a methodology for development of software composite-metrics for program control-flow structure
TRANSCRIPT
V o l . 7 N o . 3 J. o f C o m p u t . Sci. & T e c h n o l . 1992
A Methodology for Development of Software Composite- Metrics for Program
Control-Flow Structure
Aftab A h m a d
Dept. of Computer Science, College of Computer and Information Sciences ,King Saud University R~,adh 11543, Saudi Arabia Received September 16, 1991.
A b s t r a c t
This paper reports on a pioneer effort for the establishment of a software composite-metric with key capability of distinguishing among different strnctures. As a part of this effort most of the previously proposed program con~ol-flow complexity metrics are evaluated .It is observed that most of these metrics are inherently limited in distinguishing capability. However,the concept of composite metrics is potentially useful for the development of a practical metrics. This paper presents a methodology for the develop- ment of a practical composite metric using statistical techniques. The proposed metric differs from all previous metrics in 2 ways: ( I ) It is based on an overall structural analysis of a given program in deeper and broader context. It captures various structural measurements taken from all existing structural levels; (2) It unif'~s a set of 19 important structural metrics. The compositing model of these metrics is based on statistical techniques rather than on an arbierary method. Experinces with the pro- posed metric clearly indicate that it distinguishes different structures better than the previous metrics.
I. I n t r o d u c t i o n
The dominance of software is changing the focus and direction of computer technology. The arrival of "Software Age " demands the application of engineering discipline for software produc- tion and maintenance. Many authors ti' 21 have reported on real crises and growing costs encoun- tered during the life cycle of software systems.
Software Engineering techniques have been introduced to combat large costs involved during development and maintenance of Software Systems. Engineering techniques mainly depend on quantitative assessment of the cost and quality of the product. Therefore, it is essential to devel- op measurements, models and metrics to support the engineering process. To this end, Software Engineering aims at the establishment of objective metrics on concrete grounds and the develop- ment of tools to enhance software quality.
Software-metrics development involves identification and quantification of those attributes which may influence the complexity, cost and performance of software systems. A software met- ric should be practical in the sense that it may be integrated with software production and mainte- nance processes and technologies to exclude identified undesirable attributes. In general, software metric is a process of translating programs to numbers. It shifts the problem of comparing programs to a simple level of comparing numbers. It is obvious that these numbers will not be reliable for comparison, if they do not reflect actual "finger pr ints" of their respective programs.
The criterion, objectives and utilizations of a practical software metric are clearly reported by many researchers 13-241 . One significant reference TM in this area is "Software Metrics: An Analysis and Evaluation" commissioned by Naval Office of Research. The authors strongly stated that the central issue in software metrics revolves around the capability to support quanti- tative comparison of software systems. Similarly Basili I41 and Wayheker TM have recommended a "Frame of Properties" for vigorous and strong software metrics. Within this frame, it is recom- mended that a practical metric should not scale programs to a single value. It is apparent that
276 J. of Comput. Sci. & Technol. Vol.7
I f there is no value d which satisfies the Equation 2.2 then we say state Qi is not compatible with Qj.
Obviously Def. 2.2 gives a method to partition an initial state set of incompletely specified sequential machine. The partitioning rules are as follows.
Rule I. I fP(Qi ) (~ P ( Q j ) = I then we put states Qi and Qj into a class and enclose them in parenthesis, denoted by (Qi, Q j) .
Rule 2. I f P ( Q i ) ~ ) P ( Q j ) = O then we say they belong to different classes which should be separated from each other , denoted by (Q i ) , (Qj) �9
Theorem 2.1. (QI, Qz, "'" , Q~) is a compatible class gf and only gf
(-I (P(Q,)(~) P ( Q j ) ) = t . 2.3 i , j= l
This can be easily proved by Def. 2.1 and Def. 2.2. Definition 2.3. Let S be the state subset of machine M. I f it sati~%s the following two terms: Term 1. Subset S is a compatible state class. Term 2. For any state Qk-~S and any state Oi E S , there exists
P(Qk ) (~)P(Qi) =0 then state subset S is referred to as the maximal compatible class.
Let Pk represent K- level partition. From above information we have obtained a method to find P~ partition of incompletely specified sequential machine M.
Example 1. Find the Pl partition of initial state machine M~ as shown in Table 2.2.
Solution: From Table 2.2, we have A0=(0 1 0 1 0 1), and A l = ( 0 dl 0 1 d 2 1), where d~=0, 1 and d z=0, I are unspecified outputs. The initial output matrix of M~ is
[;,010,] Et= A 1 dt 0 1 d 2
Let P (A), P(B) , ..., P ( F ) represent each column vector of El respectively. Let P ( A B ) rep- resent the compatible condition between state A and state B. According to Def. 2.1 and matrix E I , w e have
P ( A C E ) = P ( A C ) " P ( A E ) " P ( C E ) = [ P ( A ) ( ~ ) e ( c ) ] " [ P ( A ) ( ~ P(E)] �9 [ e ( c ) ( ~ P(E) i
= 1 - a2 - ct2=a2. P ( B D F ) = P ( B D ) " P ( B F ) " P (DF)
= [ P ( B ) ( ~ ) P ( D ) ] �9 [P(B)(~) P(F) ] �9 [P (D) (~ P(F) ]
= d t d I " 1 = d t.
That is to say , (ACE) and (BDF) are compatible classes of machine Mi and the compati- ble conditions are dz=0, d~= 1 respectively.
And for any state B, D, F, we have
e ( a ) (~ P ( B ) = P ( a ) ~ P (D) =P ( a ) ~ P ( F ) = 0 .
By Def. 2.3. S t = ( A C E ) is a maximal compatible class. The compatible condition is d2=0. Likewise, Sz--(BDF) is also a maximal compatible class. The compatible condition is d I = l .So P~ partition of sequential machine Mi is
P~ =(ACE ) (BDF); d~ d 2 = 1
where dt d2 = 1 is the condition of Pt partition.
3 . Pk ! P a r t i t i o n a n d K E q u i v a l e n t C l a s s
Suppose that M is an incompletely specified sequential machine. Sometimes not only the out-
204 J. of Comput. Sci. & Technol. Vol.7
marized as follows: i) The metric of line of codes and several extensions of this metric. ii ) The metric of McCabe and several extensions of this metric. iii) The metric of Belady based on the nesting level of control structures and several other
metrics based on the nesting level. iv) The scope metric and several extensions of the metric. v ) Metrics defined for structured programs only. vi ) The complexity family of Basili and Hutches. vii) The metric of Oviedo. viii) Several additional metrics. Several researchers have reported tsS-rzl on the strengths and weaknesses of the previous met-
rics neglecting the 'aspect 'considered in our work. Some experimental and data-collection studies have also been reported tss-6~ indicating the usefulness of some previous metrics. Howev- er, no conclusive results are reported so far.
The previous metrics may be analyzed, compared or evaluated in many ways. We do not aim to analyze these metrics in all respects. For the purpose of our work, all previously pro- posed software complexity metrics may be classified according to the number of structural compo- nents captured by a particular metric. These classes are given by:
a) Single-Component Based Metrics. b) Multiple-Component Based Metrics (Composite Metrics). The software complexity metrics in both classes will be briefly discussed in the following
part of this paper. For each metric considered, the notation used will be the same as proposed by their authors. The detailed methods of computation and other related information concerning these metrics are available in their respective references.
(a) Single-Component Based Metrics The software metrics in this area are based on the count of a single structural measurable at o
tribute from the given control-flow structure of a program. These metrics may be further classi- fied into two areas:
(1) Surface-Level Based Metrics These metrics are based on the count of a particular structural component without consider-
ing its level of nesting within the control flow structure of a given program. The components captured by the previous metrics are: nodes, edges, decisions, loops, GOTO, paths etc.
Examples of metrics of this type include: McCabe t261, Feuert~91, Li and Cheung t~71 , Szentes TM , Gilb f291 , Piwowarski TM , Woodward, Hannell and Hedley [31], Whiteworth and Szulewski 1321, Fenton [~61, Guttag [331 , and Schneidewind I341 . All metrics in this class are based on the extensions of McCabe's Izrl metric, and its concept.
(ii) Nesting Level Based Metrics The metrics in this class are similar to the surface-level metrics except that the deepest level
of nesting is also considered for the component captured by a particular metric. Examples of these metrics include: Belady t351, Dunsmore [361, Chen I371, Li and Eldon [271 ,
Harrison I3sl, Magel I391, and Metric E-McCabe of McCabe I261. These metrics are based on the extensions of Belady t351 metric and its concept.
(b) Multiple-Component Based Metrics (Composite Metrics) The metrics in this class are based on capturing multiple structural components from the
control-flow structure of a given program. Generally these metrics are the extensions of the sin- gle-component based metrics by considering some extra components. In the literature, the compo- site metrics proposed so far, capture a maximum of 5 components simultaneously.
Given that a metric is based on multiple components, an important criterion may be raised: "What is the model of compositing these components?" All previously proposed composite met- rics are modeled in arbitrary ways and are based on author's intuition. However various types of models have been used by the authors of composite metrics. The models used and the met- rics proposed within each model may be summarized as below:
N o . 3 Software Composi te Structural Metr ics 205
i ) Vector Models : Myers [4~ , Hansen 14tl , Schmidt [a21 , Ramamurthy and Mel ton [431 , and Howat t and Baker I441 .
i i ) Linear Models with Unit-Coefficients: Moawad 1451 , Stetter I461 , Harrison and Magel [381 , and Oviedo I471 .
i i i) Linear Models with Weighted Co-efficients : Whiteworth and Szulewski/321 , Jayaprakash, Lakshaman and Sinha/asl , Presier and
Storm [491 , and Tayer [5~ .
iv) Non-Linear Mode l s : Band-Cyclo metric of Belady [351 , Potier [511 , Harrison [381 , Basili and Hutches 141 , Bache [2~ ,
and Li t271 .
Discussion The fact that the previous composite metrics are modeled in an arbitrary manner suggests
that their capability to distinguish among structures may not always be assured. This capability may not be viewed from the definition of the given metric. It is apparent that no previous met- ric has been proposed with the main objective of distinguishing among different structures. Some
previous metrics are limited to structured programs only. For evaluating the capability of the previous metrics, we maintain that component-based met-
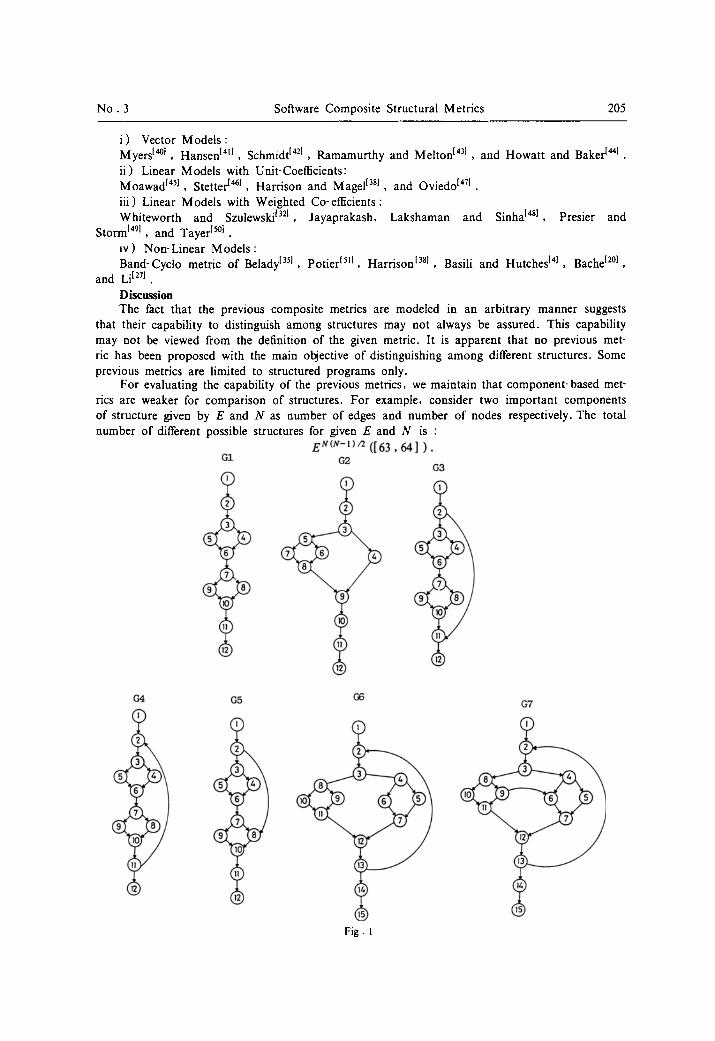
rics are weaker for comparison of structures. For example, consider two impor tant components of structure given by E and N as number of edges and number of nodes respectively. The total
number of different possible structures for given E and N is : E N(N-I)n ([63,64]).
G5
(3
c
G2 G3
G4
(
1 G7
C6
Fig. l
G1
Q ()
206 J . of C o m p u t . Sci. & Technol . Vol .7
All these structures may not be meaningful p rogram structures . However , it is a clear indica t ion
that an arbi t rary n u m b e r of s tructures possibly have the same value for a c o m p o n e n t cap tured
by a par t icular metric. Therefore , it is ou r s t rong conjecture tha t all software metrics based ei-
ther on single c o m p o n e n t or on multiple c o m p o n e n t s with l inear sum are inherent ly l imited with
respect to the d iscr iminat ion among structures .
Similarly, compos i te -vec tor based metrics may only increase confusion in compar i son of s t ruc-
ture. It does not appear feasible to compare s t ructures using arb i t ra ry n u m b e r of different metrics
s imultaneously. In fact, these metrics are even weaker for compar i son than non-vec to r based (or
single va lued ) metrics.
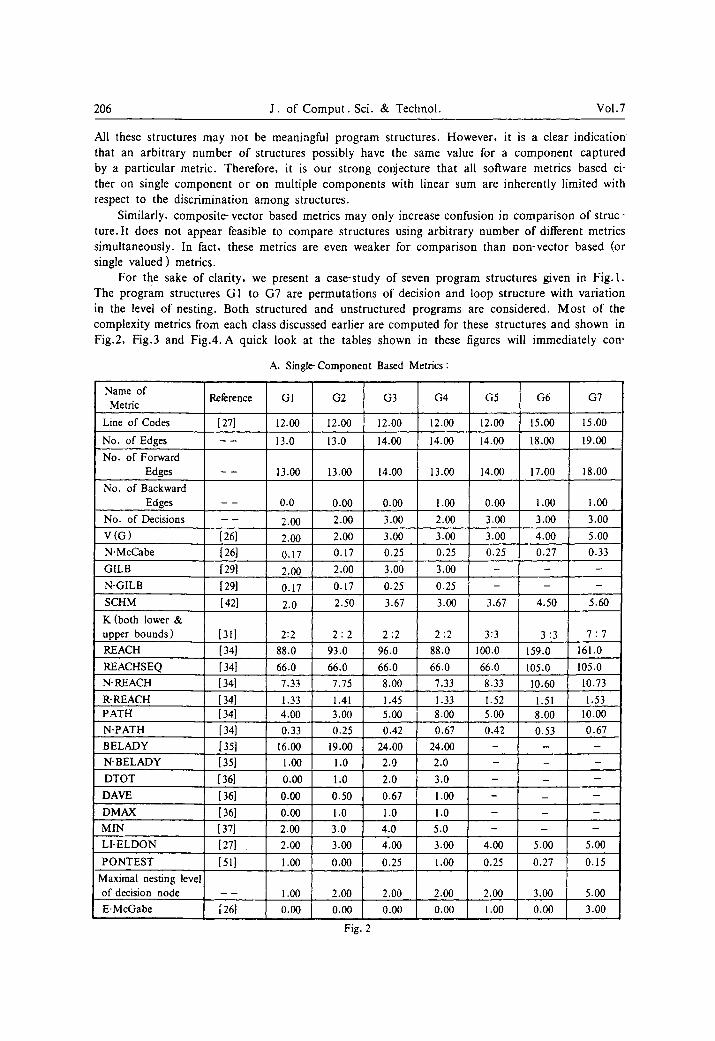
For the sake of clarity, we present a case-study of seven p rogram s t ruc tures given in Fig. 1.
The p rog ram structures G1 to G7 are pe rmuta t ions of decision and loop s t ruc ture with var ia t ion
in the level of nesting. Both s t ructured and uns t ruc tured p rograms are considered. M o s t of the
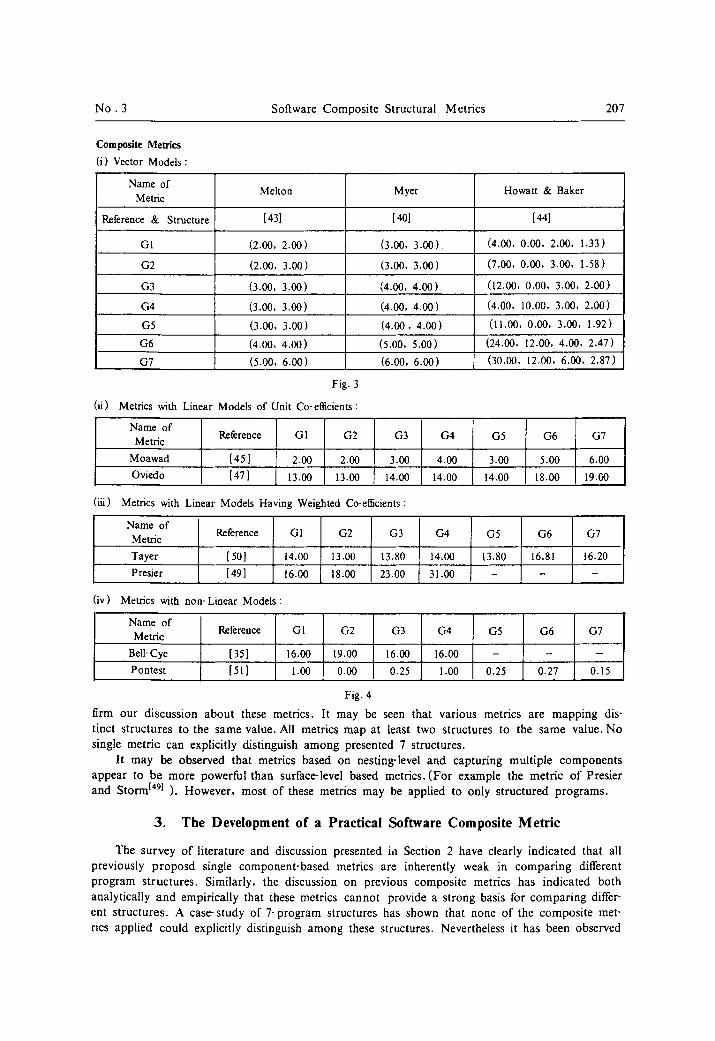
complexity metrics from each class discussed earl ier are compu ted for these s t ruc tures and shown in
Fig.2, Fig.3 and Fig.4. A quick look at the tables shown in these figures will immedia te ly con-
A. Single-Component Based Metrics:
Maximal nesting level of decision node . . . . 1.00 2.00 2.00 2.00 2.00 3.00 5.00
i
E-McGabe [261 0.00 0.00 0.00 0.00 1.00 0.00 3.00
Fig. 2
Name of Reference G 1 G2 G3 G4 G5 G6 G7
Metric
Line of Codes [27] 12.00 12.00 12.00 12.00 12.00 15.00 15.00
No. of Edges 13.0 13.0 14.00 14.00 14.00 18.00 19.00
No. of Forward i Edges 13.00 13.00 14.00 13.00 14.00 17.00 ! 18.00
No. of Backward Edges 0.0 0.00 0.00 1.00 0.00 1.00 1.00
No. of Decisions 2.00 2.00 3.00 2.00 3.00 3.00 3.00
V (G) [ 26] 2.00 2.00 3.00 3.00 3.00 4.00 5.00
N-McCabe [26] 0.17 0.17 0.25 0.25 0.25 0.27 0.33
GILB [29] 2.00 2.00 3.00 3.00 - - - i
N-GILB [291 0.17 0.17 0.25 0.25 - - -
SCHM [42] 2.0 2.50 3.67 3.00 3.67 4.50 5.60
K (both lower & upper bounds) [31] 2:2 2 : 2 2:2 2:2 3:3 3:3 7 : 7
1
REACH [34] 88.0 93.0 96.0 88.0 100.0 159.0 161.0
REACHSEQ [34] 66.0 66.0 66.0 66.0 66.0 105.0 105.0
N-REACH [34] 7.33 7.75 8.00 7.33 8.33 10.60 10.73 J
R-REACH [34] 1.33 1.41 1.45 1.33 1.52 1.51 1.53 PATH [34] 4.00 3.00 5.00 8.00 5.00 8.00 10.00
i
N-PATH [34] 0.33 0.25 0.42 0.67 0.42 0.53 0.67
BELADY [35] 16.00 19.00 24.00 24.00 - - -
N-BELADY [ 35] 1.00 1.0 2.0 2.0 - - -
DTOT [36] 0.00 1.0 2.0 3.0 - - - i
DAVE [36] 0.00 0.50 0.67 1.00 - - ~ - i
DMAX [ 36] 0.00 1.0 1.0 1.0 - - - i
MIN [37] 2.00 3.0 4.0 5.0 - - -
LI-ELDON [27] . 2.00 3.00 4.00 3.00 4.00 5.00 5.00 i
PONTEST [51] 1.00 0.00 0.25 1.00 0.25 0.27 0.15
N o . 3 Software Composite Structural Metrics 207
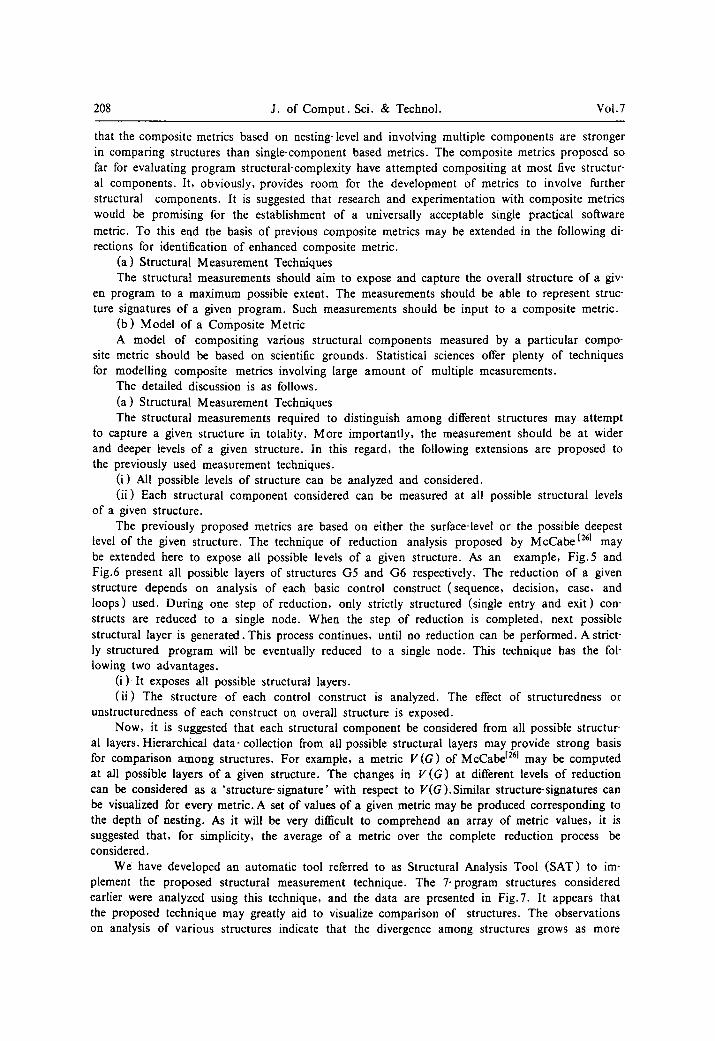
Composite Metrics
(i) Vector Models:
Name of Melton Myer Howatt & Baker Metric
Reference & Structure [43] [40] [44]
G1 (2.00, 2.00) (3.00, 3 .00) (4.00, 0.00, 2.00, 1.33)
G2 (2.00, 3.00) (3.00, 3.00) (7.00, 0.00, 3.00, 1,58)
G3 (3.00, 3.00) (4.00, 4.00) (12.00, 0.00, 3.00, 2.00)
G4 (3.00, 3.00) (4.00, 4.00) (4.00, 10.00, 3.00, 2.00)
G5 (3.00, 3.00) (4.00, 4.00) (11.00, 0.00, 3.00, 1.92)
G6 (4.00, 4.00) (5.00, 5.00) (24.00, 12.00, 4.00, 2.47)
G7 (5.00, 6.00) (6.00, 6.00) (30.00, 12.00, 6.00, 2.87)
Fig. 3
(ii) Metrics with Linear Models of Unit Co-etScients :
Name of Reference Metric
M oawad [ 45 ]
Oviedo [ 47 ]
G1 G2 G3
2.00 2.00 3.00 I
13.00 13.00 t 14.00
(iii) Metrics with Linear Models Having Weighted Co-elficients:
Name of Reference GI G2 G3 Metric
Tayer [50] 14.00 13.00 13.80
Presier [49] 16.00 18.00 23.00
G4
4.00
14.00
G5 G6 G7
3.00 5.00 6.00
14.00 18.00 19.60
G4 G5 G6 G7
14.00 13.80 16.81 16.20
31.00 - - -
(iv) Metrics with non-Linear Models:
Name of Reference
Metric
Bell- Cyc [ 35 ]
Pontest [ 51 ]
G1 G2 G3
16.00 19.00 16.00
1.00 0.00 0.25
G4 G5 G6 G7
16.00 - - -
1.00 0.25 0.27 0.15
Fig. 4
firm our discussion about these metrics. It may be seen that various metrics are mapping dis- tinct structures to the same value. All metrics map at least two structures to the same value. No single metric can explicitly distinguish among presented 7 structures.
It may be observed that metrics based on nesting-level and capturing multiple components appear to be more powerful than surface-level based metrics. (For example the metric of Presier and Storm [491 ). However, most of these metrics may be applied to only structured programs.
3. The Development of a Practical Software Composite Metric
The survey of literature and discussion presented i~1 Section 2 have clearly indicated that all previously proposd single component-based metrics are inherently weak in comparing different program structures. Similarly, the discussion on previous composite metrics has indicated both analytically and empirically that these metrics cannot provide a strong basis for comparing differ- ent structures. A case-study of 7-program structures has shown that none of the composite met- rics applied could explicitly distinguish among these structures. Nevertheless it has been observed
208 J. of Comput. Sci. & Technol. Vol.7
that the composite metrics based on nesting-level and involving multiple components are stronger in comparing structures than single-component based metrics. The composite metrics proposed so far for evaluating program structural-complexity have attempted compositing at most five structur- al components. It, obviously, provides room for the development of metrics to involve further structural components. It is suggested that research and experimentation with composite metrics would be promising for the establishment of a universally acceptable single practical software metric. To this end the basis of previous composite metrics may be extended in the following di- rections for identification of enhanced composite metric.
(a) Structural Measurement Techniques The structural measurements should aim to expose and capture the overall structure of a giv-
en program to a maximum possible extent. The measurements should be able to represent struc- ture signatures of a given program. Such measurements should be input to a composite metric.
(b) Model of a Composite Metric A model of compositing various structural components measured by a particular compo-
site metric should be based on scientific grounds. Statistical sciences offer plenty of techniques for modelling composite metrics involving large amount of multiple measurements.
The detailed discussion is as follows. (a) Structural Measurement Techniques The structural measurements required to distinguish among different structures may attempt
to capture a given structure in totality. More importantly, the measurement should be at wider and deeper levels of a given structure. In this regard, the following extensions are proposed to the previously used measurement techniques.
(i) All possible levels of structure can be analyzed and considered. (ii) Each structural component considered can be measured at all possible structural levels
of a given structure. The previously proposed metrics are based on either the surface-level or the possible deepest
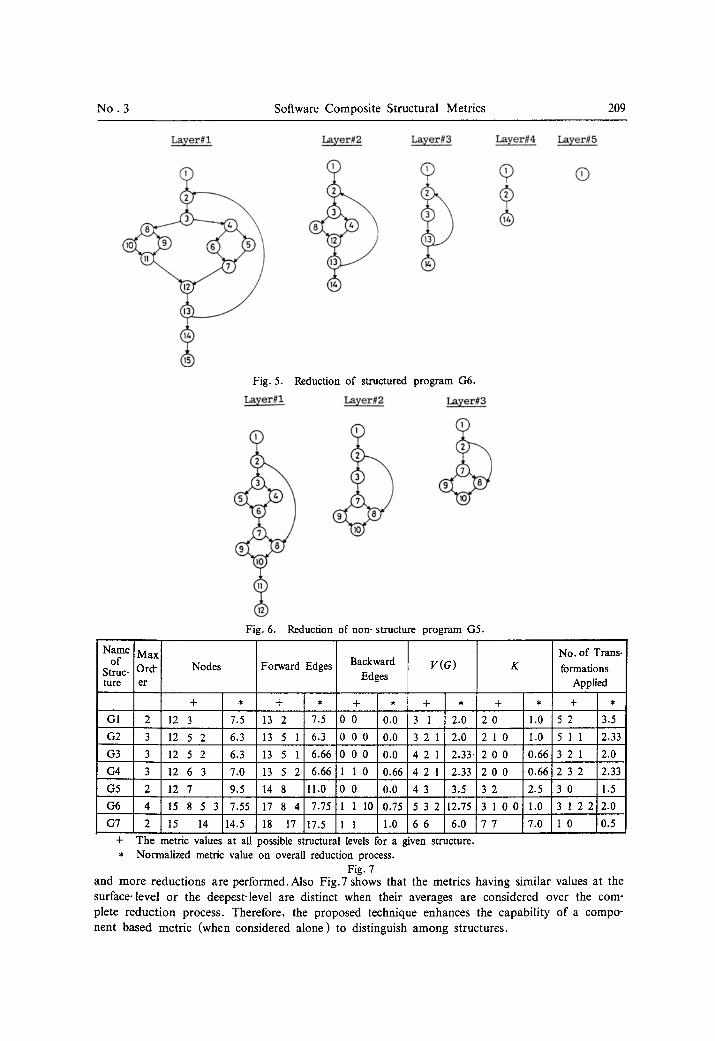
level of the given structure. The technique of reduction analysis proposed by McCabe 1261 may be extended here to expose all possible levels of a given structure. As an example, Fig.5 and Fig.6 present all possible layers of structures G5 and G6 respectively. The reduction of a given structure depends on analysis of each basic control construct (sequence, decision, case, and loops) used. During one step of reduction, only strictly structured (single entry and exit) con- structs are reduced to a single node. When the step of reduction is completed, next possible structural layer is generated. This process continues, until no reduction can be performed. A strict- ly structured program will be eventually reduced to a single node. This technique has the fol- lowing two advantages.
( i ) It exposes all possible structural layers. (ii) The structure of each control construct is analyzed. The effect of structuredness or
unstructuredness of each construct on overall structure is exposed. Now, it is suggested that each structural component be considered from all possible structur-
al layers. Hierarchical data-collection from all possible structural layers may provide strong basis for comparison among structures. For example, a metric V(G) of McCabe t261 may be computed at all possible layers of a given structure. The changes in V(G) at different levels of reduction can be considered as a 'structure-signature' with respect to V(G).Similar structure-signatures can be visualized for every metric. A set of values of a given metric may be produced corresponding to the depth of nesting. As it will be very difficult to comprehend an array of metric values, it is suggested that, for simplicity, the average of a metric over the complete reduction process be considered.
w e have developed an automatic tool referred to as Structural Analysis Tool (SAT) to im- plement the proposed structural measurement technique. The 7-program structures considered earlier were analyzed using this technique, and the data are presented in Fig.7. It appears that the proposed technique may greatly aid to visualize comparison of structures. The observations on analysis of various structures indicate that the divergence among structures grows as more
N o . 3 Software Compos i t e St ructura l Metr ics 209
Layer#l
)
Fig. 6.
Layer#2
()
Layer#3
Fig. 5.
Layer#1 Reduction of structured program G6.
Layer#2
()
(
<
Layer#3
Reduction of non- structure program G5.
Layer#4 Layer#5
Q
N a m e
of Struc- ture
G1
G2
G3
G4
G5
G6
G7 +
M a x Ord- I Nodes er
+
2 1 2 3
3 1 2 5 2
3 1 2 5 2
3 1 2 6 3
2 1 2 7
4 1 5 8 5 3
2 15 14
The metric value~
7.5
6.3
6.3
7.0
9.5
7.55
14.5
at all
Forward Edges
13 2 7.5
13 5 1 6.3
13 5 1 6.66
13 5 2 6.66
14 8 11.0
17 8 4 7.75
18 17 17.5
Backward V (G) Edges
+ �9 + �9
0 0.0 3 1 2.0
0 0 0.0 3 2 1 2.0
0 0 0.0 4 2 1 2.33
1 0 0.66 4 2 1 2.33
0 0.0 4 3 3.5
1 10 0.75 5 3 2 12.75
1 1.0 6 6 6.0
)ossible structural levels for a given structure. Normalized metric value on overall reduction process.
Fig. 7
+
2 0
2 1 0
2 0 0
2 0 0
3 2
3 1 0 0
7 7
No. of Trans-
K formations Applied
* + *
1.0 5 2 3.5
1.0 5 1 1 2.33
0 . 6 6 3 2 1 2 . 0
0.6612 3 2 2.33
2.5 3 0 1.5
1.0 3 1 2 2 2.0
7.0 1 0 0.5
and more reduc t ions are per formed.Also Fig.7 shows that the metrics having similar values at the
surface-level or the deepest-level are distinct when their averages are considered over the com-
plete r educ t ion process. Therefore, the proposed technique enhances the capabi l i ty of a compo-
nent based metr ic (when considered a lone) to dist inguish a m o n g structures.
210 J. of Comput. Sci. & Technol. Vol.7
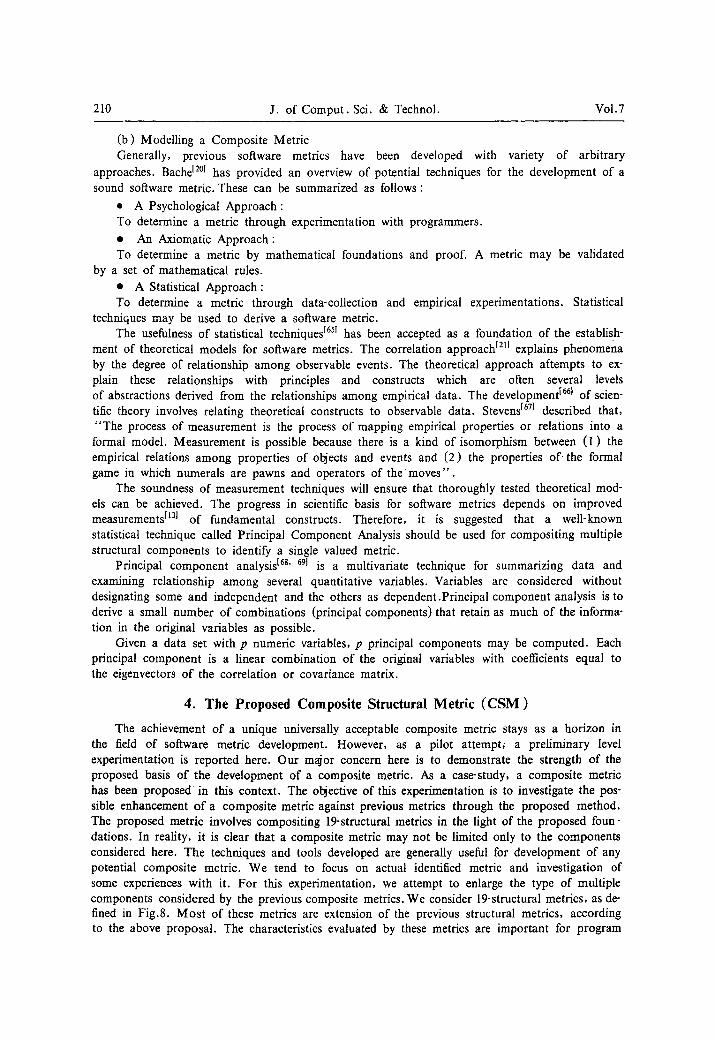
(b) Modelling a Composite Metric Generally, previous software metrics have been developed with variety of arbitrary
approaches. Bache [2~ has provided an overview of potential techniques for the development of a sound software metric. These can be summarized as follows:
�9 A Psychological Approach : To determine a metric through experimentation with programmers.
�9 An Axiomatic Approach: To determine a metric by mathematical foundations and proof. A metric may be validated
by a set of mathematical rules. �9 A Statistical Approach: To determine a metric through data-collection and empirical experimentations. Statistical
techniques may be used to derive a software metric. The usefulness of statistical techniques f65j has been accepted as a foundation of the establish-
ment of theoretical models for software metrics. The correlation approach f211 explains phenomena by the degree of relationship among observable events. The theoretical approach a~tempts to ex- plain these relationships with principles and constructs which are often several levels of abstractions derived from the relationships among empirical data. The development t661 of scien- tific theory involves relating theoretical constructs to observable data. Stevens f671 described that, "The process of measurement is the process of mapping empirical properties or relations into a formal model. Measurement is possible because there is a kind of isomorphism between (1) the empirical relations among properties of objects and events and (2) the properties of' the formal game in which numerals are pawns and operators of the moves" .
The soundness of measurement techniques will ensure that thoroughly tested theoretical mod- els can be achieved. The progress in scientific basis for software metrics depends on improved measurements tl31 of fundamental constructs. Therefore, it is suggested that a well-known statistical technique called Principal Component Analysis should be used for compositing multiple structural components to identify a single valued metric.
Principal component analysis f68' 691 is a multivariate technique for summarizing data and examining relationship among several quantitative variables. Variables are considered without designating some and independent and the others as dependent.Principal component analysis is to derive a small number of combinations (principal components) that retain as much of the informa- tion in the original variables as possible.
Given a data set with p numeric variables, p principal components may be computed. Each principal component is a linear combination of the original variables with coefficients equal to the eigenvectors of the correlation or covariance matrix.
4. The Proposed Composite Structural Metric (CSM)
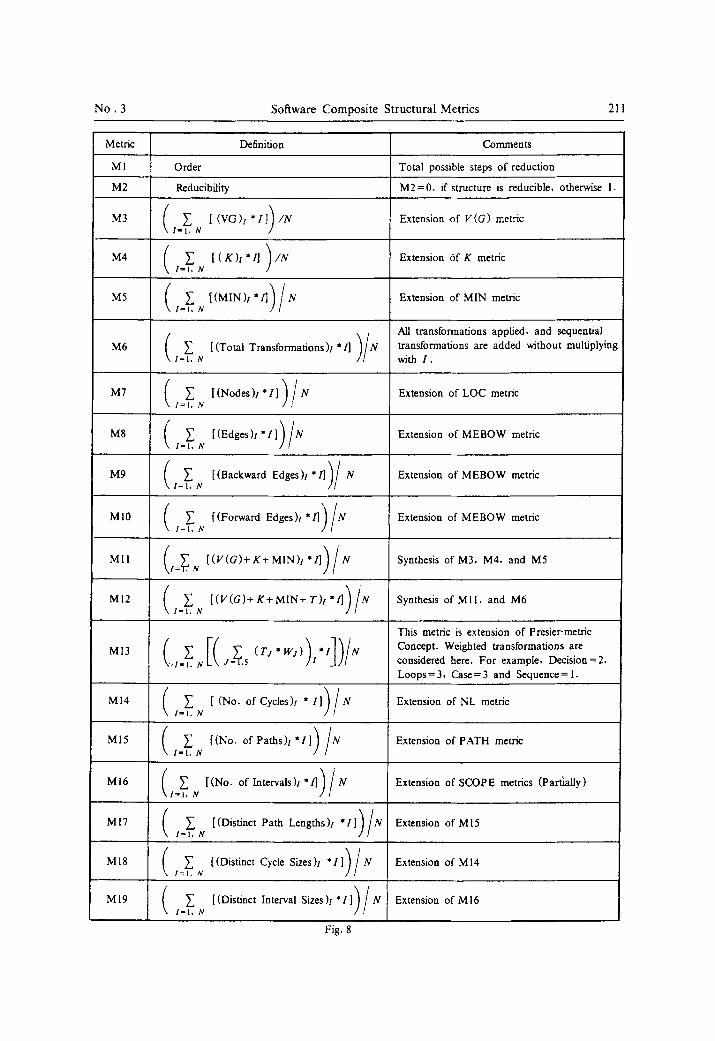
The achievement of a unique universally acceptable composite metric stays as a horizon in the field of software metric development. However, as a pilot attempt; a preliminary level experimentation is reported here. Our major concern here is to demonstrate the strength of the proposed basis of the development of a composite metric. As a case-study, a composite metric has been proposed in this context. The objective of this experimentation is to investigate the pos- sible enhancement of a composite metric against previous metrics through the proposed method. The proposed metric involves compositing 19-strnctural metrics in the light of the proposed foun- dations. In reality, it is clear that a composite metric may not be limited only to the components considered here. The techniques and tools developed are generally useful for development of any potential composite metric. We tend to focus on actual identified metric and investigation of some experiences with it. For this experimentation, we attempt to enlarge the type of multiple components considered by the previous composite metrics. We consider 19-structural metrics, as de- fined in Fig.8. Most of these metrics are extension of the previous structural metrics, according to the above proposal. The characteristics evaluated by these metrics are important for program
No. 3 Soltware Composite Structural Metrics 211
Metric Definition Comments
M I i Order Total possible steps of reduction i
M2 Reducibility M2=0, if structure is reducible, otherwise 1.
M5 ( ~ [ ( M I N ) , * / ] ) / N I ~ I . N Extension of MIN metric
All transformations applied, and sequential M6 (~[(TotalTransformations)l*ll)/Ntransformationsareaddedwithoutmultiplying
t=l. N with I .
M7 ( ~ [(Nodes)l"l])/N Extension of LOCmetric I = I , N !
M8 (~[(EdgeS)l*l])/N I-I.N Extension of MEBOW metric
M9 (~,I=I.N [(Backward Edges)l*I])/N Extension ofMEBOW metric
MI0 (~[(ForwardEdges)t*I])/N/=I.N Extension of MEBOW metric
MII ( ~ [(V(G)+K+MIN)I*I])/NI= N Synthesis ofM3, M4. and M5
This metric is extension of Prosier-metric M13 (. ~ [ ( ~ . ( T j * W j ) ) * I I ) / N Concept. Weighted transformations are
�9 t- ~v J 5 t considered here. For example, Decision = 2, Loops=3, Case=3 and Sequence=l.
i |
MI4 ( ~ [(No. of Cycles), *I])/N Extension of NL metric I ~ I , N
i 1
I ' I , N
MI6 (~[(No. oflntervals)t ' l ,)/N, tr Extension of SCOPE metrics (ParfiaUy)
i
'( )/ Ml9 I ~ [(Distinct Interval Sizes)/*ll N Extension of M16 I = h N
Fig. 8
212 J. of Comput . Sci. & Technol. Vot.7
structural complexity. These characteristics have been identified and reported by many authors in the field. The metrics considered also include structural measurements in path analysis, cycle ana- lysis [7~ and interval analysis t711 .
A data-base is maintained for on-going data collection of program samples. Currently about 4500 program samples are available. These samples cover a wide range of control-flow complexi- ty and structural characteristics. These samples are mainly taken from the published work in the field of software metrics. All program structures discussed by Kernighan and Plaugher ~721 are also considered. Similarly other structures have been collected from the computer-science stu- dent-assignments, projects and faculty research programs.
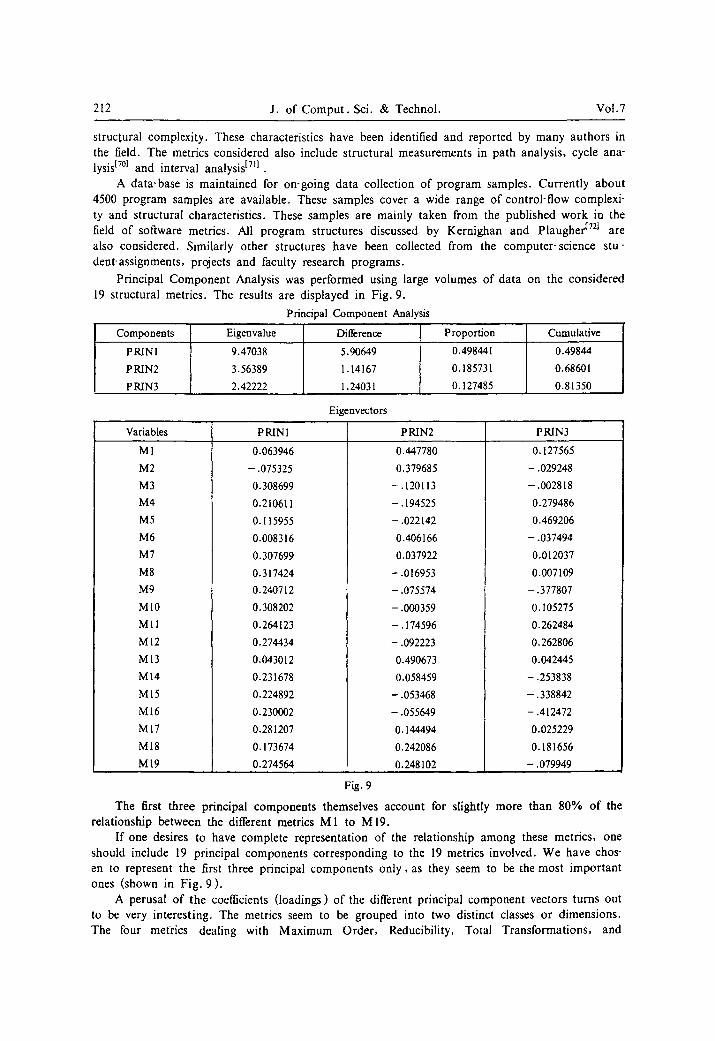
Principal Component Analysis was performed using large volumes of data on the considered 19 structural metrics. The results are displayed in Fig. 9.
Principal Component Analysis
Components Eigenvalue Difference P roporfion Cumulative
P RINI 9.47038 5.90649 0.498441 0.49844
P RIN2 3.56389 1.14167 0.185731 0.68601
P RIN3 2.42222 1.24031 0.127485 0.81350
Eigenvectors
Variables P PIN l P RIN2 P RIN3
MI
M2
M3
M4
M5
M6
M7
M8
M9
M10
MI1
MI2
MI3
MI4
M15
M16
MI7
M18
M19
0.063946
- .075325
0.3O8699
0.210611
0.115955
0.008316
0.307699
0.317424
0.240712
0.308202
0.264123
0.274434
0.043012
0.231678
0.224892
0.230002
0.281207
0.173674
0.274564
0.447780
O.379685
-.120113
-.194525
-.022142
0.406166
0.037922
-.016953
-.075574
-.000359
-.174596
-.092223
0.490673
0.058459
-.053468
-.055649
0.144494
0.242086
0.248102
0.127565
- .029248
-.002818
0.279486
0.469206
-.037494
0.012037
0.007109
-.377807
0.105275
0.262484
0.262806
0.042445
-.253838
-.338842
-.412472
0.025229
0.181656
-.079949
Fig. 9
The first three principal components themselves account for slightly more than 80% of the relationship between the different metrics M1 to M19.
If one desires to have complete representation of the relationship among these metrics, one should include 19 principal components corresponding to the 19 metrics involved. We have chos- en to represent the first three principal components only , as they seem to be the most important ones (shown in Fig. 9) .
A perusal of the coefficients (loadings) of the different principal component vectors turns out to be very interesting. The metrics seem to be grouped into two distinct classes or dimensions. The four metrics dealing with Maximum Order, Reducibility, Total Transformations, and
N o . 3 Software Composite Structural Metrics 213
Weighted Total Transformations have negative or negligible impact on the first principal component, whereas they contribute the maximum towards the second principal component.
The fact that fifteen of the nineteen metrics analyzed have comparable and positive loadings on the first principal component implies that no single metric can capture the overall structural aspect of programs. On the strength of this result we recommend that the trend of assuming semantic-based single metrics be abandoned in favour of capturing a large number of structural characteristics by using automatic analysis tools like SAT.
The fifteen metrics which contribute to the first principal component measure graph-theoretic characteristics. As these characteristics capture about 50% of all the relationships, it is felt that graph-theory oriented software metrics will be a rewarding area of research and development. The major contributors to the second principal component are the "style-dependent " four met- rics identified earlier to have contributed negligibly to the first principal component. The second principal component captures more than 18% of all relationships. Thus, style has reasonable im- pact on software complexity. Further, some metrics like V(G), K, MIN and their linear combi- nations along with graph-theoretic metrics like total edges, forward and backward edges have negative or negligible contribution to the second principal component. From this we may con- clude that metrics similar to V(G), K, and MIN do not capture the style of programming effectively.
The third principal component has contributions from both the above groups and possibly captures the residual relationships among the metrics. Hence we do not appropriate major signifi- cance to this component. However the fact that V(G) alone has a negative contribution, while MIN has the maximum impact and V(G) in combination with MIN has positive contributions, shows that the third principal component seems to capture the "decision-structure".
Based on the results from Principal Component Analysis, a unified composite metric, referred to as Composite Structural Metric (CSM) is identified and given by :
CSM = det (P * C *M ) where P = [ 0 . 5 , 0.19, 0.19] a l x3 matrix representing the proportion of the first 3 principal components.
C=[ PIJ] 1~<I~<19 l~<J~<3 a 19 x 3 matrix, where the rows represent eigenvectors of the most important first three principal components identified as shown in Fig. 8;
M = [ M.rl] a 19 x 1 matrix representing 19 structural metrics shown in Fig.8.
For a given program structure, CSM can be obtained by finding matrix M of 19-metrics val- ues using SAT. Other matrices P and C are available. Determinant value of the product of three matrices will provide the value of CSM.
5. Experiences with CSM
The development of CSM has made it possible to integrate various structural characteristics concerning structural complexity into a single model. All objectives set for a composite metric have been implemented through CSM. CSM is mainly based on 'Nestedness ' and 'structuredness' characteristics of a program structure. 'Principal Component Analysis' has nicely determined the contribution (or effectiveness ) of each considered metric towards capturing these characteristics. Having the broader and deeper coverage of a given program structure, it is apparent that CSM may be a stronger basis for structure comparison.
It is important to mention that we are performing non-psychological experimentation.However, a visual impression of program directed graph as a pattern may provide a good indication about its structural complexity (or clarity). Furthermore, one can clearly distinguish to a good extent among program structure patterns, when 2-D directed graphs of programs are available for obser- vation.
It is suggested that CSM be used to assess the structural complexity (non-psychological) of
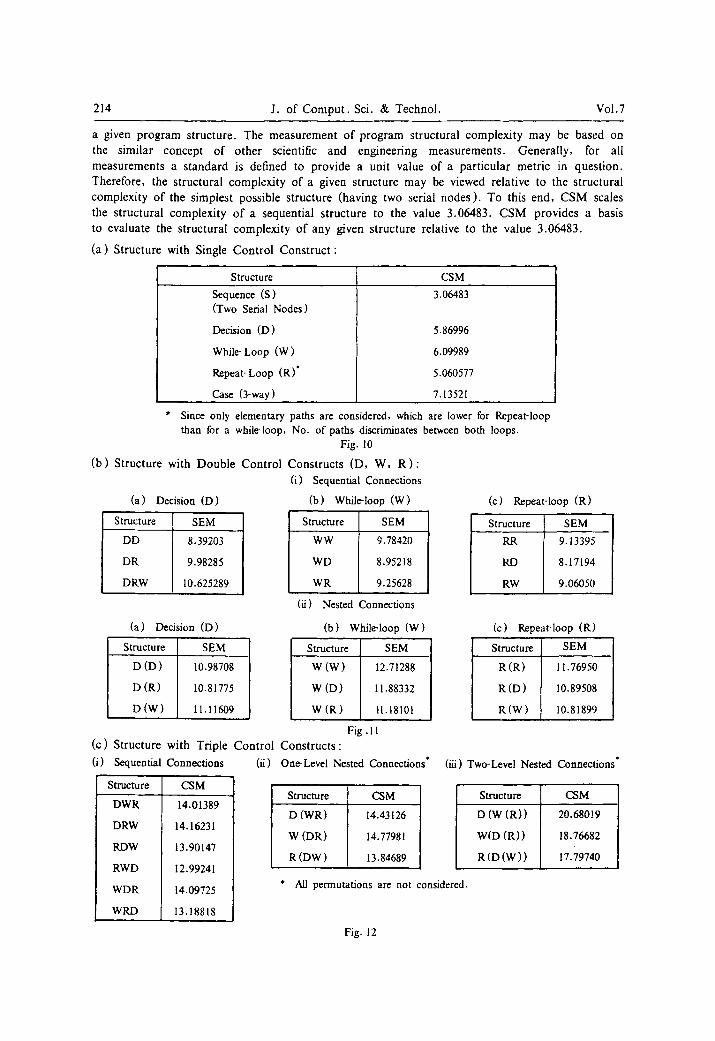
214 J. of Comput. Sci. & Technol. Vol.7
a given program structure. The measurement of program structural complexity may be based on the similar concept of other scientific and engineering measurements. Generally, for all measurements a standard is defined to provide a unit value of a particular metric in question. Therefore, the structural complexity of a given structure may be viewed relative to the structural complexity of the simplest possible structure (having two serial nodes). To this end, CSM scales the structural complexity of a sequential structure to the value 3.06483. CSM provides a basis to evaluate the structural complexity of any given structure relative to the value 3.06483.
(a) Structure with Single Control Construct:
Structure CSM
Sequence (S) 3.06483 (Two Serial Nodes)
Decision (D) 5.86996
While- Loop (W) 6.09989
Repeat- Loop (R)* 5.060577
Case (3-way) 7.13521
* Since only elementary paths are considered, which are lower for Repeat-loop than for a while-loop, No. of paths discriminates between both loops.
Fig. 10
(b) Structure with Double Control Constructs (D, W, R ) : (i) Sequential Connections
(a) Decision (D) (b) While-loop (W) (c) Repeat-loop (R)
Structure SEM
DD 8.39203
DR 9.98285
DRW 10.625289
(a) Decision (D)
Structure SEM
D (D) 10.98708
D (R) 10.81775
D(W) 11.11609
Structure SEM
WW 9.78420
WD 8.95218
WR 9.25628
(ii) Nested Connections
(b) While-loop (W)
Structure SEM
w (w)
W (D)
W(R)
(c) Structure with Triple Control Constructs:
12.71288
11.88332
11.18101
Fig. 11
(i) Sequential Connections
Structure CSM
DWR 14.01389
DRW 14.16231
RDW 13.90147
RWD 12.99241
WDR 14.09725
WRD 13.18818
(ii) One-Level Nested Connections"
Structure CSM
D (WR) 14.43126
W (DR) 14.77981
R (DW) 13.84689
Structure SEM
RR 9.13395
RD 8.17194
RW 9.06050
(c) Repeat-loop (R)
Structure SEM
R (R) 11.76950
R (D) 10.89508
R(W) 10.81899
(iii) Two-Level Nested Connections"
Structure CSM
D (W (R)) 20.68019
W(D (R)) 18.76682
R(D(W)) 17.79740
* All permutations are not considered.
Fig. 12

No. 3 Software Composite Structural Metrics 215
(d) Structures G I to G7 :
Structure SEM
G1
G2
G3
G4
G5
G6
G7
11.66649
13.01984
14.33217
16.44800
18.00094
22.83621
55.26456
Fig. 13
To view the CSM capability to distinguish among structures, initially, the structures with ba- sic control construct and their permutation are considered. Data are presented in Fig. 10, Fig. lt and Fig. 12 dealing with structures having permutation of single, double and triple control constructs. A thorough look at the presented data shows that CSM distinguishes very well even among small size programs.
Referring to the 7-program structures considered earlier, Fig. 13 presents CSM values of these structures. All CSM values are distinct and are growing proportionally with structures. One interesting aspect of CSM may also be mentioned here. Graph G5 is an unstructured ver- sion of graph G3, while numbers of nodes and edges are the same in both structures. Several previous metrics have scaled these structures to the same value (for example: LIELDON, POTNEST, TAYER, and SCHM). Furthermore some metrics have scaled unstructured version even to a value lower than that of its structured version (for example: PEN, AVG). CSM val- ues indicate its capability to expose unstructuredness.
During the experimentation, corresponding to each previous metric discussed in Section 2, a set of different program structures was collected having the same value of that metric. Data are avail- able on analysis of all these program-structure sets, where CSM nicely distinguishes among struc- tures. The scope of this paper does not allow to present all available data tables here.
6. Summary and Further Research
The work presented here, uncovers a new dimension in the area of structural analysis and design of a composite metric. A general methodology has been provided for experimentation and development of a composite program structural metric. A case study of compositing of nineteen structural metrics is described. The experimentation has clearly shown that by using statistical tech- niques, an enhanced composite metric may be identified. The usefulness of the principal component analysis towards the development of a composite metric has been exposed. Principal Component Analysis is a sound technique for evaluating effectiveness of a particular metric towards its capa- bility for capturing given structural attribute. A powerful structural measurement technique has been proposed and a tool SAT has been developed. The development of sound structural measurements and compositing techniques is the prerequisites for the development of a practical software metric.
The issues discussed can be further explored towards several avenues. A general frame has been provided for research and identification of powerful composite metrics with variation of struc- tural attributes. Since the proposed metric is a first-level attempt, a refined metric may be identi- fied by using proposed method and involving other structural components. Similarly a continu- ous data collection may also enhance the effectiveness of the principal components identified. A mathematical formulation of the proposed method may also be an interesting area of research.
216 J. of Comput . Sci. & Technol. Vol.7
References
[ 1 ] B.W. Boehm, Software and its impact : A quantitative assessment. Datamation, 1973, 129, 4 8 - - 49. [ 2] B.W. Boehm, The hardware/software cost ratio: Is it myth ? IEEE Corrputer, 1983, 3, 7 8 - - 80. [ 3] Perils, Sawayed and Shaw, Software Metrics: An Analysis and Evaluation. The MIT Press, 1981. [4 ] V.R. Basil, and D.H. Hutches, An empirical study of a syntactic complexity family. IEEE Trans.Soft.
Engg., 1983, S E - 9 (6), 664-- 672. [5 ] E. J. Wayheker, Evaluating software complexity measures. IEEE Trans. Soft. Engg., 1988, 14(9),
1357-- 1365. [ 6] V.R. Basil and R.W. Reiter, Evaluating Automable Measures of Software Development. in Proc.
IEEE Workshop on Quantitative Software Models for Reliability, Complexity and Cost, 1 0 7 - 116, 1980.
[ 7] L . A . Belady, Soft-ware Complexity. in Software Phenomenology, Atlanta : AIRMICS, 371 - - 383, 1977. [ 8] D.E. Bel and J .E . Sullivan, Further Investigations into the Complexity of Software. Tech. Rep.
MTR-2874, Bedford, MA: MITRE, 1974. [ 9] G. Benyon Tinker, Complexity Measures in an Evolving Large System. in Proc. IEEE Workshop on
Quantitative Sotware Models for Reliability, Complexity and Cost, 1 1 7 - 127, 1980. [10] W.T. Kelvin, Popular Lectures and Addresses, 1 8 9 1 - 1894. Quoted by M.L. Shooman in the
Introduction to Proc. IEEE Workshop on Quantitative SoRware Models ~'or Reliablity, Complexity and Cost, 1980.
[11] B. Curtis, In Search of Software Complexity. in Proc. IEEE Workshop on Quantitative Sotware Mod- els for Reliability, Complexity and Cost, 9 5 - - 106, 1980.
[12] Data Analysis Center for Software, Quantitative SoRware Models. (SR R - 1 ) Griliiss AFB, NY: Rome Air Development Center, 1979.
[ 13] T.C. Jones, Measuring programming quality and productivity. IBM Syst. J. , 1978, 17 (I), 3 9 - - 63. [ 14] John S. Davis and Richard J. Leblanc, A study of the applicability of complexity measures. IEEE
Trans. Soft. Eng'g., 1988, 14 (9), 1366-- 1372. [ 15] Lem O. Ejiogu, The critical issues of software metrics. SIGPLAN Notices, 1987, 22 (3). [ 16] N.E. Fenton and Agnes Kaposi, Metrics and sottware structure. Information and Software Technology,
1987, 29 (8). [17] Ion Ivan and Ashire Romulus, Program complexity: comparative analysis, hierarchy, classification.
SIGPLAN Notices, 1987, 22 (4). [18] S.D. Conte, H.E. Dunsmore and V.Y., Shen, Software Engineering Metrics and Models. Benjamin
Publishing Co., 1984. [19] A.R. Feuer and E.G. Fowlkes, Some Results from an Empirical Study of Computer Sotware. in Proe.
4th IEEE. Int . Conf. Software Engineering, 3 5 1 - 355, 1979. [20] Bache, R., Metricating A-KINDRA BT Project 610287 Document W021, South Bank 1987.
[21] T.A. Thayer, Understanding Sottware Through Empirical Reliability Analysis. in 1975 Spring Joint Comput. Conf. AFIPS Conf. Proc. Vol. 44, Montvale, NJ: AFIPS Press, 335-- 341, May 1975.
[22] V.R. Basil and H .D. Rombach, TAME: Integerating Measurement into Software Environments TR- 1764. TAME-TR-I-1987.
[23] J.K. Navlakz, A survey of system complexity metrics. The Computer Journal, 1987, 30 (3). [24] Volney Rodriguez and Tsai Weitek, Software Metrics Interpretation through Experimentation.
COMPSAC, 1986, 368-- 374. [25] H.D. Mills, The Complexity of Programs. in Program Test Methods, W.C. Hetzel, Ed., 1973. [26] T.J. McCabe, A complexity measure. IEEE Trans. Soft. Engg., 1976, SE-2, 308-- 320. [27] H.F . LI and W.K. Cheung, An empirical study of software metrics. IEEE Trans. on Soft. Engg.,
1987, SE- 13 (6), 697-- 708. [28] J . Szentes, SOMIKA: An Automated System for Measuring Soltware Quality. Soft:ware
Qualitaetssicherung, German Chapter on ACM, 188-- 202, 1982. [29] T. Glib, SoRware Metrics. Cambridge, MA: Winthrop, 1977. [30] P-aul Piwowarski, A nesting complexity measure. SIGPLAN Notices, 1982, 17 (9), 4 4 - - 50. [31] M.R. Woodward, M.A. Hannel and D.Hedley, A measure ofcontrol flow complexity in program text.
IEEE Trans. Soft. Engg., 1979, S E - 5 , 4 5 - - 50. [32] P.A. Szulewski and M.H. Whiteworth, The Measurement of Control Flow and Data-Flow Complexity
in SoRware Designs. Proc. of 4th IEEE Computer Software and Applications Conference, 7 3 5 - 743, 1980.
N o . 3 Software Composi te Structural Metrics 217
[33] J. Guttag, Abstract data types and the development of data structures. Conference on Data, Salt Lake City, 1976. CACM, 1977, 20(6), 396-- 404.
[34] N.F. Schneidewind, Software Metrics for Aiding Program Development and Debugging. Proc. NCC., 989-- 994, 1979.
[35] L.A. Belady, and C.J. Evangelisti, System partitioning and its measure. The Journal of System and Software 2, 2 3 - - 29, 1981.
[36] H.E . Dunsmore, Software Metrics: An Overview of Evolving Method, Empirical Foundations of Information and Software Science, Proc. of the First Symposium, Atlanta, GA. , 1 8 3 - 192, 1982.
[37] E . T . Chert, Program complexity and programmer productivity. IEEE Trans. Soft., Engg., 1978, S E - 4 , 187-- 194.
[38] W. Harrison and K. Magel, ,Applying software complexity metrics to program maintenance. Con,purer, 1982, (9).
[39] K. Magel, Efficient calculation of the scope program complexity metric. SIGPLAN Notices, 1986, 21 (2).
[40] G.J. Myers, An extension to the cyclomatic measure of program complexity, SIGPLAN Notices, 1977, 12 (I0), 6 1 - - 64.
[41] W.J. Hansen, Measurement of program complexity by the pair (Cyclomatic Number, Operator Count). SIGPLAN Notices, 1979, 13, 6 1 - 64.
[42] Monika Schmidt, A complexity measure based on .selection and nesting. ACM SIGMETRICS- Pe(ormanee Evaluation Review, 1985, 13 (1).
[43] Bina Ramamurthy and Austin Melton, A synthesis of software science measures and cyclomatic number. IEEE Trans. on Soft. Engg., 1988, 14(8), 1116-- 1121.
[44] W.J. Howatt, and A.L. Baker, Definition and Design Tool for Program Control Structure Measures.. COMPSAC 85, 214-- 220, 1985.
[45] R. Moawad, and M . Hassan, Structural Approach Towards Software Reliability Evaluation. COMPSAC 83, 9 - - 16, 1983.
[46] F. Stetter, Software Technologies.Wissench Aftsverlag, Bibiliographisches Institute Manheim, "Zurich, 1981.
[47] E . Oviedo, Control Flow, Data Flow and Programming Complexity. Proc. of COMPSAC 80, Chicago IL, pp. 146-- 152, 1980.
[48] S. Jayaprakash, K.B. Lakshaman and P.K. Sinha, MEBOW: A Comprehensive Measure of Control Flow Complexity, COMPSAC 87, pp. 238-- 244, 1987.
[49] S. Presier, Combined network complexity measures. IBM Journal of Research and Deoeloprrent, 1 5 - 27, Jan. 1984.
[50] A.T. Tayer and M. Lipow, Software Reliability: A Study of Large Project Reliability. North Holland Publishing Company, 1978.
[51] D. Potier, J.L. Albin and R. Ferreol, Experiments with Computer Software Complexity and Reliability. COMPSAC 82, 9 4 - - 103, 1982.
[52] N. Schneidewind and H.M. Hoffman, An experiment in software error data collection and analysis. 1EEE Trans. Soft. Engg., 1979, S E - 5 , 276-- 286.
[53] J.E. Sullivan, Measuring Complexity of Computer Software. Mitre Corporation, MTR-2648, Vol. 5, June 1973.
[54] A.R. Feuer and B.E. Fowlkes, Relating Computer Maintainability to Software Measures. National Computer Conference, 1003--1012, 1979.
[55] A.L. Baker and S.H. Zweben, A Comparison of Measures of Control Flow Complexity. in P roc., COMPSAC 79. New York: IEEE, 1979, 695-- 701.
[56] S.C. Ntafos, A comparison of some structural testing strategies. IEEE Trans. on Soft. Engg., 1986, 14 (6), 868-- 874.
[57] F. F. Waiters, Applications of Metrics to a Software Quality Management ( Q M ) Program. J .D. Cooper and M.J. Fisher, Eds., Software Quality Management, New York, Petrocelli, 1 4 3 - 157, 1979.
[58] S.S Yau and J.S. Collofellow, Some Stability Measures for Software Maintenance. in Proc. IEEE COMPSAC 79, 674-- 679, 1979.
[59] D.Kafura and R. Greereddy, The use of software complexity metrics in software maintenance. IEEE Trans. on Soft. Engg., 1987, SE-13(3) .
[60] I.L. Elshoff and M. Marcotty, On the use of the cyclomatic number to measure program complexity. SIGPLAN Notices, 1978, 12, 29 - - 39.

218 J. of Comput . Sci. & Technol. Vol.7
[61] D.J. Blaine and R.A. Kemmerer, Complexity measures for assembly language programs. The Journal of System and Software, 1985, (5), 2 2 9 - 245.
[62] Brain A. Nejmch, NAPTH: A measure of execution path complexity and its applications. CACM, 1988, 31 (2), 188-- 200.
[63] N. Deo, Graph Theory with Application to Engineering and Computer Science, Prentice-Hall, New Jersey, 1974.
[64] N.E. Fenton, The Structural Complexity of Flowgraphs in Graph Theory and Its Applications to Algorithms and Computer Science, J. WiUey and Sons, 1985.
[65] V. Rodriguez and W.T. Tsai, A tool for discriminant analysis and classification of software metrics. Software Development, Butterworth & Co., 1987, 29 (3).
[66] W.S. Torgerson, Theory and Methods of Scaling. New York, John Wiley, 1958. [67] S.S. Stevens, Measurement in G.M. Maranell Ed., Scaling: A Source-book for Behavioral Scientists.
Chicago, IL: Aldine, 2 2 - - 4 1 , 1974. [68] D.F. Morrison, Multivariate Statistical Methods. New York; McGraw Hills, 1967. [69] SAS User's Guide: SAg Institute of Statistical Analysis System, 1982. [70] J.C. Tieman, An efficient search algorithm to find the elementary circuits of a grpah. CACM, 1970,
13 (12), 722-- 726. [71] F.E. Allen, Control flow analysis. SIGPLAN Notice, 1970, 7, 1 --19. [72] Kemighan and Plaugher, The Elements of Programming Style. McGraw-Hills, 1974.