a method for visualization of “omic” datasets for...
TRANSCRIPT

This article is available online at http://www.jlr.org Journal of Lipid Research Volume 52, 2011 1073
Copyright © 2011 by the American Society for Biochemistry and Molecular Biology, Inc.
“sphingolipidome” due to its size and complexity (includ-ing the existence of many isomers and isobars) ( 9 ) and wide range in amounts. Therefore, it would be useful to have tools that draw on other sources of information, such as gene expression data, to direct attention toward particu-lar subspecies that might otherwise be overlooked by mass spectrometry or other methods.
This article describes a pathway visualization tool to predict differences in sphingolipid composition using microarray data, then explores its utility using publicly available datasets for cancer cells in culture and tumors. Cancer was selected because sphingolipids are involved in many processes that are important in regulation of growth, survival, adhesion, and migration ( 10 ), and tumors often display alterations in sphingolipid composition ( 11, 12 ), some of which have been proposed as cancer markers ( 13–15 ). Furthermore, there have been a large number of
Abstract Sphingolipids are structurally diverse and their metabolic pathways highly complex, which makes it diffi cult to follow all of the subspecies in a biological system, even using “lipidomic” approaches. This report describes a method to use transcriptomic data to visualize and predict potential differences in sphingolipid composition, and it il-lustrates its use with published data for cancer cell lines and tumors. In addition, several novel sphingolipids that were predicted to differ between MDA-MB-231 and MCF7 cells based on published microarray data for these breast cancer cell lines were confi rmed by mass spectrometry. For the data that we were able to fi nd for these comparisons, there was a signifi cant match between the gene expression data and sphingolipid composition ( P < 0.001 by Fisher’s exact test). Upon considering the large number of gene expres-sion datasets produced in recent years, this simple integra-tion of two types of “omic” technologies (“transcriptomics” to direct “sphingolipidomics”) might facilitate the discov-ery of useful relationships between sphingolipid metabolism and disease, such as the identifi cation of new biomarkers. — -Momin, A. A., H. Park, B. J. Portz, C. A. Haynes, R. L. Shaner, S. L. Kelly, I. K. Jordan, and A. H. Merrill, Jr. A method for visualization of “omic” datasets for sphingolipid metabo-lism to predict potentially interesting differences. J. Lipid Res. 2011. 52: 1073–1083.
Supplementary key words lipidomics • pathway visualization • tran-scriptomics • cancer
The importance of sphingolipids for cell structure and regulation ( 1–3 ) has inspired the development of mass spectrometric methods to analyze key categories of these compounds (see Refs. 4–8 for examples). These cover hundreds of subspecies but still miss a large portion of the
This work by was supported by the National Institutes of Health Grant U54 GM-069338 (Lipid MAPS Consortium “Glue” Grant). Its contents are solely the responsibility of the authors and do not necessarily represent the offi cial views of the National Institutes of Health. ���Author’s Choice—Final version full access. Manuscript received 30 August 2010 and in revised form 26 February 2011.
Published, JLR Papers in Press, March 16, 2011 DOI 10.1194/jlr.M010454
A method for visualization of “omic” datasets for sphingolipid metabolism to predict potentially interesting differences
Amin A. Momin , * Hyejung Park , * Brent J. Portz , * Christopher A. Haynes , * Rebecca L. Shaner , †,§ Samuel L. Kelly , * I. King Jordan , * and Alfred H. Merrill , Jr. 1, * ,†,§
School of Biology,* School of Chemistry and Biochemistry, † and the Petit Institute for Bioengineering and Bioscience, § Georgia Institute of Technology , Atlanta, GA
Abbreviations: 3KSa, 3-ketosphinganine; BCA, bicinchoninic acid; Cer, ceramide; CerP, ceramide 1-phosphate; CerS, ceramide synthase (isoforms 1-6); CERT, Cer transporter; DEGS, dihydroceramide desat-urase; DHCer, dihydroceramide; DH, dihydro- backbone; ELOVL, fatty acyl-CoA elongase; EP, ethanolamine phosphate; Fut, fucosyltrans-ferase; Fut1/Fut2, alpha(1,2)fucosyltransferase; GalCer, galactosylCer; Gb3 or CTH, ceramide trihexoside; Gb4, ceramide tetrahexoside (glo-boside); GlcCer, glucosylCer; GSL, glycosphingolipid; HexCer, mono-hexosylCer; HNSCC, head and neck small cell carcinoma; IDC, invasive ductal carcinoma; KEGG, Kyoto Encyclopedia of Genes and Genomes; LacCer, lactosylceramide; LCB, long chain base; phyto-Cer, phytocer-amide; phyto-HexCer, monohexosyl phytoceramide; phyto-SM, phy-tosphingomyelin; Sa, sphinganine; Sa1P, sphinganine 1-phosphate; SCD, stearyol-CoA desaturase; SL, sphingolipid; SM, sphingomyelin; SPTLC1, serine palmitoyltransferase 1; SPTLC2, serine palmitoyltrans-ferase 2; SPTLC3, serine palmitoyltransferase 3; SPHK, sphingosine kinase (isoforms 1 and 2); So, sphingosine; So1P, sphingosine 1-phos-phate; SSEA-3, stage-specifi c embryonic antigen 3; SSEA-4, stage-spe-cifi c embryonic antigen 4; ST, sulfatide; UGCG, UDP-glucose ceramide glucosyltransferase; UGT1, glucosylceramide synthase; UGT8, galacto-sylceramide synthase.
1 To whom correspondence should be addressed. e-mail: [email protected]
The online version of this article (available at http://www.jlr.org) con-tains supplementary data in the form of i ) one table with accompanying text, ii ) online tutorial screens, iii ) two fi gures, and iv ) 59 heat maps.
��Author’s Choice
by Alfred M
errill, on May 14, 2011
ww
w.jlr.org
Dow
nloaded from
.html http://www.jlr.org/content/suppl/2011/03/17/jlr.M010454.DC1Supplemental Material can be found at:

1074 Journal of Lipid Research Volume 52, 2011
in supplementary Fig. I; it was modifi ed to include branches for the synthesis of 3-ketodihydroceramides ( 26 ), sphingolipids with dihydroceramide backbones, and phyto-sphingolipids. These modifi ed KEGG pathway maps, as well as ones for gangliosides and globo series GSL, can be obtained from www.sphingomaps.org or the Wikipathways database ( 27 ). A list of all the genes is provided in Table 1 and supplementary online data.
Selection of DNA microarray datasets and statistical analysis
Keyword searches were conducted on National Center for Bio-technology Information, Gene expression omnibus (NCBI GEO) ( 28 ) Array express ( 29 ) and Oncomine ( 30 ) for “cancer type” or “cancer cell line,” and the outcomes were examined to identify either expression datasets having multiple replicates of control and cancer tissues or all the cell lines to be compared. The Af-fymetrix expression fi les (.CEL fi le) for the selected datasets were downloaded and processed by Affymetrix expression console v1.1 (Affymetrix, Santa Clara, CA) using the MAS5 algorithm. For non-Affymetrix studies, the normalized and background-corrected expression datasets (GDS fi le, NCBI GEO format) were accessed using the GEOquery package ( 31 ) of Bioconductor v1.8 ( 32 ) and exported as tab-delineated text fi les. Sphingolipid-specifi c gene expression values were fi ltered using a Perl search algorithm and a list of preselected Affymetrix probe IDs or gene ID (see below). The gene expression fold change was determined using Excel (Microsoft, Seattle, WA), after which the dataset was formatted as a PathVisio input fi le (comma-separated values) with “gene ids,” “system code,” and “fold change.”
Selection of gene probes To identify the best probes for sphingolipid genes, the se-
quences of all probes directed to individual transcripts were re-trieved from the Affymetrix Netaffx tool ( 33 ) and compared with the mRNA using Blat search ( 34 ) in the University of California, Santa Cruz (UCSC) genome browser ( 35 ). The probe that recog-nized the catalytic transcript and hybridized nearest to its 3 ′ UTR was selected to represent the gene for pathway model visualiza-tion, and others were excluded. The procedure was repeated for all sphingolipid genes for Affymetrix chips HG-U95 A-E and HG-U133 plus 2 (supplementary online data).
Perl algorithm for extraction of expression values A Perl script was written to search for and extract gene expres-
sion values for sphingolipid-related transcripts. The program transforms the list of probe IDs or gene IDs into an array, and then searches for similar objects in a normalized gene expression data fi le, where the rows represent probe IDs and columns indi-vidual experiments. The loop function effi ciently extracts and writes the sphingolipid gene expression values into a text fi le, which is used to calculate gene fold changes. A copy of the Perl script and instructions for its use are provided in the supplemen-tary online data.
Pathway visualization In the PathVisio v2 browser, the appropriate gene and metabo-
lite database was selected, and the expression dataset was created after importing the saved input fi le using the Import Expression Dataset tab. The color criteria for the expression dataset were specifi ed using the Visualization Option function. Gene and me-tabolite expression changes were visualized on the modifi ed sphingolipid pathway maps by opening the pathway diagram in PathVisio v2, and then selecting the saved expression dataset and visualization criteria. The pictures were prepared by exporting the images as PDF fi les; while changes to font colors were performed
microarray analyses of gene expression in cancer cell lines and tumors, and more are certain to be conducted; there-fore, a tool that can utilize this data to direct attention to compounds that are potentially different in cancer might aid the understanding of the molecular changes associated with this disease and possibly uncover novel biomarkers.
There are ample precedents for this approach. For ex-ample, elevated expression of mRNA for GD3 synthase has been correlated with the amounts of GD3 in mela-noma cell lines ( 16 ), and in the reverse direction, the fi nding of low amounts of C18-ceramide (Cer) in head and neck cancer led to the discovery of lower expression of CerS1 ( 17 ). Nonetheless, there is currently no accurate pathway map for the visualization of datasets for large cat-egories of genes and metabolites involved in sphingolipid biosynthesis. Therefore, the goal of these studies was to develop tools for this purpose by using PathVisio v2 ( 18 ), an open access pathway browser, and updated and ex-panded maps to visualize data from analyses of gene ex-pression and sphingolipid metabolites. A preliminary version of this tool was described earlier ( 19 ); this article provides more information and illustrates its application to cancer cell lines, tumors, and normal tissues, which found substantial agreement between gene expression and metabolite profi les.
MATERIALS AND METHODS
Materials MCF7 cells were purchased from the ATCC ( Manassas, VA),
and MDA-MB-231 cells were provided by Dr. Nathan Bowen (School of Biology, Georgia Institute of Technology, Atlanta, GA). Cell culture medium was procured from Gibco (Carlsbad, CA), and FBS was obtained from Hyclone (Logan, UT). U- 13 C labeled palmitic acid was obtained from Cambridge Isotopes (Andover, MA). The mass spectrometry internal standards were procured from Avanti Polar Lipids (Alabaster, AL); other gly-cosphingolipid (GSL) standards were obtained from Sigma (St. Louis, MO) and Matreya (Pleasant Gap, PA). All other reagents and solvents were HPLC grade.
Modifi cation of PathVisio v2 and construction of sphingolipid pathway maps
PathVisio v2 ( 18 ), open source Java software, was selected for the construction of pathway maps for different branches of sphin-golipid biosynthesis and the visualization of differentially ex-pressed genes. A tutorial on how to use Path Visio v2 and the tools described in this manuscript is available on the web site http://sphingolab.biology.gatech.edu/sphingoPathvisioTutorial1.html. To differentiate metabolites from genes, the former were displayed as circular objects, while the latter had a rectangular shape. New pathway maps using PathVisio v2 were constructed by altering Kyoto Encyclopedia of Genes and Genomes (KEGG) pathway diagrams to include metabolite identifi ers at the nodes, while the genes were updated to refl ect new discoveries and changes in nomenclature. Some of the prominent changes in the sphingolipid pathway maps are as follows: the addition of ceramide synthase gene isoforms (CerS1-6) ( 20–24 ), dihydrocer-amide desaturase (DEGS1, DEGS2) ( 25 ), and � (1,2)fucosyltrans-ferases (FUT1 and FUT2) ( 14 ). The layout of the backbone biosynthesis map was published previously ( 19 ) and is provided
by Alfred M
errill, on May 14, 2011
ww
w.jlr.org
Dow
nloaded from
.html http://www.jlr.org/content/suppl/2011/03/17/jlr.M010454.DC1Supplemental Material can be found at:

Tools for sphingolipidomics 1075
heatmap coloring of Fig. 1 is a comparison of MDA-MB-231 and MCF7 cells, which will be discussed later in this article ( Figs. 2–5 ). The gene annotations for the individual steps of the pathway are listed in Table 1 , and additional details are given in supplementary Fig. I and recent reviews ( 9, 19 ). An expanded form of the pathway has been pro-vided to www.wikipathways.com ( 27 ) and can be down-loaded from that site.
As displayed, de novo sphingolipid biosynthesis is initi-ated in the upper-left corner ( Fig. 1 , dashed box A) by the condensation of serine and palmitoyl-CoA by serine palmitoyltransferase (SPT) to produce 3-ketosphinganine (3KSa). The fi ve genes for SPT represent the three genes known to code for functional proteins (SPT1-3 from SPTLC 1, 2, and 3) and two shorter transcripts (ssSPTa and ssSPTb) that have been suggested to regulate SPT ( 38 ). The 3KSa is reduced to sphinganine (Sa), which is at a branch point where it can be acylated by ceramide syn-thases (CerS, in dashed box B 2 ) or phosphorylated by sphingosine kinase (SPHK1 or 2) to Sa 1-phosphate (Sa1P), which can be terminally degraded to hexadenanal (C16:0-al) and ethanolamine phosphate (EP). The acyla-tion products, dihydroCer (DHCer), are at another branch point (dashed box C) and are desaturated to Cer by DES1 (and possibly DES2), hydroxylated to 4-hydroxyDHCer (phyto-Cer) by DES2 ( 25 ), or converted to a more com-plex dihydrosphingolipids, as will be discussed later. DH-Cer can also be hydrolyzed by ceramidases (ASAH 1-3, 3L, and PCHA). For most cells, the desaturation branch is pre-sumed to predominate because Cer is the major lipid backbone of most complex sphingolipids ( 9, 39 ).
with CorelDraw X4 (Mountain View, CA) as summarized in the supplementary online data. A detailed tutorial for this tool (in-cluding how to download PathVisio software) is available (see the supplementary online data).
Estimation of the relative amounts of the sphingolipids for the samples used in the gene expression comparisons
The MCF7 and MDA-MB-231 cells were grown in 100 mm tis-sue culture dishes using RPMI 1640 medium containing 5% FBS under conditions described previously ( 36 ). When the cells reached 80-90% confl uency, they were washed once with PBS so-lution, before being scraped into screw capped glass test tubes for sphingolipid extraction as previously described ( 37 ). An ali-quot of the cells was retained from each dish to measure the pro-tein concentration by the bicinchoninic acid (BCA) assay (Pierce Biotechnology, Rockford, IL). During stable isotope-labeling studies, the media was supplemented with 0.1 mM [U- 13 C]palm-itic acid complexed with equimolar fatty acid free BSA (Calbio-chem, Gibbstown, NJ). After the times described for each experiment, the sphingolipids were analyzed by LC ESI-MS/MS using ABI 3000 and ABI 4000 LC-tandem mass spectrometers (Ap-plied Biosystems, Foster City, CA), as previously described ( 37 ).
When available, published quantitative data for metabolites were used to compute fold changes. In some instances, only pho-tographs of TLC plates were provided, and in those cases, crude estimates were obtained from the relative densities obtained us-ing Fluorchem 5500 (Alpha Innotech, San Leandro, CA). The sources of these data are provided in the text.
RESULTS AND DISCUSSION
Summary of the sphingolipid biosynthetic pathway as the basis for construction of maps to visualize gene expression and metabolite data in a pathway context
Fig. 1 displays the pathway map for the initial steps of sphingolipid biosynthesis that we constructed for use with PathVisio v2 ( 18 ). Metabolites are in circles, and the genes associated with each step of the pathway are in boxes. The
TABLE 1. Genes involved in de novo sphingolipid biosynthesis in Fig. 1
Gene ID Gene Name Ref.
SPTLC1, SPTLC2, SPTLC 3 Serine palmitoyltransferase subunits (1, 2, and 3) ( 52 )KDSR, 3KSR, FVT1 3-Ketosphinganine reductase ( 53 )CerS1, CerS2, CerS3, CerS4CerS5, CerS6
Ceramide synthase (1-6) ( 20-24 )
SPHK1, SPHK2 Sphingosine kinase (1, 2) ( 54 )SGPL1 Sphingosine 1-phosohate lyase ( 55 )DES1, DES2, DEGS1, 2 Dihydroceramide desaturase (1 and 2) ( 25 )ASAH1, ASAH2, ASAH3, ASAH3L, PCHA Ceramidases (Acid, neutral, phytoceramidase) ( 56-60 )SMS1,SMS2, SMSr, Sphingomyelin synthase (1, 2, and atypical) ( 40, 61 )UGCG, Gba Glucosylceramide synthase ( 62 )UGT8, CGT Galactosylceramide synthase ( 63 )CERK Ceramide kinase ( 64, 65 )CERT Ceramide transporter ( 42, 66 )SMPD1, SMPD2, SMPD3, SMPD4 Sphingomyelinases (acidic, neutral) ( 67, 68 )B4GALT6 Lactosylceramide synthase ( 69 )GAL3ST1 galactose-3-O-sulfotransferase 1 ( 70 )ELOVL 1-7 Fatty acid CoA elongases (1-7) ( 71 )SCD Stearoyl CoA desaturase ( 72 )ssSPTa, ssSPTb Small subunits of SPT ( 73 )ORMDL1, ORMDL 2, ORMDL 3 Orosomucoid (1-3) ( 74, 75 )
The table lists alternative gene abbreviations and complete names for genes encoding enzymes for different steps of de novo sphingolipid biosynthesis displayed in Fig. 1 . Genes involved in the biosynthesis of glycosphingolipids are described in a table in the supplementary online data.
2 The fatty acyl-CoA elongases and desaturases that biosynthesize the cosubstrates for CerS are also shown in this diagram and in supplemen-tary Fig. I.
by Alfred M
errill, on May 14, 2011
ww
w.jlr.org
Dow
nloaded from
.html http://www.jlr.org/content/suppl/2011/03/17/jlr.M010454.DC1Supplemental Material can be found at:

1076 Journal of Lipid Research Volume 52, 2011
for these steps are given in the supplementary online data. As noted before, users of PathVisio v2 can update and expand these pathways as new information is obtained.
Cer is also at a branch point (illustrated in dashed box D for Cer) for the biosynthesis of sphingomyelin (SM) ( 40 ) (and a recently reported Cer-phosphoethanolamine) ( 41 ), glucosylCer (GlcCer), galactosylCer (GalCer), or Cer 1-phosphate (Cer1P). Shown in this scheme is CERT, an additional protein that transports Cer to the trans-Golgi for biosynthesis of SM, CerP, and possibly some GlcCer ( 42 ). These reactions sometimes take place with DHCer and phyto-Cer, but for simplicity, these additional steps have not been included in Fig. 1 . Pathway maps can be customized for PathVisio v2 at the discretion of the user, which allows inclusion of additional steps, such as genes coding for the enzymes of sphingolipid turnover (see Fig. 1 for the sphingomyelinases but not the glycosidases for GlcCer and GalCer), and for updating as new genes and metabolites are discovered.
This particular scheme displays the next metabolic step for GlcCer, glycosylation of GlcCer to lactosylCer (LacCer), after which the pathway branches into fi ve so-called root structure series (globo-series, isoglobo-series, ganglio-series, lacto-series and neo-lacto-series) ( 9 ), and for GalCer, which is primarily converted to sulfatides (ST). Separate pathway maps are shown for two subcat-egories of more complex glycosphingolipids, ganglio-sides ( Fig. 6 ), and globo-series neutral glycosphingolipids ( Fig. 7 ) (these have also been made available through Wikipathways) ( 27 ). Background references for the genes
Fig. 1. Visualization of transcription and metabolite differences in early steps of sphingolipids biosynthesis between MDA-MB-231 and MCF7 cells using PathVisio v2 with an expanded pathway map. The fi gure depicts sphingolipid genes (rectangles) and metabolites (circles) that participate in early steps of sphingolipid biosynthesis prepared using PathVisio v2 (for more detail, see supplementary Fig. I) ( 18 ). The updated and expanded pathway map was overlaid by the gene expression fold change difference between MDA-MB-231 and MCF7 cells obtained from a previous study ( 36 ). Variations in sphingolipid composition (shaded circles) between the two cell lines were determined by LC-ESI-MS/MS as previously described ( 4 ) and compared with gene expression as highlighted by circumscribed dash boxes (A-D) and discussed in Figs. 3–6 . The box and circle shades represent the degree of upregulation and downregulation indicated by the color chart.
Fig. 2. Comparison of de novo sphingolipid biosynthesis between MDA-MB-231 and MCF7 cells with gene expression of serine palmi-toyltransferase. The two cell lines were grown as previously described ( 36 ) and incubated with and without 0.1 mM [ 13 C]palmitic acid as the BSA complex for 0, 3, and 6 h. A: The sphingolipids labeled in sphingoid base and fatty acid (Dual) were measured by LC-ESI-MS/MS ( 4 ). B: In parallel experiments, unlabeled sphingolipids were also measured for both cell types. A: Sum of Dual [ 13 C]palmitate-labeled complex sphingolipids with SL (Cer) and DHSL (DHCer) backbone. B: Sum of unlabeled complex SL and DHSL in ceramide (Cer), monohexosylceramide (HexCer), and sphingomyelin (SM). The signifi cance, indicated by an asterisk, was determined by a t -test at P < 0.05 for n = 3 (labeling study) and n = 6 (for unlabeled cells).
by Alfred M
errill, on May 14, 2011
ww
w.jlr.org
Dow
nloaded from
.html http://www.jlr.org/content/suppl/2011/03/17/jlr.M010454.DC1Supplemental Material can be found at:

Tools for sphingolipidomics 1077
microarray repositories ( 28, 29 ). Platform-specifi c tools were used to normalize raw expression values for samples within studies as described under “Methods,” and a Perl script was written (see supplementary online data) to sort out expression values for transcripts involved in sphingo-lipid biosynthesis. Fold differences were computed either by taking the ratio between two conditions (such as two cell lines or cancer stages) or by normalizing the individual gene expression by the average among all samples (in the case of multiple cell lines), and then visualized using the sphingolipid biosynthesis pathway maps and PathVisio v2.
The presence of multiple probes for individual tran-scripts and a large number of transcripts posed a challenge during the analysis. To address the former, probes specifi c to the 3 ′ UTR of the mRNA were chosen by a Blat search ( 34 ) using the UCSC genome browser ( 35 ). A list of the optimum probes for sphingolipid biosynthesis in human HG-U133 Plus2 and HG-U95 Affymetrix gene chips is pro-vided in the supplementary online data. In case of the lat-ter, a search algorithm was written in Perl (supplementary online data) to sort out the expression values for the opti-mum probes using the list of preselected probes.
Rules for correlating mRNA and metabolite abundance To study the correlation between transcript and metabo-
lite amounts, certain rules were followed based on biochem-ical understanding: a ) Only the de novo biosynthesis steps beginning with the condensation of serine and palmitoyl-CoA were evaluated; the reverse steps were usually not in-cluded; b ) For isoforms that are known to display distinct specifi cities, such as SPTLC3, the CerS isoforms (CerS1-6), ELOVL 1-6, SCD, and DES2 (versus DES1), the changes in individual transcripts were compared with their correspond-ing sphingolipid subspecies; c ) Enzymatic steps represented by multiple gene isoforms without known differences in the specifi cities of their product enzyme were compared with the total metabolite amount (in addition, the step was
Preparation of data for visualization in sphingolipid gene expression pathway diagrams
Before discussing the heatmap differences in these fi g-ures, some comments will be made about the datasets and the formatting of the data for visualization using PathVisio v2. Cancer was selected as the source of the datasets because published gene expression data are available for cancer cells, normal cells, and tumor cells ( 36, 43, 44 ) from public
Fig. 3. Comparison of the composition of fatty acyl CoA and cer-amide chain lengths for MDA-MB-231 and MCF7 cells. MDA-MB-231 and MCF7 cells were grown as previously described ( 36 ). The fatty acyl-CoA (FA-CoA) and ceramides (Cer) were measured by LC-ESI-MS/MS ( 37, 84 ). A: Composition of saturated and monounsatu-rated FA-CoA chain lengths. B: N-acyl chain distribution of Cer corresponding to the FA-CoA measured in A. The signifi cance, indi-cated by an asterisk, was determined by a t -test at P < 0.05 for n = 6.
Fig. 4. Comparison of the phyto-sphingolipids of MDA-MB-231 and MCF7 cells. LC-ESI-MS/MS compari-son of phyto-sphingolipids (phyto-SL; i.e., with a 4-hydroxysphinganine backbone), phyto-ceramide (phyto-Cer), phyto-monohexosylceramide (phyto-HexCer), and phyto-sphingomyelin (phyto-SM) (note different scale) for MDA-MB-231 and MCF7 cells. The signifi cance, indicated by an asterisk, was determined by a t -test at P < 0.05 for n = 6.
by Alfred M
errill, on May 14, 2011
ww
w.jlr.org
Dow
nloaded from
.html http://www.jlr.org/content/suppl/2011/03/17/jlr.M010454.DC1Supplemental Material can be found at:
1078 Journal of Lipid Research Volume 52, 2011
number of relatively self-evident predictions, including that MDA-MB-231 cells might have: a ) lower de novo sphingolipid biosynthesis due to lower mRNA abundance of SPTLC1 and SPTLC2 ( Fig. 1 , dashed box A), whereas higher expression of SPTLC3 might indicate an elevation of sphingolipids with a 16-carbon sphingoid base back-bone; b ) lower proportions of Cer with unsaturated fatty acyl chains (e.g., C24:1 and C26:1) due to lower SCD, the enzyme that converts C18:0-CoA to C18:1-CoA, which is subsequently elongated to C24:1- and C26:1-CoA ( 45 ); c ) lower phyto-sphingolipids in MDA-MB-231 cells due to lower DES2 ( Fig. 1 , dashed box C); and d ) lower GalCer production but higher GlcCer and/or LacCer due to lower UGT8 and higher UDP-glucose ceramide glucosyltrans-ferase (UGCG) and B4GALT6 ( Fig. 1 , dashed box D). In the interest of space, the complete fi gures comparisons of mRNA abundance between the two cells for other branches of de novo sphingolipid and glycosphingolipid biosynthe-sis are displayed in supplementary Fig. II.
considered “upregulated” if at least one gene isoform was elevated, the step was considered “downregulated” if all iso-forms were downregulated, or the step was considered “un-changed” if all isoforms were unchanged or there was a mix of unchanged and reduced ); and d ) correlations were only counted when there was data for both the relative gene ex-pression and accompanying metabolites, which is obviously a small subset of all of the potential molecules.
To test the utility of this technique, gene expression datasets from breast cancer cell lines were compared fi rst, then normal breast cells and tumor cells were examined as described in the following sections.
Comparison of gene expression and sphingolipid differences between MCF7 and MDA-MB-231 breast cancer cells
Examination of the apparent 3 gene expression differ-ences between the highly metastatic ER-negative MDA-MB-231 and ER-positive MCF7 cell lines ( Fig. 1 ) leads to a
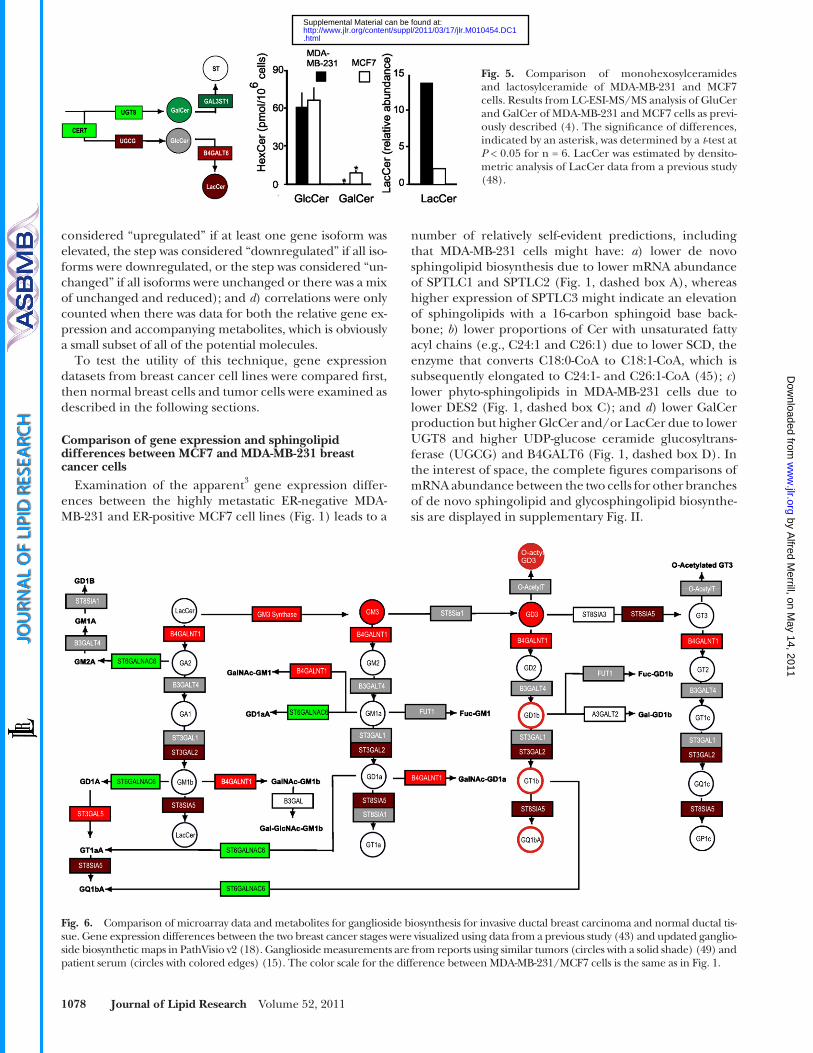
Fig. 5. Comparison of monohexosylceramides and lactosylceramide of MDA-MB-231 and MCF7 cells. Results from LC-ESI-MS/MS analysis of GluCer and GalCer of MDA-MB-231 and MCF7 cells as previ-ously described ( 4 ). The signifi cance of differences, indicated by an asterisk, was determined by a t -test at P < 0.05 for n = 6. LacCer was estimated by densito-metric analysis of LacCer data from a previous study ( 48 ).
Fig. 6. Comparison of microarray data and metabolites for ganglioside biosynthesis for invasive ductal breast carcinoma and normal ductal tis-sue. Gene expression differences between the two breast cancer stages were visualized using data from a previous study ( 43 ) and updated ganglio-side biosynthetic maps in PathVisio v2 ( 18 ). Ganglioside measurements are from reports using similar tumors (circles with a solid shade) ( 49 ) and patient serum (circles with colored edges) ( 15 ). The color scale for the difference between MDA-MB-231/MCF7 cells is the same as in Fig. 1 .
by Alfred M
errill, on May 14, 2011
ww
w.jlr.org
Dow
nloaded from
.html http://www.jlr.org/content/suppl/2011/03/17/jlr.M010454.DC1Supplemental Material can be found at:

Tools for sphingolipidomics 1079
n = 3), which is agreement with the apparently higher SPTLC3 expression in MDA-MB-231 cells ( Fig. 1 ).
To test the prediction from the microarray data that MDA-MB-231 cells would have lower amounts of SL with unsaturated fatty acids (due to production of less mono-unsaturated fatty acyl-CoAs because SCD expression is lower) ( Fig. 1 , dashed box B), the FA-CoAs and the chain-length distribution of the Cer were determined for the two cell lines. As shown in Fig. 3 , MDA-MB-231 cells had sig-nifi cantly lower amounts of all of the major mono-unsatu-rated fatty acyl-CoAs (i.e., per 10 6 MDA-MB-231 cells: 6.3 ± 0.22 pmol of C18:1, 1.4 ± 0.2 pmol of C24:1, and 4.6 ± 2.1 pmol C26:1; compared with MCF7 cells: 14.3 ± 0.6 pmol C18:1/10 6 cells, P < 0.001; 5.3 ± 1 pmol C24:1/10 6 , P < 0.001; and 10.8 ± 0.9 pmol C26:1/10 6 cells, P < 0.001). In some cases, the corresponding saturated FA-CoA was also somewhat lower ( Fig. 3A ). MDA-MB-231 cells also have sig-nifi cantly lower amounts of Cer with mono-unsaturated fatty acids ( Fig. 3B ) (the quantities for MDA-MB-231 ver-sus MCF7 cells were: 24.8 ± 4.5 pmol versus 7.1 ± 1.0 pmol C24:1-Cer/10 6 cells, P < 0.001; and 3.9 ± 0.6 pmol versus 0.5 ± 0.1 pmol C26:1-Cer/10 6 cells, P < 0.001). In contrast, there were fewer differences in the Cer with saturated fatty acids ( Fig. 3B ). All together, these fi ndings are consistent with the apparently lower expression of SCD in the MDA-MB-231 cells.
Likewise, the lower DES2 expression ( Fig. 1 ) is refl ected in lower amounts of phyto-sphingolipids in MDA-MB-231 cells ( Fig. 4 ). Per 10 6 cells, the amounts in MDA-MB-231 cells (1.4 ± 0.3 pmol phyto-Cer, 0.06 ± 0.02 pmol phyto-HexCer, and 0.6 ± 0.1 pmol phyto-SM) are all lower than the amounts in MCF7 cells (6 ± 1.4 pmol phyto-Cer, P < 0.001; 0.21 ± 0.04 pmol phyto-HexCer, P < 0.001; and 17.6 ± 1.9 pmol phyto-SM, P < 0.001).
Shown in Fig. 5 are the data relevant to the branch point for biosynthesis of GalCer, which would be predicted to be
To test the prediction that MDA-MB-231 cells have lower de novo sphingolipid biosynthesis, cells were incubated with [U- 13 C]palmitic acid, and the backbone and fatty acid-labeled sphingolipids (i.e., unambiguously biosynthesized de novo) were quantifi ed by LC ESI-MS/MS. At each time point, there was less incorporation of 13 C-palmitate into the sphingolipids of MDA-MB-231 cells than in those of MCF7 cells. Differences in the composition of these cell lines was also seen in LC ESI-MS/MS analysis of the unlabeled cells (shown in Fig. 2B) , with MDA-MB-231 cells having 48.8 ± 4.1 Cer/10 6 cells and 783 ± 40 pmol SM/10 6 cells ( Fig. 2B , black bars), which was signifi cantly lower than in MCF7 cells, which had 79.8 ± 11.1 pmol Cer/10 6 cells ( P < 0.001) and 1,220 ± 110 pmol SM/10 6 cells ( P < 0.001) ( Fig. 2B , white bars). In contrast, the amounts of unlabeled HexCer were higher in MDA-MB-231 cells, 50.3 + 3.4 pmol HexCer/10 6 cells, than in MCF7 cells, 36.9 ± 5.9 pmol HexCer/10 6 cells ( P < 0.001). Overall, however, both the 13 C-labeling and the SL amounts in MDA-MB-231 cells were lower than those in MCF7 cells, which were consistent with the apparent differences in SPT1 and SPT2 ( Fig. 1 ).
Another apparent difference between MDA-MB-231 and MCF7 cells is a higher expression of SPTLC3, which has been proposed to metabolize a shorter chain (d16:1) ( 46, 47 ). Although standards are not yet available for a rig-orous quantitation of d16:1-containing sphingolipids, pre-liminary analysis of the Cer subspecies of these cells by LC ESI-MS/MS ( 4 ) indicated that MDA-MB-231 cells had a higher proportion of d16:1-Cer (1.9 ± 0.4 pmol/10 6 cells) than did MCF7 cells (1.1 ± 0.2 pmol/10 6 cells) ( P < 0.05,
Fig. 7. Comparison of microarray data and corresponding metabolites for globo-series glycosphingolipid biosynthesis for invasive ductal breast carcinoma and normal ductal tissue. Comparison of gene expression differences between normal and invasive ductal carcinoma (IDC) from a previous study ( 43 ) using updated KEGG pathway maps for globo-series biosynthesis to metabolite changes previously re-ported using fl ow cytometry ( 14 ). The color scale for the difference between MDA-MB-231/MCF7 cells is the same as in Fig. 1 .
3 These differences are referred to as “apparent” because microarray data are not quantitative and should be validated by another method before drawing mechanistic conclusions. However, the purpose of this study was not to establish the validity of the gene expression data per se, but rather to explore whether publicly available microarray data can aid sphingolipid analysis by directing attention to possible differences.
by Alfred M
errill, on May 14, 2011
ww
w.jlr.org
Dow
nloaded from
.html http://www.jlr.org/content/suppl/2011/03/17/jlr.M010454.DC1Supplemental Material can be found at:

1080 Journal of Lipid Research Volume 52, 2011
GT 1a , GQ 1b , etc.). We have not found data to evaluate all of these predictions, but published results for the sphingo-lipid composition of IDC tissue versus normal tissue ( 49 ) noted higher quantities of GM 3 ( 49 ) as well as higher GD 3 , and N- and O-acetyl GD 3 and GT 3 ( 49 ), which might be due to elevation of GM 3 because the mRNAs for the proxi-mal enzymes (e.g., ST8Sia1 and O-AcetylT in Fig. 6 ) did not appear to be higher than for normal tissue. It is per-haps relevant that sera from patients with IDC have been found to have signifi cant elevations in GD 1b , GT 1b , and GQ 1b (highlighted in Fig. 6 as circles with colored edges) compared with healthy volunteers ( 15 ), which is also con-sistent with the gene expression data. It would be interest-ing to know whether this gene expression profi le might direct investigators to additional differences in glycosphin-golipid biosynthesis that might have functional relevance in this cancer or perhaps serve as biomarkers.
Fig. 7 shows a comparison of the available gene expres-sion data for steps in the biosynthesis of globo-series gly-cosphingolipids for IDC versus normal tissue. From the pathway depiction, higher globoside synthase, B3GalT5, and Fut2 would be predicted to elevate Gb4, SSEA-3, and Globo-H antigen, and the latter two (highlighted in Fig. 7
lower for MDA-MB-231 cells due to lower expression of UGT8, versus GlcCer, which might be higher due to the higher UGCG in MDA-MB-231 cells. Consistent with these predictions, MDA-MB-231 cells had barely detectable Gal-Cer (0.6 ± 0.6 pmol/10 6 cells), whereas MCF7 cells had 9 ± 2 pmol GalCer/10 6 cells ( P < 0.001). In contrast, the two cell lines contain essentially the same amounts of GlcCer (61 ± 11 pmol GlcCer/10 6 MDA-MB-231 cells and 66 ± 10 pmol GlcCer /10 6 MCF7 cells, P = 0.41), despite the appar-ent differences in UGCG expression. This might be due to consumption of GlcCer by the next step of the pathway as B4GALT6 expression also appears to be higher for MBA-MB-231 cells, and LacCer has been reported to be higher for MDA-MB-231 compared with MCF7 cells ( Fig. 5 , right panel) ( 48 ).
Other predictions might be made from the microarray data ( Fig. 1 ), but they would be more tenuous. For exam-ple, there are differences in some of the CerS that imply that the chain length subspecies of MDA-MB-231 and MCF7 cells might differ (beyond what has already been addressed above); however, two of the members (CerS1 and CerS3) were not represented in this data set, which adds unknown variables. As another example, mRNAs for both SM synthases (SMS1 and SMS2) appear to be higher for MDA-MB-231 cells, but sphingomyelinases (SMPD1 and SMPD3) are also elevated, and a transporter that is thought to be involved in Cer traffi cking to Golgi for SM synthesis (CERT) is lower. On the basis of the lower SM amounts in MDA-MB-231 cells ( Fig. 2 ), it appears that one or both of the latter factors predominate(s).
Correlation of gene predictions and metabolite analysis in breast tumor tissues
Visualization of downstream steps of sphingolipid me-tabolism is also possible, as shown in Fig. 6 for ganglioside biosynthesis using published data from invasive ductal car-cinoma (IDC) breast tumors and normal ductal tissue ( 43 ). This dataset predicts that IDC have higher expres-sion of GM 3 synthase (which makes GM 3 from LacCer), B4GALNT1 (which adds GalNAc to LacCer to produce GA2, and to GM 3 to produce GM 2 , etc., as shown), ST3gal2 (which catalyzes the transfer of sialic acid from CMP-sialic acid to GA1 to produce GM 1b , to GM 1a for GD 1a , etc.) and ST8SIA5 (which is responsible for biosynthesis of GT 3 ,
TABLE 2. Comparison of gene expression and glycosphingolipid differences for nine cancer datasets
Cancer Type Gene Expression Ref. Metabolite Ref. G(i)M(i) G(d)M(d) G(i)M(d) G(d)M(i)
MDA-MB231 / MCF7 ( 36 ) Current analysis and ( 48 ) 4 8 4 2IDC / normal ductal ( 43 ) ( 14, 15, 49, 50 ) 5 1Gliosarcoma ( 76 ) ( 77 ) 2 1 1GBM / white matter ( 76 ) ( 78 ) 1 3 2 2Serious ovarian ( 79 ) ( 13, 80 ) 2 1Mucinous ovarian ( 79 ) ( 13, 80 ) 4 1SSEA3 / globo-H ( 36 ) ( 81 ) 3 7 5Melanoma cells ( 16 ) ( 16 ) 6 9 5Melanoma ( 82 ) ( 83 ) 3
Total 30 28 18 6
The table compares the agreement G(i)M(i) and G(d)M(d), and disagreement G(i)M(d) and G(i)M(d), between gene expression and sphingolipid differences for nine cancer datasets. G, gene expression difference; M, metabolite difference; (i), higher ratio; and (d), lower ratio. The total for each category were used to determine the statistical signifi cance as indicated in Fig. 8 .
Fig. 8. Statistical comparison of gene expression differences with metabolite amounts. Results from a survey comparing nine differ-ent gene expression datasets with corresponding sphingolipids. G(i) and G(d) indicate an increase and decrease in gene levels, while M(i) and M(d) indicate increase and decrease in metabo-lites. The signifi cance of agreement and disagreement between genes and metabolites was measured by Fisher’s exact test ( P = 0.01).
by Alfred M
errill, on May 14, 2011
ww
w.jlr.org
Dow
nloaded from
.html http://www.jlr.org/content/suppl/2011/03/17/jlr.M010454.DC1Supplemental Material can be found at:

Tools for sphingolipidomics 1081
and continually growing, body of data on differences in gene expression in cancer and other diseases, these path-way maps should be useful in accelerating the discovery of interesting new ways that sphingolipids are involved, and possibly in identifying new disease biomarkers. As lipi-domic data sets become more plentiful, there might also be occasions where the display of the metabolite data in PathVisio could assist investigators in the discovery of in-teresting aspects of regulation of sphingolipid metabolism at transcription or other levels.
The authors thank Sarah Singh for working with the online visualization tool and helping explore and validate its utility.
REFERENCES
1 . Hannun , Y. A. , and L. M. Obeid . 2008 . Principles of bioactive lipid signalling: lessons from sphingolipids. Nat. Rev. Mol. Cell Biol. 9 : 139 – 150 .
2 . Maceyka , M. , S. Milstien , and S. Spiegel . 2009 . Sphingosine-1-phosphate: the Swiss army knife of sphingolipid signaling. J. Lipid Res. 50 ( Suppl ): S272 – S276 .
3 . Lopez , P. H. , and R. L. Schnaar . 2009 . Gangliosides in cell recogni-tion and membrane protein regulation. Curr. Opin. Struct. Biol. 19 : 549 – 557 .
4 . Shaner , R. L. , J. C. Allegood , H. Park , E. Wang , S. Kelly , C. A. Haynes , M. C. Sullards , and A. H. Merrill , Jr . 2009 . Quantitative analysis of sphingolipids for lipidomics using triple quadrupole and quadrupole linear ion trap mass spectrometers. J. Lipid Res . 50: 1692–1707.
5 . Haynes , C. A. , J. C. Allegood , H. Park , and M. C. Sullards . 2009 . Sphingolipidomics: methods for the comprehensive analysis of sphingolipids. J. Chromatogr. B Analyt. Technol. Biomed. Life Sci. 877 : 2696 – 2708 .
6 . Han , X. , and X. Jiang . 2009 . A review of lipidomic technologies ap-plicable to sphingolipidomics and their relevant applications. Eur. J. Lipid Sci. Technol. 111 : 39 – 52 .
7 . Kirsch , S. , M. Zarei , M. Cindric , J. Muthing , L. Bindila , and J. Peter-Katalinic . 2008 . On-line nano-HPLC/ESI QTOF MS and tandem MS for separation, detection, and structural elucidation of human erythrocytes neutral glycosphingolipid mixture. Anal. Chem. 80 : 4711 – 4722 .
8 . Serb , A. , C. Schiopu , C. Flangea , E. Sisu , and A. D. Zamfi r . 2009 . Top-down glycolipidomics: fragmentation analysis of ganglioside oligosaccharide core and ceramide moiety by chip-nanoelectro-spray collision-induced dissociation MS2–MS6. J. Mass Spectrom. 44 : 1434 – 1442 .
9 . Merrill , A. H. , Jr ., M. D. Wang , M. Park , and M. C. Sullards . 2007 . (Glyco)sphingolipidology: an amazing challenge and opportunity for systems biology. Trends Biochem. Sci. 32 : 457 – 468 .
10 . Hakomori , S. I. 2008 . Structure and function of glycosphingolipids and sphingolipids: recollections and future trends. Biochim. Biophys. Acta . 1780 : 325 – 346 .
11 . Hakomori , S. 2002 . Glycosylation defi ning cancer malignancy: new wine in an old bottle. Proc. Natl. Acad. Sci. USA . 99 : 10231 – 10233 .
12 . Hakomori , S. 2001 . Tumor-associated carbohydrate antigens defi n-ing tumor malignancy: basis for development of anti-cancer vac-cines. Adv. Exp. Med. Biol. 491 : 369 – 402 .
13 . Makhlouf , A. M. , M. M. Fathalla , M. A. Zakhary , and M. H. Makarem . 2004 . Sulfatides in ovarian tumors: clinicopathological correlates. Int. J. Gynecol. Cancer . 14 : 89 – 93 .
14 . Chang , W. W. , C. H. Lee , P. Lee , J. Lin , C. W. Hsu , J. T. Hung , J. J. Lin , J. C. Yu , L. E. Shao , J. Yu , et al . 2008 . Expression of Globo H and SSEA3 in breast cancer stem cells and the involvement of fucosyl transferases 1 and 2 in Globo H synthesis. Proc. Natl. Acad. Sci. USA . 105 : 11667 – 11672 .
15 . Wiesner , D. A. , and C. C. Sweeley . 1995 . Circulating gangliosides of breast-cancer patients. Int. J. Cancer . 60 : 294 – 299 .
16 . Yamashiro , S. , M. Okada , M. Haraguchi , K. Furukawa , K. O. Lloyd , and H. Shiku . 1995 . Expression of alpha 2,8-sialyltransferase (GD3
as circles with colored edges) have been reported to be elevated in 77% and 61%, respectively, of breast cancer tissues ( 14, 50 ).
Comparison of the frequency of gene and sphingolipid alterations in cancers
There is no comprehensive dataset that allows rigorous comparison of the correlation between gene expression data and sphingolipid composition; however, we have ana-lyzed the frequency for the data at hand ( Table 2 ): nine gene expression datasets for which corresponding metab-olite data are available, for a total of 82 observations, in-cluding the present study. Evaluation of positive and negative correlations between gene expression differences and metabolite amounts revealed 30 instances in which both increased, 28 in which both decreased, for a total of 58 positive correlations ( Fig. 8 and Table 2 ). In 24 cases, genes and metabolite changes showed opposing outcomes (a negative correlation). In 12 instances, the metabolites were different, but the respective mRNA changes were less than ±1.5-fold. Thus, although we do not have data for all of the genes and metabolites of this pathway, for the ones we were able to locate there was a 70.7% correlation be-tween gene expression and sphingolipid differences, which was statistically signifi cant at P < 0.001 by Fisher’s exact test ( Fig. 8 ).
Although many factors other than mRNA amount are well known to regulate metabolic pathways (e.g., rates of translation, post translational modifi cation, protein turn-over, etc.), this degree of correlation suggests that it would still be worthwhile to use a pathway depiction of gene ex-pression data to direct attention to particular sphingolip-ids for subsequent analysis by a method such as mass spectrometry. To illustrate the wide range of similarities and differences among different cancer cell lines, pathway maps based on published gene expression data ( 36 ) for the 59 cancer cells lines in the NCI 60-cell line drug screen (NCI-60, http://discover.nci.nih.gov/cellminer/) have been provided in the supplementary online data. There is clearly a rich amount of diversity that warrants exploration.
SUMMARY
These studies illustrate how use of pathway maps to visu-alize gene expression data can facilitate the prediction of metabolic changes and direct attention to particular sphin-golipids for analysis. Two examples of this in our studies were the observation of elevated SPTLC3 in MDA-MB-231 cells versus MCF7 cells, which directed our attention to-ward the possibility that shorter chain (d16:1) sphingoid bases are present and that lower DES2 implied that MDA-MB-231 cells have less phyto-sphingolipids. In a separate study, we recently used this pathway map to note that epi-thelial ovarian cancer cells (collected by laser capture mi-crodissection) displayed elevated expression of mRNAs for the steps in sulfatide biosynthesis; the presence of sul-fatides was confi rmed by LC ESI-MS/MS and tissue-imag-ing mass spectrometry ( 51 ). Considering the already large,
by Alfred M
errill, on May 14, 2011
ww
w.jlr.org
Dow
nloaded from
.html http://www.jlr.org/content/suppl/2011/03/17/jlr.M010454.DC1Supplemental Material can be found at:

1082 Journal of Lipid Research Volume 52, 2011
35 . Kent , W. J. , C. W. Sugnet , T. S. Furey , K. M. Roskin , T. H. Pringle , A. M. Zahler , and D. Haussler . 2002 . The human genome browser at UCSC. Genome Res. 12 : 996 – 1006 .
36 . Shankavaram , U. T. , W. C. Reinhold , S. Nishizuka , S. Major , D. Morita , K. K. Chary , M. A. Reimers , U. Scherf , A. Kahn , D. Dolginow , et al . 2007 . Transcript and protein expression profi les of the NCI-60 cancer cell panel: an integromic microarray study. Mol. Cancer Ther. 6 : 820 – 832 .
37 . Sullards , M. C. , J. C. Allegood , S. Kelly , E. Wang , C. A. Haynes , H. Park , Y. Chen , and A. H. Merrill , Jr . 2007 . Structure-specifi c, quan-titative methods for analysis of sphingolipids by liquid chromatog-raphy-tandem mass spectrometry: “inside-out” sphingolipidomics. Methods Enzymol. 432 : 83 – 115 .
38 . Han , G. , S. D. Gupta , K. Gable , S. Niranjanakumari , P. Moitra , F. Eichler , R. H. Brown , Jr ., J. M. Harmon , and T. M. Dunn . 2009 . Identifi cation of small subunits of mammalian serine palmitoyl-transferase that confer distinct acyl-CoA substrate specifi cities. Proc. Natl. Acad. Sci. USA . 106 : 8186 – 8191 .
39 . Pruett , S. T. , A. Bushnev , K. Hagedorn , M. Adiga , C. A. Haynes , M. C. Sullards , D. C. Liotta , and A. H. Merrill , Jr . 2008 . Biodiversity of sphingoid bases (“sphingosines”) and related amino alcohols. J. Lipid Res. 49 : 1621 – 1639 .
40 . Yamaoka , S. , M. Miyaji , T. Kitano , H. Umehara , and T. Okazaki . 2004 . Expression cloning of a human cDNA restoring sphingomy-elin synthesis and cell growth in sphingomyelin synthase-defective lymphoid cells. J. Biol. Chem. 279 : 18688 – 18693 .
41 . Ternes , P. , J. F. Brouwers , J. van den Dikkenberg , and J. C. Holthuis . 2009 . Sphingomyelin synthase SMS2 displays dual activ-ity as ceramide phosphoethanolamine synthase. J. Lipid Res. 50 : 2270 – 2277 .
42 . Hanada , K. , K. Kumagai , N. Tomishige , and T. Yamaji . 2009 . CERT-mediated traffi cking of ceramide. Biochim. Biophys. Acta . 1791 : 684 – 691 .
43 . Turashvili , G. , J. Bouchal , K. Baumforth , W. Wei , M. Dziechciarkova , J. Ehrmann , J. Klein , E. Fridman , J. Skarda , J. Srovnal , et al . 2007 . Novel markers for differentiation of lobular and ductal invasive breast carcinomas by laser microdissection and microarray analysis. BMC Cancer . 7 : 55 .
44 . Hoefl ich , K. P. , C. O’Brien , Z. Boyd , G. Cavet , S. Guerrero , K. Jung , T. Januario , H. Savage , E. Punnoose , T. Truong , et al . 2009 . In vivo antitumor activity of MEK and phosphatidylinositol 3-kinase inhibitors in basal-like breast cancer models. Clin. Cancer Res. 15 : 4649 – 4664 .
45 . Kishimoto , Y. , and N. S. Radin . 1963 . Biosynthesis of nervonic acid and its homologues from carboxyl-labeled oleic acid. J. Lipid Res. 4 : 444 – 447 .
46 . Hornemann , T. , A. Penno , M. F. Rutti , D. Ernst , F. Kivrak-Pfi ffner , L. Rohrer , and A. von Eckardstein . 2009 . The SPTLC3 subunit of serine palmitoyltransferase generates short chain sphingoid bases. J. Biol. Chem. 284 : 26322 – 26330 .
47 . Han , G. , S. D. Gupta , K. Gable , S. Niranjanakumari , P. Moitra , F. Eichler , R. H. Brown Jr , J. M. Harmon , and T. M. Dunn . 2009 . Identifi cation of small subunits of mammalian serine palmitoyl-transferase that confer distinct acyl-CoA substrate specifi cities. Proc. Natl. Acad. Sci. USA. 106 : 8186 – 8191 .
48 . Nohara , K. , F. Wang , and S. Spiegel . 1998 . Glycosphingolipid com-position of MDA-MB-231 and MCF-7 human breast cancer cell lines. Breast Cancer Res. Treat. 48 : 149 – 157 .
49 . Marquina , G. , H. Waki , L. E. Fernandez , K. Kon , A. Carr , O. Valiente , R. Perez , and S. Ando . 1996 . Gangliosides expressed in human breast cancer. Cancer Res. 56 : 5165 – 5171 .
50 . Menard , S. , E. Tagliabue , S. Canevari , G. Fossati , and M. I. Colnaghi . 1983 . Generation of monoclonal antibodies reacting with normal and cancer cells of human breast. Cancer Res. 43 : 1295 – 1300 .
51 . Liu , Y. , Y. Chen , A. Momin , R. Shaner , E. Wang , N. J. Bowen , L. V. Matyunina , L. D. Walker , J. F. McDonald , M. C. Sullards , et al . 2010 . Elevation of sulfatides in ovarian cancer: an integrated tran-scriptomic and lipidomic analysis including tissue-imaging mass spectrometry. Mol. Cancer . 9 : 186 .
52 . Hornemann , T. , S. Richard , M. F. Rutti , Y. Wei , and A. von Eckardstein . 2006 . Cloning and initial characterization of a new subunit for mammalian serine-palmitoyltransferase. J. Biol. Chem. 281 : 37275 – 37281 .
53 . Kihara , A. , and Y. Igarashi . 2004 . FVT-1 is a mammalian 3-ketodihy-drosphingosine reductase with an active site that faces the cytosolic side of the endoplasmic reticulum membrane. J. Biol. Chem. 279 : 49243 – 49250 .
synthase) gene in human cancer cell lines: high level expression in melanomas and up-regulation in activated T lymphocytes. Glycoconj. J. 12 : 894 – 900 .
17 . Senkal , C. E. , S. Ponnusamy , M. J. Rossi , J. Bialewski , D. Sinha , J. C. Jiang , S. M. Jazwinski , Y. A. Hannun , and B. Ogretmen . 2007 . Role of human longevity assurance gene 1 and C18-ceramide in chemo-therapy-induced cell death in human head and neck squamous cell carcinomas. Mol. Cancer Ther. 6 : 712 – 722 .
18 . van Iersel , M. P. , T. Kelder , A. R. Pico , K. Hanspers , S. Coort , B. R. Conklin , and C. Evelo . 2008 . Presenting and exploring biological pathways with PathVisio. BMC Bioinformatics . 9 : 399 .
19 . Merrill , A. H. , Jr ., T. H. Stokes , A. Momin , H. Park , B. J. Portz , S. Kelly , E. Wang , M. C. Sullards , and M. D. Wang . 2009 . Sphingolipidomics: a valuable tool for understanding the roles of sphingolipids in biol-ogy and disease. J. Lipid Res. 50 ( Suppl ): S97 – S102 .
20 . Laviad , E. L. , L. Albee , I. Pankova-Kholmyansky , S. Epstein , H. Park , A. H. Merrill , Jr ., and A. H. Futerman . 2008 . Characterization of ceramide synthase 2: tissue distribution, substrate specifi city, and inhibition by sphingosine 1-phosphate. J. Biol. Chem. 283 : 5677 – 5684 .
21 . Mizutani , Y. , A. Kihara , and Y. Igarashi . 2005 . Mammalian Lass6 and its related family members regulate synthesis of specifi c cer-amides. Biochem. J. 390 : 263 – 271 .
22 . Mizutani , Y. , A. Kihara , and Y. Igarashi . 2006 . LASS3 (longevity as-surance homologue 3) is a mainly testis-specifi c (dihydro)ceramide synthase with relatively broad substrate specifi city. Biochem. J. 398 : 531 – 538 .
23 . Riebeling , C. , J. C. Allegood , E. Wang , A. H. Merrill , Jr ., and A. H. Futerman . 2003 . Two mammalian longevity assurance gene (LAG1) family members, trh1 and trh4, regulate dihydroceramide synthesis using different fatty acyl-CoA donors. J. Biol. Chem. 278 : 43452 – 43459 .
24 . Venkataraman , K. , C. Riebeling , J. Bodennec , H. Riezman , J. C. Allegood , M. C. Sullards , A. H. Merrill , Jr ., and A. H. Futerman . 2002 . Upstream of growth and differentiation factor 1 (uog1), a mammalian homolog of the yeast longevity assurance gene 1 (LAG1), regulates N-stearoyl-sphinganine (C18-(dihydro)cer-amide) synthesis in a fumonisin B1-independent manner in mam-malian cells. J. Biol. Chem. 277 : 35642 – 35649 .
25 . Omae , F. , M. Miyazaki , A. Enomoto , M. Suzuki , Y. Suzuki , and A. Suzuki . 2004 . DES2 protein is responsible for phytoceramide biosynthesis in the mouse small intestine. Biochem. J. 379 : 687 – 695 .
26 . Zheng , W. , J. Kollmeyer , H. Symolon , A. Momin , E. Munter , E. Wang , S. Kelly , J. C. Allegood , Y. Liu , Q. Peng , et al . 2006 . Ceramides and other bioactive sphingolipid backbones in health and disease: lipidomic analysis, metabolism and roles in membrane structure, dynamics, signaling and autophagy. Biochim. Biophys. Acta . 1758 : 1864 – 1884 .
27 . Pico , A. R. , T. Kelder , M. P. van Iersel , K. Hanspers , B. R. Conklin , and C. Evelo . 2008 . WikiPathways: pathway editing for the people. PLoS Biol. 6 : e184 .
28 . Barrett , T. , D. B. Troup , S. E. Wilhite , P. Ledoux , D. Rudnev , C. Evangelista , I. F. Kim , A. Soboleva , M. Tomashevsky , and R. Edgar . 2007 . NCBI GEO: mining tens of millions of expres-sion profi les--database and tools update. Nucleic Acids Res. 35 : D760 – D765 .
29 . Parkinson , H. , U. Sarkans , M. Shojatalab , N. Abeygunawardena , S. Contrino , R. Coulson , A. Farne , G. G. Lara , E. Holloway , M. Kapushesky , et al . 2005 . ArrayExpress--a public repository for mi-croarray gene expression data at the EBI. Nucleic Acids Res. 33 : D553 – D555 .
30 . Rhodes , D. R. , J. Yu , K. Shanker , N. Deshpande , R. Varambally , D. Ghosh , T. Barrette , A. Pandey , and A. M. Chinnaiyan . 2004 . ONCOMINE: a cancer microarray database and integrated data-mining platform. Neoplasia . 6 : 1 – 6 .
31 . Sean , D. , and P. S. Meltzer . 2007 . GEOquery: a bridge between the Gene Expression Omnibus (GEO) and BioConductor. Bioinformatics . 23 : 1846 – 1847 .
32 . Gentleman , R. C. , V. J. Carey , D. M. Bates , B. Bolstad , M. Dettling , S. Dudoit , B. Ellis , L. Gautier , Y. Ge , J. Gentry , et al . 2004 . Bioconductor: open software development for computational biol-ogy and bioinformatics. Genome Biol. 5 : R80 .
33 . Liu , G. , A. E. Loraine , R. Shigeta , M. Cline , J. Cheng , V. Valmeekam , S. Sun , D. Kulp , and M. A. Siani-Rose . 2003 . NetAffx: Affymetrix probesets and annotations. Nucleic Acids Res. 31 : 82 – 86 .
34 . Kent , W. J. 2002 . BLAT--the BLAST-like alignment tool. Genome Res. 12 : 656 – 664 .
by Alfred M
errill, on May 14, 2011
ww
w.jlr.org
Dow
nloaded from
.html http://www.jlr.org/content/suppl/2011/03/17/jlr.M010454.DC1Supplemental Material can be found at:
Tools for sphingolipidomics 1083
54 . Liu , H. , M. Sugiura , V. E. Nava , L. C. Edsall , K. Kono , S. Poulton , S. Milstien , T. Kohama , and S. Spiegel . 2000 . Molecular cloning and functional characterization of a novel mammalian sphingosine kinase type 2 isoform. J. Biol. Chem. 275 : 19513 – 19520 .
55 . Van Veldhoven , P. P. , S. Gijsbers , G. P. Mannaerts , J. R. Vermeesch , and V. Brys . 2000 . Human sphingosine-1-phosphate lyase: cDNA cloning, functional expression studies and mapping to chromo-some 10q22(1). Biochim. Biophys. Acta . 1487 : 128 – 134 .
56 . Mao , C. , R. Xu , Z. M. Szulc , J. Bielawski , K. P. Becker , A. Bielawska , S. H. Galadari , W. Hu , and L. M. Obeid . 2003 . Cloning and charac-terization of a mouse endoplasmic reticulum alkaline ceramidase: an enzyme that preferentially regulates metabolism of very long chain ceramides. J. Biol. Chem. 278 : 31184 – 31191 .
57 . Koch , J. , S. Gartner , C. M. Li , L. E. Quintern , K. Bernardo , O. Levran , D. Schnabel , R. J. Desnick , E. H. Schuchman , and K. Sandhoff . 1996 . Molecular cloning and characterization of a full-length complementary DNA encoding human acid ceramidase. Identifi cation of the fi rst molecular lesion causing Farber disease. J. Biol. Chem. 271 : 33110 – 33115 .
58 . El Bawab , S. , P. Roddy , T. Qian , A. Bielawska , J. J. Lemasters , and Y. A. Hannun . 2000 . Molecular cloning and characterization of a human mitochondrial ceramidase. J. Biol. Chem. 275 : 21508 – 21513 .
59 . Xu , R. , J. Jin , W. Hu , W. Sun , J. Bielawski , Z. Szulc , T. Taha , L. M. Obeid , and C. Mao . 2006 . Golgi alkaline ceramidase regulates cell proliferation and survival by controlling levels of sphingosine and S1P. FASEB J. 20 : 1813 – 1825 .
60 . Mao , C. , R. Xu , Z. M. Szulc , A. Bielawska , S. H. Galadari , and L. M. Obeid . 2001 . Cloning and characterization of a novel human alkaline ceramidase. A mammalian enzyme that hydrolyzes phyto-ceramide. J. Biol. Chem. 276 : 26577 – 26588 .
61 . Huitema , K. , J. van den Dikkenberg , J. F. Brouwers , and J. C. Holthuis . 2004 . Identifi cation of a family of animal sphingomyelin synthases. EMBO J. 23 : 33 – 44 .
62 . Ichikawa , S. , H. Sakiyama , G. Suzuki , K. I. Hidari , and Y. Hirabayashi . 1996 . Expression cloning of a cDNA for human ceramide glucosyl-transferase that catalyzes the fi rst glycosylation step of glycosphin-golipid synthesis. Proc. Natl. Acad. Sci. USA . 93 : 4638 – 4643 .
63 . Bosio , A. , E. Binczek , M. M. Le Beau , A. A. Fernald , and W. Stoffel . 1996 . The human gene CGT encoding the UDP-galactose cer-amide galactosyl transferase (cerebroside synthase): cloning, char-acterization, and assignment to human chromosome 4, band q26. Genomics . 34 : 69 – 75 .
64 . Lamour , N. F. , R. V. Stahelin , D. S. Wijesinghe , M. Maceyka , E. Wang , J. C. Allegood , A. H. Merrill , Jr ., W. Cho , and C. E. Chalfant . 2007 . Ceramide kinase uses ceramide provided by ceramide trans-port protein: localization to organelles of eicosanoid synthesis. J. Lipid Res. 48 : 1293 – 1304 .
65 . Sugiura , M. , K. Kono , H. Liu , T. Shimizugawa , H. Minekura , S. Spiegel , and T. Kohama . 2002 . Ceramide kinase, a novel lipid ki-nase. Molecular cloning and functional characterization. J. Biol. Chem. 277 : 23294 – 23300 .
66 . Hanada , K. , K. Kumagai , S. Yasuda , Y. Miura , M. Kawano , M. Fukasawa , and M. Nishijima . 2003 . Molecular machinery for non-vesicular traffi cking of ceramide. Nature . 426 : 803 – 809 .
67 . Schuchman , E. H. , M. Suchi , T. Takahashi , K. Sandhoff , and R. J. Desnick . 1991 . Human acid sphingomyelinase. Isolation, nu-cleotide sequence and expression of the full-length and alterna-tively spliced cDNAs. J. Biol. Chem. 266 : 8531 – 8539 .
68 . Hofmann , K. , S. Tomiuk , G. Wolff , and W. Stoffel . 2000 . Cloning and characterization of the mammalian brain-specifi c, Mg2+-dependent neutral sphingomyelinase. Proc. Natl. Acad. Sci. USA . 97 : 5895 – 5900 .
69 . Takizawa , M. , T. Nomura , E. Wakisaka , N. Yoshizuka , J. Aoki , H. Arai , K. Inoue , M. Hattori , and N. Matsuo . 1999 . cDNA cloning and
expression of human lactosylceramide synthase. Biochim. Biophys. Acta . 1438 : 301 – 304 .
70 . Ogawa , D. , K. Shikata , K. Honke , S. Sato , M. Matsuda , R. Nagase , A. Tone , S. Okada , H. Usui , J. Wada , et al . 2004 . Cerebroside sulfo-transferase defi ciency ameliorates L-selectin-dependent monocyte infi ltration in the kidney after ureteral obstruction. J. Biol. Chem. 279 : 2085 – 2090 .
71 . Jakobsson , A. , R. Westerberg , and A. Jacobsson . 2006 . Fatty acid elongases in mammals: their regulation and roles in metabolism. Prog. Lipid Res. 45 : 237 – 249 .
72 . Miyazaki , M. , and J. M. Ntambi . 2003 . Role of stearoyl-coenzyme A desaturase in lipid metabolism. Prostaglandins Leukot. Essent. Fatty Acids . 68 : 113 – 121 .
73 . Han , G. , S. D. Gupta , K. Gable , S. Niranjanakumari , P. Moitra , F. Eichler , R. H. Brown , Jr ., J. M. Harmon , and T. M. Dunn . 2009 . Identifi cation of small subunits of mammalian serine palmitoyl-transferase that confer distinct acyl-CoA substrate specifi cities. Proc. Natl. Acad. Sci. USA . 106: 8186–8191.
74 . Han , S. , M. A. Lone , R. Schneiter , and A. Chang . 2010. Orm1 and Orm2 are conserved endoplasmic reticulum membrane proteins regulating lipid homeostasis and protein quality control. Proc. Natl. Acad. Sci. USA . 107 : 5851 – 5856 .
75 . Breslow , D. K. , S. R. Collins , B. Bodenmiller , R. Aebersold , K. Simons , A. Shevchenko , C. S. Ejsing , and J. S. Weissman . 2010. Orm family proteins mediate sphingolipid homeostasis. Nature . 463 : 1048 – 1053 .
76 . Bredel , M. , C. Bredel , D. Juric , G. E. Duran , R. X. Yu , G. R. Harsh , H. Vogel , L. D. Recht , A. C. Scheck , and B. I. Sikic . 2006 . Tumor necrosis factor-alpha-induced protein 3 as a putative regulator of nuclear factor-kappaB-mediated resistance to O6-alkylating agents in human glioblastomas. J. Clin. Oncol. 24 : 274 – 287 .
77 . Vukelic , Z. , S. Kalanj-Bognar , M. Froesch , L. Bindila , B. Radic , M. Allen , J. Peter-Katalinic , and A. D. Zamfi r . 2007 . Human gliosarco-ma-associated ganglioside composition is complex and distinctive as evidenced by high-performance mass spectrometric determina-tion and structural characterization. Glycobiology . 17 : 504 – 515 .
78 . Sung , C. C. , D. K. Pearl , S. W. Coons , B. W. Scheithauer , P. C. Johnson , and A. J. Yates . 1994 . Gangliosides as diagnostic mark-ers of human astrocytomas and primitive neuroectodermal tumors. Cancer . 74 : 3010 – 3022 .
79 . Hendrix , N. D. , R. Wu , R. Kuick , D. R. Schwartz , E. R. Fearon , and K. R. Cho . 2006 . Fibroblast growth factor 9 has oncogenic activity and is a downstream target of Wnt signaling in ovarian endometri-oid adenocarcinomas. Cancer Res. 66 : 1354 – 1362 .
80 . Kiguchi , K. , K. Takamatsu , J. Tanaka , S. Nozawa , M. Iwamori , and Y. Nagai . 1992 . Glycosphingolipids of various human ovarian tumors: a signifi cantly high expression of I3SO3GalCer and Lewis antigen in mucinous cystadenocarcinoma. Cancer Res. 52 : 416 – 421 .
81 . Schrump , D. S. , K. Furukawa , H. Yamaguchi , K. O. Lloyd , and L. J. Old . 1988 . Recognition of galactosylgloboside by monoclonal anti-bodies derived from patients with primary lung cancer. Proc. Natl. Acad. Sci. USA . 85 : 4441 – 4445 .
82 . Riker , A. I. , S. A. Enkemann , O. Fodstad , S. Liu , S. Ren , C. Morris , Y. Xi , P. Howell , B. Metge , R. S. Samant , et al . 2008 . The gene expression profi les of primary and metastatic melanoma yields a transition point of tumor progression and metastasis. BMC Med. Genomics . 1 : 13 .
83 . Ravindranath , M. H. , S. Muthugounder , and N. Presser . 2008 . Ganglioside signatures of primary and nodal metastatic melanoma cell lines from the same patient. Melanoma Res. 18 : 47 – 55 .
84 . Haynes , C. A. , J. C. Allegood , K. Sims , E. W. Wang , M. C. Sullards , and A. H. Merrill , Jr . 2008 . Quantitation of fatty acyl-coenzyme As in mammalian cells by liquid chromatography-electrospray ioniza-tion tandem mass spectrometry. J. Lipid Res. 49 : 1113 – 1125 .
by Alfred M
errill, on May 14, 2011
ww
w.jlr.org
Dow
nloaded from
.html http://www.jlr.org/content/suppl/2011/03/17/jlr.M010454.DC1Supplemental Material can be found at: