a method for tensile tests of biological tissues at the ... method for tensile tests of biological...
TRANSCRIPT
A method for tensile tests of biological tissues at the mesoscaleThierry Savin, Amy E. Shyer, and L. Mahadevan Citation: J. Appl. Phys. 111, 074704 (2012); doi: 10.1063/1.3699176 View online: http://dx.doi.org/10.1063/1.3699176 View Table of Contents: http://jap.aip.org/resource/1/JAPIAU/v111/i7 Published by the American Institute of Physics. Related ArticlesSuppression of scar formation in a murine burn wound model by the application of non-thermal plasma Appl. Phys. Lett. 99, 203701 (2011) Longitudinal variations in the Poisson’s ratio of collagen fibrils Appl. Phys. Lett. 98, 163707 (2011) In vivo nanomechanical imaging of blood-vessel tissues directly in living mammals using atomic force microscopy Appl. Phys. Lett. 95, 013704 (2009) Detection and discrimination of optical absorption and shear stiffness at depth in tissue-mimicking phantoms bytransient optoelastography Appl. Phys. Lett. 94, 154103 (2009) Effects of hydration on the mechanical response of individual collagen fibrils Appl. Phys. Lett. 92, 233902 (2008) Additional information on J. Appl. Phys.Journal Homepage: http://jap.aip.org/ Journal Information: http://jap.aip.org/about/about_the_journal Top downloads: http://jap.aip.org/features/most_downloaded Information for Authors: http://jap.aip.org/authors
Downloaded 28 Apr 2012 to 18.7.29.240. Redistribution subject to AIP license or copyright; see http://jap.aip.org/about/rights_and_permissions

A method for tensile tests of biological tissues at the mesoscale
Thierry Savin,1,a) Amy E. Shyer,2 and L. Mahadevan1,3,b)
1School of Engineering and Applied Sciences, Harvard University, Cambridge, Massachusetts 02138, USA2Department of Genetics, Harvard Medical School, Boston, Massachusetts 02115, USA3Department of Physics, Harvard University, Cambridge, Massachusetts 02138, USA
(Received 23 November 2011; accepted 2 March 2012; published online 13 April 2012)
We describe a new technique for determining the tensile properties of biological tissues at the
mesoscale. The procedure uses a calibrated magnetic interaction between a steel bead attached to
the sample and a permanent magnet to apply a uniaxial tensile force, along with a simple video
assay to monitor the sample extension and thus the strain. Our method fills a significant gap in
the accessible range of both forces and strains and is useful for forces in the micro and milli-
Newton range, and displacements in the range of hundreds of microns with strains of up to 200%.
We give two examples of the mechanical characterization of tissues using our technique,
employing it to characterize the elastic modulus of tubular and membraneous embryonic tissues
from the chick. VC 2012 American Institute of Physics. [http://dx.doi.org/10.1063/1.3699176]
I. INTRODUCTION
Tensile testing is an important method for the mechanical
characterization of soft and hard matter.1 Depending on the
sample size and the magnitude of the response, different tech-
niques are employed to measure the load-deformation
response. For example, optical traps are used to stretch single
molecules and cells,2 with forces in the 10�12-10�10 N range
applied in order to measure displacements . 10�6 m. On a
larger scale, flexible rods (e.g., glass optical fibers) are used to
measure the properties of early stage embryonic tissues,3,4
with forces between 10�9 and 10�6 N and displacements
. 10�4 m. The gauging of forces >10�2 N on �10�2 m tis-
sues5 can now be performed using commercial solutions,
although most aspects continue to be designed in-house to suit
particular biological sample handling requirements, such as
the fixation to the force apparatus. Here we present a simple
and inexpensive technique for applying known forces in the
10�6 to 10�3 N range on . 10�2 m biological samples by
using the attractive force between a permanent magnet and a
millimetric steel sphere that is glued to the probed tissue. A
typical setup using our force apparatus is shown in Fig. 1.
II. METHODS
We used high precision steel spheres (New England
Miniature Ball Corp., Norfolk, CT) of 3 different radii—
rb¼ 0.122, 0.253, and 0.398 mm (60.01 mm, as measured
on micrographs)—made of AISI 440 C martensitic ferro-
magnetic stainless steel (density qb¼ 7650 kg/m3). The per-
manent magnet is a commercial grade neodymium (Nd-Fe-
B) axially magnetized disk (nickel plated, diameter
2 a¼ 7.5 mm and height t¼ 2.8 mm; The Magnet Source,
Castle Rock, CO).
The interaction between the magnet and the bead was
calibrated by immersing the steel ball in pure glycerol (den-
sity qf¼ 1261 kg/m3, viscosity gf¼ 0.690 Pa s at 29 �C) at
the tip of a conical support; the magnet was then brought
above the bead (cylindrical edges facing the bead, flat edges
oriented vertically), and the motion of the bead was simulta-
neously video-recorded at 250 frames per second (fps) using
a digital camera (PL-B781, PixeLINK, Ottawa, ON)
equipped with an objective that magnified to 45 lm/px1 (see
movie S1 in the supplementary material).6 All materials used
to manipulate the bead and the magnet had no magnetic sus-
ceptibility. Movies were processed off-line using the IDL
language (ITT Visual Information Solutions, Boulder, CO)
in order to extract the position of the bead and of the magnet.
We used a particle tracking package7 to extract the bead tra-
jectory, and the magnet was tracked using image registration
of a reference sub-array in each frame: the reference image
was manually clipped from the initial frame to contain the
intensity pattern of the feature to be tracked, and was then
aligned in the remaining frames onto the mobile matching
pattern by maximizing intensity correlation.8 These trajec-
tory extraction methods offer a resolution that we estimated
as being about 1/2 pixel, that is, �20 lm.
The equation describing the motion of a sphere in a vis-
cous fluid is9
4
3pr3
b qb þqf
2
� �_vðtÞ ¼ F� 6pgf rbvðtÞ � 4
3pr3
bðqb � qf Þg
� 6r2bðpgf qf Þ1=2
ðt
0
_vðsÞds
ðt� sÞ1=2;
(1)
in which the rate of change of the momentum of the sphere
(left-hand side) is balanced by, in order of appearance on the
right-hand side, the magnetic force F (to be determined), the
drag force, the weight, and the Boussinesq-Basset force.
Here, v(t) and _v(t) are, respectively, the velocity and the
acceleration of the bead at time t, and g¼ 9.81 m/s2 is grav-
ity. In the regime of operation, we find that the Reynolds
number qf rbv=gf < 10�1 at all times, so that the unsteady
effects due to the Boussinesq-Basset force are negligible.
a)Currently at the Department of Materials, ETH Zurich, Switzerland.b)Author to whom correspondence should be addressed. Electronic mail:
0021-8979/2012/111(7)/074704/6/$30.00 VC 2012 American Institute of Physics111, 074704-1
JOURNAL OF APPLIED PHYSICS 111, 074704 (2012)
Downloaded 28 Apr 2012 to 18.7.29.240. Redistribution subject to AIP license or copyright; see http://jap.aip.org/about/rights_and_permissions
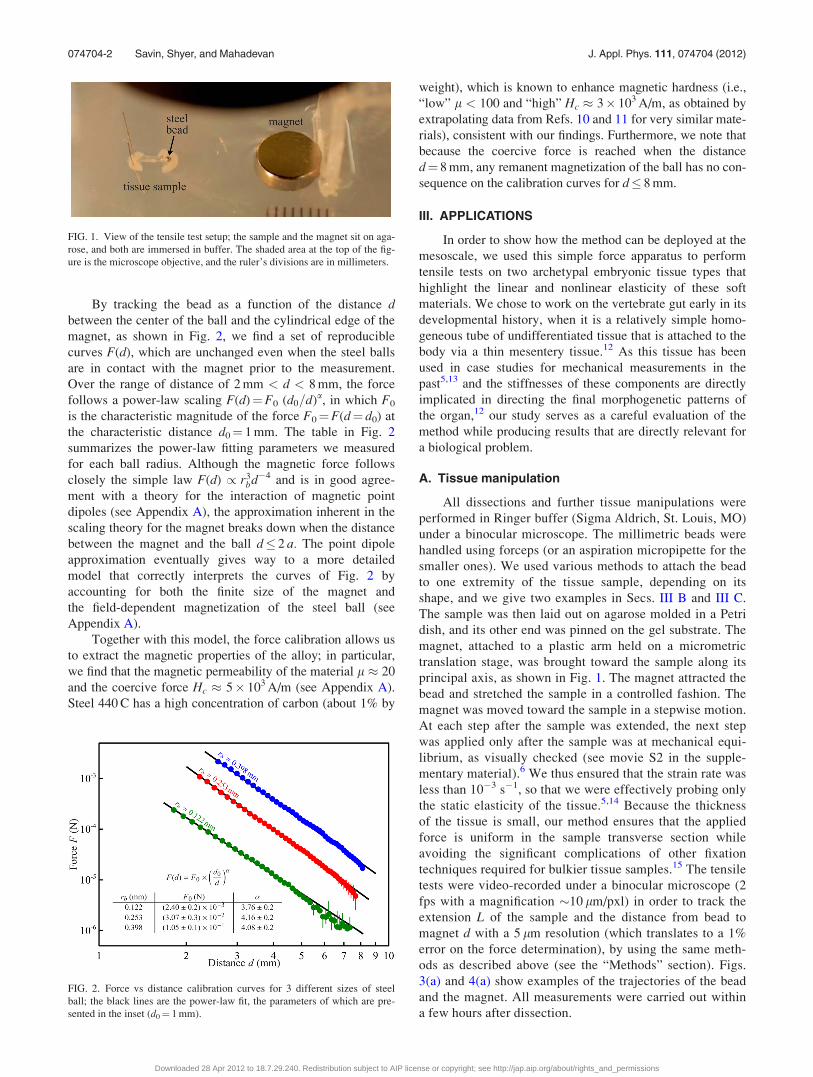
By tracking the bead as a function of the distance dbetween the center of the ball and the cylindrical edge of the
magnet, as shown in Fig. 2, we find a set of reproducible
curves F(d), which are unchanged even when the steel balls
are in contact with the magnet prior to the measurement.
Over the range of distance of 2 mm < d < 8 mm, the force
follows a power-law scaling F(d)¼F0 (d0=d)a, in which F0
is the characteristic magnitude of the force F0¼F(d¼ d0) at
the characteristic distance d0¼ 1 mm. The table in Fig. 2
summarizes the power-law fitting parameters we measured
for each ball radius. Although the magnetic force follows
closely the simple law F(d) / r3bd�4 and is in good agree-
ment with a theory for the interaction of magnetic point
dipoles (see Appendix A), the approximation inherent in the
scaling theory for the magnet breaks down when the distance
between the magnet and the ball d� 2 a. The point dipole
approximation eventually gives way to a more detailed
model that correctly interprets the curves of Fig. 2 by
accounting for both the finite size of the magnet and
the field-dependent magnetization of the steel ball (see
Appendix A).
Together with this model, the force calibration allows us
to extract the magnetic properties of the alloy; in particular,
we find that the magnetic permeability of the material l � 20
and the coercive force Hc � 5� 103 A/m (see Appendix A).
Steel 440 C has a high concentration of carbon (about 1% by
weight), which is known to enhance magnetic hardness (i.e.,
“low” l < 100 and “high” Hc � 3� 103 A/m, as obtained by
extrapolating data from Refs. 10 and 11 for very similar mate-
rials), consistent with our findings. Furthermore, we note that
because the coercive force is reached when the distance
d¼ 8 mm, any remanent magnetization of the ball has no con-
sequence on the calibration curves for d� 8 mm.
III. APPLICATIONS
In order to show how the method can be deployed at the
mesoscale, we used this simple force apparatus to perform
tensile tests on two archetypal embryonic tissue types that
highlight the linear and nonlinear elasticity of these soft
materials. We chose to work on the vertebrate gut early in its
developmental history, when it is a relatively simple homo-
geneous tube of undifferentiated tissue that is attached to the
body via a thin mesentery tissue.12 As this tissue has been
used in case studies for mechanical measurements in the
past5,13 and the stiffnesses of these components are directly
implicated in directing the final morphogenetic patterns of
the organ,12 our study serves as a careful evaluation of the
method while producing results that are directly relevant for
a biological problem.
A. Tissue manipulation
All dissections and further tissue manipulations were
performed in Ringer buffer (Sigma Aldrich, St. Louis, MO)
under a binocular microscope. The millimetric beads were
handled using forceps (or an aspiration micropipette for the
smaller ones). We used various methods to attach the bead
to one extremity of the tissue sample, depending on its
shape, and we give two examples in Secs. III B and III C.
The sample was then laid out on agarose molded in a Petri
dish, and its other end was pinned on the gel substrate. The
magnet, attached to a plastic arm held on a micrometric
translation stage, was brought toward the sample along its
principal axis, as shown in Fig. 1. The magnet attracted the
bead and stretched the sample in a controlled fashion. The
magnet was moved toward the sample in a stepwise motion.
At each step after the sample was extended, the next step
was applied only after the sample was at mechanical equi-
librium, as visually checked (see movie S2 in the supple-
mentary material).6 We thus ensured that the strain rate was
less than 10�3 s�1, so that we were effectively probing only
the static elasticity of the tissue.5,14 Because the thickness
of the tissue is small, our method ensures that the applied
force is uniform in the sample transverse section while
avoiding the significant complications of other fixation
techniques required for bulkier tissue samples.15 The tensile
tests were video-recorded under a binocular microscope (2
fps with a magnification �10 lm/pxl) in order to track the
extension L of the sample and the distance from bead to
magnet d with a 5 lm resolution (which translates to a 1%
error on the force determination), by using the same meth-
ods as described above (see the “Methods” section). Figs.
3(a) and 4(a) show examples of the trajectories of the bead
and the magnet. All measurements were carried out within
a few hours after dissection.
FIG. 1. View of the tensile test setup; the sample and the magnet sit on aga-
rose, and both are immersed in buffer. The shaded area at the top of the fig-
ure is the microscope objective, and the ruler’s divisions are in millimeters.
FIG. 2. Force vs distance calibration curves for 3 different sizes of steel
ball; the black lines are the power-law fit, the parameters of which are pre-
sented in the inset (d0¼ 1 mm).
074704-2 Savin, Shyer, and Mahadevan J. Appl. Phys. 111, 074704 (2012)
Downloaded 28 Apr 2012 to 18.7.29.240. Redistribution subject to AIP license or copyright; see http://jap.aip.org/about/rights_and_permissions
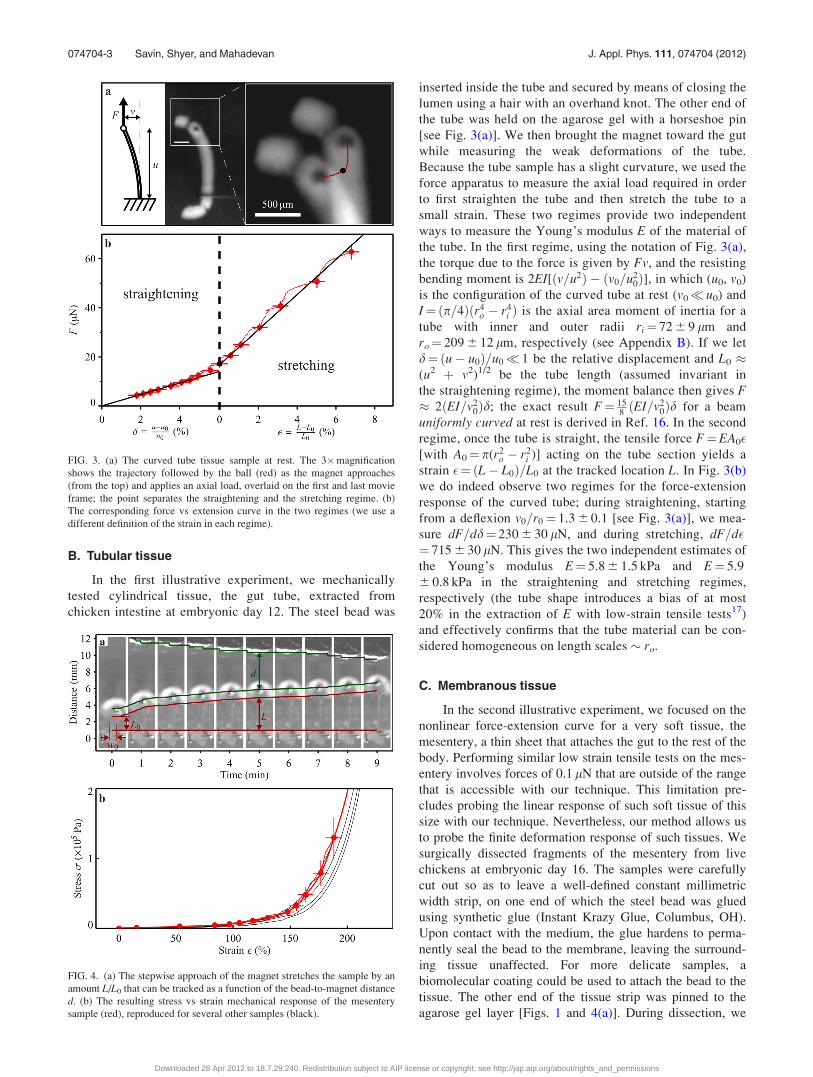
B. Tubular tissue
In the first illustrative experiment, we mechanically
tested cylindrical tissue, the gut tube, extracted from
chicken intestine at embryonic day 12. The steel bead was
inserted inside the tube and secured by means of closing the
lumen using a hair with an overhand knot. The other end of
the tube was held on the agarose gel with a horseshoe pin
[see Fig. 3(a)]. We then brought the magnet toward the gut
while measuring the weak deformations of the tube.
Because the tube sample has a slight curvature, we used the
force apparatus to measure the axial load required in order
to first straighten the tube and then stretch the tube to a
small strain. These two regimes provide two independent
ways to measure the Young’s modulus E of the material of
the tube. In the first regime, using the notation of Fig. 3(a),
the torque due to the force is given by Fv, and the resisting
bending moment is 2EI[ðv=u2Þ � ðv0=u20Þ], in which (u0, v0)
is the configuration of the curved tube at rest (v0� u0) and
I¼ðp=4Þðr4o � r4
i Þ is the axial area moment of inertia for a
tube with inner and outer radii ri¼ 72 6 9 lm and
ro¼ 209 6 12 lm, respectively (see Appendix B). If we let
d¼ðu� u0Þ=u0� 1 be the relative displacement and L0 �(u2 þ v2)1/2 be the tube length (assumed invariant in
the straightening regime), the moment balance then gives F� 2ðEI=v2
0Þd; the exact result F¼ 158ðEI=v2
0Þd for a beam
uniformly curved at rest is derived in Ref. 16. In the second
regime, once the tube is straight, the tensile force F¼EA0�[with A0¼p(r2
o � r2i )] acting on the tube section yields a
strain �¼ðL� L0Þ=L0 at the tracked location L. In Fig. 3(b)
we do indeed observe two regimes for the force-extension
response of the curved tube; during straightening, starting
from a deflexion v0=r0¼ 1.3 6 0.1 [see Fig. 3(a)], we mea-
sure dF=dd¼ 230 6 30 lN, and during stretching, dF=d�¼ 715 6 30 lN. This gives the two independent estimates of
the Young’s modulus E¼ 5.8 6 1.5 kPa and E¼ 5.9
6 0.8 kPa in the straightening and stretching regimes,
respectively (the tube shape introduces a bias of at most
20% in the extraction of E with low-strain tensile tests17)
and effectively confirms that the tube material can be con-
sidered homogeneous on length scales � ro.
C. Membranous tissue
In the second illustrative experiment, we focused on the
nonlinear force-extension curve for a very soft tissue, the
mesentery, a thin sheet that attaches the gut to the rest of the
body. Performing similar low strain tensile tests on the mes-
entery involves forces of 0.1 lN that are outside of the range
that is accessible with our technique. This limitation pre-
cludes probing the linear response of such soft tissue of this
size with our technique. Nevertheless, our method allows us
to probe the finite deformation response of such tissues. We
surgically dissected fragments of the mesentery from live
chickens at embryonic day 16. The samples were carefully
cut out so as to leave a well-defined constant millimetric
width strip, on one end of which the steel bead was glued
using synthetic glue (Instant Krazy Glue, Columbus, OH).
Upon contact with the medium, the glue hardens to perma-
nently seal the bead to the membrane, leaving the surround-
ing tissue unaffected. For more delicate samples, a
biomolecular coating could be used to attach the bead to the
tissue. The other end of the tissue strip was pinned to the
agarose gel layer [Figs. 1 and 4(a)]. During dissection, we
FIG. 3. (a) The curved tube tissue sample at rest. The 3�magnification
shows the trajectory followed by the ball (red) as the magnet approaches
(from the top) and applies an axial load, overlaid on the first and last movie
frame; the point separates the straightening and the stretching regime. (b)
The corresponding force vs extension curve in the two regimes (we use a
different definition of the strain in each regime).
FIG. 4. (a) The stepwise approach of the magnet stretches the sample by an
amount L/L0 that can be tracked as a function of the bead-to-magnet distance
d. (b) The resulting stress vs strain mechanical response of the mesentery
sample (red), reproduced for several other samples (black).
074704-3 Savin, Shyer, and Mahadevan J. Appl. Phys. 111, 074704 (2012)
Downloaded 28 Apr 2012 to 18.7.29.240. Redistribution subject to AIP license or copyright; see http://jap.aip.org/about/rights_and_permissions
usually kept sections of the tube or of the superior mesenteric
artery, as they provided convenient handles with which to
manipulate or pin the fragments and to glue the bead (see
Figs. 1 and 4(a), in which sections of the tube are clearly
visible). For large deformation assays, the sample was first
preconditioned by stretching it once to an extension ratio
greater than 1, after which the magnet was removed so as to
let the sample relax to its rest length L0 (movie S2),6 at
which stage we visually extracted the rest width w0 of the
mesentery strip. This pre-conditioning stage, shown in the
first 10 min of movie S2,6 is commonly employed to produce
reliable large deformation mechanical measurements that are
relatively independent of previous manipulations.5,14,18 The
magnet was then moved back toward the sample in a step-
wise motion. Using the cross-section area of the sample at
rest A0¼w0h0, with h0¼ 12.7 6 2.8 lm being the thickness
of the unstretched mesentery (see Appendix B), allows us to
plot the nominal stress r¼FðdÞ=A0, calculated from the
known force, against the nominal strain �¼ðL� L0Þ=L0 in
order to quantify the mechanical response of the material
for � . �p¼ 218% 6 15%, the physiological strain (see
Appendix B and Ref. 12). More sophisticated methods for
extracting the local strain field could be used in that case (for
example, tracking small features in the sample strip). How-
ever, we infer that the nominal strain is sufficient for evaluat-
ing the non-linear mechanical response of the mesentery
material at the large strain found in physiological conditions.
Several stress-strain response curves, corresponding to sam-
ples of mesentery extracted from different day 16 chicken
embryos, are shown in Fig. 4(b) and verify that our method
returns reproducible results, with same-sample variations
that are below the sample-to-sample variations, measured at
about 50% [Fig. 4(b)]. Notably, we observe the typical
strain-stiffening around � � �p of biological soft tissues.18
IV. CONCLUSION
These two tests serve to show that our method will be of
practical value for a wide variety of mechanical tests on vari-
ous types of tissue. Possible extensions of the method
include the use of an oscillatory force (e.g., with an electro-
magnet), although in that case the dynamic response of the
bead in the fluid would need to be carefully scrutinized as
well.
APPENDIX A: MODEL OF THE INTERACTIONBETWEEN THE BEAD AND THE MAGNET
The magnetic field strength H0(r) generated at a position
r from the center of an axially magnetized disk magnet with
a radius a and height t can be computed exactly. In the (r,z)
cylindrical coordinates basis, in which z is on the cylinder’s
axis and z¼ 0 at its center, and where M0¼ (0, M0) is its uni-
form magnetization, H0(r)¼ðH0
r ;H0z Þ is given by19
H0r=z ¼
M0
2fr=z r; z� t
2
� �� fr=z r; zþ t
2
� �h i(A1)
with
frðr; zÞ ¼ð1
0
J1ðuaÞJ1ðurÞe�uzadu; (A2a)
fzðr; zÞ ¼ð1
0
J1ðuaÞJ0ðurÞe�uzadu (A2b)
for r external to the magnet. Here Jn is the nth-order Bessel
function of the first kind. One can express the functions
fr/z(r,z) in term of the complete elliptic integrals of the first,
second, and third kind, K(k), E(k), and PðpjkÞ; respectively,
defined as
KðkÞ ¼ðp=2
0
ð1� k2sin2hÞ�1=2dh; (A3a)
EðkÞ ¼ðp=2
0
ð1� k2sin2hÞ1=2dh; (A3b)
PðpjkÞ ¼ðp=2
0
ð1� psin2hÞ�1ð1� k2sin2hÞ�1=2dh: (A3c)
Calling the elliptic modulus k2 ¼ 4ar=½ðaþ rÞ2 þ z2 and the
elliptic characteristic p ¼ 4ar=ðaþ rÞ2, we get20
frðr; zÞ ¼2a
kpffiffiffiffiffiarp 1� 1
2k2
� �KðkÞ � EðkÞ
� �(A4)
and
fzðr; zÞ ¼kz
2pffiffiffiffiffiarp r � a
r þ a
� �PðpjkÞ � KðkÞ
� �
þ1 if r < a;
0 if r a:
(A5)
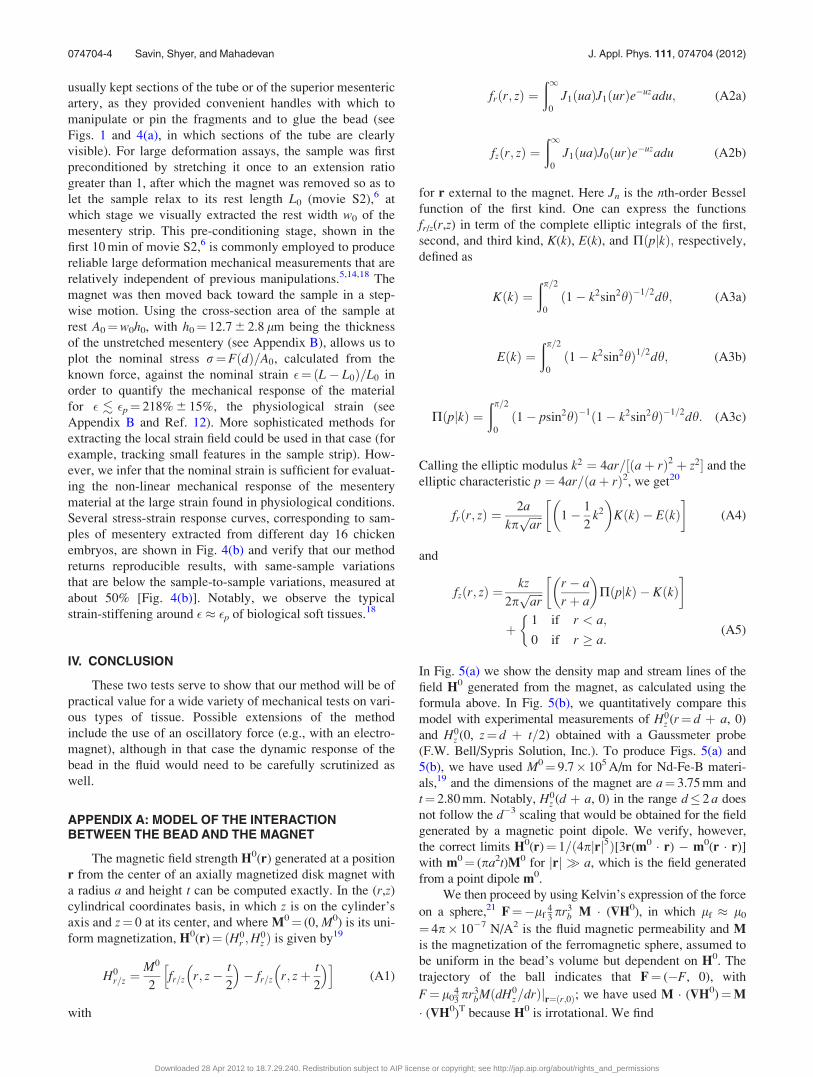
In Fig. 5(a) we show the density map and stream lines of the
field H0 generated from the magnet, as calculated using the
formula above. In Fig. 5(b), we quantitatively compare this
model with experimental measurements of H0z (r¼ d þ a, 0)
and H0z (0, z¼ d þ t=2) obtained with a Gaussmeter probe
(F.W. Bell/Sypris Solution, Inc.). To produce Figs. 5(a) and
5(b), we have used M0¼ 9.7� 105 A/m for Nd-Fe-B materi-
als,19 and the dimensions of the magnet are a¼ 3.75 mm and
t¼ 2.80 mm. Notably, H0z (d þ a, 0) in the range d� 2 a does
not follow the d�3 scaling that would be obtained for the field
generated by a magnetic point dipole. We verify, however,
the correct limits H0(r)¼ 1=ð4pjrj5Þ[3r(m0 � r) � m0(r � r)]
with m0¼ (pa2t)M0 for jrj � a, which is the field generated
from a point dipole m0.
We then proceed by using Kelvin’s expression of the force
on a sphere,21 F¼�lf43pr3
b M � ($H0), in which lf � l0
¼ 4p� 10�7 N/A2 is the fluid magnetic permeability and M
is the magnetization of the ferromagnetic sphere, assumed to
be uniform in the bead’s volume but dependent on H0. The
trajectory of the ball indicates that F¼ (�F, 0), with
F¼ l043pr3
bMðdH0z=drÞjr¼ðr;0Þ; we have used M � ($H0)¼M
� ($H0)T because H0 is irrotational. We find
074704-4 Savin, Shyer, and Mahadevan J. Appl. Phys. 111, 074704 (2012)
Downloaded 28 Apr 2012 to 18.7.29.240. Redistribution subject to AIP license or copyright; see http://jap.aip.org/about/rights_and_permissions

dH0z
dr
r¼ðr;0Þ
¼ dH0r
dz
r¼ðr;0Þ
¼ M0
2
kt
2prffiffiffiffiffiarp
� 2� k2
2� 2k2
� �EðkÞ � KðkÞ
� �; (A6)
with k2¼ 4ar=½ðaþ rÞ2 þ ðt=2Þ2. If one assumes that the
magnetization of the ball is saturated at all positions relative
to the magnet, one finds F(d)� l0ðmm0=d4Þ from Kelvin’s
formula in the limit d¼ jrj � a� a (point dipole limit), with
m0¼ pa2tM0 and m¼ 43pr3
bM. As stated in the main text, this
approximation is not valid here, even if the measured scaling
for F(d) appears to agree.
From the force calibration curve F (Fig. 2) and the
known field H0z at z¼ 0 [Fig. 5(b)], we can calculate M as a
function of H0 using Kelvin’s formula. We present our result
in Fig. 5(c) in the more standard “B versus H” form; the in-
ternal fields are H¼H0z � 1
3M and B¼l0(H þ M), as calcu-
lated for a permeable sphere.19 The ball size r3b-dependence
of the force is outlined in the main text; thus the (H, B) data
obtained for the three different beads all fall on the same
curve that characterizes the magnetic response of their AISI
440 C stainless steel material. From this curve we can evalu-
ate the maximum magnetic permeability l¼max(B=l0H)
� 20, the coercive force Hc � 5� 103 A/m such that
B(Hc)¼ 0, and the remanent flux Br � 0.5 T by extrapolation.
These magnetic properties are in close agreement with tabu-
lated data for similar ferromagnetic steel alloys,10,11 as
explained in the main text.
APPENDIX B: CROSS SECTION MEASUREMENTS
Small intestines were collected from chicken embryos at
day 16 and were fixed in 4% paraformaldehyde in phosphate-
buffered saline, dehydrated in a graded ethanol series, cleared
in xylenes, and embedded in paraffin. This allowed transverse
sections 10 lm in thickness to be created and collected on
glass slides. Fast Green staining was performed using stand-
ard protocols;22 briefly, slides were dewaxed in xylenes,
rinsed in successive washes with 100% and 95% ethanol, and
rehydrated in tap water. Slides were then stained with Fast
Green (Sigma Aldrich, St. Louis, MO) for 30 min, rinsed in
tap water, dehydrated, cleared in xylenes, and mounted with
DPX (Fluka-Sigma Aldrich, St. Louis, MO). A micrograph
showing one of these sections is presented in Fig. 6(a). Such
micrographs were used to measure the mesentery thickness
h¼ 7.1 6 1.4 lm under physiological conditions, in which
the mesentery is under tension. The physiological strain �p of
the mesentery is found by measuring the deformed and rest
lengths of strips Lp and L0, respectively, before and after sur-
gical isolation from the intestine. We find
�p¼ðLp � L0Þ=L0¼ 218% 6 15%, a typically large value for
this organ that is also encountered in other species.5,13
Assuming material incompressibility, we find the rest thick-
ness of the mesentery h0¼ (1 þ �p)1/2h ¼ 12.7 6 2.8 lm. We
use this value in the main text to calculate the cross-section
rest area of the sample of mesentery tissue.
DAPI (Molecular Probes, Invitrogen, Carlsbad, CA) was
used as a nuclear stain on sections of the tube obtained in a
similar way for embryos at day 12, in order to determine the
size of the inner and outer radii (ri and ro, respectively) of
the gut tube from the fluorescent micrographs shown in
Fig. 6(b). We found ri¼ 72 6 9 lm and ro¼ 209 6 12 lm af-
ter averaging over 10 sections extracted from different loca-
tions along the tube.
1D. S. Gianola and C. Eberl, JOM 61, 24 (2009).2M. Dao, C. T. Lim, and S. Suresh, J. Mech. Phys. Solids 51, 2259 (2003).3C. Wiebe and G. W. Brodland, J. Biomech. 38, 2087 (2005).4L. A. Davidson and R. Keller, in Cell Mechanics, Methods in CellBiology, Vol. 83 (Elsevier, 2007), pp. 425–439.
5Y. C. Fung, Am. J. Physiol. 213, 1532 (1967). Available at http://ajplegacy.
physiology.org/content/213/6/1532.6See supplementary material at http://dx.doi.org/10.1063/1.3699176 for
movies S1 and S2 and their legends.
FIG. 5. (a) Map and streamlines of the magnetic field H0 generated by the
magnet. (b) Measurements of the axial field H0z at r¼ 0 and at z¼ 0. (c)
Magnetization curve of the steel 440 C, inferred from the force curves.
FIG. 6. (a) Cross section of the mesentery at embryonic day 16. The gut
tube can be seen at the top of the image. (b) Cross section of the gut tube at
embryonic day 12. The connection to the mesentery is visible at the “6
o’clock” orientation.
074704-5 Savin, Shyer, and Mahadevan J. Appl. Phys. 111, 074704 (2012)
Downloaded 28 Apr 2012 to 18.7.29.240. Redistribution subject to AIP license or copyright; see http://jap.aip.org/about/rights_and_permissions
7J. C. Crocker and D. G. Grier, J. Colloid Interface Sci. 179, 298 (1996).8H. Xie, N. Hicks, G. R. Keller, H. Huang, and V. Kreinovich, Comput.
Geosci. 29, 1045 (2003).9L. D. Landau and E. M. Lifshitz, Fluid Mechanics, 2nd ed. (Pergamon,
Oxford, England, 1987).10R. M. Bozorth, Ferromagnetism (Van Nostrand, New York, 1951).11P. Oxley, J. Goodell, and R. Molt, J. Magn. Magn. Mater. 321, 2107
(2009).12T. Savin, N. A. Kurpios, A. E. Shyer, P. Florescu, H. Liang, L. Mahade-
van, and C. J. Tabin, Nature 476, 57 (2011).13J. Hildebrandt, H. Fukaya, and C. J. Martin, J. Appl. Physiol. 27, 758
(1969). Available at http://jap.physiology.org/content/27/5/758.14R. M. Kenedi, T. Gibson, J. H. Evans, and J. C. Barbenel, Phys. Med.
Biol. 20, 699 (1975).
15J. Lepetit, R. Favier, A. Grajales, and P. O. Skjervold, J. Biomech. 37, 557
(2004).16C. Gonzalez and J. LLorca, Int. J. Solids Struct. 42, 1537 (2005).17R. Mahmoodian and K. Van Vliet, private communication (June 2011).18Y. C. Fung, Biomechanics: Mechanical Properties of Living Tissues, 2nd
ed. (Springer-Verlag, New York, 1993).19D. J. Craik, Magnetism: Principles and Applications (Wiley, New York,
1995).20G. Eason, B. Noble, and I. N. Sneddon, Philos. Trans. R. Soc. London
247, 529 (1955).21A. Engel and R. Friedrichs, Am. J. Phys. 70, 428 (2002).22N. A. Kurpios, M. Ibanes, N. M. Davis, W. Lui, T. Katz, J. F. Martin, J. C.
I. Belmonte, and C. J. Tabin, Proc. Natl. Acad. Sci. U.S.A. 105, 8499
(2008).
074704-6 Savin, Shyer, and Mahadevan J. Appl. Phys. 111, 074704 (2012)
Downloaded 28 Apr 2012 to 18.7.29.240. Redistribution subject to AIP license or copyright; see http://jap.aip.org/about/rights_and_permissions