a method for magma viscosity assessment by lava dome
TRANSCRIPT

ISSN 0742-0463, Journal of Volcanology and Seismology, 2021, Vol. 15, No. 3, pp. 159–168. © The Author(s), 2021. This article is an open access publication.Russian Text © The Author(s), 2021, published in Vulkanologiya i Seismologiya, 2021, No. 3, pp. 18–28.
A Method for Magma Viscosity Assessmentby Lava Dome Morphology
Yu. V. Starodubtsevaa, b, I. S. Starodubtseva, b, c, A. T. Ismail-Zadeha, d, *, **,I. A. Tsepeleva, b, O. E. Melnika, e, and A. I. Korotkiia, b
a Institute of Earthquake Prediction Theory and Mathematical Geophysics, Russian Academy of Sciences, Moscow, 117997 Russia
b N.N. Krasovskii Institute of Mathematics and Mechanics, Ural Branchof the Russian Academy of Sciences, Yekaterinburg, 620990 Russia
c Ural Federal University, Yekaterinburg, 620002 Russiad Karlsruhe Institute of Technology, Institute of Applied Geosciences, Karlsruhe, 76131 Germany
e Institute of Mechanics, Lomonosov Moscow State University, Moscow, 119192 Russia*e-mail: [email protected]
**e-mail: [email protected] September 21, 2020; revised November 17, 2020; accepted December 11, 2020
Abstract—Lava domes form when a highly viscous magma erupts on the surface. Several types of lava domemorphology can be distinguished depending on the f low rate and the rheology of magma: obelisks, lava lobes,and endogenic structures. The viscosity of magma nonlinearly depends on the volume fraction of crystals andtemperature. Here we present an approach to magma viscosity estimation based on a comparison of observedand simulated morphological forms of lava domes. We consider a two-dimensional axisymmetric model ofmagma extrusion on the surface and lava dome evolution, and assume that the lava viscosity depends only onthe volume fraction of crystals. The crystallization is associated with a growth of the liquidus temperature dueto the volatile loss from the magma, and it is determined by the characteristic time of crystal content growth(CCGT) and the discharge rate. Lava domes are modeled using a finite-volume method implemented inAnsys Fluent software for various CCGTs and volcanic vent sizes. For a selected eruption duration a set ofmorphological shapes of domes (shapes of the interface between lava dome and air) is obtained. Lava domeshapes modeled this way are compared with the observed shape of the lava dome (synthesized in the study bya random modification of one of the calculated shapes). To estimate magma viscosity, the deviation betweenthe observed dome shape and the simulated dome shapes is assessed by three functionals: the symmetric dif-ference, the peak signal-to-noise ratio, and the structural similarity index measure. These functionals areoften used in the computer vision and in image processing. Although each functional allows to determine thebest fit between the modeled and observed shapes of lava dome, the functional based on the structural simi-larity index measure performs it better. The viscosity of the observed dome can be then approximated by theviscosity of the modeled dome, which shape fits best the shape of the observed dome. This approach can beextended to three-dimensional case studies to restore the conditions of natural lava dome growth.
Keywords: lava dome, viscosity, morphology, numerical analysis, image processingDOI: 10.1134/S0742046321030064
INTRODUCTIONLava domes form as a result of the extrusion of
highly viscous magma. It develops a solid surface layer(carapace) remaining mobile and undergoing defor-mations for days or even months. Several types of lavadome morphology are distinguished. In the endoge-nous regime, magma intrudes inside the dome with-out extrusion of fresh magma on the surface. In theexogenous regime, a fresh lava pours out over the sur-face forming various forms of domes, such as obelisks,lobes, pancake-shaped structures, and some others(Fig. 1). Lava dome collapse can cause explosive erup-
tions, pyroclastic f lows, and lahars, and hence studiesof the conditions of lava dome growth is important forhazard assessment and risk reduction.
Detailed monitoring of lava domes has been con-ducted at several volcanoes, such as the MountSt. Helens in the United States (Swanson et al., 1987),Mount Pinatubo in the Philippines (Daag et al.,1996), Mount Unzen in Japan (Nakada et al., 1999),Santiaguito (Santa Maria) in Guatemala (Harris et al.,2003), Merapi and Sinabung in Indonesia (Voightet al., 2000; Nakada et al., 2019), Soufrière Hills onMontserrat (Watts et al., 2002; Wadge et al., 2014),
159

160 STARODUBTSEVA et al.
Fig. 1. Morphological structures of the lava domes at the Soufrière Hills Volcano, Montserrat (photos by Watts et al., 2002). Pan-els (a) lava obelisk (about 40 m high and 35 m wide); (b) lava whaleback structure; and (c) lobe structure (about 20 m thick)located on rock debris.
(b) (c)(a)
and Volcán de Colima in Mexico (Zobin et al., 2015).Monitoring allows mapping the spatial and temporaldevelopment of lava domes, and determining the mor-phological changes during the dome growth as well asthe changes in the lava volume over time (to assess thedischarge rate).
The morphology of lava domes is influenced by therheology of magma and lava discharge rate (DR).Magma viscosity depends on temperature and volumefraction of crystals, which in its turn is determined bycrystallization kinetics (the characteristic time of crys-tal content growth, CCGT (Tsepelev et al., 2020)). Atsmall CCGT values, i.e. fast lava crystallization, obe-lisk-type structures develop at lower DR and pancake-like structures at higher DR; at high CCGT values, thedomes form either lava lobes or pancake-like struc-tures. It was shown that cooling does not play a signif-icant role in the development of the lava dome. If thecrystals content is controlled only by the cooling, thenthe lava viscosity increases in the near-surface layer ofthe dome, and the thickness of the temperatureboundary layer remains small compared to the domeheight (Tsepelev et al., 2020). In the dome body, a sig-nificant increase in the viscosity occurs due to crystal-lization caused by a loss of volatiles. Thus, the evolu-tion of the lava dome can be modeled using the rheol-ogy depending on CCGT and DR. Meanwhile, thefollowing inverse problem is of an interest to volcanol-ogists: to determine the lava dome viscosity (e.g., therheological properties of the lava within the dome) bythe observed shape of the lava dome for known dis-charge rate.
Here we propose an approach to solving thisinverse problem based on minimizing the deviationbetween the observed and simulated lava domeshapes. We consider a two-dimensional axisymmetricmodel of lava dome evolution assuming that the lavaviscosity depends only on the volume fraction of crys-tals, and this fraction, in its turn, depends on theCCGT. Lava domes are modeled numerically at dif-ferent values of CCGT, DR and the conduit diameter.Using numerical experiments we develop a database ofmorphological shapes of modeled domes for specified
JOURNAL OF VOLCAN
extrusion durations. The results of the experiments(the elements of the database) and an observed dome(in the work, a synthetic dome is constructed to repre-sent the observed dome) are analyzed in the form oftwo-dimensional images. To estimate the viscosity ofthe observed lava dome, we minimize the differencebetween the observed and simulated dome shapesusing three different functionals used in computervision and image processing theory. The viscosity ofthe observed lava dome is then assessed based on therheological properties of the modeled lava dome,which shape fits best the shape of the observed dome.
PROBLEM STATEMENT AND THE METHOD OF NUMERICAL MODELING
OF LAVA DOMESWe consider a two-dimensional axisymmetric
model of two-phase immiscible incompressible f luidapproximating the lava (one phase) and the air(another phase). The two phases are separated bya moving interface—the lava dome surface. The influ-ence of the air phase on the lava dome growth is insig-nificant due to a large ratio between densities/viscositiesof the air and the lava. In the model domain Ω (Fig. 2),the lava motion is described by the following set ofequations supplemented by the initial and boundaryconditions (Ismail-Zadeh and Tackley, 2010; Tsepelevet al., 2019, 2020).
We use the Navier-Stokes equations with the initialcondition u(t = 0, x) = 0 and the continuity equationto describe the lava dynamics
(1)
(2)
where are the Cartesian coordinates;t is the time; is the final time (the duration ofthe model experiments); is thevelocity; is the density; is the viscosity; isthe pressure; , g—is the acceleration due togravity; , T, and denote the gradient vector, the
( )( )∂ ρ + ∇ ρ −∇ ⋅ η ∇ + ∇ = −∇ − ρ∂( ) , ( ) ,T p
tu u u u u g
∇ ⋅ = 0,u
= ∈ Ω1 2( , )x xx∈ ϑ[0, ] ϑ
= 1 2( ( , ), ( , ))u t u tu x xρ η = ( )p p x
= (0, )gg∇ i i,
OLOGY AND SEISMOLOGY Vol. 15 No. 3 2021

A METHOD FOR MAGMA VISCOSITY ASSESSMENT 161
Fig. 2. Sketch of the model domain. The curved arrowpoints to the symmetry condition along the x1=0 axis. (p = 1, 2, 3, 4, 5, 6) represents a part of the model boundary(see the text for the boundary conditions). The large blackarrow shows the part of the boundary, through whichmagma enters the model domain. The interface betweenthe lava and the air is indicated by a dotted line. The soliddashed line indicates the border of binary images stored inthe database.
x2 100 m
DГ6
Г1Air Г5 70 m
C
BA
Lava Г4
Г3
x = 0Г2
30 m
x1
Γ p
transposed matrix, and the scalar product of vectors,respectively. We neglect the temperature dependenceof the physical parameters of the model, and the sur-face tension forces. Model density and viscosity arerepresented as and
, respectively. Here isthe air density; is the lava density; is the air vis-cosity; and is the lava viscosity. The function equals 1 for the lava and 0 for the air at each point xand at time t, and this function is transported with thevelocity u according to the advection equation
(3)
with the initial condition , which meansthat the entire model domain is filled with the air atthe initial time.
We assume that the lava viscosity (measured in Pa s)depends on the volume fraction of crystals (Costa et al.,2009) as
(4)
where is the volume fraction of crystals; is the specific volume fraction of crystals; B is the Ein-stein coefficient’s theoretical value determined fromthe Einstein equation as (Mardles,1940) (it was experimentally determined that the Ein-stein coefficient varies from 1.5 to 5 (Jeffrey and Acri-vos, 1976)); , , and (Lejeune and Richet, 1995; Costa et al., 2009); is the error function. The volume fraction of crystals isdetermined from the following evolutionary equationdescribing the simplified kinetics of crystal growthduring crystallization due to magma degassing
(5)
with the initial condition . Here isthe volume fraction of crystals at the equilibrium,which depends on the amount of water dissolved in themagma and on the temperature; is the CCGT. Thesmaller CCGT, the faster the crystallization processconverges to its equilibrium state. CCGT is referred toas the relaxation time required to decrease the differ-ence between actual ( ) and equilibrium ( ) valuesof the volume fraction of crystals by a factor of e(~2.72) relative to the initial difference ( ),where is the initial volume fraction of crystals in themagma. For and u = 0, the CCGT can be foundanalytically as . Therelaxation time can vary from a few hours to severalmonths depending on the temperature and water satu-
ρ = ρ α + ρ − α( , ) (1 ( , ))L At tx xη = η α + η − α( , ) (1 ( , ))L At tx x ρA
ρL ηA
ηL α( , )t x
( ) 0t
∂α + ∇ ⋅ α =∂
u
α = =( 0, ) 0t x
( )δ
− φγ
η ϕ = + ϕ
π× − − ξ ϕ + ϕ − ξ
7
*
( ) 10 1
1 (1 )erf (1 ) ,2(1 )
L
B
ϕ = φ φ ,* φ φ*
= η φ − φ( ( ) 1)LB
δ = 7.24 γ = 5.76 −ξ = × 44.63 10⋅erf( )
φ − φ∂φ + ∇ ⋅ αφ = −α∂ τ
( ) ,eq
tu
φ = =( 0, ) 0t x φeq
τ
φ φeq
φ − φin eq
φinα = 1
[ ]( )−τ = − φ − φ φ − φ 1ln ( ) ( )eq eq intτ
JOURNAL OF VOLCANOLOGY AND SEISMOLOGY V
ration of the magma, the number of pre-existing crys-tals in the magma and its composition (Tsepelev et al.,2020). Note that although the viscosity depends on thepetrological (chemical) composition of the lava andthe volatile content of the lava (its water saturation),these viscosity dependencies are not considered in thispaper.
The following conditions are set on the boundary of the model
domain (see Fig. 2). At the boundary , the symmetryconditions are set, i.e., the impermeability condition
and the free slip condition
. It is assumedthat the lava of density and viscosity enters themodel domain through the boundary at the givenDR Q. At the boundaries , and , no-slip con-dition u = 0 is assumed. The air is removed from themodel domain through the boundary according tothe given DR. It is assumed that the volume fraction ofcrystals is equal at the boundary and at . The values of model parameters used in numer-ical simulations are presented in Table 1.
The finite volume method implemented in AnsysFluent software is employed to solve numerically theproblem (1)-(5). To determine the position of the lavadome interface with the air, the volume of f luid (VOF)method is used (Hirt and Nichols, 1981). An implicit
Γ = Γ Γ Γ Γ Γ Γ∪ ∪ ∪ ∪ ∪1 2 3 4 5 6
Γ1
=, 0u n
( ) ( )∇ + ∇ − ∇ + ∇ =, 0T Tu u n u u n n nρL ηL
Γ2
Γ3 Γ4 Γ5
Γ6
φ = φin Γ2 φ = 0Γ6
ol. 15 No. 3 2021
162 STARODUBTSEVA et al.
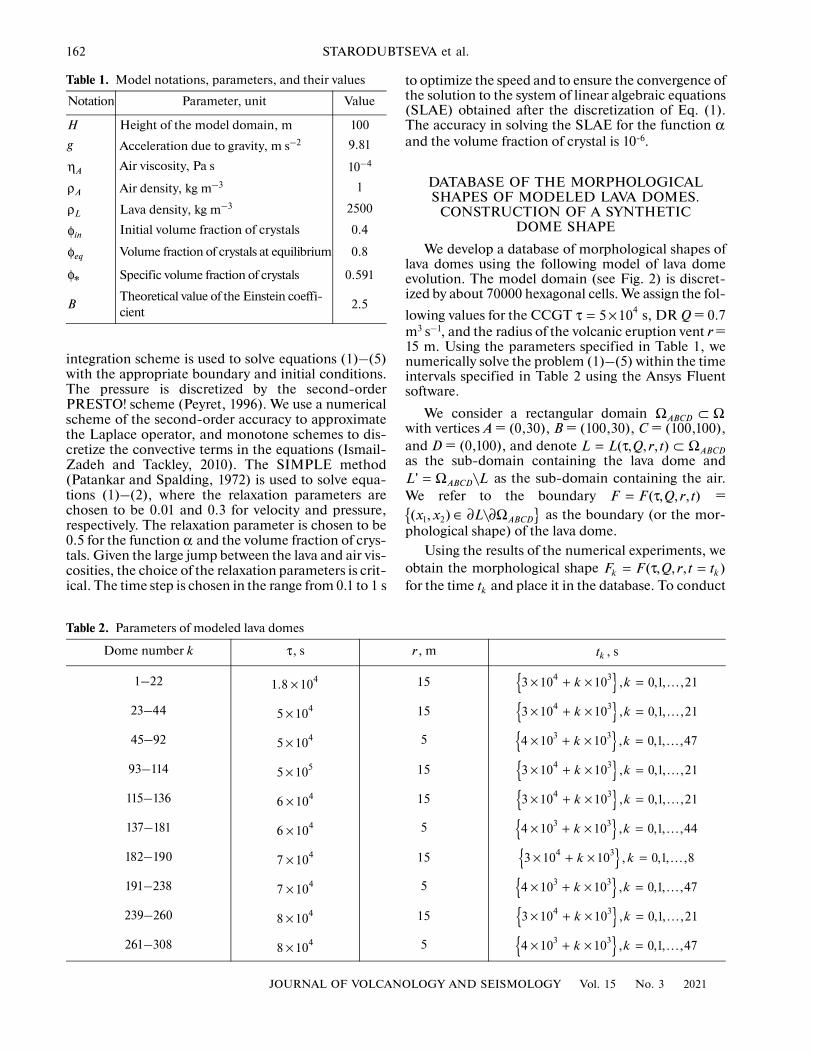
Table 1. Model notations, parameters, and their values
Notation Parameter, unit Value
H Height of the model domain, m 100g Acceleration due to gravity, m s–2 9.81
Air viscosity, Pa s 10–4
Air density, kg m–3 1
Lava density, kg m–3 2500
Initial volume fraction of crystals 0.4
Volume fraction of crystals at equilibrium 0.8
Specific volume fraction of crystals 0.591
BTheoretical value of the Einstein coeffi-cient 2.5
ηA
ρA
ρL
φin
φeq
φ*
integration scheme is used to solve equations (1)–(5)with the appropriate boundary and initial conditions.The pressure is discretized by the second-orderPRESTO! scheme (Peyret, 1996). We use a numericalscheme of the second-order accuracy to approximatethe Laplace operator, and monotone schemes to dis-cretize the convective terms in the equations (Ismail-Zadeh and Tackley, 2010). The SIMPLE method(Patankar and Spalding, 1972) is used to solve equa-tions (1)–(2), where the relaxation parameters arechosen to be 0.01 and 0.3 for velocity and pressure,respectively. The relaxation parameter is chosen to be0.5 for the function and the volume fraction of crys-tals. Given the large jump between the lava and air vis-cosities, the choice of the relaxation parameters is crit-ical. The time step is chosen in the range from 0.1 to 1 s
α
JOURNAL OF VOLCAN
Table 2. Parameters of modeled lava domes
Dome number k , s
1–22
23–44
45–92
93–114
115–136
137–181
182–190
191–238
239–260
261–308
τ
× 41.8 10
× 45 10
× 45 10
× 55 10
× 46 10
× 46 10
× 47 10
× 47 10
× 48 10
× 48 10
to optimize the speed and to ensure the convergence ofthe solution to the system of linear algebraic equations(SLAE) obtained after the discretization of Eq. (1).The accuracy in solving the SLAE for the function and the volume fraction of crystal is 10-6.
DATABASE OF THE MORPHOLOGICAL SHAPES OF MODELED LAVA DOMES.
CONSTRUCTION OF A SYNTHETICDOME SHAPE
We develop a database of morphological shapes oflava domes using the following model of lava domeevolution. The model domain (see Fig. 2) is discret-ized by about 70000 hexagonal cells. We assign the fol-lowing values for the CCGT s, DR Q = 0.7m3 s–1, and the radius of the volcanic eruption vent r =15 m. Using the parameters specified in Table 1, wenumerically solve the problem (1)–(5) within the timeintervals specified in Table 2 using the Ansys Fluentsoftware.
We consider a rectangular domain with vertices A = (0,30), B = (100,30), C = (100,100),and D = (0,100), and denote as the sub-domain containing the lava dome and
as the sub-domain containing the air.We refer to the boundary =
as the boundary (or the mor-phological shape) of the lava dome.
Using the results of the numerical experiments, weobtain the morphological shape for the time and place it in the database. To conduct
α
τ = × 45 10
Ω ⊂ ΩABCD
= τ ⊂ Ω( , , , ) ABCDL L Q r t
' \ABCDL L= Ω= τ( , , , )F F Q r t
{ }1 2( , ) \ ABCDx x L∈ ∂ ∂Ω
= τ =( , , , )k kF F Q r t tkt
OLOGY AND SEISMOLOGY Vol. 15 No. 3 2021
, m , s
5
5
5
5
r kt
15 { }× + × = …4 33 10 10 , 0,1 , , 21k k
15 { }× + × = …4 33 10 10 , 0,1 , , 21k k
{ }× + × = …3 34 10 10 , 0,1 , , 47k k
15 { }× + × = …4 33 10 10 , 0,1 , , 21k k
15 { }× + × = …4 33 10 10 , 0,1 , , 21k k
{ }× + × = …3 34 10 10 , 0,1 , , 44k k
15 { }× + × = …4 33 10 10 , 0,1 , , 8k k
{ }× + × = …3 34 10 10 , 0,1 , , 47k k
15 { }× + × = …4 33 10 10 , 0,1 , , 21k k
{ }3 34 10 10 , 0,1 , , 47k k× + × = …

A METHOD FOR MAGMA VISCOSITY ASSESSMENT 163
Fig. 3. Morphological shapes of several modeled lava domes.
F21 F43 F51
F113 F135 F143
F197 F259 F267
10 m
the test study, we computed the morphological shapesfor the following values of
s andr = 5 m (see Table 2). The database can be replenishedwith modeled dome shapes for different parameters ofCCGT, DR, and the vent’s radius. Figure 3 shows sev-eral morphological shapes of the domes obtained innumerical simulations for different parameters of theproblem. Note that the area L (of each lava dome pre-sented in Fig. 3) is approximately the same.
As the main goal of the study is to find a domeshape in the database that approximates a natural(observed) lava dome in the best way and to determinethen its viscosity, we construct a synthetic dome as anexample of a natural lava dome. To construct the syn-thetic dome, we choose a dome from the database, forinstance, the dome with the morphological shape
(Fig. 4a) and introduce a random noisealong the boundary of this dome to develop a syntheticdome shape F* (see Fig. 4b).
The random noise is generated in the followingway. Consider some point on the lavadome boundary. This point is randomly displaced as
τ = × × × × ×4 4 4 4 5{1.8 10 , 6 10 , 7 10 , 8 10 , 5 10 }
4135 ( 6 10 s,F F= τ = × 3 10.7 m s ,Q −= 15 m,r =
45 10 s)t = ×
= ∈1 2( , )a a a F
JOURNAL OF VOLCANOLOGY AND SEISMOLOGY V
, where and are normallydistributed random variables with zero mathematicalexpectation and standard deviation equal to 1 (Went-zel, 1969). We consider the circle with thecenter at the point and radius |ε| for each dis-placed point, where is a uniformly distributed ran-dom variable taking values on the interval , isa constant and equal to 1 in this case. Then we con-struct the following sub-domain:
Thus, the synthetic dome with boundary F* isobtained by combining the dome with boundary Fwith a set of random circles in the case of non-negative
and by truncating the synthetic dome with a set ofrandom circles in the case of negative . The artificialdistortion (noise) of the dome boundary allows forsimulating real distortions caused by the growth of anatural lava dome and its partial collapse and/or byerrors in measurements of the morphological shape ofa lava dome.
+ δ = + δ + δ1 1 2 2( , )a a a δ1 δ2
( )+δ εaC+ δa
ε[ ]−ω ω, ω
( )
( )
δ
δ
, 0* .
\ , 0
aa F
aa F
L CL
L C
+∈
+∈
∪ ε ε ≥ = ε ε <
∪
∪
εε
ol. 15 No. 3 2021

164 STARODUBTSEVA et al.
Fig. 4. Morphological shapes of the modeled dome F = F135 (a) and the synthetic dome (b).
10 m 10 m
F F*
L L*
L' L'*
(а) (b)
PATTERN RECOGNITION METHODSWe compare the shape of the synthetic dome F*
with the shapes of lava domes Fk from the database bythe methods used in the theory of image processingand pattern recognition (e.g., Salomon, 2007). Herewe represent lava domes by binary images and intro-duce a uniform rectangular partitioning of the area
into cells as .
A rectangular matrix of size isassigned to each shape of the dome F, where thematrix element equals to 0, if the corresponding cellΩij contains more than 50 percent of the air, and equalsto 1 in all other cases. We evaluate then the closenessof the synthetic dome shape F* and the arbitrary domeshape Fk from the morphological shape database bymeans of the following quality functions.
1. The functional based on the symmetric difference:
where (m2) is the area of the region and k1 (m–2) isthe scaling multiplier.
2. The functional based on peak signal-to-noise ratio(PSNR) measure (Salomon, 2007):
where k2 is the scaling factor, and k3 is a positive con-stant. In numerical implementations, if P(F) and P(F*)match completely, the user receives a message con-
ΩABCD ×I J ( )− −
= =Ω Ω = Ω∪
1, 1
0, 0
I Jij ABCD iji j
− −= == 1, 1
0, 0( ) { }I Jij i jP F p ×I J
ijp
1 1( *, ) (( * )\( * )),J F F k S L L L L= ∪ ∩⋅( )S
( )− −
= =
=
= + −
21, 1 2
2 3 100, 0
( *, )
*10 log ( ) ,I J
ij iji j
J F F
k k p p IJ
JOURNAL OF VOLCAN
taining the number of the modeled dome, where thecondition of the complete match between the twomatrices is reached.
3. The functional based on the SSIM (structure simi-larity index measure) (Wang et al., 2004):
where μ(P), μ(P*) is the mathematical expectation,σ(P,P*) is the covariance, σ2(P), σ2(P*) is the disper-sion, k4 is the scaling multiplier, c1 = 0.01, and c3 =0.03. Here we consider a probabilistic model of imagerepresentation, namely, the image is considered as afield of random variables, and the value at each pointof this field is a realization of a random variable.
The values of the functionals are calculated foreach element of the database, and the obtained set ofvalues is ordered in the descending order. In this case,the fact that one or another functional gives a moreaccurate estimate is based on the information aboutthe synthetic dome. For example, Figure 5 showingthe values of the three functionals on the elements pre-sented in Fig. 3 illustrates that all three functionalsreach a minimum at modeled dome #135. Note thatfunctionals J1, J2, and J3 estimate the quantitativedeviation of the modeled and synthetic domes, whilethe functional J3 also estimates the structural featuresof the morphological shapes of the domes, although itleads to complex and resource-consuming computa-tions.
( )( ) ( )
( )
3 4 12 2
2
2 22
* 2 ( ) ( *)
( , *) (
( ,
) ( *)
( ) ( * ,
)
)
P P c
P P c P P
P
J
P
F F
c
k μ μ +× σ + μ + μ
× σ + +
=
σ
OLOGY AND SEISMOLOGY Vol. 15 No. 3 2021

A METHOD FOR MAGMA VISCOSITY ASSESSMENT 165
Fig. 5. The values of functionals J1, J2, and J3 related to themodeled domes (see Fig. 3) and presented in descendingorder.
1354321259511431972670113
J1J2
J3
0.30
0.45
0.15
0.60J
(F *
, Fk)
Dome number k
Fig. 6. The values of the functionals presented in descendingorder: (a), (b), and (c).
132287 67 272 25 47 257112625110962169227880308
0.50
0.75
0.25
1.00
J1
J2
J3
J m (F
*, F
k)
Dome number k
13272 67 272 262 190 258264245108946277823020308
0.50
0.75
0.25
1.00
J1
J2
J3
J m (F
*, F
k)Dome number k
13272 67 272 262 190 258112451089462772973020308
0.50
0.75
0.25
1.00
J1
J2
J3
J m (F
*, F
k)
Dome number k
(a)
(b)
(c)
1( *, )kJ F F 2( *, )kJ F F 3( *, )kJ F F
RESULTS: DETERMINATIONOF THE LAVA DOME VISCOSITY
FROM THE KNOWN DOME SHAPE
Using the functionals described above, we comparethe synthetic dome F* with all domes Fk from the data-base of morphological forms. The following scalingmultipliers are prescribed to get the values of all func-tionals on the database’s elements within the interval[0, 1]: k1 = 1/30, k2 = 1/25, k3 = 33, and k4 = 1/14.Figures 6 and 7 present the values of the functionalsJm(F*, F), m = 1, 2, and 3 versus the k numbers of thedomes from the database. The set of elements, onwhich the smallest values of the considered function-als are achieved, are almost identical: the modeleddomes F41, F133, F134, and F135 are the closest to the syn-thetic dome F* (see Fig. 7). Figure 8 shows the syn-thetic dome and four closest modeled domes from thedatabase. The time of a lava dome formation, the dis-charge rate, and the vent’s size can help with a practi-cal selection of the closest modeled dome.
From the available information about the syntheticdome F* (obtained by the introduction of a noise onthe morphological shape of the modeled dome F135)one can deduce that the SSIM-based functional pro-vides a more accurate closeness estimate. Note thatthe functionals J1 and J2 give qualitatively similarresults for the binary images, and hence only one ofthem can be considered. To consider qualitative andquantitative closeness of the synthetic and modeleddomes simultaneously, a linear combination of thedescribed functionals can be used, and in this caseoptimal qualitative and quantitative estimates can beachieved by a suitable choice of weighting coefficients.For example, considering the functional =
, we see that the minimumof the functional is achieved for dome #135 (Fig. 9).Although the linear combination of the functionalscan be used to choose the modeled dome that willoptimally fit the natural dome, it should be noted that
( *, )J F F[ ]1 30.5 ( *, ) ( *, )J F F J F F+
JOURNAL OF VOLCANOLOGY AND SEISMOLOGY V
the choice of the weighting coefficients may be diffi-cult in practice when the natural (and not synthetic)dome is to be assessed.
DISCUSSION AND CONCLUSION
Lava dome morphological diversity can beexplained by changes in the magma viscosity caused bydegassing and crystallization during the magma ascentthrough the volcanic conduit from the magma cham-ber (Melnik and Sparks, 1999, 2005). The rapid ascentof magma reduces the time available for magma crys-tallization, so magma behaves as a relatively low-vis-cosity f luid and, after extrusion to the surface, spreadsout to form pancake-like morphological structures.With decreasing DR or at small CCGT, the crystallinemagma undergoes a transition from a f luid to a quasi-
ol. 15 No. 3 2021

166
JOURNAL OF VOLCAN
STARODUBTSEVA et al.
Fig. 7. Fragment of Fig. 6 for small values of the function-als (a), (b), and (c).
134 135411331364240132430
8
0.15
0.30
J1
J2
J3
J m (F
*, F
k)
Dome number k
135 13413341136424013243018
(a)
0.15
0.30
J1
J2
J3
J m (F
*, F
k)
135 13413341136424013243018
0.15
0.30
J1
J2
J3
J m (F
*, F
k)
(b)
(c)
1( *, )kJ F F 2( *, )kJ F F 3( *, )kJ F F
Fig. 8. Comparison of synthetic dome F* with modeled domes Fdistribution.
F135 F134
7.50 8.05 8.60 9.15 9.70 10.
Log10 (
solid state forming lava lobes and obelisks on the sur-face (Tsepelev et al., 2020).
The magma viscosity and the history of a lava domegrowth can be determined from observations on themorphological shapes of the dome by solving inverseproblems. This paper presents an approach to estimat-ing the magma viscosity, based on the comparison ofobserved and modeled morphological shapes of lavadomes, by three functionals used in the computervision and image processing theory. Although eachfunctional allows for determining the minimal differ-ence between the modeled and observed morphologi-cal shapes of lava domes, the SSIM-based functionalevaluates not only the quantitative deviation of themodeled and observed domes, but also their structuralfeatures, and thus performs a better assessment. Therheological parameters of the modeled dome, whichmorphological shape fits that of the observed lavadome, can be then estimated and adopted for the vis-cosity of the observed dome.
An observed lava dome was synthesized from a ran-dom modification of one of the modeled lava domes,and the functional estimates were based on the knowl-edge of the morphological shape of this syntheticdome. In the case of a natural lava dome, we wouldrecommend considering the element of the database,at which the values of the functionals are minimal,along with a few other elements close to it. Theobtained sample of the elements is to be subjected toan expert evaluation.
The inverse problem under consideration is arather complicated object of research from both theo-retical and computational points of view (Samarskiiand Vabishchevich, 2004; Kabanikhin, 2009). As arule, an inverse problem is ill-posed, that is, its solu-tion is unstable and/or non-unique. The consideredinverse problem is ill-posed, namely it is unstable (assmall errors in the initial data or rounding errors can
OLOGY AND SEISMOLOGY Vol. 15 No. 3 2021
135, F134, F133 and F41. Colors indicate the modeled lava viscosity
10 m
F133 F41
2 10.8 11.4 11.9 12.4 13.0
lava viscosity)

A METHOD FOR MAGMA VISCOSITY ASSESSMENT 167
Fig. 9. The values of functional presented indescending order.
134 13513341136424013243018
0.05
0.10
J (F
*, F
k)
Dome number k
( *, )J F F
lead to significant errors in the solution of the prob-lem), and also it has a non-unique solution (for exam-ple, different DR and different CCGT can result in asimilar shape of the lava dome). However, the dis-charge rate can be practically determined by the domevolume, and therefore DR can be considered as aknown characteristic of the process. Classical methodsare not suitable for solving inverse problems, and var-ious approaches are used to transform ill-posed prob-lems into well-posed (when the solution is stable andunique) (Tikhonov and Arsenin, 1977). Many of theseapproaches may be satisfactory in the theoretical stud-ies of the inverse problem, but unsatisfactory in itsnumerical solution. Other approaches involve varioussimplifications of inverse problems.
In this work, the inverse problem is related to asearch for the lava dome viscosity distribution, whichis presented as a certain function with a small numberof model parameters. Actually, this search is reducedto determining CCGT, on which the viscositydepends, and this has been performed by minimizingthe differences between the morphological shapes ofthe observed (synthetic, in this case) and modeled lavadomes.
Prediction of a dome shape and stress distributionwithin the dome structure may help in assessments ofits stability and possible collapse with the formation ofpyroclastic f lows or explosive eruptions. Ideally, a cus-tomized volcano-specific program should be used forshort- and long-term forecasts by volcano observatorystaff. A similar practice is used by oil companies toforecast oil production in the fields. A regular adjust-ment of the model by reproducing the history of oilproduction permits for reliable forecasts in this caseand for determining optimal production strategies.
When applying this method to a real eruption, it ispossible to consider deviations of the calculated domeshape from the measured one not only at a certainpoint in time, but also over the entire observationperiod, setting limitations on the crater shape, theconduit feeding the dome, and the magma petrology.Natural lava domes are three-dimensional objects.Although the approach presented in the paper is two-dimensional, it can be extended to the three-dimen-sional case and used to reconstruct the growth condi-tions of natural lava domes.
ACKNOWLEDGMENTSWe are grateful to two anonymous reviewers for their
constructive comments. Numerical experiments were car-ried out on the Uran computing cluster (Institute of Math-ematics and Mechanics, Ural Branch of the Russian Acad-emy of Sciences, Yekaterinburg).
FUNDINGThe work was supported by the Russian Science Foun-
dation (project no. 19-17-00027)
JOURNAL OF VOLCANOLOGY AND SEISMOLOGY V
OPEN ACCESS
This article is licensed under a Creative Commons Attri-bution 4.0 International License, which permits use, shar-ing, adaptation, distribution and reproduction in anymedium or format, as long as you give appropriate credit tothe original author(s) and the source, provide a link to theCreative Commons licence, and indicate if changes weremade. The images or other third party material in this articleare included in the article’s Creative Commons licence,unless indicated otherwise in a credit line to the material. Ifmaterial is not included in the article’s Creative Commonslicence and your intended use is not permitted by statutoryregulation or exceeds the permitted use, you will need toobtain permission directly from the copyright holder. Toview a copy of this licence, visit http://creativecom-mons.org/licenses/by/4.0/.
REFERENCESCosta, A., Caricchi, L., and Bagdassarov, N., A model for
the rheology of particle-bearing suspensions and par-tially molten tocks, Geochem. Geophys. Geosys., 2009,vol. 10, no. 3, pp. Q03010.
Daag, A.S., Dolan, M.T., Laguerta, E., et al., Growth of apostclimactic lava dome at Pinatubo Volcano, Ju-ly‒October 1992, in Fire and Mud. Eruptions and La-hars of Mount Pinatubo, Philippines, Newhall, C. andPunongbayan, R., Eds., Seattle: University of Wash-ington Press, 1996. P. 647–664.
Harris, A.J., Rose, W.I., and Flynn, L.P., Temporal trendsin lava dome extrusion at Santiaguito 1922–2000, Bull.Volcanol., 2003, vol. 65, pp. 77–89.
Hirt, C.W. and Nichols, B.D., Volume of f luid (VOF)method for the dynamics of free boundaries, J. Comput.Phys., 1981, vol. 39, no. 1, pp. 201–225.
Ismail-Zadeh, A. and Tackley, P., Computational Methodsfor Geodynamics, Cambridge: Cambridge UniversityPress, 2010.
Jeffrey, D. and Acrivos, A., The rheological properties ofsuspensions of rigid particles, AIChE J., 1976, vol. 22,pp. 417–432.
ol. 15 No. 3 2021
168 STARODUBTSEVA et al.
Kabanikhin, S.I., Obratnye i nekorrektnye zadachi (Reverseand Ill-Posed Problems), Novosibirsk: SibirskoeNauchnoe Izdatelstvo, 2009.
Lejeune, A. and Richet, P., Rheology of crystal-bearing sil-icate melts: An experimental study at high viscosity, J.Geophys. Res., 1995, vol. 100, pp. 4215–4229.
Mardles, E., Viscosity of suspensions and the Einsteinequation, Nature, 1940, vol. 145, pp. 970.
Melnik, O. and Sparks, R.S.J., Nonlinear dynamics of lavadome extrusion, Nature, 1999, vol. 402, pp. 37–41.
Melnik, O. and Sparks, R.S.J., Controls on conduit magmaflow dynamics during lava dome building eruptions, J.Geophys. Res., 2005, vol. 110, no. B2, p. B02209.
Nakada, S., Shimizu, H., and Ohta, K., Overview of the1990‒1995 eruption at Unzen Volcano, J. Volcanol.Geotherm. Res., 1999, vol. 89, pp. 1–22.
Nakada, S., Zaennudin, A., Yoshimoto, M., et al., Growthprocess of the lava dome/flow complex at SinabungVolcano during 2013‒2016, J. Volcanol. Geotherm. Res.,2019, vol. 382, pp. 120–136.
Patankar, S.V. and Spalding, D.B., A calculation procedurefor heat and mass transfer in three−dimensional para-bolic f lows, Int. J. Heat Mass Transfer, 1972, vol. 15,pp. 1787−1806.
Peyret, R., Handbook of Computational Fluid Mechanics,Academic Press Limited, USA, 1996.
Salomon, D., Data Compression: The Complete Reference,London: Springer, 2007.
Samarsky, A.A. and Vabishchevich, P.N., Chislennye meto-dy resheniya obratnykh zadach matematicheskoi fiziki(Numerical Methods for Inverse Problems in Mathe-matical Physics), Moscow: Editorial URSS, 2004.
Swanson, D.A., Dzurisin, D., Holcomb, R.T., et al.,Growth of the lava dome at Mount St Helens, Washing-ton, (USA) 1981‒1983, in The Emplacement of SilicicDomes and Lava Flows, Fink, J.Y., Ed., Geol. Soc. Amer.,Boulder, Special Paper 212, 1987, pp. 1–16.
The Eruption of Soufrière Hills Volcano, Montserrat, from2000 to 2010, Wadge, G., Robertson, R.E.A., and Voi-ght, B., Eds., Geol. Soc. London Mem., 2014, vol. 39, https://doi.org/10.1144/M39
Tikhonov, A.N. and Arsenin, V.Ya., Metody resheniya ne-korrektnykh zadach (Methods for Inverse Problems),2nd ed., Moscow: Nauka, 1979.
Tsepelev, I., Ismail-Zadeh, A., and Melnik, O., Lava domemorphology inferred from numerical modelling, Geo-phys. J. Inter., 2020. ggaa395. https://doi.org/10.1093/gji/ggaa395
Tsepelev, I., Ismail-Zadeh, A., Starodubtseva, Y., et al.,Crust development inferred from numerical models oflava f low and its surface thermal measurements, Ann.Geophys., 2019, vol. 61, no. 2, pp. VO226. https://doi.org/10.4401/ag-7745
Ventsel, E.S., Teoriya veroyatnostei (Probability Theory),4th ed., Moscow: Nauka, 1969.
Voight, B., Constantine, E.K., Siswowidjoyo, S., and Tor-ley, R., Historical eruptions of Merapi volcano, CentralJava, Indonesia, 1768–1998, J. Volcanol. Geotherm.Res., 2000, vol. 100, pp. 69–138.ц
Wang, Z., Bovik, A.C., Sheikh, H. R., and Simoncelli, E.P.,Image quality assessment: From error visibility to struc-tural similarity, IEEE Transactions on Image Processing,2004, vol. 13, no. 4, pp. 600–612.
Watts, R.B., Herd, R.A., Sparks, R.S. J., and Young, S.R.,Growth patterns and emplacement of the andesitic lavadome at Soufrière Hills Volcano, Montserrat, in TheEruption of Soufrière Hills Volcano, Montserrat, from1995 to 1999, Druitt, T.H. and Kokelaar, B.P., Eds.,Geol. Soc. London Mem., 2002, vol. 21, pp. 115‒152.
Zobin, V.M., Arámbula, R., Bretón, M., et al., Dynamics ofthe January 2013–June 2014 explosive-effusive episodein the eruption of Volcán de Colima, México: insightsfrom seismic and video monitoring, Bull. Volcanol.,2015, vol. 77, pp. 31. https://doi.org/10.1007/s00445-015-0917-z
JOURNAL OF VOLCANOLOGY AND SEISMOLOGY Vol. 15 No. 3 2021