a method for independent component graph analysis of
TRANSCRIPT

Western UniversityScholarship@Western
Anatomy and Cell Biology Publications Anatomy and Cell Biology Department
3-1-2017
A method for independent component graphanalysis of resting-state f MRIDemetrius Ribeiro de PaulaWestern University, [email protected]
Erik ZieglerUniversity of Liege
Pubuditha M. AbeyasingheWestern University
Tushar K. DasWestern University
Follow this and additional works at: https://ir.lib.uwo.ca/anatomypub
Part of the Anatomy Commons, and the Cell and Developmental Biology Commons
Citation of this paper:de Paula, Demetrius Ribeiro; Ziegler, Erik; Abeyasinghe, Pubuditha M.; and Das, Tushar K., "A method for independent componentgraph analysis of resting-state fMRI" (2017). Anatomy and Cell Biology Publications. 11.https://ir.lib.uwo.ca/anatomypub/11
Brain and Behavior. 2017;7:e00626. wileyonlinelibrary.com/journal/brb3 | 1 of 12https://doi.org/10.1002/brb3.626
Received:9May2016 | Revised:28October2016 | Accepted:18November2016DOI:10.1002/brb3.626
M E T H O D S
A method for independent component graph analysis of resting-statefMRI
DemetriusRibeirodePaula1 | ErikZiegler2 | PubudithaM.Abeyasinghe1 | TusharK.Das1 | Carlo Cavaliere2,3 | MarcoAiello3 | LizetteHeine2 | CaroldiPerri2 | AthenaDemertzi2,4 | QuentinNoirhomme2 | VanessaCharland-Verville2 | AudreyVanhaudenhuyse5 | JohanStender6 | FranciscoGomez7 | Jean-FloryL.Tshibanda8 | StevenLaureys2,8 | AdrianM.Owen9 | AndreaSoddu1
ThisisanopenaccessarticleunderthetermsoftheCreativeCommonsAttributionLicense,whichpermitsuse,distributionandreproductioninanymedium,providedtheoriginalworkisproperlycited.©2017TheAuthors.Brain and BehaviorpublishedbyWileyPeriodicals,Inc.
1DepartmentofPhysics&Astronomy,Brain&MindInstitute,WesternUniversity,London,ON,Canada2ComaScienceGroup,GIGAResearch,UniversitéetCentreHospitalierUniversitairedeLiège,Liège,Belgium3IRCCSSDN,IstitutodiRicercaDiagnosticaeNucleare,Naples,Italy4BrainandSpineInstitute(ICM),HôpitalPitié-Salpêtrière,Paris,France5DepartmentofAlgologyandPalliativeCare,UniversitédeLiège,Liege,Belgium6DepartmentofNeuroscienceandPharmacology,UniversityofCopenhagen,Copenhagen,Denmark7DepartmentofMathematics,UniversidadNacionaldeColombiasedeBogotá,Bogotá,Colombia8DepartmentofNeurology,UniversitédeLiège,Liège,Belgium9DepartmentofPsychology,Brain&MindInstitute,WesternUniversity,London,ON,Canada
AbstractIntroduction:Independentcomponentanalysis(ICA)hasbeenextensivelyusedforre-ducingtask-freeBOLDfMRIrecordings intospatialmapsandtheirassociatedtime-courses.Thespatiallyidentifiedindependentcomponentscanbeconsideredasintrinsicconnectivitynetworks(ICNs)ofnon-contiguousregions.Todate,thespatialpatternsofthenetworkshavebeenanalyzedwithtechniquesdevelopedforvolumetricdata.Objective:Here,wedetailagraphbuildingtechniquethatallowsthese ICNstobeanalyzedwithgraphtheory.Methods:First,ICAwasperformedatthesingle-subjectlevelin15healthyvolunteersusing a 3TMRI scanner. The identification of nine networks was performed by amultiple-template matching procedure and a subsequent component classificationbasedonthenetwork“neuronal”properties.Second,foreachoftheidentifiednet-works, the nodes were defined as 1,015 anatomically parcellated regions. Third,between-nodefunctionalconnectivitywasestablishedbybuildingedgeweightsforeachnetworks.Group-levelgraphanalysiswasfinallyperformedforeachnetworkandcomparedtotheclassicalnetwork.Results:Networkgraphcomparisonbetweentheclassicallyconstructednetworkandtheninenetworks showed significantdifferences in the auditory andvisualmedial
CorrespondenceDemetriusRibeirodePaulaandAndreaSoddu,DepartmentofPhysics&Astronomy,Brain&MindInstitute,WesternUniversity,London,ON,Canada.Emails:[email protected]@uwo.ca
FundinginformationCanadaExcellenceResearchChairs(CERC);JamesS.McDonnellFoundation(JSMF)Program;NaturalSciencesandEngineeringResearchCouncilofCanada(NSERC);BelgianNationalFundforScientificResearch;UniversityofLiege;QueenElisabethMedicalFoundation;LeonFredericqFoundation;BelgianInter-UniversityAttractionProgram;WalloonExcellenceinLifeSciencesandBiotechnologyprogram;MarieCurieInitialTrainingNetworkinNeurophysics,Grant/AwardNumber:PITN-GA-2009-238593
2 of 12 | RIBEIRO dE PAULA Et AL.
1 | INTRODUCTION
Theevaluationoffunctionalconnectivityfromresting-statefMRIdatais broadlybasedon two familiesof analyticalmethods. Seed-basedcorrelationanalysisestimatestherelationshipbetweenapredefinedregion(the“seed”)andallothervoxelsaroundthebrain(Biswal,Yetkin,Haughton,&Hyde, 1995; Fox&Raichle, 2007; Fox etal., 2005).Acommonlyemployedalternative is independent componentanalysis(ICA;Beckmann,DeLuca,Devlin,&Smith,2005;Damoiseauxetal.,2006; Esposito etal., 2008; Hyvärinen, Karhunen, & Oja, 2001), adata-drivenapproachtodecomposewhole-brainBOLDsignalintoanumberofcontributingvolumetricspatialmapsandtheirassociatedtime-courses,suchthatthespatialindependenceofthecomponentsismaximized.ICAhasproventobeaneffectiveandrobusttoolfortheisolationof low-frequencyresting-statepatternsfromdataacquiredatvariousspatialandtemporal resolutions (DeLuca,Beckmann,DeStefano, Matthews, & Smith, 2006). The ICA-generated volumetricmapsaregenerallyreportedasz-scoresinordertoshowthecontri-butionofeachcomponent’stime-coursetotheBOLDsignalineachvoxel.Thesemapsarethencommonlyanalyzedinavoxel-wiseman-nerinordertoshowbetweenorwithin-groupconnectivitydifferences(Greicius,Srivastava,Reiss,&Menon,2004).Thenumberofcompo-nentsisgenerallyuser-definedandmanyoftheresultingcomponentsmay be due to non-neuronal activity (such as cardiovascular signal,eyemovements,muscleactivityinthevicinityoftheheadandheadmovement).Classically10 functionalnetworks canbe reliably iden-tifiedfromICA(Beckmannetal.,2005;Damoiseauxetal.,2006;DeLucaetal.,2006;Fox&Raichle,2007)bydecomposingthesignalandto separate neuronal from non-neuronal components. Apart fromvoxel-wisestatistics,graphtheorycouldbeappliedtothefunctionalnetworkswhichprovidestoolsforanalysisofnetworktopographyandconnectivity(Rubinov&Sporns,2010).Functionalandstructuralcon-nectomeanalysishasbecomeincreasinglycommoninneuroscience.Inthesemethods,thebrainisdefinedabstractlyasanetworkofnodeswithedgesconnectingthem.Nodesareoftenanatomicallydefinedre-gions,whereasedgestypicallycarryweightsdescribingthecorrelation,
similarity,ordegreeofconnectivitybetweennodes.Adjacencygraphs,inwhich the edge’s existence is binary and carry no representativeweight, are also common, as data-driven approaches for brain par-cellation(Bullmore&Bassett,2011).Usually,aweightedgraphW iscreatedbycalculatingaconnectivitymeasurebetweeneverypairofregions;subsequently,themeaningfulpropertiesofthegrapharecar-riedoutbynetworkanalysismethods,suchassummarystatistics(e.g.,degree, small-worldness) and permutation testing (Zalesky, Fornito,&Bullmore,2010).Toourknowledge,nographtheoryapproachhasbeendevelopedtoevaluatetheorganizationpropertieswithinbrainnetworks derived from ICA.A graphical method permits to extractpropertiesofaregionofinterestinthecontextofthefullnetwork.Acomparisonofgraphicalpropertiesgoes farbeyondthecomparisonofthezvalues,ascommonlydonewiththecomparisonofICspatialmapsvoxel byvoxel,where eachvoxel is treated as a separate en-tityandnot considered in thecontextof the full brain spatialmap.Themethodwepresenthereincorporatespiecesofbothfamiliesofmethodsanditisageneralizationtotheentirebrainofapreviouslyintroducedapproachrestrictedtothedefaultmodenetwork (DMN)to study functional connectivity changes in patientswith disordersof consciousness (Soddu etal., 2012). Following, this approach hasbeenalsoappliedinpatientssufferingfromtinnitusfocusingontheauditorynetwork(Maudouxetal.,2012a,2012b).Wedobelievethatourmethod,fortheveryfirsttime,permitsacomparisonofICspatialmapsusingtheadvantageofgraphtheory.
2 | METHODS
In short,weused ICAandmachine learningclassification to isolateasetofneuronalcomponents(Demertzietal.,2014),andthencon-structweighted graphs for each of these components. As in otherfunctionalandstructuralconnectivitymappingmethods,wedefinedour regionsbasedonstructuralparcellation (Cammounetal.,2012;Gerhard etal., 2011). As the parcellation concerned cortical areasonly,thecerebellumwasnothereconsideredasanetworkofinterest,
networkswithregardtotheaveragedegreeandthenumberofedges,whilethevisuallateralnetworkshowedasignificantdifferenceinthesmall-worldness.Conclusions:Thisnovelapproachpermitsustotakeadvantageofthewell-recognizedpowerof ICA inBOLDsignaldecompositionand,at thesametime,tomakeuseofwell-establishedgraphmeasures toevaluateconnectivitydifferences.Moreover,byproviding a graph for each separate network, it can offer the possibility to extractgraphmeasuresinaspecificwayforeachnetwork.Thisincreasedspecificitycouldberelevantforstudyingpathologicalbrainactivityoralteredstatesofconsciousnessasinducedbyanesthesiaorsleep,wherespecificnetworksareknowntobealteredindifferentstrength.
K E YWORD S
BOLDfMRI,graphtheory,independentcomponentanalysis,restingstate

| 3 of 12RIBEIRO dE PAULA Et AL.
reducingthenumberofICAmapsanalyzedtonine.Theedgeweight-inginthegraphswasfairlyuniquetothismethod,anddependedonanode-basedcalculationofthecontributionofthespecificcompo-nenttotheaverageBOLDsignal inthatregion.Wethencalculatedtheweight (dependenton themagnitude and typeof contribution)betweeneachpairofnodesthatreflectsthesimilaritybetweenthemthroughacommonsimilaritywiththetimecourseofthecomponentof interest. This approach provided weighted within-componentgraphsthatarerelatedtodistinctandknowncognitivefunctionsandcouldbequantifiedbyusinggraphtheory.Inprinciple,thistechniquecanbeappliedtoanyindependentcomponentmap.
2.1 | Subjects
Fifteen(meanage=43±15,7women)healthysubjects,freeofpsy-chiatricorneurologicalhistory,werestudied.TheEthicsCommitteeoftheMedicalSchoolattheUniversityofLiègeapprovedthestudy.Informedconsenttoparticipateinthestudywasobtainedfromeverysubject.
2.2 | Dataacquisitionandpreprocessing
FunctionalMRI time serieswere acquired on a 3T head-only scan-ner (Siemens Trio, Siemens Medical Solutions, Erlangen, Germany)operatedwithastandardtransmit-receivequadrateheadcoil.Threehundred multislice T2*-weighted functional images were acquiredwith a gradient-echo echo-planar imaging sequence using axialsliceorientationandcovering thewholebrain (32 slices;voxel size:3 × 3 × 3 mm3;matrix size64×64×32; repetitiontime=2,000ms;echo time=30ms; flip angle=78°; field ofview=192×192mm2).The three initialvolumeswerediscarded to avoidT1 saturationef-fects.Thesubjectswereinstructedtoclosetheireyes,relaxwithoutfallingasleepandrefrainfromanystructuredthinkingsuchascount-ing, singing etc. A high-resolution T1-weighted imagewas also ac-quiredforeachsubject (120slices,repetitiontime=2,300ms,echotime=2.47ms, voxel size=1×1×1.2mm3, flip angle=9°, field ofview=256×256mm2). Data preprocessing was performed usingStatisticalParametricMapping8(RRID:nif-0000-00343;www.fil.ion.ucl.ac.uk/spm).Preprocessingstepsincludedrealignmentandadjust-mentformovement-relatedeffects,coregistrationoffunctionalwithstructural images, segmentationof structuraldata, spatialand func-tionalnormalizationintostandardstereotacticMontrealNeurologicalInstitute space, and spatial smoothing of the fMRI data with aGaussiankernelof8mmfull-widthathalf-maximum.Furthercorrec-tionforsmall,large,andrapidmotions,noisespikes,andspontaneousdeepbreathswasappliedusingArtRepair (RRID:SCR-005990;cibsr.stanford.edu/tools/human-brain-project/artrepair-software.html).
2.3 | Independentcomponentanalysisandcomponentclassification
Single-subjectindependentcomponentanalysiswasperformedusingtheInfomaxalgorithmwithintheGroupICAoffMRIToolbox(RRID:
SCR-001953; http://mialab.mrn.org/software/gift/) with a prede-finednumberofcomponentsequaltothirty.Thecomponentspatialimageswerecalibratedtotherawdatasothatthe intensityvalueswereinunitsofpercentsignalchangefromthemean.Componentsweresubsequentlyassignedtotheputativeintrinsicconnectivitynet-works using amultiple-templatematching procedure. Thismethodextends the single-template goodness-of-fit approach by assigningtheindependentcomponentthatmaximizesthegoodness-of-fittoabinarypredefinedtemplatewhileconsideringalloftheRSNssimul-taneously.Thisprocedurehasbeendescribedpreviously (Demertzietal.,2014).
For the discrimination between “neuronal” and “non-neuronal”independentcomponents,abinaryclassificationapproachusingsup-portvectormachine(SVM)wasperformed.ThetrainingoftheSVMclassifierwasperformedonthefingerprintsoftheindependentcom-ponents obtained from ICA decompositionwith 30 components in19 independently studied healthy subjects (Demertzi etal., 2014).The classifier with highest overall classification rate was selectedand subsequently used to label neuronal independent components.Independent components that failed to pass the “neuronality” testwereexcluded.SeeFigure1aforapictorialdescriptionoftheabove-describedprocedure.
2.4 | Regionalparcellation
Segmentation of each subject’s T1-weighted imagewas performedwith Freesurfer’s automatic segmentationpipeline and theDesikanKilliany atlas (De Luca etal., 2006). Further parcellation, using theLausanne2008atlas and its1,015 individually labeled regions,wasdonewithfunctionsfromtheConnectomeMappingToolkit,inordertoseparatedifferentICA-derivednetworksintonon-overlappingspa-tialcomponents(Cammounetal.,2012;Daduccietal.,2012;Gerhardetal.,2011;Gorgolewskietal.,2011).Tofacilitatethecreationofthefunctionalnetworks,thistypeofparcellationwasperformedforboththeoriginalandspatiallynormalizedT1imagesforeachsubject.SeeFigure1bforanillustrativedescriptionofthefinalparcellation.
2.5 | Functionalnetworkconstruction
Inthefollowing,thelettersN,PandRwillrefertothenumberofICAneuronalcomponents(N),thenumberofBOLDsignaltimepoints(P)andthenumberofparcellatedregions(R),respectively.
LetX a N × PmatrixstoringattheithrowthetimecourseoftheithindependentcomponentandY a R × PmatrixcontainingattheithrowthetimecourseoftheBOLDsignalaveragedoverthevoxelbelong-ingtotheithregion.Theprocessofidentifyingregionaltime-coursesacrossasetofanatomicallydefinedvoxelsisshowninFigure1c.Wesolvethesimpleequation:
for theN × Rmatrix β, using the least squares solution (Worsley&Friston,1995).Thismeansminimizingthevalueof:
(1)Y=Xβ
(2)‖Y−Xβ‖2
4 of 12 | RIBEIRO dE PAULA Et AL.
withanerrortermε,foreveryregionandeachcomponent:
The regression value βij describes how the time course of thejthregioncanbeexplainedbythe ith independentcomponenttimecourseplusanerrorterm.Theregressionvaluesare,however,valuesof arbitrary size andvariance and cannot be interpreteddirectly. Inordertodealwiththisissue,wechosetotransformthesevaluesintot-values(Worsley&Friston,1995),usingthefollowingequation:
where c isavectorindexingeachcomponent,andT isthematrixoft-values by region and IC. At this point, we have regional t-values
for each component,which can be used to buildweighted graphs,Figure1c.Thegoalistochooseanappropriateweightingschemesuchthatedgesarestrongbetweenregionswhichbothcontributelargely,andwithsimilarstrengths,totheregionalfMRItimecourse.Forthisreason,wehavechosenastraightforwardweightingequationforthedegreeofconnectionbetweentwonodes:
where Wa,brepresentstheedgeweightbetweennodesaandb,andta,tbarethet-valuesfornodeaandb,respectively.
Equation5 produces a zero weight for ta and tb with oppositesigns.Here,werestraintheanalysistopositivecorrelationnetworksonly,forwhichaconnectionisconsideredonlybetweennodeswitht-valuesofthesamesign.Itisalsopossibletoconstructthecomple-mentaryanti-correlationnetworks,bydrawingedgesbetweenregions
(3)ε=Y−Xβ
(4)T=cTβ
√Var(ε)cT(XTX)
−1c
(5)Wa,b= |ta|+ |tb|− |ta− tb|
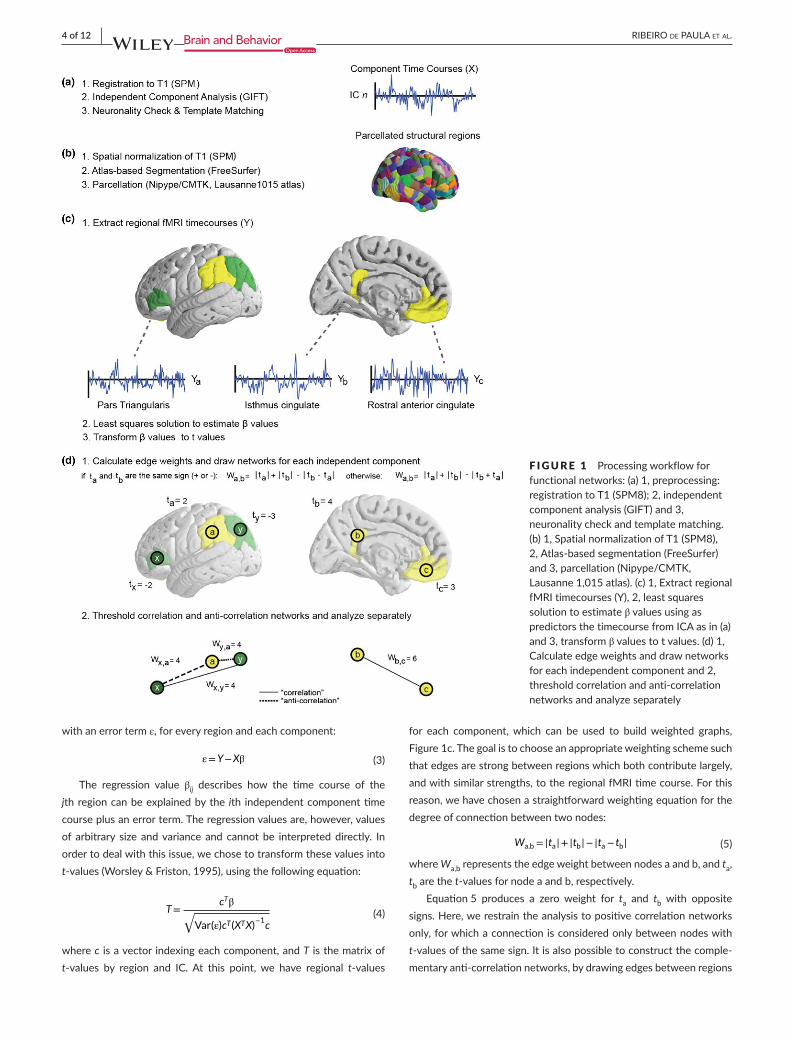
F IGURE 1 Processingworkflowforfunctionalnetworks:(a)1,preprocessing:registrationtoT1(SPM8);2,independentcomponentanalysis(GIFT)and3,neuronalitycheckandtemplatematching.(b)1,SpatialnormalizationofT1(SPM8),2,Atlas-basedsegmentation(FreeSurfer)and3,parcellation(Nipype/CMTK,Lausanne1,015atlas).(c)1,ExtractregionalfMRItimecourses(Y),2,leastsquaressolutiontoestimateβvaluesusingaspredictorsthetimecoursefromICAasin(a)and3,transformβvaluestotvalues.(d)1,Calculateedgeweightsanddrawnetworksforeachindependentcomponentand2,thresholdcorrelationandanti-correlationnetworksandanalyzeseparately

| 5 of 12RIBEIRO dE PAULA Et AL.
withopposingsigns.Forcreatingweightededgesbetweennodesofoppositesign,thefollowingequationcanbeused:
2.6 | Thresholdingnetworkedges
Weestimatedthedegrees-of-freedombyconsideringthenumberoffunctional image volumes and the number of independent compo-nentsinournetworkconstructionprocedure.Thisledtotheequation:
Given thedegreesof freedomand thedesiredsignificance level(p<.001), we calculated the t-value with which to threshold ourgraphs.Wechose to thresholdournetworks to removeall t-valuesthatwerenotinthe99thpercentile.Thisledtothecalculation:
Following the weighting scheme described in Equation5, thenodescanhaveedgeweightsrangingfromzerotothesumoftheirt-values.Forthisreason,wechosetodiscardedgesabove2×tthresh-oldwith2×tthresholdbeingthemaximumvalueforWa,bgiventheas-sumed tthreshold.Group levelnetworks, aspresented inFigures2–6,werecreatedbythresholdingeachsubjectweightedmatrixWa,bandby subsequently keeping the edgeswhichwere present in at least25%ofthesubjects.
2.7 | Classicalnetworkconnectivitymatrix
Withtheaimofthecreationofawhole-brainconnectivitymatrix,wereconstructedthefunctionalMRIsignalateachvoxelbya lin-earcombinationofthecomponentsdeemed“neuronal”bytheclas-sifierwithweights coming from the corresponding scalarmapsof
each component. The resulting signal, cleaned off “non-neuronal”noise,wasthenaveragedoverallthevoxelsbelongingtothesameparcellatedregiontoobtaintimecoursesforeachofthe1,015re-gions.TheWmatrix, representingtheclassicalnetwork,was thencalculated.
2.8 | Networkanalysisandstatistics
Nodesforeachnetworkofinterestwerepreviouslyextractedasthenon-isolatednodesofthecorrespondinggrouplevelnetworksprevi-ouslyintroducedandpresentedinFigures2–6.Wehaveconsideredseveralnetworksummarystatisticsforthegraphs.Wecomputedthenumberofedges(E),averagedegree(k),averagenumberoftrianglesandsmall-worldness (Rubinov&Sporns,2010)asshowninTable1.A graph is a formalmathematical representation of a network andeach object in a graph is called a node. The number of edges rep-resentsthenumberofconnectionsbetweeneachpairofconnectednodes.The averagedegree represents the averagenumberof con-nections(edges)pernode.Isolatednodes(nodeswithoutedges)werediscardedandallthepropertieswerecalculatedfortheconstellationof connected nodes. The number of triangles represents triplets ofnodesinwhicheachnodeisconnectedtothetwoothers.Thesmall-worldnesswascalculatedby:
where CandCrandaretheclusteringcoefficientsandLandLrand are the characteristic path lengths of the network of interest and thecorrespondingrandomnetwork(Humphries&Gurney,2008).Small-worldness is an extremely important property of networks. Thesenetworks are “highly clustered, like regular lattices, yet have smallcharacteristicpathlengths,likerandomgraphs”makingthemveryef-ficientininformationtransfer(Watts&Strogatz,1998).
(6)WACa,b
= |ta|+ |tb|− |ta+ tb|
(7)DOF=Nvolumes−Ncomponents−1
(8)tthreshold= tINV(Confidence, DOF)
(9)σ=C∕Crand
L∕Lrand
F IGURE 2 SagittalandaxialrepresentationofthenetworkandcorticalextentoftherelativeICfortheDMN.Thedegreeofeachoneofthe1,015regionsisrepresentedbythenode’ssizeandorangetoyellowgradient.Ontheright,corticalparcellationforDMNextractedbygroup-ICAsuperimposedtoastructuralT1image
6 of 12 | RIBEIRO dE PAULA Et AL.
Thepropertieswere calculated at subject-level producing adis-tributionofgraphicalvaluesforthenetworkofinterest.Thismethodwasusedtocomparethegraphproperties(Table1)amongthediffer-entnetworksasshowninFigure7.AnANOVAtestwasperformedtocompareallthenineweightedfunctionalnetworkswiththeweightedclassical network.The calculation for both networkswas restrictedonly to the nodes belonging to the network of interest due to thenumberofnodesofanetworkhaveanstrongeffectinresultingtopol-ogy(Zalesky,Fornito,Harding,etal.,2010).Column3inTable1showsthenumberofnon-isolatednodesforeachnetwork.Forthenumberoftriangles,thecomparisonwasperformedbyfirstlynormalizingthenumberoftrianglesbyarandomnetworkcontainingthesamenumberofnodes.
Todeterminewhich networks are different from theothers,weconductedaposthocpairedcomparison(Tukeyposthoctestasim-plementedinR),whichisdesignedtoevaluatethedifferencebetweeneachpairofnetworks,Figure7.
3 | RESULTS
3.1 | Componentclassification
Thetemplate-matchingandfingerprintselectioncriteriaidentifiedthepredefinedneuronalcomponentswithinthegroupofhealthycontrols.Thepercentageofsubjects inwhichtheywerefound ispresentedinthesecondcolumninTable1.TheSensorimotorwasthehighestrecognizednetwork,withthescoreofdetectionequalto87%ofthesubjects.Theexecutivecontrolleftandvisualoccipi-talnetworkswerethelowestrecognizednetworks,beingpresentin33%of the subjects. ICAwasused to separate the signal intonon-overlapping spatial and time components. This data-drivenmethodwasabletoextract theDMNaswellasmanyothernet-works with very high consistency, that can be verified by com-paring Figures2–6with the z-maps produced using the classicalapproach.
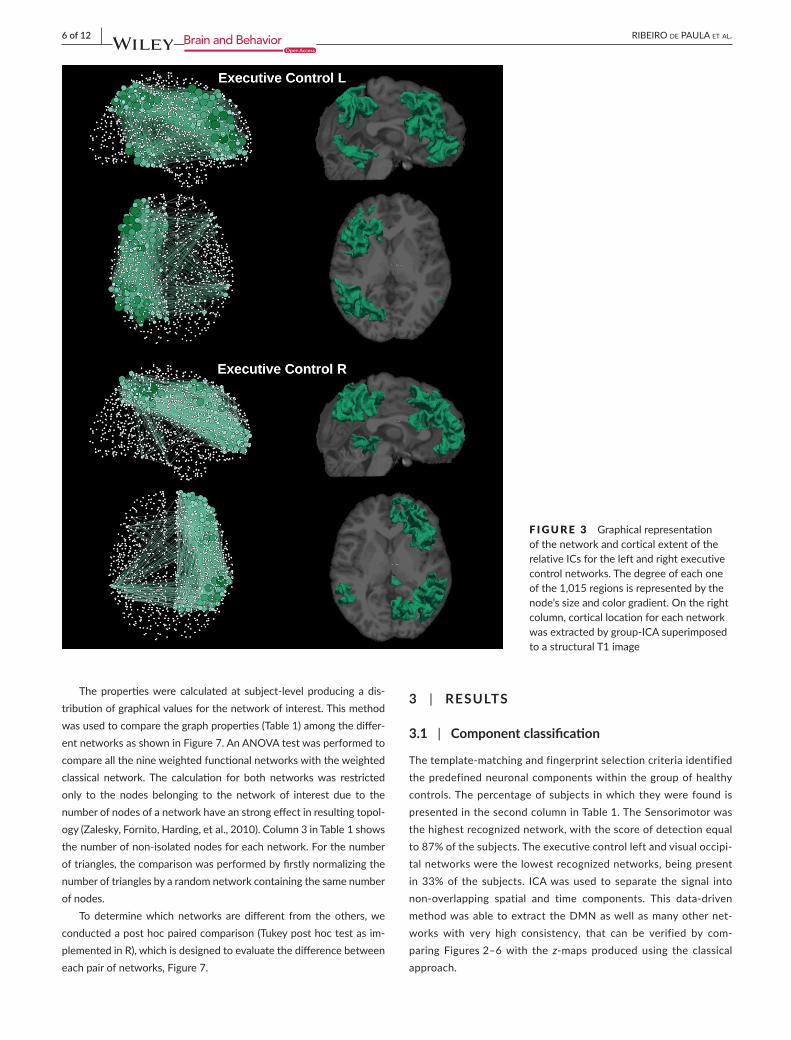
F IGURE 3 GraphicalrepresentationofthenetworkandcorticalextentoftherelativeICsfortheleftandrightexecutivecontrolnetworks.Thedegreeofeachoneofthe1,015regionsisrepresentedbythenode’ssizeandcolorgradient.Ontherightcolumn,corticallocationforeachnetworkwasextractedbygroup-ICAsuperimposedtoastructuralT1image

| 7 of 12RIBEIRO dE PAULA Et AL.
3.2 | Networkproperties
The network properties were calculated for the nine independentcomponentnetworksof interest forall the15subjects.The resultsareshowninTable1.
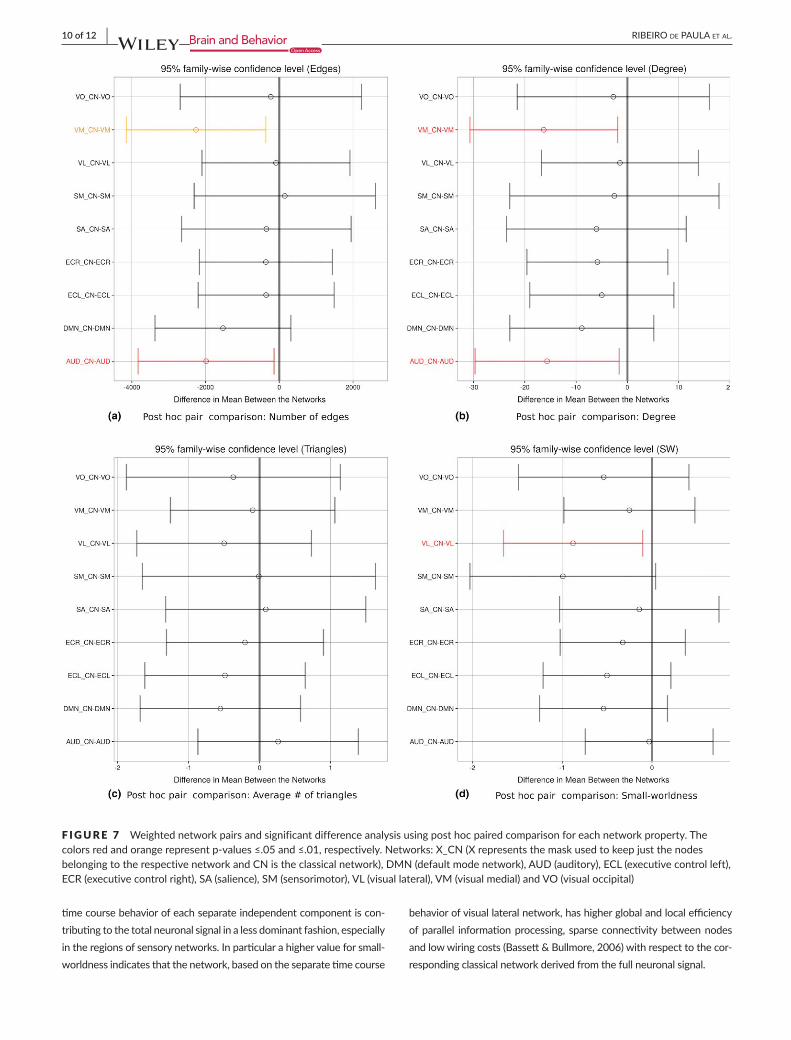
Whencomparingeachoftheninenetworkswiththeclassicalnet-work,focusingonlyontheconstellationofnodescharacterizingthenetworkofinterest,seeFigure7,wefoundthattheauditoryandthevisualmedialnetworkshadasignificantlydifferentnumberofedgesanddegreewithrespecttotheclassicalnetwork.Alternatively,whencomparingsmall-worldnessitwasthevisuallateralnetworkshowingasignificantlydifferentvaluefromtheclassicalnetwork.Nosignificantdifferenceswerefoundforthenormalizednumberoftriangles.(SeeintheTableS1forgraphpropertiesandFigureS1forasimilarANOVAanalysisperformedthistimeoverallthe1,015nodes).
The sagittal and axial graphical representationsof thenetworks,as created from the respective group level matrixW, are shown in
Figure8 (all nine overlapping networks and the classical network).Theywerealsopresentedseparately,DMNinFigure2,executivecon-trolleftandexecutivecontrolrightinFigure3,auditoryandsalienceinFigure4,sensorimotorandvisuallateralinFigure5andvisualmedialandvisualoccipitalinFigure6.AsshowninFigure8,thenodeswiththehighestdegreeoftheclassicalnetworkarealsothenodeswiththehighestaveragedegreesharedby theninedifferentnetworks.FromFigures2–6itisalsopossibletorecognizethattheclustersofnodeswithhigherdegreetendtobespatiallydistributedasthehighz-valueinthecorrespondingindependentcomponentz-mapforthespatialpat-ternsofthenineindependentcomponents(Damoiseauxetal.,2006).
4 | DISCUSSION
Wepresentedanovelmethod forapplyinggraph theorymetrics torestingstatefMRIbrainnetworksderivedfromdata-drivenICA.With
F IGURE 4 GraphicalrepresentationofthenetworkandcorticalextentoftherelativeICsforauditoryandsaliencenetworks.Thedegreeofeachoneofthe1,015regionsisrepresentedbythenode’ssizeandcolorgradient.Ontherightcolumn,corticallocationforeachnetworkwasextractedbygroup-ICAsuperimposedtoastructuralT1image
8 of 12 | RIBEIRO dE PAULA Et AL.
thiswithin-componentapproach,thebetween-grouptopologicaldif-ferencesinconnectivestructureoffunctionalnetworkscanbestud-iedwithwell-establishednetworkmeasuresemployedingraphtheory.
ClassicalapproachesarebasedontherecognitionofRSNsfromdifferent ICAprocessingresults,suchasmultipletemplate-matching(Demertzietal.,2014),highdimensionalICA(Dipasqualeetal.,2015)and fully exploratory network ICA (Schöpf etal., 2010); once eachRSN is estimated, their spatial distributions are usually comparedvoxel-wisebetweensubjectsorgroupsfortheassessmentofwithin-networkdifferences.Ontheotherhand,atthebestofourknowledge,thereisnotyetaneffectiveprocedurefortheanalysisandcomparisonofgraphpropertiesbetweennetworkcomponentsderivedfromspa-tialICAprocedures.
Asimilarapproachhasbeenproposedfortheanalysesofwithin-networkorganization.In(Parketal.,2014),analternativemethodfortheestimationofeachRSNisemployed.Asourmethod,itprovidesinformation on the connectivity among each component, but eachcomponent isnotderivedwithaconventionalspatial-ICAapproach.
Therefore,ourmethodoffersmoreflexibility,sinceitdealswithcom-monly derived ICA components, exploiting thewell-established ad-vantageofspatialICAfortherejectionofartifactualcomponents.
Comparisonbetweentheninenetworksandtheclassicalnetworkdidnot show, formost of the comparisons, significant differences inthestudiedgraphproperties,which indicatessimilarity in theirgraphstructure.Theabsenceofmaindifferences is also indicating the factthatwhenrestrictingtonetwork’sregions,connectivityduetothetimecoursebehaviorrepresentativeoftheICofinterestiscapturingalmostentirelythefullneuronalbehavior.(FigureS1insupplementarymaterialshows clearly thatwhenextending the analysis to the full brain, i.e.,1,015nodes,deviationof theclassicalnetwork from thenetworkofinterestbecomemorerelevant,consideringthatnow,asexpected,out-sidetheconstellationofnodesrepresentativeofthenetworkofinteresttheclassicalnetworkgetscontributionsfromalltheothernetworks).
Thesignificantdifferencesinthenumberofedgesanddegree,forthe auditory andvisualmedial networks togetherwith the significantsmall-worldnessfor thevisual lateralnetwork,aresuggestingthat the
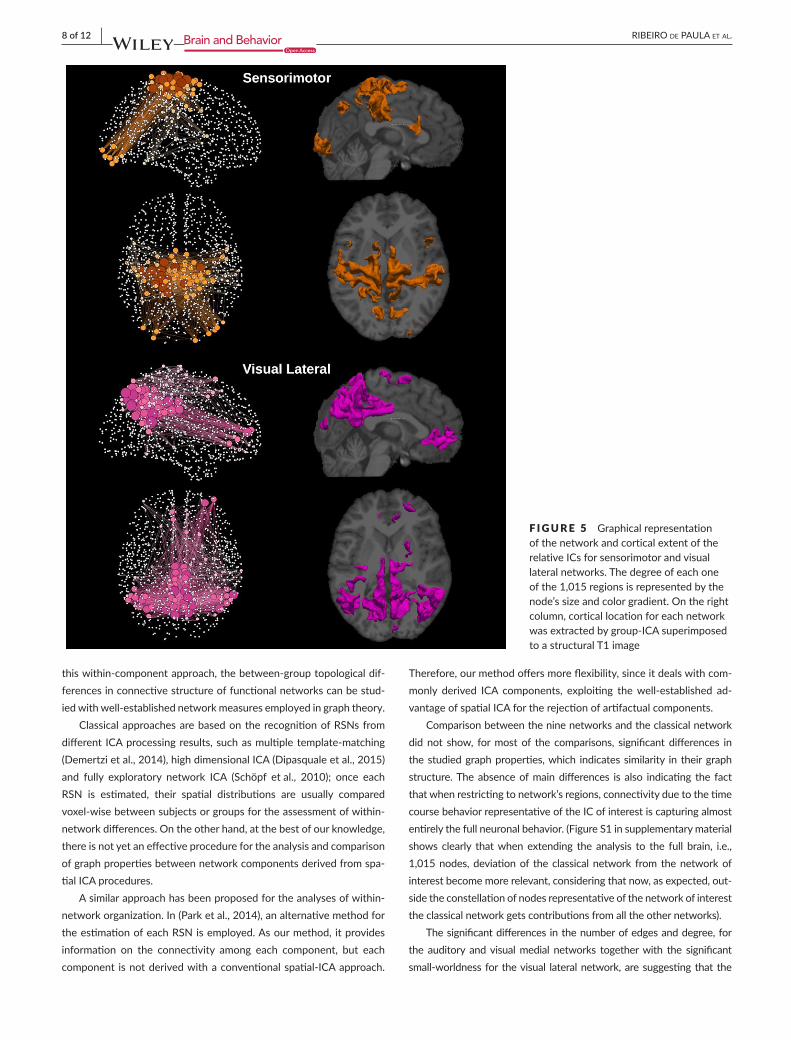
F IGURE 5 GraphicalrepresentationofthenetworkandcorticalextentoftherelativeICsforsensorimotorandvisuallateralnetworks.Thedegreeofeachoneofthe1,015regionsisrepresentedbythenode’ssizeandcolorgradient.Ontherightcolumn,corticallocationforeachnetworkwasextractedbygroup-ICAsuperimposedtoastructuralT1image

| 9 of 12RIBEIRO dE PAULA Et AL.
Type % No.ofnodes E (103) k Triangles(103) σ
AUD 80 265 15±2 144±9 1.13±0.02 1.18±0.03
DMN 47 356 26±4 167±14 1.28±0.03 1.41±0.05
ECL 33 153 6±1 84±5 1.53±0.04 1.88±0.07
ECR 80 131 9±1 105±7 1.51±0.03 1.86±0.06
SA 80 116 17±7 115±30 1.10±0.04 1.14±0.06
SM 87 102 5±1 80±13 1.44±0.09 1.68±0.16
VL 60 133 14±3 121±15 1.34±0.06 1.58±0.10
VM 73 277 22±2 174±12 1.24±0.04 1.38±0.06
VO 33 183 10±1 123±10 1.38±0.09 1.61±0.18
Thepropertieswerecalculatedforeachsubject.Themeasureofvariabilityisreportedwiththemean.Networks:AUD,auditory;DMN,defaultmodenetwork;ECL,executivecontrol left;ECR,executivecontrolright;SA,salience;SM,sensorimotor;VL,visuallateral;VM,visualmedialandVO,visualoccipi-tal.Theproperties:%,percentageofsubjectsthathavetherespectivenetwork;No.ofnodes,numberofconnectednodesamongthe1,015possiblenodes;E,NumberofEdges;k,averagedegreeandσ,Small-WorldnessIndex.
TABLE 1 Graphtheoreticalmetricsforthenineindependentcomponentmaskednetworks
F IGURE 6 GraphicalrepresentationofthenetworkandcorticalextentoftherelativeICsforvisualmedialandvisualoccipitalnetworks.Thedegreeofeachoneofthe1,015regionsisrepresentedbythenode’ssizeandcolorgradient.Ontherightcolumn,corticallocationforeachnetworkwasextractedbygroup-ICAsuperimposedtostructuralT1image
10 of 12 | RIBEIRO dE PAULA Et AL.
timecoursebehaviorofeachseparateindependentcomponentiscon-tributingtothetotalneuronalsignalinalessdominantfashion,especiallyintheregionsofsensorynetworks.Inparticularahighervalueforsmall-worldnessindicatesthatthenetwork,basedontheseparatetimecourse
behaviorofvisuallateralnetwork,hashigherglobalandlocalefficiencyofparallel informationprocessing, sparseconnectivitybetweennodesandlowwiringcosts(Bassett&Bullmore,2006)withrespecttothecor-respondingclassicalnetworkderivedfromthefullneuronalsignal.
F IGURE 7 Weightednetworkpairsandsignificantdifferenceanalysisusingposthocpairedcomparisonforeachnetworkproperty.Thecolorsredandorangerepresentp-values≤.05and≤.01,respectively.Networks:X_CN(XrepresentsthemaskusedtokeepjustthenodesbelongingtotherespectivenetworkandCNistheclassicalnetwork),DMN(defaultmodenetwork),AUD(auditory),ECL(executivecontrolleft),ECR(executivecontrolright),SA(salience),SM(sensorimotor),VL(visuallateral),VM(visualmedial)andVO(visualoccipital)

| 11 of 12RIBEIRO dE PAULA Et AL.
Adrawbackof theprocedure is that it reliesona spatiotempo-ral “neuronality” check and template matching procedure prior tonetworkcreation. It isobvious that the templatematchingwillonlyworkproperlyifthesubjects’brainactivitypatternsfitthepredefinedtemplates. Pathological brain morphology may affect network pre-sentation, however, we do not know inwhich form the functionalnetworkswill appear. Itmaybeattractive toperform some typeofcomponentclusteringtoobtaindata-drivensetsofthegroups’mostcommon graph types. Component clustering has been performedrepeatedly inICAanalysesusingvolumetricdata,aswellas inothergraph-theoreticalstudies (vandenHeuvel,Mandl,&Pol,2008). It isnotclearwhichparameterstheclusteringalgorithmwouldneedtobebasedon,butsomesuitablecandidatescouldbelocaledgeweightandnodalnetworkmetrics.Finally,itisclearthatnewmethodcouldbede-velopedatthesinglesubjectleveltoselectthecomponentofinterest.Infact,forexample,giventheselectionofnodesthatformanetwork(aprioriknowledge)foracomponentof interest,an ICcouldbese-lectedasthecomponentwiththehighestaveragenumberofedgesintheselectedconstellationofnodes.Therefore,thisapproachcouldbe quite appealing to patients suffering severe brain injury, consid-eringthatthenetworksmightbehighlyaffected.Forthesepatients,structuralinformationcouldbeusedtoindicatethepartialselectionofnodeswhichwewouldliketofocuson,andsimplyselectthecom-ponentbasedonthehighestaveragenumberofedgesforthenewlyselectedconstellationofnodes.
5 | CONCLUSIONS
Wepresentedanapproachfortheanalysisofrestingstatenetworkscarriedoutbydissectingtheconnectivitypatternsoftask-freefMRIdatabyusingICA.Ourresultssuggestthat,byevaluatingindependentcomponentnetworksusinggraphtheoryinsteadofusingvolumetric
data,onecouldtakefulladvantageofgraphicalmethods,whichper-mitthecomparisonoflocalpropertiesinthecontextofthefullbrain.Moreover,ourapproachisthebasisforfurtherrefinementssuchasacomponentclusteringbasedonnetworktopology.Similarly,theinitialinvestigation into the anti-correlationnetworks for the15 subjectsstudied here showed wide variability in structural topology, and itneedstobefurtherinvestigated.Infuture,onecouldselectivelycon-nectedgesbasedonthesignoftwonodest-valuesandexplorethedifferencesbetweengraphscreatedwithdifferingparity.
ACKNOWLEDGMENTS
This research was supported by the Canada Excellence ResearchChairs (CERC), the James S. McDonnell Foundation (JSMF) pro-grams,adiscoverygrantfromtheNaturalSciencesandEngineeringResearch Council of Canada (NSERC), the Belgian National FundforScientificResearch,theUniversityofLiege,theQueenElisabethMedical Foundation, the Leon Fredericq Foundation, the BelgianInter-UniversityAttractionProgram, theWalloon Excellence in LifeSciences and Biotechnology program, and the Marie Curie InitialTrainingNetworkinNeurophysics(PITN-GA-2009-238593).
CONFLICTOFINTEREST
Nonedeclared.
REFERENCES
Bassett, D. S., & Bullmore, E. (2006). Small-world brain networks. The Neuroscientist,12,512–523.
Beckmann, C. F., DeLuca, M., Devlin, J. T., & Smith, S. M. (2005).Investigationsintoresting-stateconnectivityusingindependentcom-ponentanalysis.Philosophical Transactions of the Royal Society of London B: Biological Sciences,360,1001–1013.
F IGURE 8 Sagittalandaxialrepresentationofallninenetworks(defaultmodenetwork,executivecontrolleft,executivecontrolright,visuallateral,visualmedial,visualoccipital,auditory,sensorimotorandsalience)overlappedandclassicalnetwork,withthreshold0.45.Theaveragedegreeofeachnodeisrepresentedbythenode’ssizeandcolorgradient

12 of 12 | RIBEIRO dE PAULA Et AL.
Biswal,B.,Yetkin,F.Z.,Haughton,V.M.,&Hyde,J.S. (1995).Functionalconnectivity in themotorcortexof restinghumanbrainusingecho-planarMRI.Magnetic Resonance in Medicine,34,537–541.
Bullmore,E.T.,&Bassett,D.S.(2011).Braingraphs:Graphicalmodelsofthehumanbrainconnectome.Annual Review of Clinical Psychology,7,113–140.
Cammoun,L.,Gigandet,X.,Meskaldji,D.,Thiran,J.P.,Sporns,O.,Do,K.Q.,…Hagmann,P.(2012).MappingthehumanconnectomeatmultiplescaleswithdiffusionspectrumMRI.Journal of Neuroscience Methods,203,386–397.
Daducci,A.,Gerhard,S.,Griffa,A.,Lemkaddem,A.,Cammoun,L.,Gigandet,X.,…Thiran, J.-P. (2012).The connectomemapper:An open-sourceprocessing pipeline to map connectomes with MRI. PLoS One, 7,e48121.
Damoiseaux,J.,Rombouts,S.,Barkhof,F.,Scheltens,P.,Stam,C.,Smith,S.M.,&Beckmann,C.(2006).Consistentresting-statenetworksacrosshealthysubjects.Proceedings of the National Academy of Sciences,103,13848–13853.
DeLuca,M.,Beckmann,C.,DeStefano,N.,Matthews,P.,&Smith,S.(2006).fMRIrestingstatenetworksdefinedistinctmodesoflong-distancein-teractionsinthehumanbrain.NeuroImage,29,1359–1367.
Demertzi, A., Gómez, F., Crone, J. S., Vanhaudenhuyse, A., Tshibanda,L., Noirhomme, Q., Thonnard, M., Charland-Verville, V., Kirsch, M.,Laureys, S.,&Soddu,A. (2014).Multiple fMRI system-level baselineconnectivity is disrupted in patientswith consciousness alterations.Cortex,52,35–46.
Dipasquale, O., Griffanti, L., Clerici, M., Nemni, R., Baselli, G., & Baglio,F. (2015). High-Dimensional ICA Analysis Detects Within-NetworkFunctionalConnectivityDamageofDefault-ModeandSensory-MotorNetworksinAlzheimer’sDisease.Frontiers in Human Neuroscience,9,43.
Esposito,F.,Aragri,A.,Pesaresi,I.,Cirillo,S.,Tedeschi,G.,Marciano,E.,…DiSalle,F.(2008).Independentcomponentmodelofthedefault-modebrain function:Combining individual-level andpopulation-level anal-ysesinresting-statefMRI.Magnetic Resonance Imaging,26,905–913.
Fox,M.D.,&Raichle,M.E.(2007).Spontaneousfluctuationsinbrainac-tivity observedwith functional magnetic resonance imaging.Nature Reviews Neuroscience,8,700–711.
Fox,M.D.,Snyder,A.Z.,Vincent,J.L.,Corbetta,M.,VanEssen,D.C.,&Raichle,M.E.(2005).Thehumanbrainisintrinsicallyorganizedintody-namic,anticorrelatedfunctionalnetworks.Proceedings of the National Academy of Sciences of the United States of America,102,9673–9678.
Gerhard, S., Daducci, A., Lemkaddem, A., Meuli, R., Thiran, J.-P., &Hagmann,P. (2011).Theconnectomeviewertoolkit:anopensourceframeworktomanage,analyze,andvisualizeconnectomes.Frontiers in Neuroinformatics,5,3.
Gorgolewski, K., Burns, C. D., Madison, C., Clark, D., Halchenko, Y. O.,Waskom,M.L.,&Ghosh,S.S. (2011).Nipype:aflexible, lightweightand extensible neuroimaging data processing framework in Python.Frontiers in Neuroinformatics,5,13.
Greicius,M.D.,Srivastava,G.,Reiss,A.L.,&Menon,V. (2004).Default-modenetworkactivitydistinguishesAlzheimer’sdiseasefromhealthy
aging: Evidence from functional MRI. Proceedings of the National Academy of Sciences of the United States of America,101,4637–4642.
Humphries, M. D., & Gurney, K. (2008). Network ‘small-world-ness’: Aquantitativemethod fordeterminingcanonicalnetworkequivalence.PLoS One,3,e0002051.
Hyvärinen,A.,Karhunen,J.,&Oja,E.(2001).Independent component analy-sis.NewYork,NY:Wiley.xxi,481s.p.
Maudoux,A.,Lefebvre,P.,Cabay,J.-E.,Demertzi,A.,Vanhaudenhuyse,A.,Laureys,S.,&Soddu,A.(2012a).Auditoryresting-statenetworkcon-nectivityintinnitus:AfunctionalMRIstudy.PLoS One,7,e36222.
Maudoux,A., Lefebvre, P., Cabay, J.-E., Demertzi,A.,Vanhaudenhuyse,A., Laureys, S.,&Soddu,A. (2012b).Connectivitygraphanalysisoftheauditoryrestingstatenetwork intinnitus.Brain Research,1485,10–21.
Park,B.,Kim,D.-S.,&Park,H.-J. (2014).GraphIndependentComponentAnalysisRevealsRepertoiresofIntrinsicNetworkComponentsintheHumanBrain.PLoS One,9,e82873.
Rubinov,M.,&Sporns,O.(2010).Complexnetworkmeasuresofbraincon-nectivity:Usesandinterpretations.NeuroImage,52,1059–1069.
Schöpf,V.,Kasess,C.H.,Lanzenberger,R.,Fischmeister,F.,Windischberger,C.,&Moser, E. (2010). Fully exploratory network ICA (FENICA) onresting-statefMRIdata.Journal of neuroscience methods,192,207–213.
Soddu, A., Vanhaudenhuyse, A., Bahri, M. A., Bruno, M.-A., Boly, M.,Demertzi,A.,…Noirhomme,Q. (2012). Identifyingthedefault-modecomponent in spatial IC analyses of patientswith disorders of con-sciousness.Human Brain Mapping,33,778–796.
vandenHeuvel,M.,Mandl,R.,&Pol,H.H.(2008).Normalizedcutgroupclusteringofresting-stateFMRIdata.PLoS One,3,e2001.
Watts,D.J.,&Strogatz,S.H.(1998).Collectivedynamicsof‘small-world’networks.Nature,393,440–442.
Worsley,K.J.,&Friston,K.J. (1995).Analysisof fMRItime-series revis-ited—Again.NeuroImage,2,173–181.
Zalesky, A., Fornito, A., & Bullmore, E. T. (2010). Network-based sta-tistic: Identifying differences in brain networks. NeuroImage, 53,1197–1207.
Zalesky,A.,Fornito,A.,Harding,I.H.,Cocchi,L.,Yücel,M.,Pantelis,C.,&Bullmore, E. T. (2010).Whole-brain anatomical networks: Does thechoiceofnodesmatter?NeuroImage,50,970–983.
SUPPORTINGINFORMATION
AdditionalSupportingInformationmaybefoundonlineinthesupport-inginformationtabforthisarticle.
Howtocitethisarticle:RibeirodePaulaD,ZieglerE,AbeyasinghePM,etal.Amethodforindependentcomponentgraphanalysisofresting-statefMRI.Brain Behav. 2017;7:e00626. https://doi.org/10.1002/brb3.626