a meta-analytic assessment of the delone and mclean is success model: an examination of is success...
TRANSCRIPT

Information & Management 46 (2009) 159–166
A meta-analytic assessment of the DeLone and McLean IS success model: Anexamination of IS success at the individual level
Stacie Petter a,*, Ephraim R. McLean b
a College of Information Science & Technology, University of Nebraska at Omaha, 1110 S. 67th Street, Omaha, NE 68182-0392, United Statesb J. Mack Robinson College of Business, Georgia State University, 35 Broad Street, Atlanta, GA 30303, United States
A R T I C L E I N F O
Article history:
Received 16 October 2007
Received in revised form 16 September 2008
Accepted 1 December 2008
Available online 3 March 2009
Keywords:
IS success
IS effectiveness
IS success model
IS success variables
Meta-analysis
A B S T R A C T
Fifteen years ago, DeLone and McLean published their original model of IS success, which received
considerable attention in the literature. Given the widespread acceptance of the model, we conducted a
meta-analysis to determine whether the model had been validated by research studies reported in the
literature. By aggregating the results of 52 empirical studies that examined relationships within the IS
success model at the individual level of analysis, we found support for the relationships that encompass
the model. We also offer insights on IS success based on the findings of our work.
� 2009 Elsevier B.V. All rights reserved.
Contents lists available at ScienceDirect
Information & Management
journa l homepage: www.e lsev ier .com/ locate / im
1. Introduction
At the first International Conference on Information Systems,Keen [18] posed a key question that needed to be answered by theIS field to establish a coherent discipline, namely: ‘‘What is thedependent variable?’’ In 1992, DeLone and McLean (D&M)addressed this question by defining IS success as the dependentvariable of the field. Their review of the literature resulted in ataxonomy of IS success consisting of six variables: System Quality,Information Quality, Use, User Satisfaction, Individual Impact, andOrganizational Impact. The model also identified the variousrelationships among these success variables; but, at the same time,cautioned researchers that the model needed ‘‘further develop-ment and validation’’ [9].
Considerable research has been devoted to examining theeffectiveness of IT. Numerous papers have been published on thetopics of IS success, evaluation, effectiveness, and acceptance.Since D&M first published their model, over 1000 publicationshave referenced their work; and at least 150 empirical studies haveexamined some or all of the relationships in the model. However,the various relationships in the IS success model have founddiffering levels of support within the empirical literature. Somestudies found high correlations among the variables, while others
* Corresponding author. Tel.: +1 402 554 2077; fax: +1 402 554 3284.
E-mail address: [email protected] (S. Petter).
0378-7206/$ – see front matter � 2009 Elsevier B.V. All rights reserved.
doi:10.1016/j.im.2008.12.006
found either low or nonsignificant correlations. Therefore, toreconcile these conflicting results, we applied meta-analysis toexamine each of the relationships.
2. The history of the D&M IS success model
2.1. The original D&M model
D&M reviewed the literature published in 1981–1987 in sevenpublications to develop a taxonomy of IS success. This taxonomywas based upon Mason’s modification of the Shannon and Weavermodel [37] of communications which had identified three levels ofinformation: the technical level (accuracy and efficiency of thesystem that produces it), the semantic level (its ability to transferthe intended message), and the effectiveness level (its impact onthe receiver). Mason adapted this theory for IS and expanded theeffectiveness level into three categories: receipt of information,influence on the recipient, and influence on the system [27].
D&M identified categories for system success by mapping anaspect of IS success to each of Mason’s effectiveness levels. Thisanalysis yielded six variables of IS success: System Quality,Information Quality, Use, User Satisfaction, Individual Impact,and Organizational Impact. System Quality was equivalent to thetechnical level of communication, while Information Quality wasequivalent to the semantic level of communication. The other fourvariables mapped to Mason’s subcategories of the effectivenesslevel. Use related to Mason’s ‘‘receipt of information.’’ User
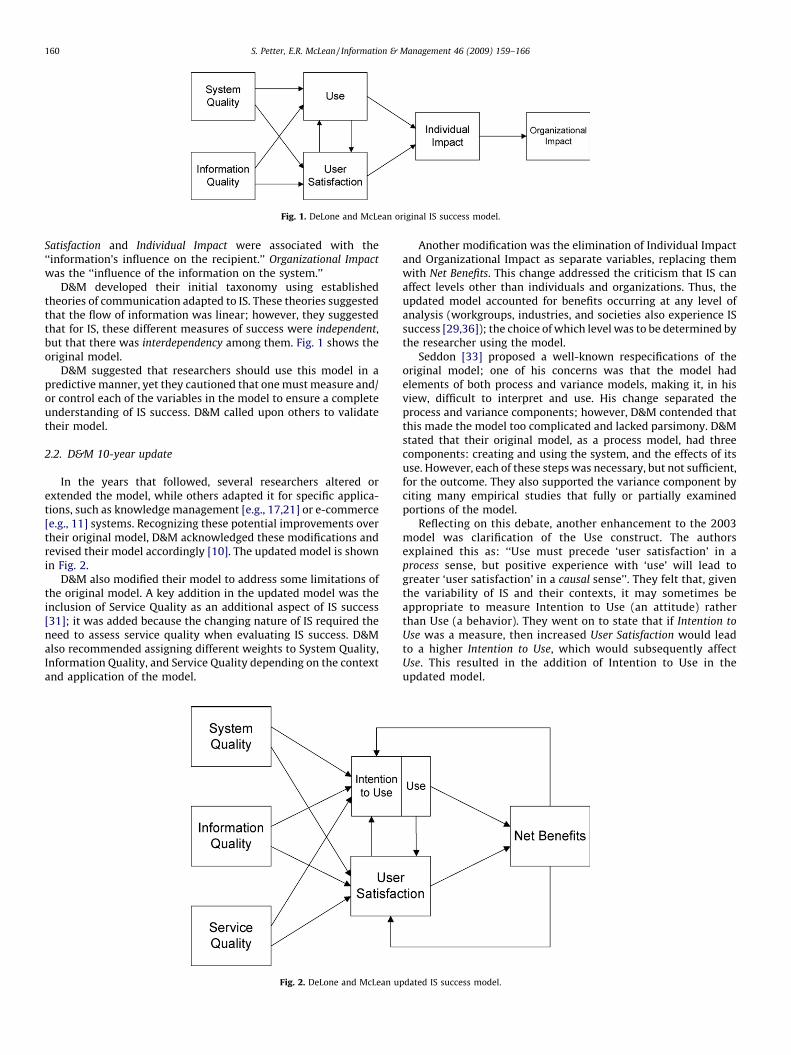
Fig. 1. DeLone and McLean original IS success model.
S. Petter, E.R. McLean / Information & Management 46 (2009) 159–166160
Satisfaction and Individual Impact were associated with the‘‘information’s influence on the recipient.’’ Organizational Impact
was the ‘‘influence of the information on the system.’’D&M developed their initial taxonomy using established
theories of communication adapted to IS. These theories suggestedthat the flow of information was linear; however, they suggestedthat for IS, these different measures of success were independent,but that there was interdependency among them. Fig. 1 shows theoriginal model.
D&M suggested that researchers should use this model in apredictive manner, yet they cautioned that one must measure and/or control each of the variables in the model to ensure a completeunderstanding of IS success. D&M called upon others to validatetheir model.
2.2. D&M 10-year update
In the years that followed, several researchers altered orextended the model, while others adapted it for specific applica-tions, such as knowledge management [e.g., 17,21] or e-commerce[e.g., 11] systems. Recognizing these potential improvements overtheir original model, D&M acknowledged these modifications andrevised their model accordingly [10]. The updated model is shownin Fig. 2.
D&M also modified their model to address some limitations ofthe original model. A key addition in the updated model was theinclusion of Service Quality as an additional aspect of IS success[31]; it was added because the changing nature of IS required theneed to assess service quality when evaluating IS success. D&Malso recommended assigning different weights to System Quality,Information Quality, and Service Quality depending on the contextand application of the model.
Fig. 2. DeLone and McLean u
Another modification was the elimination of Individual Impactand Organizational Impact as separate variables, replacing themwith Net Benefits. This change addressed the criticism that IS canaffect levels other than individuals and organizations. Thus, theupdated model accounted for benefits occurring at any level ofanalysis (workgroups, industries, and societies also experience ISsuccess [29,36]); the choice of which level was to be determined bythe researcher using the model.
Seddon [33] proposed a well-known respecifications of theoriginal model; one of his concerns was that the model hadelements of both process and variance models, making it, in hisview, difficult to interpret and use. His change separated theprocess and variance components; however, D&M contended thatthis made the model too complicated and lacked parsimony. D&Mstated that their original model, as a process model, had threecomponents: creating and using the system, and the effects of itsuse. However, each of these steps was necessary, but not sufficient,for the outcome. They also supported the variance component byciting many empirical studies that fully or partially examinedportions of the model.
Reflecting on this debate, another enhancement to the 2003model was clarification of the Use construct. The authorsexplained this as: ‘‘Use must precede ‘user satisfaction’ in aprocess sense, but positive experience with ‘use’ will lead togreater ‘user satisfaction’ in a causal sense’’. They felt that, giventhe variability of IS and their contexts, it may sometimes beappropriate to measure Intention to Use (an attitude) ratherthan Use (a behavior). They went on to state that if Intention to
Use was a measure, then increased User Satisfaction would leadto a higher Intention to Use, which would subsequently affectUse. This resulted in the addition of Intention to Use in theupdated model.
pdated IS success model.
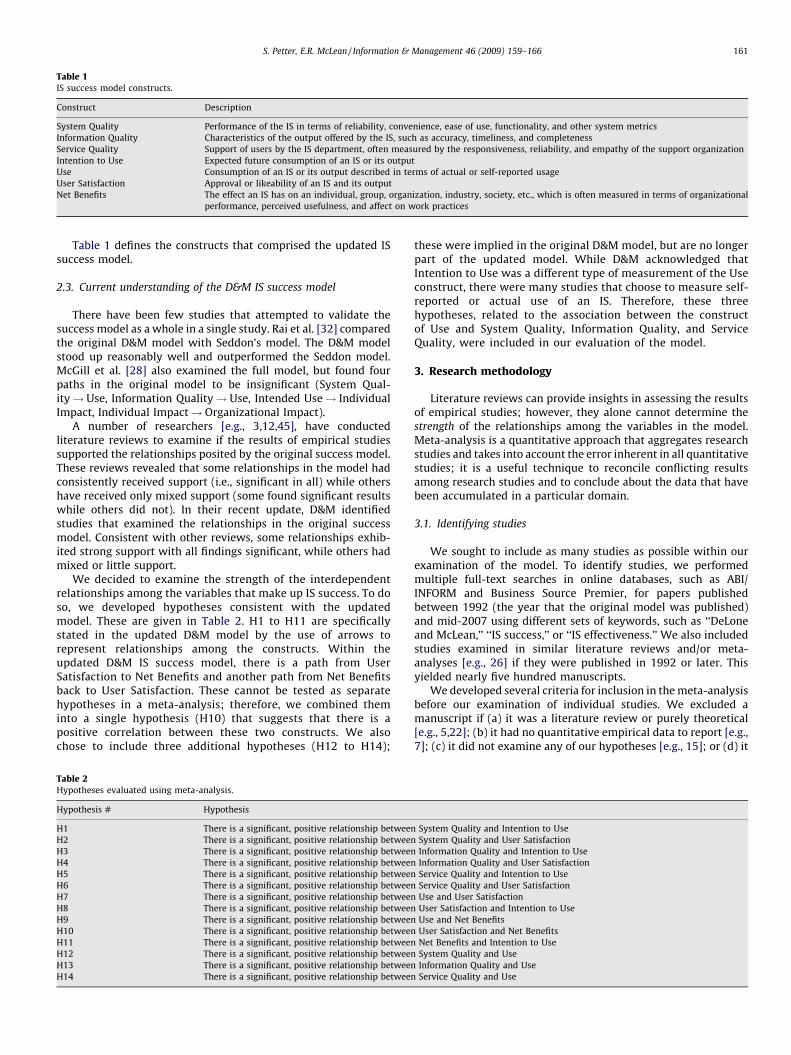
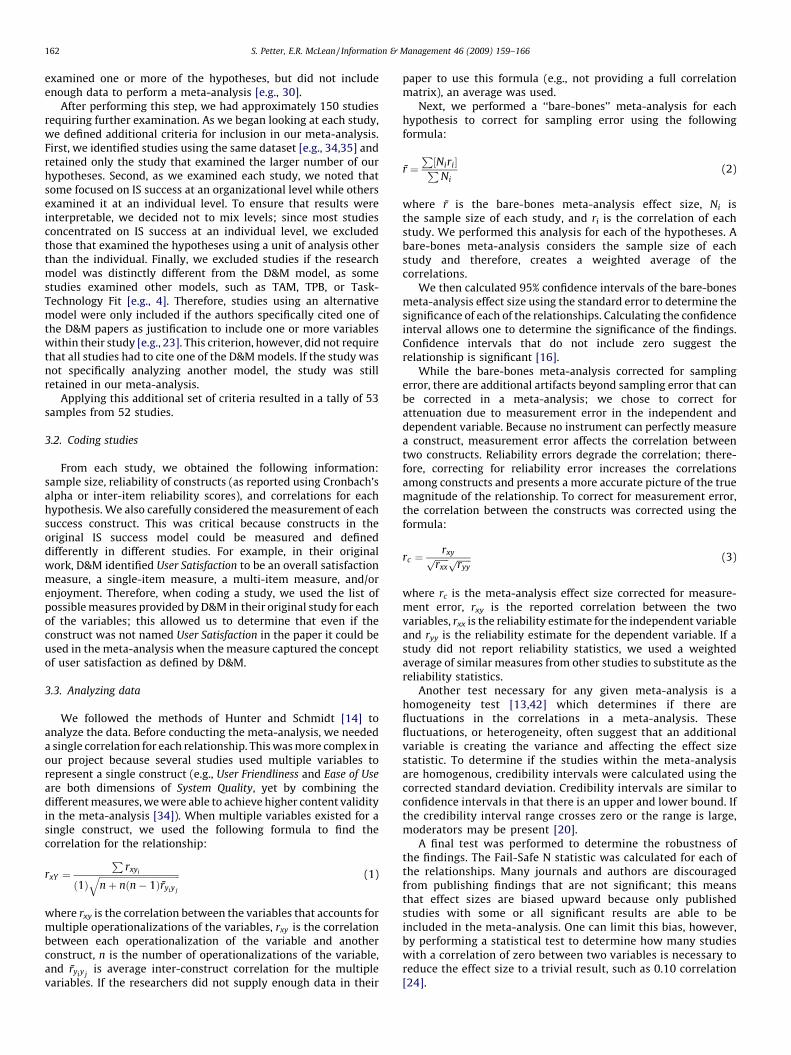
Table 1IS success model constructs.
Construct Description
System Quality Performance of the IS in terms of reliability, convenience, ease of use, functionality, and other system metrics
Information Quality Characteristics of the output offered by the IS, such as accuracy, timeliness, and completeness
Service Quality Support of users by the IS department, often measured by the responsiveness, reliability, and empathy of the support organization
Intention to Use Expected future consumption of an IS or its output
Use Consumption of an IS or its output described in terms of actual or self-reported usage
User Satisfaction Approval or likeability of an IS and its output
Net Benefits The effect an IS has on an individual, group, organization, industry, society, etc., which is often measured in terms of organizational
performance, perceived usefulness, and affect on work practices
S. Petter, E.R. McLean / Information & Management 46 (2009) 159–166 161
Table 1 defines the constructs that comprised the updated ISsuccess model.
2.3. Current understanding of the D&M IS success model
There have been few studies that attempted to validate thesuccess model as a whole in a single study. Rai et al. [32] comparedthe original D&M model with Seddon’s model. The D&M modelstood up reasonably well and outperformed the Seddon model.McGill et al. [28] also examined the full model, but found fourpaths in the original model to be insignificant (System Qual-ity! Use, Information Quality! Use, Intended Use! IndividualImpact, Individual Impact! Organizational Impact).
A number of researchers [e.g., 3,12,45], have conductedliterature reviews to examine if the results of empirical studiessupported the relationships posited by the original success model.These reviews revealed that some relationships in the model hadconsistently received support (i.e., significant in all) while othershave received only mixed support (some found significant resultswhile others did not). In their recent update, D&M identifiedstudies that examined the relationships in the original successmodel. Consistent with other reviews, some relationships exhib-ited strong support with all findings significant, while others hadmixed or little support.
We decided to examine the strength of the interdependentrelationships among the variables that make up IS success. To doso, we developed hypotheses consistent with the updatedmodel. These are given in Table 2. H1 to H11 are specificallystated in the updated D&M model by the use of arrows torepresent relationships among the constructs. Within theupdated D&M IS success model, there is a path from UserSatisfaction to Net Benefits and another path from Net Benefitsback to User Satisfaction. These cannot be tested as separatehypotheses in a meta-analysis; therefore, we combined theminto a single hypothesis (H10) that suggests that there is apositive correlation between these two constructs. We alsochose to include three additional hypotheses (H12 to H14);
Table 2Hypotheses evaluated using meta-analysis.
Hypothesis # Hypothesis
H1 There is a significant, positive relationship between
H2 There is a significant, positive relationship between
H3 There is a significant, positive relationship between
H4 There is a significant, positive relationship between
H5 There is a significant, positive relationship between
H6 There is a significant, positive relationship between
H7 There is a significant, positive relationship between
H8 There is a significant, positive relationship between
H9 There is a significant, positive relationship between
H10 There is a significant, positive relationship between
H11 There is a significant, positive relationship between
H12 There is a significant, positive relationship between
H13 There is a significant, positive relationship between
H14 There is a significant, positive relationship between
these were implied in the original D&M model, but are no longerpart of the updated model. While D&M acknowledged thatIntention to Use was a different type of measurement of the Useconstruct, there were many studies that choose to measure self-reported or actual use of an IS. Therefore, these threehypotheses, related to the association between the constructof Use and System Quality, Information Quality, and ServiceQuality, were included in our evaluation of the model.
3. Research methodology
Literature reviews can provide insights in assessing the resultsof empirical studies; however, they alone cannot determine thestrength of the relationships among the variables in the model.Meta-analysis is a quantitative approach that aggregates researchstudies and takes into account the error inherent in all quantitativestudies; it is a useful technique to reconcile conflicting resultsamong research studies and to conclude about the data that havebeen accumulated in a particular domain.
3.1. Identifying studies
We sought to include as many studies as possible within ourexamination of the model. To identify studies, we performedmultiple full-text searches in online databases, such as ABI/INFORM and Business Source Premier, for papers publishedbetween 1992 (the year that the original model was published)and mid-2007 using different sets of keywords, such as ‘‘DeLoneand McLean,’’ ‘‘IS success,’’ or ‘‘IS effectiveness.’’ We also includedstudies examined in similar literature reviews and/or meta-analyses [e.g., 26] if they were published in 1992 or later. Thisyielded nearly five hundred manuscripts.
We developed several criteria for inclusion in the meta-analysisbefore our examination of individual studies. We excluded amanuscript if (a) it was a literature review or purely theoretical[e.g., 5,22]; (b) it had no quantitative empirical data to report [e.g.,7]; (c) it did not examine any of our hypotheses [e.g., 15]; or (d) it
System Quality and Intention to Use
System Quality and User Satisfaction
Information Quality and Intention to Use
Information Quality and User Satisfaction
Service Quality and Intention to Use
Service Quality and User Satisfaction
Use and User Satisfaction
User Satisfaction and Intention to Use
Use and Net Benefits
User Satisfaction and Net Benefits
Net Benefits and Intention to Use
System Quality and Use
Information Quality and Use
Service Quality and Use
S. Petter, E.R. McLean / Information & Management 46 (2009) 159–166162
examined one or more of the hypotheses, but did not includeenough data to perform a meta-analysis [e.g., 30].
After performing this step, we had approximately 150 studiesrequiring further examination. As we began looking at each study,we defined additional criteria for inclusion in our meta-analysis.First, we identified studies using the same dataset [e.g., 34,35] andretained only the study that examined the larger number of ourhypotheses. Second, as we examined each study, we noted thatsome focused on IS success at an organizational level while othersexamined it at an individual level. To ensure that results wereinterpretable, we decided not to mix levels; since most studiesconcentrated on IS success at an individual level, we excludedthose that examined the hypotheses using a unit of analysis otherthan the individual. Finally, we excluded studies if the researchmodel was distinctly different from the D&M model, as somestudies examined other models, such as TAM, TPB, or Task-Technology Fit [e.g., 4]. Therefore, studies using an alternativemodel were only included if the authors specifically cited one ofthe D&M papers as justification to include one or more variableswithin their study [e.g., 23]. This criterion, however, did not requirethat all studies had to cite one of the D&M models. If the study wasnot specifically analyzing another model, the study was stillretained in our meta-analysis.
Applying this additional set of criteria resulted in a tally of 53samples from 52 studies.
3.2. Coding studies
From each study, we obtained the following information:sample size, reliability of constructs (as reported using Cronbach’salpha or inter-item reliability scores), and correlations for eachhypothesis. We also carefully considered the measurement of eachsuccess construct. This was critical because constructs in theoriginal IS success model could be measured and defineddifferently in different studies. For example, in their originalwork, D&M identified User Satisfaction to be an overall satisfactionmeasure, a single-item measure, a multi-item measure, and/orenjoyment. Therefore, when coding a study, we used the list ofpossible measures provided by D&M in their original study for eachof the variables; this allowed us to determine that even if theconstruct was not named User Satisfaction in the paper it could beused in the meta-analysis when the measure captured the conceptof user satisfaction as defined by D&M.
3.3. Analyzing data
We followed the methods of Hunter and Schmidt [14] toanalyze the data. Before conducting the meta-analysis, we neededa single correlation for each relationship. This was more complex inour project because several studies used multiple variables torepresent a single construct (e.g., User Friendliness and Ease of Use
are both dimensions of System Quality, yet by combining thedifferent measures, we were able to achieve higher content validityin the meta-analysis [34]). When multiple variables existed for asingle construct, we used the following formula to find thecorrelation for the relationship:
rxY ¼P
rxyi
ð1Þffiffiffiffiffiffiffiffiffiffiffiffiffiffiffiffiffiffiffiffiffiffiffiffiffiffiffiffiffiffiffiffiffiffiffinþ nðn� 1Þr̄yiy j
q (1)
where rxy is the correlation between the variables that accounts formultiple operationalizations of the variables, rxy is the correlationbetween each operationalization of the variable and anotherconstruct, n is the number of operationalizations of the variable,and r̄yiy j
is average inter-construct correlation for the multiplevariables. If the researchers did not supply enough data in their
paper to use this formula (e.g., not providing a full correlationmatrix), an average was used.
Next, we performed a ‘‘bare-bones’’ meta-analysis for eachhypothesis to correct for sampling error using the followingformula:
r̄ ¼P
Niri½ �PNi
(2)
where r̄ is the bare-bones meta-analysis effect size, Ni isthe sample size of each study, and ri is the correlation of eachstudy. We performed this analysis for each of the hypotheses. Abare-bones meta-analysis considers the sample size of eachstudy and therefore, creates a weighted average of thecorrelations.
We then calculated 95% confidence intervals of the bare-bonesmeta-analysis effect size using the standard error to determine thesignificance of each of the relationships. Calculating the confidenceinterval allows one to determine the significance of the findings.Confidence intervals that do not include zero suggest therelationship is significant [16].
While the bare-bones meta-analysis corrected for samplingerror, there are additional artifacts beyond sampling error that canbe corrected in a meta-analysis; we chose to correct forattenuation due to measurement error in the independent anddependent variable. Because no instrument can perfectly measurea construct, measurement error affects the correlation betweentwo constructs. Reliability errors degrade the correlation; there-fore, correcting for reliability error increases the correlationsamong constructs and presents a more accurate picture of the truemagnitude of the relationship. To correct for measurement error,the correlation between the constructs was corrected using theformula:
rc ¼rxyffiffiffiffiffiffi
rxxp ffiffiffiffiffiffi
ryyp (3)
where rc is the meta-analysis effect size corrected for measure-ment error, rxy is the reported correlation between the twovariables, rxx is the reliability estimate for the independent variableand ryy is the reliability estimate for the dependent variable. If astudy did not report reliability statistics, we used a weightedaverage of similar measures from other studies to substitute as thereliability statistics.
Another test necessary for any given meta-analysis is ahomogeneity test [13,42] which determines if there arefluctuations in the correlations in a meta-analysis. Thesefluctuations, or heterogeneity, often suggest that an additionalvariable is creating the variance and affecting the effect sizestatistic. To determine if the studies within the meta-analysisare homogenous, credibility intervals were calculated using thecorrected standard deviation. Credibility intervals are similar toconfidence intervals in that there is an upper and lower bound. Ifthe credibility interval range crosses zero or the range is large,moderators may be present [20].
A final test was performed to determine the robustness ofthe findings. The Fail-Safe N statistic was calculated for each ofthe relationships. Many journals and authors are discouragedfrom publishing findings that are not significant; this meansthat effect sizes are biased upward because only publishedstudies with some or all significant results are able to beincluded in the meta-analysis. One can limit this bias, however,by performing a statistical test to determine how many studieswith a correlation of zero between two variables is necessary toreduce the effect size to a trivial result, such as 0.10 correlation[24].

Table 3Meta-analysis results.
Hypothesis Total N K r Var r 95% Confidence
interval
r Var r 90% Credibility
interval
Fail-Safe N
H1: System Quality and Intention to Use 2864 12 0.48 0.02 0.41, 0.56 0.54 0.02 0.33, 0.75 53
H2: System Quality and User Satisfaction 3653 17 0.54 0.04 0.44, 0.63 0.60 0.04 0.27, 0.93 85
H3: Information Quality and Intention to Use 1312 5 0.52 0.01 0.45, 0.58 0.56 0.01 0.46, 0.67 23
H4: Information Quality and User Satisfaction 2136 10 0.53 0.05 0.39, 0.66 0.58 0.06 0.20, 0.96 48
H5: Service Quality and Intention to Use one study—no results
H6: Service Quality and User Satisfaction 366 3 0.21 0.04 0.00, 0.43 0.24 0.05 n/a n/a
H7: Use and User Satisfaction 5231 26 0.25 0.02 0.19, 0.31 0.28 0.03 0.03, 0.52 46
H8: User Satisfaction and Intention to Use 2245 9 0.65 0.03 0.54, 0.75 0.74 0.03 0.46, 1.00 57
H9: Use and Net Benefits 4416 26 0.36 0.04 0.28, 0.43 0.39 0.04 0.07, 0.72 76
H10: User Satisfaction and Net Benefits 6030 31 0.52 0.04 0.45, 0.59 0.58 0.05 0.23, 0.92 148
H11: Net Benefits and Intention to Use 3335 14 0.55 0.05 0.43, 0.67 0.63 0.07 0.20, 1.00 74
H12: System Quality and Use 2408 15 0.30 0.03 0.21, 0.39 0.34 0.05 0.01, 0.67 36
H13: Information Quality and Use 897 7 0.42 0.03 0.28, 0.55 0.49 0.06 0.09, 0.88 27
H14: Service Quality and Use 448 4 0.09 0.07 -0.18, 0.35 0.09 0.09 n/a n/a
Total N = total sample size for the given meta-analysis; K = number of studies included in the meta-analysis; r = bare-bones meta-analysis effect size (weighted average
corrected only for sampling error, not reliability); Var r = variance of the bare-bones effect size; 95% Confidence interval = 95% confidence interval for the bare-bones meta-
analysis effect size based on the standard error; r = effect size corrected for reliability; Var r = variance of effect size corrected for reliability; 90% Credibility interval = test for
homogeneity in the sample based on standard deviation of r; Fail-Safe N = test to evaluate robustness of the findings (i.e., number of studies required to reduce effect size to a
value 0.10).
Table 4Summary of hypothesis testing.
H# Hypothesis summary Result
H1 System Quality and Intention to Use Supported
H2 System Quality and User Satisfaction Supported
H3 Information Quality and Intention to Use Supported
H4 Information Quality and User Satisfaction Supported
H5 Service Quality and Intention to Use Not tested
H6 Service Quality and User Satisfaction Not supported
H7 Use and User Satisfaction Supported
H8 User Satisfaction and Intention to Use Supported
H9 Use and Net Benefits Supported
H10 User Satisfaction and Net Benefits Supported
H11 Net Benefits and Intention to Use Supported
H12 System Quality and Use Supported
H13 Information Quality and Use Supported
H14 Service Quality and Use Not supported
S. Petter, E.R. McLean / Information & Management 46 (2009) 159–166 163
3.4. Meta-analysis results
Table 3 shows the results of the individual meta-analyses.Examining the 95% confidence interval of each study suggestedthat the majority of the relationships within the original andupdated D&M models were supported. One hypothesis, H5 (ServiceQuality and Intention to Use), was not examined because only onestudy had examined it. H6 (Service Quality and User Satisfaction)and H14 (Service Quality and Use) were also found to benonsignificant because the 95% confidence interval included zero.All other hypotheses were supported.
We also evaluated the 90% credibility intervals. If they includedzero or were sufficiently large, then the studies were nothomogenous, suggesting moderators (i.e., unknown variables)were present. None of the 90% credibility intervals included zerowithin their range; however, the size of the credibility intervalswere somewhat large for many of the meta-analyses. Thissuggested that the population sampled in each of the studieswere probably not truly homogeneous.
In our assessment of the results, we also considered the Fail-Safe N statistic. This is helpful to determining the robustness ofthe results and whether publication bias was a problem. A ruleof thumb is that the Fail-Safe N statistic should be at least twicethe number of studies in the meta-analysis (i.e., ‘K’). All of thesupported hypotheses had a ratio of Fail-Safe N to the number ofstudies greater than 2.0, except for H7 (Use and UserSatisfaction). The ratio of Fail-Safe N to K for H7 was only1.77. Given that the magnitude of the relationship between Useand User Satisfaction was the weakest of the supportedhypotheses (i.e., r = 0.28), it is not surprising that that it failedthe Fail-Safe N test.
4. Discussion
4.1. Empirical support for the D&M models
We found that the majority of hypotheses implied by theupdated D&M models were supported. Table 4 summarizes theresults of our hypothesis tests.
The three unsupported hypotheses were associated with theService Quality construct; one was not testable due to a lack ofstudies examining this relationship, while the other two (ServiceQuality and User Satisfaction; Service Quality and Use) wereexamined, but were not found to be significant.
4.2. Strength of relationships in the D&M models
One of the benefits of meta-analysis is its ability to examine thestrength or magnitude of the relationship between two constructs.Cohen and Cohen [8] established general heuristics to judge themagnitude of the effect sizes as strong (0.50), moderate (0.30), orweak (0.10). Examining the corrected correlation coefficients (r),the majority of the relationships in the original and updated ISsuccess models were moderate or strong. To illustrate this result,we grouped and ordered the results of the individual meta-analysisusing Cohen and Cohen’s heuristics.
The only weak relationship was Use and User Satisfaction. Arelatively large number of studies had examined this relationship(i.e., 26 studies); and yet, surprisingly, the correlation was stillweak. Our findings are consistent with other meta-analyses thathave examined this relationship.
All other relationships were moderate to strong, suggesting thatthe relationships identified by D&M for these success variableswere empirically supported.
4.3. Insights on IS success
4.3.1. Intention to Use
In this research, we found that, empirically, the inclusion ofIntention to Use in the updated D&M model is appropriate andsupported. The relationships between System Quality, InformationQuality, User Satisfaction, and Net Benefits with Intention to Use
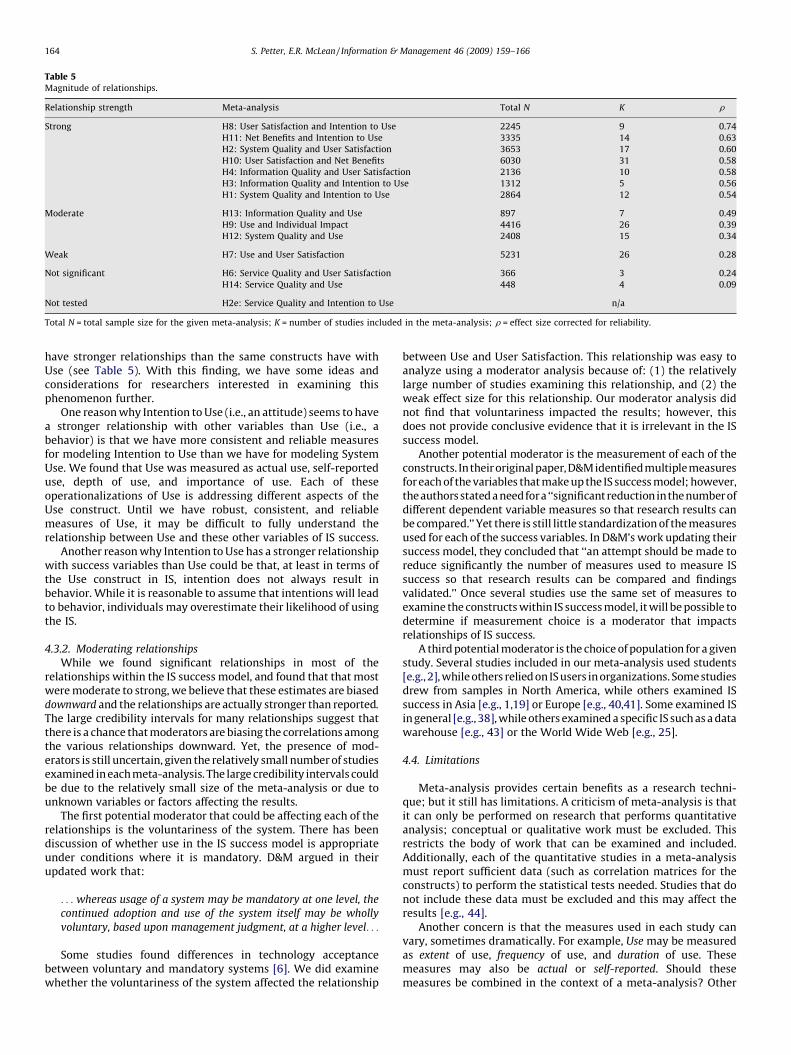
Table 5Magnitude of relationships.
Relationship strength Meta-analysis Total N K r
Strong H8: User Satisfaction and Intention to Use 2245 9 0.74
H11: Net Benefits and Intention to Use 3335 14 0.63
H2: System Quality and User Satisfaction 3653 17 0.60
H10: User Satisfaction and Net Benefits 6030 31 0.58
H4: Information Quality and User Satisfaction 2136 10 0.58
H3: Information Quality and Intention to Use 1312 5 0.56
H1: System Quality and Intention to Use 2864 12 0.54
Moderate H13: Information Quality and Use 897 7 0.49
H9: Use and Individual Impact 4416 26 0.39
H12: System Quality and Use 2408 15 0.34
Weak H7: Use and User Satisfaction 5231 26 0.28
Not significant H6: Service Quality and User Satisfaction 366 3 0.24
H14: Service Quality and Use 448 4 0.09
Not tested H2e: Service Quality and Intention to Use n/a
Total N = total sample size for the given meta-analysis; K = number of studies included in the meta-analysis; r = effect size corrected for reliability.
S. Petter, E.R. McLean / Information & Management 46 (2009) 159–166164
have stronger relationships than the same constructs have withUse (see Table 5). With this finding, we have some ideas andconsiderations for researchers interested in examining thisphenomenon further.
One reason why Intention to Use (i.e., an attitude) seems to havea stronger relationship with other variables than Use (i.e., abehavior) is that we have more consistent and reliable measuresfor modeling Intention to Use than we have for modeling SystemUse. We found that Use was measured as actual use, self-reporteduse, depth of use, and importance of use. Each of theseoperationalizations of Use is addressing different aspects of theUse construct. Until we have robust, consistent, and reliablemeasures of Use, it may be difficult to fully understand therelationship between Use and these other variables of IS success.
Another reason why Intention to Use has a stronger relationshipwith success variables than Use could be that, at least in terms ofthe Use construct in IS, intention does not always result inbehavior. While it is reasonable to assume that intentions will leadto behavior, individuals may overestimate their likelihood of usingthe IS.
4.3.2. Moderating relationships
While we found significant relationships in most of therelationships within the IS success model, and found that that mostwere moderate to strong, we believe that these estimates are biaseddownward and the relationships are actually stronger than reported.
The large credibility intervals for many relationships suggest thatthere is a chance that moderators are biasing the correlations amongthe various relationships downward. Yet, the presence of mod-erators is still uncertain, given the relatively small number of studiesexamined in each meta-analysis. The large credibility intervals couldbe due to the relatively small size of the meta-analysis or due tounknown variables or factors affecting the results.
The first potential moderator that could be affecting each of therelationships is the voluntariness of the system. There has beendiscussion of whether use in the IS success model is appropriateunder conditions where it is mandatory. D&M argued in theirupdated work that:
. . . whereas usage of a system may be mandatory at one level, the
continued adoption and use of the system itself may be wholly
voluntary, based upon management judgment, at a higher level. . .
Some studies found differences in technology acceptancebetween voluntary and mandatory systems [6]. We did examinewhether the voluntariness of the system affected the relationship
between Use and User Satisfaction. This relationship was easy toanalyze using a moderator analysis because of: (1) the relativelylarge number of studies examining this relationship, and (2) theweak effect size for this relationship. Our moderator analysis didnot find that voluntariness impacted the results; however, thisdoes not provide conclusive evidence that it is irrelevant in the ISsuccess model.
Another potential moderator is the measurement of each of theconstructs. Intheir original paper, D&Midentifiedmultiplemeasuresfor each of the variables that make up the IS success model; however,the authors stated a needfora ‘‘significantreduction inthe number ofdifferent dependent variable measures so that research results canbe compared.’’ Yet there is still little standardization of the measuresused for each of the success variables. In D&M’s work updating theirsuccess model, they concluded that ‘‘an attempt should be made toreduce significantly the number of measures used to measure ISsuccess so that research results can be compared and findingsvalidated.’’ Once several studies use the same set of measures toexamine the constructs within IS success model, it will be possible todetermine if measurement choice is a moderator that impactsrelationships of IS success.
A third potential moderator is the choice of population for a givenstudy. Several studies included in our meta-analysis used students[e.g., 2], while others relied on IS users in organizations. Some studiesdrew from samples in North America, while others examined ISsuccess in Asia [e.g., 1,19] or Europe [e.g., 40,41]. Some examined ISin general [e.g., 38], while others examined a specific IS such as a datawarehouse [e.g., 43] or the World Wide Web [e.g., 25].
4.4. Limitations
Meta-analysis provides certain benefits as a research techni-que; but it still has limitations. A criticism of meta-analysis is thatit can only be performed on research that performs quantitativeanalysis; conceptual or qualitative work must be excluded. Thisrestricts the body of work that can be examined and included.Additionally, each of the quantitative studies in a meta-analysismust report sufficient data (such as correlation matrices for theconstructs) to perform the statistical tests needed. Studies that donot include these data must be excluded and this may affect theresults [e.g., 44].
Another concern is that the measures used in each study canvary, sometimes dramatically. For example, Use may be measuredas extent of use, frequency of use, and duration of use. Thesemeasures may also be actual or self-reported. Should thesemeasures be combined in the context of a meta-analysis? Other
S. Petter, E.R. McLean / Information & Management 46 (2009) 159–166 165
meta-analyses on IS success have addressed the problem in thesame manner as we did. There is, however, a possible benefit tousing multiple measures for a given construct. The content validityof each variable of the IS success model should be quite highbecause we are capturing not just one aspect of a variable (such asfrequency of use), but a comprehensive variable that includes thefull range of the construct. The potential downside of integratingthese studies with different measures is that the measurement is amoderator of the relationship between constructs. This can biasthe directionality of the relationship, meaning that each of theserelationships evaluated should have an even stronger magnitudethan we found in our study.
Another limitation of meta-analysis is that it does not assesscausal relationship between variables. We believe that a causalanalysis of the IS success model would be helpful and useful.However, to perform a causal analysis, one needs performindividual meta-analysis for all possible relationships amongthe variables to develop a correlation matrix and not just therelationships hypothesized [39], which cannot be done with theavailable data.
A final limitation of our meta-analysis was that we limited thestudies to those that focused on the individual level of analysis. Wemade this choice to prevent confounding results from differentlevels of analysis; however, the generalizability of the findingsmust therefore be questioned, primarily as they relate to themeasures of the Net Benefits construct. Although we did restrictthe unit of analysis, the types of IS included in this meta-analysis isquite broad. Examples of studies included decision-supportsystems, enterprise systems, accounting IS, knowledge manage-ment systems, and many others. However, we caution readers tointerpret the findings with care.
5. Conclusion
Our work assesses the updated D&M IS success model usingmeta-analysis. While others have also examined some or all of therelationships in the original IS success model using meta-analysis,we evaluated the updated D&M IS success model. This allowed usto evaluate the role of Intention to Use and Service Quality, whichare recent additions to the model.
We have empirically evaluated the relationships within theD&M IS success model using the quantitative method of meta-analysis and found that the majority of the relationships posited inthe updated D&M IS success model were supported. As businesseshave become more reliant on IT in achieving success within theirorganizations, IS have become essential. A better understanding ofwhat constitutes an effective IS is necessary. The D&M IS successmodel provides a framework that can assist in understanding this.
Acknowledgements
We would first like to thank Michael Gallivan for introducing usto the idea of conducting a meta-analysis on this topic. Also, wewould like to thank Yi Ding and Legodile Kwapa for assisting withdata collection and verification. Finally, we would like to thank themany researchers that have read different drafts of this manuscriptand offered their thoughtful comments throughout the writingprocess.
References1
[1] A.H. Abdul-Gader, Determinants of computer-mediated communication successamong knowledge workers in Saudi Arabia, Journal of Computer InformationSystems 38 (1), 1997, *.
1 Studies with an asterisk were included in the meta-analysis.
[2] R. Agarwal, J. Prasad, The role of innovation characteristics and perceived volun-tariness in the acceptance of information technologies, Decision Sciences 28 (3),1997, pp. 557–582, *.
[3] N. Au, E.W.T. Ngai, T.C.E. Cheng, A critical review of end-user information systemsatisfaction research and a new research framework, Omega 30 (6), 2002, pp.451–478.
[4] A. Bajaj, S.R. Nidumolu, A feedback model to understand information systemusage, Information & Management 33 (4), 1998, pp. 213–224.
[5] J. Ballantine, M. Bonner, M. Levy, A.M.I. Martin, P.L. Powell, The 3-D model ofinformation systems success: the search for the dependent variable continues,Information Resources Management Journal 9 (4), 1996, pp. 5–14.
[6] S.A. Brown, A.P. Massey, M.M. Montoya-Weiss, J.R. Burkman, Do I really have to?User acceptance of mandated technology European Journal of Information Sys-tems 11, 2002, pp. 283–295.
[7] M.M. Caldeira, J.M. Ward, Understanding the successful adoption and use of IS/ITin SMEs: an explanation from Portuguese manufacturing industries, InformationSystems Journal 12 (2), 2002, pp. 121–152.
[8] J. Cohen, P. Cohen, Applied Multiple Regression/Correlation Analysis for theBehavioral Sciences, Erlbaum, Hillsdale, NJ, 1983.
[9] W.H. DeLone, E.R. McLean, Information systems success: the quest for thedependent variable, Information Systems Research 3 (1), 1992, pp. 60–95.
[10] W.H. DeLone, E.R. McLean, The DeLone and McLean model of information systemssuccess: a ten-year update, Journal of Management Information Systems 19 (4),2003, pp. 9–30.
[11] W.H. DeLone, E.R. McLean, Measuring e-commerce success: applying the DeLone& McLean information systems success model, International Journal of ElectronicCommerce 9 (1), 2004, pp. 31–47.
[12] V. Grover, S.R. Jeong, A.H. Segars, Information systems effectiveness: the constructspace and patterns of application, Information & Management 31 (4), 1996, pp.177–191.
[13] L.V. Hedges, I. Olkin, Statistical Methods for Meta-analysis, Academic Press,Orlando, FL, 1985.
[14] J.E. Hunter, F.L. Schmidt, Methods of Meta-analysis: Correcting Error and Bias inResearch Findings, 2nd ed., Sage Publications, Thousand Oaks, CA, 2004.
[15] J.E. Hunton, K.H. Price, Effects of the user participation process and task mean-ingfulness on key information system outcomes, Management Science 43 (6),1997, pp. 797–812.
[16] M.I. Hwang, The use of meta-analysis in MIS research: promises and pro-blems, The DATA BASE for Advances in Information Systems 27 (3), 1996, pp.35–48.
[17] M.E. Jennex, L. Olfman, P. Pituma, P. Yong-Tae, An organizational memoryinformation systems success model: an extension of DeLone and McLean’s I/Ssuccess model, in: Proceedings of the 31st Hawaii International Conference onSystem Sciences, IEEE Computer Society Press, Hawaii, United States, 1998.
[18] P.G.W. Keen, MIS research: reference disciplines and a cumulative tradition, in:Proceedings from the First International Conference on Information Systems,1980, pp. 9–18.
[19] O.E.M. Khalil, M.M. Elkordy, The relationship between user satisfaction andsystems usage: empirical evidence from Egypt, Journal of End User Computing11 (2), 1999, pp. 21–28, *.
[20] M. Koslowsky, A. Sagie, On the efficacy of credibility intervals as indicators ofmoderator effects in meta-analytic research, Journal of Organizational Behavior14, 1993, pp. 695–699.
[21] U.R. Kulkarni, S. Ravindran, R. Freeze, A knowledge management success model:theoretical development and empirical validation, Journal of Management Infor-mation Systems 23 (3), 2006, pp. 309–347, *.
[22] K. Larsen, A taxonomy of antecedents of information systems success, Journal ofManagement Information Systems 20 (2), 2003, pp. 169–246.
[23] S.S. Liaw, H.M. Huang, An investigation of user attitudes toward search engines asan information retrieval tool, Computers in Human Behavior 19 (6), 2003, *.
[24] M.W. Lipsey, D.B. Wilson, Practical Meta-analysis, Sage Publications, ThousandOaks, CA, 2001.
[25] C. Liu, K.P. Arnett, Exploring the factors associated with web site success in thecontext of electronic commerce, Information & Management 38 (1), 2000, pp. 23–33, *.
[26] M.A. Mahmood, L. Hall, D.L. Swanberg, Factors affecting information technologyusage: a meta-analysis of the empirical literature, Journal of OrganizationalComputing & Electronic Commerce 11 (2), 2001, pp. 107–130.
[27] R.O. Mason, Measuring information output: a communication systems approach,Information & Management 1 (5), 1978, pp. 219–234.
[28] T. McGill, V. Hobbs, J. Klobas, User-developed applications and informationsystems success: a test of DeLone and McLean’s model, Information ResourcesManagement Journal 16 (1), 2003, pp. 24–45.
[29] B.L. Myers, L.A. Kappelman, V.R. Prybutok, A comprehensive model for assessingthe quality and productivity of the information systems function: toward acontingency theory for information systems assessment, Information ResourcesManagement Journal 10 (1), 1997, pp. 6–25.
[30] S. Negash, T. Ryan, M. Igbaria, Quality and effectiveness in web-based customersupport systems, Information & Management 40 (8), 2003, pp. 757–768.
[31] L.F. Pitt, R.T. Watson, C.B. Kavan, Service quality: a measure of informationsystems effectiveness, MIS Quarterly 19 (2), 1995, pp. 173–187.
[32] A. Rai, S.S. Lang, R.B. Welker, Assessing the validity of IS success models: anempirical test and theoretical analysis, Information Systems Research 13 (1),2002, pp. 5–69, *.
[33] P.B. Seddon, A respecification and extension of the DeLone and McLean model ofIS success, Information Systems Research 8 (3), 1997, pp. 240–253.

S. Petter, E.R. McLean / Information & Management 46 (2009) 159–166166
[34] P.B. Seddon, M.-Y. Kiew, A partial test and development of the DeLone and McLeanmodel of is success, International Conference on Information Systems 1994, pp.99–110.
[35] P.B. Seddon, M.-Y. Kiew, A partial test and development of DeLone and McLean’smodel of is success, Australian Journal of Information Systems 4 (1), 1996, pp. 90–109, *.
[36] P.B. Seddon, S. Staples, R. Patnayakuni, M. Bowtell, Dimensions of informationsystems success, Communications of the Association for Information Systems 2,1999, pp. 2–39.
[37] C.E. Shannon, W. Weaver, The Mathematical Theory of Communication, Uni-versity of Illinois Press, Urbana, IL, 1949.
[38] R.L. Thompson, C.A. Higgins, J.M. Howell, Influence of experience on personalcomputer utilization: testing a conceptual model, Journal of Management Infor-mation Systems 11 (1), 1994, pp. 167–187, *.
[39] C. Viswesvaran, D.S. Ones, Theory testing: combining psychometric meta-analysisand structural equation modeling, Personnel Psychology 48, 1995, pp. 865–885.
[40] G.E. Vlahos, T.W. Ferratt, Information technology use by managers in Greece tosupport decision making: amount, perceived value, and satisfaction, Information& Management 29 (6), 1995, pp. 305–315, *.
[41] G.E. Vlahos, T.W. Ferratt, G. Knoepfle, The use of computer-based informationsystems by German managers, Information & Management 41 (6), 2004, pp. 763–779, *.
[42] E.M. Whitener, Confusion of confidence intervals and credibility intervals inmeta-analysis, Journal of Applied Psychology 75 (3), 1990, pp. 315–321.
[43] B.H. Wixom, P.A. Todd, A theoretical integration of user satisfaction and technol-ogy acceptance, Information Systems Research 16 (1), 2005, pp. 85–102, *.
[44] J.-H. Wu, Y.-M. Wang, Measuring KMS success: a respecification of the DeLoneand McLean’s model, Information & Management 43 (6), 2006, pp. 728–739.
[45] M. Zviran, Z. Erlich, Measuring is user satisfaction: review and implications,Communications of the Association for Information Systems 12, 2003, pp. 81–103, *.
Additional studies included in the meta-analysis
[46] R. Agarwal, J. Prasad, Are individual differences germane to the acceptance of newinformation technologies? (Additional studies included in the meta-analysis)Decision Sciences 30 (2), 1999, pp. 361–391.
[47] A.M. Aladwani, Organizational actions, computer attitudes, and end-user satis-faction in public organizations: an empirical study, Journal of End User Comput-ing 14 (1), 2002, pp. 42–49.
[48] H. Almutairi, G.H. Subramanian, An empirical application of the DeLone andMcLean model in the Kuwaiti private sector, Journal of Computer InformationSystems 45 (3), 2005, pp. 113–122.
[49] M. Anandarajan, M. Igbaria, U.P. Anakwe, IT acceptance in a less-developedcountry: a motivational factor perspective, International Journal of InformationManagement 22 (1), 2002.
[50] S. Ang, C. Soh, User information satisfaction, job satisfaction, and computerbackground: an exploratory study, Information & Management 32 (5), 1997,pp. 255–266.
[51] F. Bergeron, L. Raymond, S. Rivard, M.-F. Gara, Determinants of EIS use: testing abehavioral model, Decision Support Systems 14 (2), 2005, pp. 131–146.
[52] P. Bharati, People and information matter: task support satisfaction from theother side, Journal of Computer Information Systems 43 (2), 2002, pp. 93–102.
[53] A.D. Carswell, V. Venkatesh, Learner outcomes in an asynchronous distanceeducation environment, International Journal of Human-Computer Studies 56(5), 2002.
[54] F. Collopy, Biases in retrospective self-reports on time use: an empirical study ofcomputer users, Management Science 42 (5), 1996, pp. 758–767.
[55] E.J. Garrity, B. Glassberg, Y.J. Kim, G.L. Sanders, S.K. Shin, An experimentalinvestigation of web-based information systems success in the context of elec-tronic commerce, Decision Support Systems 39 (3), 2005.
[56] A.W. Gatian, Is user satisfaction a valid measure of system effectiveness? Infor-mation & Management 26 (3), 1994, pp. 119–131.
[57] A.W. Harrison, R.K. Rainer Jr., A general measure of user computing satisfaction,Computers in Human Behavior 12 (1), 1996, pp. 79–92.
[58] M.H. Hsu, C.M. Chiu, T.L. Ju, Determinants of continued use of the WWW: anintegration of two theoretical models, Industrial Management & Data Systems104, 2004.
[59] M. Igbaria, T. Guimaraes, Empirically testing the outcome of user involvement inDSS development, Omega 22 (2), 1994, pp. 157–172.
[60] M. Igbaria, M. Tan, The consequences of information technology acceptance onsubsequent individual performance, Information & Management 32 (3), 1997, pp.113–121.
[61] R.A. Jones, N.L. Jimmieson, A. Griffiths, The impact of organizational culture andreshaping capabilities on change implementation success: the mediating role ofreadiness for change, Journal of Management Studies 42 (2), 2005, pp. 361–386.
[62] C. Kim, K. Suh, J. Lee, Utilization and user satisfaction in end-user computing: atask contingent model, Information Resources Management Journal 11 (4), 1998,pp. 11–24.
[63] H.W. Kim, H.C. Chan, S. Gupta, Value-based adoption of mobile internet: anempirical investigation, Decision Support Systems 43 (1), 2007, pp. 111–126.
[64] U. Konradt, T. Christophersen, U. Schaeffer-Kuelz, Predicting user satisfaction,strain and system usage of employee self-services, International Journal ofHuman-Computer Studies 64 (11), 2006, pp. 1141–1153.
[65] S.M. Lee, Y.R. Kim, An empirical study of the relationships among end-userinformation systems acceptance, training and effectiveness, Journal of Manage-ment Information Systems 12 (2), 1995, pp. 189–203.
[66] C.C. Liao, P. Palvia, H.N. Lin, The roles of habit and web site quality in e-commerce,International Journal of Information Management 26 (6), 2006, pp. 469–483.
[67] N.J. Lightner, What users want in e-commerce design: effects of age, education,and income, Ergonomics 46, 2003.
[68] J.C.C. Lin, H.-P. Lu, Towards an understanding of the behavioural intention to use aweb site, International Journal of Information Management 20 (3), 2000.
[69] H.-P. Lu, H.-J. Yu, S.S.K. Lu, The effects of cognitive style and model type on DSSacceptance: an empirical study, European Journal of Operational Research 131(3), 2001.
[70] R.P. Marble, A system implementation study: management commitment toproject management, Information & Management 41 (1), 2003.
[71] S.A. Morris, T.E. Marshall, R.K. Rainer Jr., Impact of user satisfaction and trust onvirtual team members, Information Resources Management Journal 15 (2), 2002,pp. 22–30.
[72] J.C. Roca, C.M. Chiu, F.J. Martinez, Understanding e-learning continuance inten-tion: an extension of the technology acceptance model, International Journal ofHuman-Computer Studies 64 (8), 2006, pp. 683–696.
[73] H.P. Shih, Extended technology acceptance model of internet utilization behavior,Information & Management 41 (6), 2004.
[74] K. Suh, S. Kim, J. Lee, End-user’s disconfirmed expectations and the success ofinformation systems, Information Resources Management Journal 7 (4), 1994, pp.30–39.
[75] B. Szajna, Determining information system usage: some issues and examples,Information & Management 25 (3), 1993, pp. 147–154.
[76] J.T.C. Teng, K.J. Calhoun, Organizational computing as a facilitator of operationaland managerial decision making, Decision Sciences 6 (2), 1996, pp. 673–710.
[77] H.H. Teo, H.C. Chan, K.-K. Wei, Z.J. Zhang, Evaluating information accessibility andcommunity adaptivity features for sustaining virtual learning communities,International Journal of Human-Computer Studies 59 (4), 2003.
[78] G. Torkzadeh, W.J. Doll, The development of a tool for measuring the perceivedimpact of information technology on work, Omega 27 (3), 1999, pp. 327–339.
[79] G. Udo, Rethinking the effectiveness measures of decision support systems,Information & Management 22, 1992, pp. 123–135.
[80] M. Wilkins, Determinants of microcomputer usage in the republic of Ireland,Journal of End User Computing 8 (4), 1996, pp. 3–9.
[81] S.J. Winter, K.M. Chudoba, B.A. Gutek, Attitudes toward computers: when do theypredict computer use? Information & Management 34 (5), 1998, pp. 275–284.
[82] H.D. Yang, Y. Yoo, It’s all about attitude: revisiting the technology acceptancemodel, Decision Support Systems 38 (1), 2004.
[83] Y. Yoon, T. Guimaraes, Assessing expert systems impact on users’ jobs, Journal ofManagement Information Systems 12 (1), 1995, pp. 225–249.
[84] K. Yuthas, S.T. Young, Material matters: assessing the effectiveness of materialsmanagement is, Information & Management 33 (3), 1998, pp. 115–124.
Stacie Petter is Assistant Professor of Information
Systems and Quantitative Analysis at the University of
Nebraska at Omaha. Stacie received her Ph.D. and
M.B.A. from Georgia State University in Computer
Information Systems. Her research has been published
in MIS Quarterly, European Journal of Information
Systems, and Information Sciences. Stacie’s research
interests include software project management, knowl-
edge management, information systems success, and
research methods.
Ephraim R. McLean is a Regents’ Professor, holder of
the Smith Eminent Scholar’s Chair in Information
Systems, and the Chair of the CIS Department, all in
the Robinson College of Business at Georgia State
University in Atlanta, Georgia. He earned his master’s
and doctoral degrees at M.I.T.’s Sloan School of
Management and his master’s and bachelor’s degrees
in mechanical engineering at Cornell University. His
1992 paper on IS Success, co-authored with William
DeLone, is the most widely cited IS publication in
the world in the last 15 years. Last year, he stepped
down as the Executive Director of AIS after 12 years.
He is a Fellow of AIS and winner of the AIS-ICIS LEO Award for Lifetime
Achievement in IS.