a measurement study of a large-scale p2p iptv...
TRANSCRIPT

A Measurement Study of a Large-Scale P2P IPTV System
Xiaojun Hei†, Chao Liang‡, Jian Liang†, Yong Liu‡ and Keith W. Ross††Department of Computer and Information Science
‡Department of Electrical and Computer EngineeringPolytechnic University, Brooklyn, NY, USA 11201
Abstract
An emerging Internet application, IPTV, has the potentialto flood Internet access and backbone ISPs with massiveamounts of new traffic. We recently measured 200,000 IPTVusers for a single program, receiving at an aggregate simulta-neous rate of 100 gigabits/second. Although many architec-tures are possible for IPTV video distribution, several chunk-driven P2P architectures have been successfully deployedin the Internet. In order to gain insight into chunk-drivenP2P IPTV systems and the traffic loads they place on ISPs,we have undertaken an in-depth measurement study of oneof the most popular IPTV systems, namely, PPLive. Wehave developed a dedicated PPLive crawler, which enablesus to study the global characteristics of the chunk-drivenPPLive system. We have also collected extensive packettraces for various different measurement scenarios, includ-ing both campus access network and residential access net-works. The measurement results obtained through these plat-forms bring important insights into IPTV user behavior, P2PIPTV traffic overhead and redundancy, peer partnership char-acteristics, P2P IPTV viewing quality, and P2P IPTV designprinciples.
1 Introduction
With the widespread adoption of broadband residential ac-cess, IPTV may be the next disruptive IP communicationtechnology [11]. With potentially hundreds of millions ofusers watching streams of 500 kbps or more, IPTV wouldnot only revolutionize the entertainment and media indus-tries, but could also overwhelm the Internet backbone andaccess networks with traffic. Given this possible tidal waveof new Internet traffic, it is important for the Internet researchcommunity to acquire an in-depth understanding of the de-livery of IPTV, particularly for the delivery architectures thathold the greatest promise for broad deployment in the nearfuture.
There are several classes of delivery architectures forIPTV, including native IP multicast [14], application-levelinfrastructure overlays such as those provided by CDN com-panies [1, 19], peer-to-peer multicast trees such as in end-system multicast [12], and chunk-driven P2P streaming such
as CoolStreaming [26] and PPLive [6]. Each of these archi-tectures classes imposes different traffic patterns and designchallenges on Internet backbone and access networks. Re-quiring minimal infrastructure, P2P architectures offer thepossibility of rapid deployment at low cost.
In terms of the number of simultaneous users, the mostsuccessful IPTV deployments to date have employed chunk-driven P2P streaming architectures. Bearing strong similari-ties to BitTorrent [13], chunk-driven P2P architectures havethe following characteristics:
1. A television channel is divided into media chunks (e.g.,each chunk consisting of one second of media data) andis made available from an origin server.
2. A host, interested in viewing a particular channel, re-quests from the system a list of hosts currently watchingthe channel. The host then establishes partner relation-ships (TCP connections) with a subset of hosts on thelist.
3. Each host viewing the channel buffers and shareschunks with other hosts viewing the same channel. Inparticular, a host periodically receives buffer maps fromeach of its current partners. The buffer map indicatesthe chunks the partner currently has available. Using ascheduling algorithm, the host requests from its partnersthe chunks that it will need in the near future.
4. As in BitTorrent, each host continually seeks new part-ners that deliver data at higher rates than its existingpartners.
An important characteristic of chunk-driven P2P algorithmsis the lack of an (application-level) multicast tree - a charac-teristic particularly desirable for the highly dynamic, high-churn P2P environment [26]. Although these chunk-drivenalgorithms have similarities with BitTorrent, BitTorrentin it-self is not a feasible delivery architecture, since it does notaccount for the real-time needs of IPTV.
Several chunk-driven P2P streaming systems have beensuccessfully deployed to date, accommodating thousands ofsimultaneous users. Almost all of the these deploymentshave originated from China (including Hong Kong). The pi-oneer in the field, CoolStreaming, reported that more than
1

4, 000 simultaneous users in 2003. More recently, a num-ber of second-generation chunk-driven P2P systems have re-ported phenomenal success on their Web sites, advertisingtens of thousands of simultaneous users who watch channelsat rates between 300 kbps to 1 Mbps. These systems includePPLive [6], ppStream [7], VVSky [9], TVAnts [8] and FeiD-ian [4].
Given the success to date of many of these IPTV systems,as well as their potential to swamp the Internet with massiveamounts of new traffic in the near future, we have been moti-vated to carry out an extensive measurement study on one ofthe chunk-driven P2P streaming systems, namely, PPLive.We chose PPLive as it is currently one of the most popu-lar – if not the most popular – IPTV deployment to date.In particular, as part of a preliminary study we performedon PPLive, we measured the number of simultaneous userswatching a PPLive broadcast of the annual Spring FestivalGala on Chinese New Year on January 28, 2006. We ob-served that PPLive broadcasted this event to over 200,000users at bit rate in the 400-800 kbps range, corresponding toan aggregate bit rate in the vicinity of 100 gigabits/sec!
In an earlier workshop paper, we reported preliminarymeasurement results for PPLive [17]. The current papergoes significantly further, providing a comprehensive studyof PPLive, including insights into the global properties ofthesystem. Achieving these deeper insights has been challeng-ing because the PPLive protocol is proprietary. In particular,in order to build the measurement tools that were used to col-lect much of the data in this paper, we had to analyze a largeportion of the PPLive protocol.
In this paper, we seek to answer the following questionsabout a large-scale P2P IPTV deployment:
• What are the user characteristics?For both popular andless-popular PPLive channels, how does the number ofusers watching a channel vary with time? As with tra-ditional television, are there diurnal variations in userdemand? What are the dynamics of user churn? Whatis the geographic distribution of the users, and how doesthis distribution fluctuate over time.
• How much overhead and redundant traffic is there?What fraction of bytes a peer sends (or receives) is con-trol data and what fraction is actual video data? Whatfraction of the video traffic that a peer receives is redun-dant traffic?
• What are the characteristics of a peer’s partnershipswith other peers?How many partners does a peer have?What are the durations of the partnerships? At whatrates does a peer download from and upload to its part-ners? How are the partnerships different for a campuspeer and a residential peer? How do the partnershipscompare to those in BitTorrent?
• How good is the viewing quality?What are the view-ing quality metrics in an IPTV system? How well doesPPLive perform with respect to these metrics?
• What are the fundamental requirements for a successful
chunk-driven P2P IPTV system?How does a P2P IPTVsystem maintain high enough downloading rates on allpeers with heterogeneous uploading capacities? Whatis the video buffering requirement for smooth playbackon individual peers in the face of rate fluctuations onpeering connections and peer churns?
In this paper, we attempt to answer these questions by us-ing a custom-designed PPLive crawler and using packet snif-fers deployed at both high-speed campus access and broad-band residential access points. Quantitative results obtainedin our study bring light to important performance and designissues of live streaming over the public Internet.
This paper is organized as follows. We conclude this sec-tion with an overview of related P2P measurement work. InSection 2, we provide an overview of different aspects ofPPLive including architecture, signal and management pro-tocols based on our measurement studies. The design anddevelopment of the tools are presented in details in Section3. Our measurement tools include an active crawler and apassive sniffer. In Section 4, using our PPLive crawler, wepresent the global-scale measurement results for the PPLivenetwork, including number of users, arrival and departurepatterns, and peer geographic distributions. In Section 5,by sniffing monitored peers, we present the traffic patternsand peering strategies as viewed by residential and campusPPLive clients. In Section 6, we characterize the stream-ing performance of PPLive, including playback freezing andrestoration, using our playback monitor. Finally, based onour measurement results, we outline some design guidelinesfor the successful deployment of IPTV application over theInternet in Section 7.
1.1 Related P2P Measurement Work
To our knowledge, this paper (along with [17]) is the firstmeasurement study of a large-scale P2P streaming system.There are, however, a number of recent measurement stud-ies of other types of P2P systems, including file sharing,content-distribution, and VoIP. For file sharing, Saroiu etal.measured the Napster and Gnutella [23] and provided a de-tailed characterization of end-user hosts in these two sys-tems. Their measurement results showed significant het-erogeneity and lack of cooperation across peers participat-ing in P2P systems. Gummadi et al. monitored KaZaatraffic [16] for characterizing KaZaa’s multimedia workloadand they showed locality-aware P2P file-sharing architec-tures can achieve significant bandwidth savings. Ripeanuet al. crawled the one-tier Gnutella network to extract itsoverlay topology. For the latest two-tier Gnutella network,Stutzbach et al. provided a detailed characterization of P2Poverlay topologies and their dynamics in [25]. Liang et al.deployed active crawling in [20] to reveal in-depth under-standing of KaZaa overlay structure and dynamics. In [21],Liang et al. further demonstrated the existence of contentpollution and poisoning in KaZaa using an active crawler.
2

A measurement study was carried out for the live stream-ing workload from a large content delivery network in [24].For content distribution, Izal et al. and Pouwelse et al. re-ported measurement results for BitTorrent [18] and [22]. ForVoIP, two measurement studies of Skype are available [10]and [15]. A detailed protocol analysis of Skype was pre-sented in [10] and Skype traffic pattern reported in [15] dif-fers fundamentally from previous file-sharing P2P systems.Performance evaluation of CoolStreaming was carried outover PlanetLab [26] and the measurement results showedthat chunk-driven live streaming systems achieve significantmore continuous media playback than tree based systems.
2 Overview of PPLive
PPLive is a free P2P IPTV application. According to thePPLive web site [6] in May 2006, PPLive provides200+channels with400, 000 daily users on average. The bit ratesof video programs mainly range from250 kbps to400 kbpswith a few channels as high as800 kbps. PPLive does notown video content; the video content is mostly feeds fromTV channels in Mandarin. The channels are encoded intwo video formats: Window Media Video (WMV) or RealVideo (RMVB). The encoded video content is divided intochunks and distributed to users through the PPLive P2P net-work. The PPLive web site [6] provides limited informa-tion about its proprietary technology. Through our measure-ment studies and protocol analysis, however, we have gainedsignificant insight into the PPLive protocols and streamingmechanisms. In order to gain a better understanding of ourmeasurement tools and results, in this section we provide anoverview of the PPLive operation. The overview also pro-vides an introduction into the design of a chunk-based videostreaming system.
The PPLive software, running in user computers (peers),has two major communication protocols:(i) a registrationand peer discovery protocol; and(ii) a P2P chunk distribu-tion protocol. Figure 1 depicts an overview of the registra-tion and peer discovery protocol. When an end-user starts thePPLive software, it joins the PPLive network and becomes aPPLive peer node. The first action (step1) is an HTTP ex-change with the PPLive Web site to retrieve a list of channelsdistributed by PPLive. Once the user selects a channel, thepeer node registers with the bootstrap root servers and re-quests a list of peers that are currently watching the channel(step2). The peer node then communicates with the peersin the list to obtain additional lists (step3), which it aggre-gates with its existing list. In this manner, each peer main-tains a list of other peers watching the channel. A peer on alist is identified by its IP address and UDP and TCP serviceport numbers. The registration and peer discovery protocolis commonly running over UDP; however, if UDP fails (forexample, because of a firewall), PPLive will instead use TCPfor registration and peer discovery.
We now describe the chunk distribution protocol. At any
PC
channel list server
PC
PC
PC
peer list root server
1
2
3
Figure 1: Channel and peer discovery
given instant, a peer buffers up to a few minutes worth ofchunks within a sliding window. Some of these chunks maybe chunks that have been recently played; the remainingchunks are chunks scheduled to be played in the next fewminutes. Peers upload chunks to each other. To this end,peers send to each other “buffer map” messages; a buffermap message indicates which chunks a peer currently hasbuffered and can share. The buffer map message includesthe offset (the ID of the first chunk), the length of the buffermap, and a string of zeroes and ones indicating which chunksare available (starting with the chunk designated by the off-set). The offset field is of 4 bytes. For one PPLive channelwith the bit rate of 340 kbps and a chunk size of 14 KBytes,this chunk range of232 indicates the time range of 2042 dayswithout wrap-up. Figure 2 illustrates a buffer map. A peer
offset
0playable media file
gap
1 1 1 1 1 1 1 0 0 0 1 0 1 0 0 1
buffer map
time
... ...
Figure 2: A peer’s buffer map of video chunks
can request, over a TCP connection, a buffer map from anypeer in its current list of peers. After a peer A receives abuffer map from peer B, peer A can request one or morechunks that peer B has advertised in the buffer map. Aswe will see in Section 5, a peer A may download chunksfrom tens of other peers simultaneously. PPLive continu-ally searches for new partners from which it can downloadchunks. Since PPLive is proprietary, we do not know the ex-act algorithm a peer uses for choosing partners and request-ing chunks. Clearly, when a peer requests chunks, it shouldgive some priority to the missing chunks that are to be playedout first. Most likely, it also gives priority to rare chunks,thatis, chunks that do not appear in many of its partners’ buffermaps (see [2] [26]). Peers can also download chunks fromthe PPLive channel server. The chunks are sent over TCPconnections.
Having addressed how chunks are distributed amongpeers, we now briefly describe the video display mecha-
3

nism. As mentioned above, PPLive works in conjunctionwith a media player (either Windows Media Player or Re-alPlayer). Figure 3 illustrates the interaction between thePPLive peer software and the media player. The PPLiveengine, once having buffered a certain amount of contigu-ous chunks, launches the media player. The media playerthen makes an HTTP request to the PPLive engine, andthe PPLive engine responds by sending video to the mediaplayer. The media player buffers the received video; when ithas buffered a sufficient amount of video content, it beginsto render the video.
Media Player
InternetMedia User
Interface Queue
S
PPLive Engine
Queue
streaming direcion
Figure 3: PPLive streaming process
If, during video playback, the PPLive engine becomes in-capable of supplying the video player with data at a sufficientrate (because the PPLive client is in turn not getting chunksfast enough from the rest of the PPLive network), then themedia player will starve. When this occurs, depending onthe severity of the starvation, the PPLive engine may havethe media player wait where it left off (freezing) or it mayhave the media player skip frames.
3 Measurement Methodologies
Our P2P network measurements fall into two categories: ac-tive crawling and passive sniffing. The active crawling isused to obtain a global view of the entire PPLive network forany channel. Our crawler has a UDP component for collect-ing peer lists from all the PPLive peers; and a TCP compo-nent for collecting buffer maps from all the PPLive peers.The passive sniffing is used to gain a deeper insight intoPPLive from the perspective of residential users and campususers.
3.1 Active Crawling
To characterize the behavior of the entire PPLive network,we developed a crawler which repeatedly probesall of thePPLive nodes that are watching a specific channel. Buildingthe crawler was a major challenge in itself, since we neededto implement portions of the PPLive proprietary protocol.To this end, using packet traces from passive sniffing and ourknowledge about how chunk-driven P2P streaming generallyoperates, we were able to understand critical portions of thePPLive’s signaling protocols. During a crawling experiment,peer responses are recorded for online processing and off-line analysis.
3.1.1 Harvesting Peer Lists
Recall from Section 2 that each peer watching a particularchannel maintains a peer list, which lists other peers cur-rently watching the same channel. Also recall that any peerA can send to any other peer B, within a UDP datagram,a request for peer B’s peer list. The crawler, implementingthe PPLive protocol, sweeps across the peers watching thechannel and obtains the peer list from each visited peer. Thecrawler does these three phases:
• Peer Registration:The UDP crawler first registers it-self with one of the root servers by sending out a peerregistration packet. The significant information in thispacket includes a128 bit channel identifier, its IP ad-dress, and its TCP and UDP service ports. In contrastto many other popular P2P applications, a PPLive peerdoes not maintain a fixed peer ID, but instead generatesa new, random value every time it re-joins the channel.
• Bootstrap:After the registration, the crawler sends outmultiple bootstrap peer list queries to the peer-list rootserver for peers enrolled in this channel. In responseto a single query, the server will return a list of peers(normally50 peers), including IP addresses and serviceport numbers. The crawler aggregates all the lists it hasreceived, thereby maintaining its own list of peers en-rolled in the channel.
• Peer Query:After obtaining an initial peer list from theroot servers, the crawler sends peer list queries directlyto those peers from the initial list. Active peers willreturn part of their own peer lists, which get added tothe crawler’s list.
PPLive clients are highly dynamic, joining and leavingPPLive and switching between channels frequently. To ac-count for the highly dynamic nature of the PPLive clients, wedesigned the crawler to periodically crawl the PPLive net-work to track active peers once a minute. In particular, everyone minute, the crawler starts from scratch, with an emptypeer list. Furthermore, within each minute, the crawler isonly active for the first 15-seconds, during which it:
1. Obtains an initial peer list for the root server.
2. Sends peer queries to non-queried peers in the list.
3. Marks a peer active if it responds to the query with itsown peer list; expands the crawler’s peer list using thelists received from active peers; returns to step(2) untilno new peers are obtained by peer queries.
Then we have finished oneloop of probing. In our experi-ments, it normally takes about6 seconds to finish one loop.After one loop, to include peers that joined the network dur-ing the probing loop, the crawler goes back to the beginningof the list and probes all the peers again to find new activepeers. We repeat the process until15 seconds run up. Thecrawler then records the active peers seen in this15 seconds,clears its memory, and goes to sleep until the beginning of
4

the next minute. In this manner we obtain a profile of the ac-tive peers every minute. We note in passing that the crawlerdoesn’t use a NAT traversal scheme. Peers behind NATs maynot set their NATs properly to receive peer queries from thecrawler. Our crawler therefore under-estimates the numberof active peers; in fact, in some of experiments we observedthat as many as 37% of the PPLive peers could be behindNATs. Although NATs make it difficult to determine the ab-solute number of users at any time, our measurement resultsstill enable us to report time evolutionary trends and also pro-vide lower bounds on the number of users.
3.1.2 Harvesting Buffer Maps from Active Peers
To monitor the buffer content of PPLive clients, we aug-mented the crawler with a TCP component that retrieves thebuffer map from the active peers during above crawling pro-cess. To this end, as we crawl each peer, the crawler sendsa PPLive request for the peer’s buffer map. We then parsethe buffer maps off-line, to glean information about bufferresources and timing issues at the remote peers throughoutthe network.
3.2 Passive Sniffing
Passive sniffing captures the traffic exchanged between ourmonitored peers and their partners in the PPLive network.We collected multiple PPLive packet traces from four PCs:two PCs connected to Polytechnic University campus net-work with 100 Mbps Ethernet access; and two PCs con-nected to residential networks through cable modem. Mostof the PPLive users today have either one of these two typesof network connections. The PCs with residential accesswere located at Manhattan and Brooklyn in New York. EachPC ran Ethereal [3] to capture all inbound and outboundPPLive traffic. We built our own customized PPLive packetanalyzer to analyze the various fields in the various PPLivesignaling and content packets.
3.2.1 Playback Monitoring
In IPTV, user’s perceived quality is vital for a successfulservice. As shown in Figure 3, the media player interactswith the PPLive engine. Whenever the PPLive engine hasreceived playable media chunks, the PPLive engine streamsthese media chunks to the player. When the media playerruns out of media contents, the player freezes, impactingthe user perceived quality. To trace the user playback per-formance, we developed a simple PPLive playback moni-tor. This monitor emulates the normal media playback pro-cess and tracks the presentation time of the latest mediachunk. The difference between the actual playback time andthe latest media chunk presentation time indicates the sizeof playable media size in the player. The monitor reportsan playback freeze whenever this time difference reaches0.During the playback freezing period, the monitor continues
receiving media content from the PPLive engine. When thebuffered content is above a threshold, which is specified bythe content source in the media file header, the monitor re-ports a recovery from freeze.
4 Global Behavior of the PPLive Net-work
In this section, we reportglobal statisticsfor the PPLive net-work collected by UDP component of the crawler. PPLivehosts more than200 different programs. To compare thecharacteristics of different programs, we crawled two pro-grams: XING, a popular channel with a5-star popularitygrade: and GUANG, a less popular channel with a1-starpopularity grade. The two programs were both crawled forone entire day in April, 2006. The crawler crawled bothprograms every minute as described in the previous section.Based on the lists of the active peers at every minute ofthe crawled programs, we calculated the number of users,user arrivals and departures, and user geographic locations.What’more, we also collected data during the Chinese NewYear to observe some user behavior.
4.1 Number of Participating Users
Figure 4 shows how the number of users evolves for bothcrawled programs. Both sub-figures are labelled in US East-ern Standard Time. We first observe that the numbers of par-ticipating users are quite different for the two programs. Themaximum number of users for the popular program reachesnearly1, 700; however, that of the unpopular program is justaround120. The diurnal trend is clear for both programs.The major peaks appear during9AM to 1PM EST, translat-ing into 9PM to 1AM China local time. As we shall see,those peaks are mostly contributed by users from China.There are several smaller peaks scattered around9PM to5AM, translating into9PM EST to2AM WST. We believethose are mostly due to users in US. We will show the usergeographic distribution in Section 4.3. This suggests thatpeople tend to use IPTV to watch TV programs outside of of-fice hours, consistent with the behavior of regular TV users.In contrast, a recent measurement study on Skype [15] sug-gests that people tend to use VoIP service at work.
In Fig 5, we plot the evolution of the number of users forthe popular channel over one week. We can observe thatmore people use PPLive during weekends than during week-days. This again confirms that most users use IPTV in theirleisure time. As with many other P2P applications, the num-ber of IPTV users is largely determined by the popularity ofthe program. The annual Spring Festival Gala on ChineseNew Year is one of the most popular TV programs withinChinese communities all over the world. Starting from3AMEST, January28, 2006 (Chinese New Year Eve day), we ranthe crawler to collect all peer IP addresses from14 PPLivechannels which were rebroadcasting the event. Figure 6 plots
5

0 2 4 6 8 10 12 14 16 18 20 22 24200
400
600
800
1000
1200
1400
1600
1800
Time(h)
# of
act
ive p
eers
(a) Popular Channel
0 2 4 6 8 10 12 14 16 18 20 22 240
20
40
60
80
100
120
Time(h)
# of
act
ive p
eers
(b) Less Popular Channel
Figure 4: Diurnal Trend of Number of Participating Users
Sat Sun Mon Tue Wed Thu Fri Sat Sun0
500
1000
1500
2000
2500
Data(noon)
# of
act
ive p
eers
Figure 5: Weekly Trend of Number of Users
the number of peers watching this event live through PPLive.There was a sharp jump from50, 000 peers to200, 000 peersafter the event started at7AM EST. The number of usersstayed at this high level for around4 hours. The numberof users went back to normal when the event finished atabout12AM EST. The near constant user population duringthe event suggests that chunk-driven P2P streaming systemsscales well, handling a flash crowd in a live broadcasting.We will come back to the video quality issue in Section 6.
4.2 User Arrivals and Departures
In this section, we examine the peer arrival and departurepattern for the popular channel. We record a peer arrivalwhen the crawler finds a new IP address joining the program.To deal with possible losses of peer queries and responses,we only record a peer departure if a previously active peerdoesn’t respond to three consecutive queries.
The numbers of peer arrivals and departures of the popu-lar channel in every minute of one day are plotted in Figure7. Since it is a popular program, many peers continuously
4 8 12 16 20 24 4 8 12 16 20 2410
3
104
105
106
Time(h)
# of
pee
rs
Jan. 28 Jan. 29
Figure 6: Flash Crowd on Chinese New Year Eve
join and leave. Comparing this figure with that the evolutionof the number of active peers, Figure 4(a), we see peers joinand leave at a higher rate at the peak time. Note the con-secutive pulse spacings of about2 hours in Figure 7(b). Thepulses are due to many peers leaving immediately and simul-taneously at the end of (roughly) two-hour programs. Thisbatch-departures pattern in PPLive system is different fromp2p file sharing systems, where peer departures are mostlytriggered by the asynchronous completions (or, the detec-tions of completions) of file downloads. This suggests thatp2p IPTV systems expect lower peer churn rates in the mid-dle of a program. Consequently, peers can maintain morestable partnership with each other. We will address this morein Section 5.2.3.
0 2 4 6 8 10 12 14 16 18 20 22 240
10
20
30
40
50
60
70
80
90
100
Time(h)
# of
arri
val
(a) Peer Arrival Rate
0 2 4 6 8 10 12 14 16 18 20 22 240
20
40
60
80
100
120
140
160
180
200
Time(h)
# of
dep
artu
re
(b) Peer Departure Rate
Figure 7: Peer Arrival and Departure Evolution of a PopularChannel
We define the peer lifetime the time between the arrivaland the departure of the peer. Our analysis shows that peerlifetimes vary from very small values up to16 hours. Thereare totally34, 021 recorded peer sessions for the popularchannel and2, 518 peer sessions for the unpopular channel.
6

The peer lifetime distribution in Figure 8 suggests that thepeers prefer to stay longer for popular programs than for un-popular programs. However90% of peers for both programshave lifetimes shorter than1.5 hours.
0 30 60 90 120 150 1800
0.1
0.2
0.3
0.4
0.5
0.6
0.7
0.8
0.9
1
Time(min)
CDF
prob
abilit
y
popunpop
Figure 8: Peer Lifetime Distribution
4.3 User Geographic Distribution
We classify PPLive users into three categories according totheir IP addresses: users from Asia, users from North Amer-ica, and users from the rest of the world. To accomplish this,we query the free MaxMind GeoIP database [5] to obtain thecountry that each user belongs to with the recorded user IPaddress as the input. Figure 9 shows the evolution of the geo-graphic distribution of the popular channel during one entireday. The figure is divided into three regions by two curves.The bottom region is made up of the peers from Asia, themiddle region is for the peers from North America, and thetop region is for peers from the rest of the world. We can seethat most of users come from Asia. Again, the curve reachesit lowest point around7PM to8PM EST.
0 2 4 6 8 10 12 14 16 18 20 22 2470%
75%
80%
85%
90%
95%
100%
Time(h)
Dist
ribut
ion
of p
eers
OthersNorth AmericaAsia
Figure 9: Evolution of Geographic Distribution
Fig 10 plots the evolution of peer geographic distributionfor the Spring Festival Gala event on the past Chinese NewYear’s Eve. This figure has the same format as Figure 9,with three regions denoting three different geographical re-gions. We can see that for this event, many peers from out-side of Asia were watching the live broadcast – in fact, asignificantly higher percentage of peers were from outsideof Asia as compared with Figure 9. The distribution evolu-tion is consistent with the observations in Section 4.2: Peersfrom North America have the smallest share at about7AMEST, and the largest share at about8PM EST. Thus the be-
havior of users in North America is quite similar to users inAsia.
4 8 12 16 20 24 4 8 12 16 20
10%
20%
30%
40%
50%
60%
70%
80%
90%
100%
Time(h)
Dist
ribut
ion
of p
eers
OthersNorth AmericaAsia
Jan. 28 Jan. 29
Others
Figure 10: Evolution of Geographic Distribution during Chi-nese New Year’s Eve
5 Local Views from Monitored Peers
In this section, we present detailed statistics derived frompacket traces collected on our monitored peers. As summa-rized in Table 1, we collected traces from four peers, each ofwhich was watching one of two channels (either the popu-lar CCTV3 or the less popular CCTV10) from either a cam-pus network or residential networks. Data was obtained atdifferent granularities, including byte-level, packet-level andsession-level, to help us understand PPLive’s signaling andstreaming protocols and its impact on the Internet.
5.1 Video Traffic and Signaling Overhead
A PPLive peer generates and receives both video and sig-naling traffic. In this paper, we are mainly concerned withthe video traffic, since it is responsible for majority of thetraffic in most P2P streaming systems. In order to present aclear picture of the nature of the PPLive video traffic, we usea simple heuristic to filter out the signaling traffic from ourtraces. The ideas behind heuristic can likely be employedfor the analysis of many P2P streaming systems, includingPPLive.
In a chunk-driven P2P video streaming system, a peer nor-mally has a large number of ongoing TCP connections withother peers. Some of these connections contain only sig-naling traffic; other connections contain video chunks andpossibly some signalling traffic. The chunk size is typicallymuch larger than the maximum payload size of a TCP seg-ment (typically 1460 bytes). For example, in PPLive, thechunk size is larger than 14 KBytes (the exact chunk sizedepends on the bitrate). Thus, if a TCP connection carriesvideo, it should have a large number (say, at least 10) of largesize TCP segments (say,> 1200 bytes) during its lifetime.These observations lead to the following heuristic:
1. For a given TCP connection, we count the cumulativenumber of large packets (> 1200 bytes) during the con-nection’s lifetime. If the cumulative number of largepackets is larger than 10, this connection is labeled as
7

Table 1: Data setsTrace Name Trace size Duration Playback Rate Total IPs Active IPs Download Upload
(Byte) (Sec) (Kbps) (MByte) (MByte)CCTV3-Campus 784,411,647 7676 340 3105 2691 360.99 4574.57
CCTV3-Residence 132,494,879 7257 340 1616 1183 372.53 352.75CCTV10-Campus 652,000,813 7285 312 1008 910 317.08 3815.34
CCTV10-Residence 66,496,909 9216 312 797 282 385.50 7.68
a “video TCP connection”; otherwise, the connection islabeled as a “signaling TCP connection”. We filter fromthe traces all signaling TCP connections.
2. A video TCP connection may include some signalingtraffic as well. For each video TCP connection, we fur-ther filter out all packets smaller than 1200 bytes.
We first use this heuristic to estimate the fraction of up-stream and downstream signaling overhead for each of thefour traced peers. The signaling overhead consists of thepayloads of all UDP packets, plus the payloads of all the TCPpackets in the signaling connections, plus the payloads of allthe TCP packets less than 1200 bytes in all of the video con-nections. From Table 2 we see that the signaling overhead isgenerally in the 5% to 8% range.
5.1.1 Video Traffic Redundancy
Due to the distributed nature of chunk-driven P2P streaming,it is possible that a peer downloads duplicate chunks frommultiple partners. The transmission of redundant chunkswastes network and access bandwidth; hence, we are inter-ested in measuring the redundancy traffic once the streamingplayer begins to playback steadily. To this end, to minimizethe impact of transient behavior, the first 10 minutes of thetraces are not used for this redundancy analysis . ExcludingTCP/IP headers, we determine the total streaming payloadfor the download traffic. Utilizing the video traffic filteringheuristic rule, presented in Section 5.1, we are able to extractthe video traffic. Given the playback interval and the me-dia playback speed, we obtain a rough estimate of the mediasegment size for the playback interval. We compute the re-dundant traffic as the difference between the total receivedvideo traffic and the estimated media segment size. We de-fine the redundancy ratio as the ratio between the redundanttraffic and the estimated media segment size. From Table 3,we observe that the traffic redundancy to be small. This ispartially due to the long buffer time period so that PPLivepeers have enough time to locate peers in the same stream-ing channel and exchange content availability informationbetween themselves.
The negative redundancy ratio (−3.5%) for CCTV3-Campus indicates that the video download chunks are notsufficient for smooth video playback. As shown in Figure11(a), at time10 < t < 20 minute and60 < t < 64 minutefor CCTV3-Campus, the download rate decreases signifi-cantly and the PPLive playback may suffer seriously lack-
ing of video chunks. Given the good connectivity of campusnetwork, this abnormal case requires further investigation.
5.1.2 Download and Upload Video Traffic
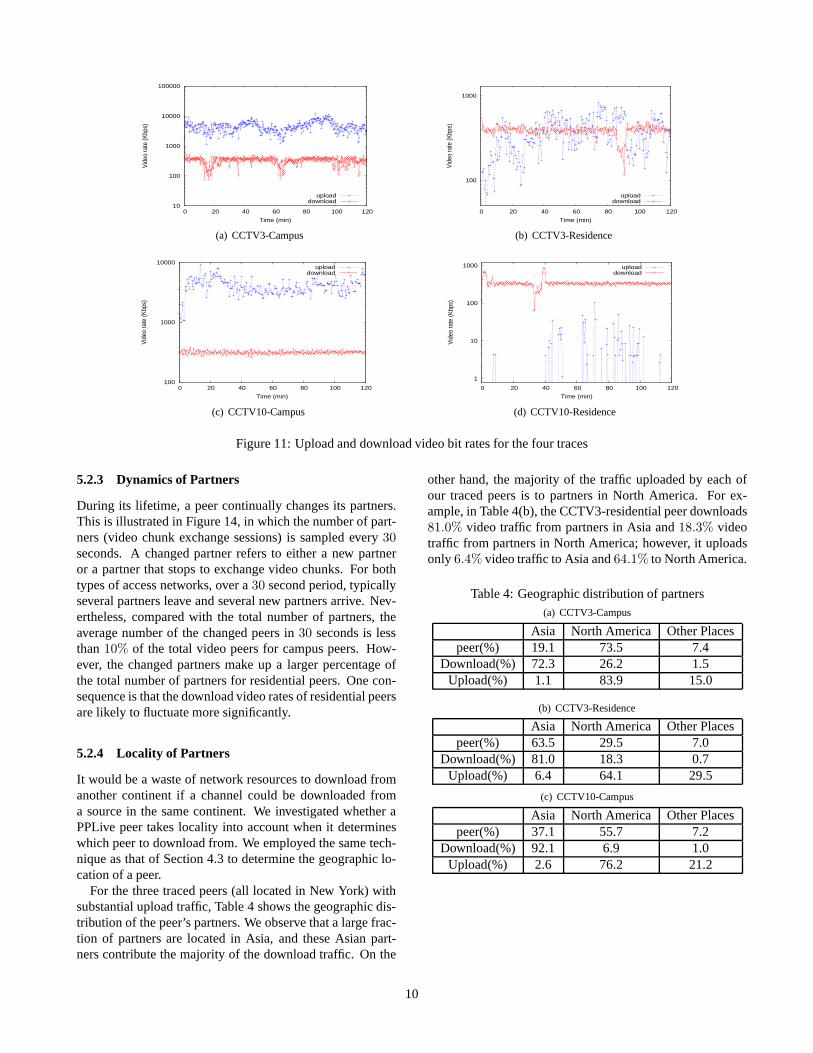
Having isolated the video traffic, we examine the aggregateamount of upload and download video traffic leaving and en-tering the four peers. Figure 11 plots the upload and down-load rates for the video traffic for the four traces beginningfrom startup. Each data point is the average bit rate over a30second interval. We make the following observations:
1. The aggregate download rates closely hug the videoplayback rates, even for campus peers where the avail-able bandwidth greatly exceeds the playback rate. Thisis very different from BitTorrent, which tries to use asmuch of its downstream bandwidth as possible.
2. A P2P streaming peer’s aggregate upload rate cangreatly exceed the aggregate download rate. For exam-ple, we see that for two campus peers, the upload rateexceeds the download rate by (approximately) a factorof 10. This is also very different from BitTorrent, whosetit-for-tat mechanism encourages peers of roughly equalcapacity to partner with each other.
3. In a P2P streaming system, not all peers have an ag-gregate upload rate exceeding the download rate. Forexample, we see that one of the residential peers up-loads at an average rate approximately equal to the av-erage download rate, and the other residential peer doesalmost no uploading. Thus, some peers act asampli-fiers, pumping out bytes at rates higher than the receiverate; some peers act asforwarders, pumping out bytesat roughly the same average rate as the receive rate; andsome peers act assinks, forwarding very little trafficover their lifetimes.
One important lesson learned is that even though an accesslink may have asymmetric downstream and upstream band-widths (such as ADSL), with the downstream bandwidthbeing higher than the upstream bandwidth, the actual bitrates can have opposite behavior, with uploading rates beinghigher than the downloading rates. Thus, P2P video stream-ing can potentially severely stress the upstream capacity ofaccess ISPs.
Note that in trace CCTV10-Residence, the download ratefalls significantly below the playback rate for about4 min-utes at about timet = 33 minutes. After this decrease, the
8

Table 2: PPLive traffic overheadTrace name upload (MByte) download(MByte)
Signaling Video Percentage Signaling Video PercentageUDP TCP TCP Overhead(%) UDP TCP TCP Overhead(%)
CCTV3-Campus 0.60 43.7 3951.4 1.11 0.88 22.6 285.7 7.59CCTV3-Residence 2.87 19.9 313.2 6.78 4.40 23.5 314.9 8.14CCTV10-Campus 1.23 73.8 3406.3 2.16 1.28 21.6 259.4 8.11
CCTV10-Residence 1.55 2.7 4.4 49.13 2.76 23.9 351.6 7.05
Table 3: Video traffic redundancyTrace name Interval Total download Video download Estimated media segment sizeRedundancy ratio
(second) (MByte) (MByte) (MByte)CCTV3-Campus 6966.2 308.3 285.7 296.1 -3.5%
CCTV3-Residence 6512.6 338.4 314.9 276.8 13.8%CCTV10-Campus 6600.7 281.0 259.4 257.4 0.76%
CCTV10-Residence 8230.5 375.5 351.6 321.0 9.5%
peer aggressively downloads from the network, download-ing at a rate higher than the playback rate for about3 min-utes. Then the download rate becomes steady again. Despitethe PPLive and media player buffering, this download ratedeficit may have impacted the quality of the video playback.
Although not as high as the two campus peers, the res-idential peer watching CCTV3 contributed traffic volumecomparable to its download traffic volume. However, theother residual peer (watching CCTV10) only uploaded4.6MBytes of video to other peers. Since the two residentialpeers have similar access bandwidth, we seek an explana-tion for why this one peer hardly uploaded any video. Onepossibility is that the other peers contribute sufficient uploadbandwidth, so that this residential peer simply doesn’t needto contribute. Another possibility is that the buffering andrendering for this residential peer lags behind most of theother peers; thus, relatively few other peers can use the res-idential peer’s chunks (we will discuss this lagging issue inmore detail in Section 6).
5.2 Properties of Video TCP Connections
In this section we examine the basic properties of video TCPconnections in PPLive, including connection duration, num-ber of partners, partner churn, and upload/download trafficto/from partners.
5.2.1 Duration of Video TCP Connections
A video TCP connection begins with the TCP SYN packet;we say that the connection ends when we see a TCP FINpacket or when we see a packet that is not followed by anyother packet in the connection for two minutes. Figure 12provides a typical Complementary Cumulative DistributionFunction (CCDF) of video TCP connection durations. Notethat durations spread over a wide range. The median dura-tion is about 20 seconds and only about10% of the connec-tions last for over15 minutes. Because many connections
are short, a peer may only exchange a few video chunks withits partner before the connection ends.
100
101
102
103
10−2
10−1
100
Video session duration x(sec)
CCDF
(1−F
(x))
Figure 12: CCDF of duration of video TCP connection forCCTV3-Campus
5.2.2 Number of Partners
For each of the four peers, Figure 13 plots the number ofpartners (that is, its number of video TCP connections) thepeer has as a function of time. Note that campus peershave many more partners than residential peers. A campuspeer utilizes its high-bandwidth access, maintaining a steadynumber of partners for video traffic exchange. Content popu-larity also has a significant impact on the number of partnersfor the residential peer. In particular, the residential peer withthe less-popular CCTV10 channel seems to have difficultyin finding enough partners for streaming the media. At timet = 33 minutes, the number of partners drops to1. This re-duction in partners significantly impacts the download rateofthis residential peer, as shown in Figure 11(d). In this experi-ment, the peer detected this rate reduction quickly and startedto search for new partners. New partners were quickly foundand fresh streaming flows were established; hence, the videodownload rate recovered quickly as a result.
9
10
100
1000
10000
100000
0 20 40 60 80 100 120
Vide
o ra
te (K
bps)
Time (min)
uploaddownload
(a) CCTV3-Campus
100
1000
0 20 40 60 80 100 120
Vide
o ra
te (K
bps)
Time (min)
uploaddownload
(b) CCTV3-Residence
100
1000
10000
0 20 40 60 80 100 120
Vide
o ra
te (K
bps)
Time (min)
uploaddownload
(c) CCTV10-Campus
1
10
100
1000
0 20 40 60 80 100 120
Vide
o ra
te (K
bps)
Time (min)
uploaddownload
(d) CCTV10-Residence
Figure 11: Upload and download video bit rates for the four traces
5.2.3 Dynamics of Partners
During its lifetime, a peer continually changes its partners.This is illustrated in Figure 14, in which the number of part-ners (video chunk exchange sessions) is sampled every30seconds. A changed partner refers to either a new partneror a partner that stops to exchange video chunks. For bothtypes of access networks, over a30 second period, typicallyseveral partners leave and several new partners arrive. Nev-ertheless, compared with the total number of partners, theaverage number of the changed peers in30 seconds is lessthan10% of the total video peers for campus peers. How-ever, the changed partners make up a larger percentage ofthe total number of partners for residential peers. One con-sequence is that the download video rates of residential peersare likely to fluctuate more significantly.
5.2.4 Locality of Partners
It would be a waste of network resources to download fromanother continent if a channel could be downloaded froma source in the same continent. We investigated whether aPPLive peer takes locality into account when it determineswhich peer to download from. We employed the same tech-nique as that of Section 4.3 to determine the geographic lo-cation of a peer.
For the three traced peers (all located in New York) withsubstantial upload traffic, Table 4 shows the geographic dis-tribution of the peer’s partners. We observe that a large frac-tion of partners are located in Asia, and these Asian part-ners contribute the majority of the download traffic. On the
other hand, the majority of the traffic uploaded by each ofour traced peers is to partners in North America. For ex-ample, in Table 4(b), the CCTV3-residential peer downloads81.0% video traffic from partners in Asia and18.3% videotraffic from partners in North America; however, it uploadsonly 6.4% video traffic to Asia and64.1% to North America.
Table 4: Geographic distribution of partners(a) CCTV3-Campus
Asia North America Other Placespeer(%) 19.1 73.5 7.4
Download(%) 72.3 26.2 1.5Upload(%) 1.1 83.9 15.0
(b) CCTV3-Residence
Asia North America Other Placespeer(%) 63.5 29.5 7.0
Download(%) 81.0 18.3 0.7Upload(%) 6.4 64.1 29.5
(c) CCTV10-Campus
Asia North America Other Placespeer(%) 37.1 55.7 7.2
Download(%) 92.1 6.9 1.0Upload(%) 2.6 76.2 21.2
10

10
15
20
25
30
35
40
45
50
0 20 40 60 80 100 120
# of
act
ive
vide
o pe
ers
Time (min)
campusresidence
(a) CCTV3
5
10
15
20
25
30
35
40
45
50
0 20 40 60 80 100 120
# of
act
ive
vide
o pe
ers
Time (min)
campusresidence
(b) CCTV10
Figure 13: Evolution of numbers of partners for each of fourpeers
5.2.5 Traffic Volume Breakdowns across Video TCPConnections
In a chunk-driven P2P system, a peer may download frommany partners and may upload to many partners. In this sub-section, we examine how the download rates differ amongpartners and how the upload rates differ among partners.For a campus peer, Figure 15(a) compares the peer’s aggre-gate download video rate with the download rate from thegreatest contributing peer. This top peer contributes on aver-age about50% of the total video download traffic. How-ever, the download rate from this top peer is highly dy-namic, most likely due to content availability from the toppeer and congestion in the network between the two peers.One important consequence is that a peer typically receivesvideo from more than one peer at any given time. With thismulti-download feature, the aggregate video download ratebecomes quite smooth. In conjunction with the bufferingmechanisms, PPLive typically provides smooth video play-back, as discussed in Section 6.3. We also plot analogouscurves, in log scale, for video upload in Figure 15(b). Sincethe campus node uploads to many peers, the top peer videoupload session only accounts for about5% of the total videoupload traffic.
6 User Perceived Quality
A fundamental measure of the success of an IPTV system isuser viewing satisfaction. While both subjective and anec-dotal feedback from PPLive users and the stableness of userpopulation suggest highly satisfactory user perceived qual-
0
10
20
30
40
50
0 20 40 60 80 100 120
# of
vid
eo p
eers
Time (min)
# of video peers# of changed video peers
(a) CCTV3-Campus
0
5
10
15
20
25
30
35
40
0 20 40 60 80 100 120
# of
vid
eo p
eers
Time (min)
# of video peers# of changed video peers
(b) CCTV3-Residence
Figure 14: Partner departures and arrivals
ity, in this section, we reportquantitativeresults on user per-ceived quality for PPLive. In particular, we used our mea-surement platforms, to obtain insights into start-up delay,playback freezing rate, and video buffer occupancy.
6.1 Start-up Delay
Start-up delay is the time interval from when one chan-nel is selected until actual playback starts on the screen.For streaming applications in best-effort networks, start-upbuffering has always been a useful mechanism to deal withthe rate variations of streaming sessions. P2P streaming ap-plications additionally have to deal with peer churns, increas-ing the need for startup buffering and delay. While shortstart-up delay is desirable, certain amount of start-up delayis necessary for continuous playback. Using our monitoredpeers, we recorded two types of start-up delays in PPLive:the delay from when one channel is selected until the stream-ing player pops up; and the delay from when the player popsup until the playback actually starts. For a popular channel,the player pop-up delay was in general10 to 15 seconds andthe player buffering delay was10 to 15 seconds. Therefore,the total start-up delay is from20 to 30 seconds. Less pop-ular channels had start-up delays of up to2 minutes. Thesedelays are, of course, significantly longer than what are pro-vided by traditional television.
6.2 Playback Continuity
Other than start-up delay, playback continuity is anotherimportant measure of user perceived quality. We devel-oped a simple PPLive playback monitor to trace the play-
11
50
100
150
200
250
300
350
400
450
500
0 20 40 60 80 100 120
Vide
o ra
te (K
bps)
Time (min)
aggregate-downloadtop-download-session
(a) Download
10
100
1000
10000
0 20 40 60 80 100 120
Vide
o ra
te(K
bps)
Time (min)
aggregate-uploadtop-upload-session
(b) Upload
Figure 15: Peer download and upload video traffic break-down for CCTV3-Campus
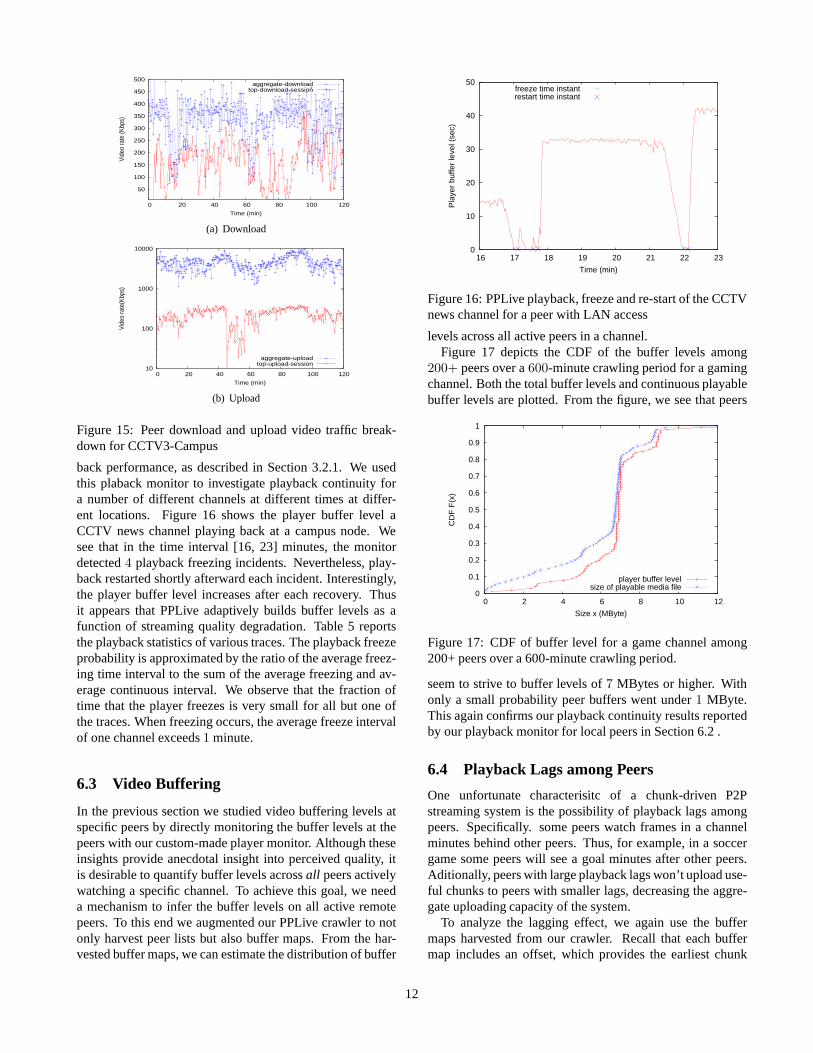
back performance, as described in Section 3.2.1. We usedthis plaback monitor to investigate playback continuity fora number of different channels at different times at differ-ent locations. Figure 16 shows the player buffer level aCCTV news channel playing back at a campus node. Wesee that in the time interval [16, 23] minutes, the monitordetected4 playback freezing incidents. Nevertheless, play-back restarted shortly afterward each incident. Interestingly,the player buffer level increases after each recovery. Thusit appears that PPLive adaptively builds buffer levels as afunction of streaming quality degradation. Table 5 reportsthe playback statistics of various traces. The playback freezeprobability is approximated by the ratio of the average freez-ing time interval to the sum of the average freezing and av-erage continuous interval. We observe that the fraction oftime that the player freezes is very small for all but one ofthe traces. When freezing occurs, the average freeze intervalof one channel exceeds1 minute.
6.3 Video Buffering
In the previous section we studied video buffering levels atspecific peers by directly monitoring the buffer levels at thepeers with our custom-made player monitor. Although theseinsights provide anecdotal insight into perceived quality, itis desirable to quantify buffer levels acrossall peers activelywatching a specific channel. To achieve this goal, we needa mechanism to infer the buffer levels on all active remotepeers. To this end we augmented our PPLive crawler to notonly harvest peer lists but also buffer maps. From the har-vested buffer maps, we can estimate the distribution of buffer
0
10
20
30
40
50
16 17 18 19 20 21 22 23
Pla
yer
buffe
r le
vel (
sec)
Time (min)
freeze time instantrestart time instant
Figure 16: PPLive playback, freeze and re-start of the CCTVnews channel for a peer with LAN access
levels across all active peers in a channel.Figure 17 depicts the CDF of the buffer levels among
200+ peers over a600-minute crawling period for a gamingchannel. Both the total buffer levels and continuous playablebuffer levels are plotted. From the figure, we see that peers
0
0.1
0.2
0.3
0.4
0.5
0.6
0.7
0.8
0.9
1
0 2 4 6 8 10 12
CD
F F
(x)
Size x (MByte)
player buffer levelsize of playable media file
Figure 17: CDF of buffer level for a game channel among200+ peers over a 600-minute crawling period.
seem to strive to buffer levels of7 MBytes or higher. Withonly a small probability peer buffers went under1 MByte.This again confirms our playback continuity results reportedby our playback monitor for local peers in Section 6.2 .
6.4 Playback Lags among Peers
One unfortunate characterisitc of a chunk-driven P2Pstreaming system is the possibility of playback lags amongpeers. Specifically. some peers watch frames in a channelminutes behind other peers. Thus, for example, in a soccergame some peers will see a goal minutes after other peers.Aditionally, peers with large playback lags won’t upload use-ful chunks to peers with smaller lags, decreasing the aggre-gate uploading capacity of the system.
To analyze the lagging effect, we again use the buffermaps harvested from our crawler. Recall that each buffermap includes an offset, which provides the earliest chunk
12

Table 5: Playback StatisticsTrace Average smooth playback intervalAverage freeze interval Freezing probability
ATV-Campus-NY 4222.6 6.8 0.0016ATV-Campus-HK 19360.3 61.5 0.0032ATV-Cable-NY 14789.2 16.9 0.0011
CCTV3-Campus-HK 1462.7 2.4 0.0016CCTV3-Cable-NY 973.0 2.0 0.0021
CCTV6-Campus-HK 587.2 4.6 0.0078CCTVNews-Campus-NY 323.8 8.9 0.0268CCTVNews-Cable-NY 7765.7 6.4 0.0008
buffered in the PPLive engine. This offset increases alongwith the playback. We use the buffer map offset as a ref-erence point of the actual playback. Therefore, the lags ofbuffer map offsets among peers watching the same channelreflect the lags of the actual playbacks among them. Weintensively probed peers in a TV channel, ATV, to retrievetheir buffer maps for60 minutes. We clustered the harvestedbuffer maps according to the time when they are received bythe crawler. Received buffer maps are clustered into timebins of10 seconds. For buffer maps within each bin, we cal-culated the difference between the maximum and minimumoffset. Figure 18(a) plots the numbers of buffer maps fallinginto different time bins, and Figure 18(b) plots the maximumplayback time differences over all bins. We observe that thelag among peers can be huge - with around70 probed peers,the maximum playback time difference of these peers arearound150 seconds.
0
10
20
30
40
50
60
70
0 10 20 30 40 50 60
# of
pee
rs
Time (min)
sampled peers
(a) Sampling Intensity
0
20
40
60
80
100
120
140
160
0 10 20 30 40 50 60
Tim
e (s
ec)
Time (min)
maximum playback lag
(b) Maximum playback time difference
Figure 18: Bitmap harvesting for the ATV channel over a60-minute period.
7 Conclusions and Future Work
IPTV is an emerging Internet application which may dramat-ically reshape the traffic profile in both access and backbonenetworks. We conducted a measurement study on a popu-lar P2P IPTV application, PPLive. Our study demonstratesthat the current Internet infrastructure is capable of providingthe performance requirements of IPTV at low cost and withminimal dedicated infrastructure. Through passive and ac-tive measurements, we characterized P2P IPTV user behav-ior and traffic profiles at packet, connection and applicationlevels. More importantly, the measurement results providean understanding of how to architect a successful large scaleP2P IPTV system. Insights obtained in this study will bevaluable for the development and deployment of future P2PIPTV systems.
Although large-scale P2P IPTV systems are feasible in to-day’s Internet, this class of applications is in its infancy, andperformance remains to be improved in several directions:
• Shorter Start-up Delay.We showed that at start-up,PPLive buffers tens of seconds of video before play-back to compensate for peer churn and rate fluctuationsof video connections. However, many users of ordi-nary televison enjoy raplidly switching among chan-nels. Thus, if P2P IPTV is truly going to mimic (andenhance) ordinary television, the start-up delay needsto be reduced to from tens of seconds to a few seconds.Possible directions to be investigated include redundantdownloading and/or network coding of video chunks. Itwill come at the price of increased video traffic redun-dancy.
• Higher Rate Streaming.We demonstrated that, un-like the BitTorrent file distribution system, it is diffi-cult to enforce the tit-for-tat policy in a P2P stream-ing system, since many peers have upload capacity lessthan the compressed playback rate of video. To com-pensate, peers with higher uploading capacity uploadmuch more than what they download to sustain steadyplayback at all peers. To support higher bit rates, theworkload on those “amplifier” nodes will be further in-creased. It becomes questionable whether an ordinarypeer, and the access ISP to which it is connected, willhave the capability and incentive to continue to pro-
13

vide the additional upload traffic. Thus, in the future,some level of dedicated infrastructure (such as dedi-cated proxy nodes), may have to be combined with theP2P distribution to deliver videos at higher rates.
• Smaller Peer Lags.In our measurement study we ob-served large playback lags, that is, some peers watchframes in a channel minutes behind other peers. To re-duce the lags, better peering strategies and video chuckscheduling schemes are needed.
• Better NAT Traversal.We observed lots of private IPaddresses in collected peer lists. The peers behindNATs are often not fully reachable. To utilize the up-loading capacities from peers behind NATs, better NATtraversal schemes need to be employed.
References
[1] Akamai. http://www.akamai.com/.
[2] BitTorrent. http://bittorrent.com/.
[3] Ethereal.http://www.ethereal.com/.
[4] FeiDian.http://tv.net9.org.
[5] Maxmind. http://www.maxmind.com/app/country.
[6] PPLive.http://www.pplive.com.
[7] ppStream.http://www.ppstream.com.
[8] TVAnts. http://www.tvants.com.
[9] VVSky. http://www.vvsky.com.cn.
[10] BASET, S. A., AND SCHULZRINNE, H. An Analysisof the Skype Peer-to-Peer Internet Telephony Protocol.In IEEE INFOCOM(Apr. 2006).
[11] CHERRY, S. The Battle for Broadband.IEEE Spectrum42, 1 (Jan. 2005), 24 – 29.
[12] CHU, Y., RAO, S. G.,AND ZHANG, H. A Case forEnd System Multicast. InACM SIGMETRICS(2000),pp. 1–12.
[13] COHEN, B. Incentives Build Robustness in BitTorrent.In P2P-Econ(June 2003).
[14] DEERING, S.,AND CHERITON, D. Multicast Routingin Datagram Internetworks and Extended LANs.ACMTrans. on Computer Systems(May 1990), 85–111.
[15] GUHA , S., DASWANI , N., AND JAIN , R. An Experi-mental Study of the Skype Peer-to-Peer VoIP System.In IPTPS’06(Feb. 2006).
[16] GUMMADI , K. P., DUNN, R. J., SAROIU, S., GRIB-BLE, S. D., LEVY, H. M., AND ZAHORJAN, J. Mea-surement, Modeling, and Analysis of a Peer-to-PeerFile-sharing Workload. InACM SOSP(2003), pp. 314–329.
[17] HEI, X., L IANG , C., LIANG , J., LIU , Y., AND ROSS,K. W. Insights into PPLive: A measurement study ofa large-scale P2P IPTV system. InIPTV workshop inconjunction with WWW2006(May 2006).
[18] IZAL , M., URVOY-KELLER, G., BIERSACK, E. W.,FELBER, P., HAMRA , A. A., AND GARCES-ERICE,L. Dissecting bittorrent: Five months in a torrent’s life-time. InPAM (2004), pp. 1–11.
[19] KONTOTHANASSIS, L., SITARAMAN , R., WEIN, J.,HONG, D., KLEINBERG, R., MANCUSO, B., SHAW,D., AND STODOLSKY, D. A transport layer for livestreaming in a content delivery network.Proc. IEEE92, 9 (Sep. 2004), 1408– 1419.
[20] L IANG , J., KUMAR , R., AND ROSS, K. W. The Fast-Track Overlay: A Measurement Study.Computer Net-works 50, 6 (Apr. 2006), 842–858.
[21] L IANG , J., NAOUMOV, N., AND ROSS, K. The In-dex Poisoning Attack in P2P File-Sharing Systems. InIEEE INFOCOM(Apr. 2006).
[22] POUWELSE, J., GARBACKI , P., EPEMA, D., AND
SIPS, H. The Bittorrent P2P File-sharing System:Measurements and Analysis. InIPTPS’05(Feb. 2005).
[23] SAROIU, S., GUMMADI , K. P., AND GRIBBLE, S. D.Measuring and Analyzing the Characteristics of Nap-ster and Gnutella Hosts.Multimedia Syst. 9, 2 (2003),170–184.
[24] SRIPANIDKULCHAI , K., MAGGS, B., AND ZHANG,H. An analysis of live streaming workloads on the in-ternet. InACM IMC (2004), pp. 41–54.
[25] STUTZBACH, D., REJAIE, R., AND SEN, S. Char-acterizing Unstructured Overlay Topologies in ModernP2P File-Sharing Systems. InACM IMC (Oct. 2005).
[26] ZHANG, X., L IU , J., LI , B., AND YUM , T.-S. P.DONet/CoolStreaming: A Data-driven Overlay Net-work for Peer-to-Peer Live Media Streaming. InIEEEINFOCOM (Mar. 2005), vol. 3, pp. 2102 – 2111.
14