a matter of life and death? hospital distance and quality ... · a matter of life and death?...
TRANSCRIPT

WP 14/18
A matter of life and death?
Hospital distance and quality of care: evidence from
emergency room closures and myocardial infarctions
Daniel Avdic
August 2014
york.ac.uk/res/herc/hedgwp

A matter of life and death? Hospital distance and
quality of care: Evidence from emergency room
closures and myocardial infarctions∗
Daniel Avdic†
July 11, 2014
Abstract
Recent health care centralization trends raise the important question of the
extent to which the quality of emergency medical services may o�set e�ects from
decreased access to emergency health care. This article analyzes whether residential
proximity from an emergency room a�ects the probability of surviving an acute
myocardial infarction (AMI). The critical time aspect in AMI treatment provides an
ideal application for evaluating this proximity-outcome hypothesis. Previous studies
have encountered empirical di�culties relating to potential endogenous health-based
spatial sorting of involved agents and data limitations on out-of-hospital mortality.
Using policy-induced variation in hospital distance arising from emergency room
closures in the highly regulated Swedish health care sector and data on all AMI
deaths in Sweden over two decades, estimation results show a clear and gradually
declining probability of surviving an AMI as residential distance from an emergency
room increases. The results further show that spatial sorting is likely to signi�cantly
attenuate the distance e�ect unless accounted for.
JEL Classi�cation: I14, I18.
Keywords: myocardial infarction, geographical access, hospital closures, health pol-
icy, spatial sorting, self-selection, causal e�ect
∗The author thanks Colin Cameron, Annika Herr, Per Johansson, Arizo Karimi, Martin Karlsson,Tobias Laun, Maren Michaelsen, Agne Suziedelyte, Johan Vikström and seminar participants at UppsalaUniversity, CINCH-Essen, IFAU-Uppsala, EALE in Turin, ESPE in Braga, 13th Journées LAGV in Aix-de-Provence, the 1st IAAE conference in London and the 10th joint iHEA and ECHE Congress in Dublin.Financial support from the Swedish Council for Working Life and Social Research (DNR 2004-2005 and2009-0826) is gratefully acknowledged†IFAU, UCLS and CINCH. Address: CINCH-Health Economics Research Center, DE-451 27 Essen,
Germany. Phone: +49 (0)201 183 6326. Email: [email protected].
1
1 Introduction
Over the past two decades more than half a million Swedish residents, a country with
approximately nine million inhabitants, su�ered an acute myocardial infarction (AMI).
Moreover, a majority of these individuals are now deceased, with AMI as either the pri-
mary or as a contributing cause of death. Overall AMI incidence in Sweden over the same
period exceeded 800,000 cases, making AMI one of the leading causes of hospitalization
as well as the leading cause of death in Sweden at the time (Socialstyrelsen, 2009). Put
di�erently, around twelve percent of the Swedish population is expected to experience an
AMI at some point in their life (Nationellt register för hjärtstopp, 2011). Far from unique
in this respect, Sweden shares these morbidity and mortality patterns with most of the
Western world. For example, half a million deaths in the U.S. per year are the result of
an AMI (American Heart Association, 2012).
The relatively high mortality rates for AMI arise primarily from two speci�c charac-
teristics of the disease; the lack of indication signals, or the unexpectedness, of the disease
(more than two-thirds of Swedish AMIs occur in the home) and the critical importance of
time for a successful treatment. In the event of a cardiac arrest, a common manifestation
of the infarction, the brain su�ers irreversible damage after only �ve minutes due to the
lack of oxygen. After �fteen minutes, death is essentially unavoidable regardless of any
resuscitation attempts made (Pell et al., 2001; GUSTO Investigators, 1993). Together,
these two disease characteristics imply that professional medical assistance may often be
unavailable and out of reach when the life-threatening condition occurs. Hence, many
AMI patients expires before they reach an emergency care facility.1
Trends of health care consolidation have recently emerged in many countries. In
countries with more deregulated health care markets, such as the U.S., these trends have
primarily been driven by increased competition in the health care sector, in which hospi-
tals have either merged into giant multi-hospital units or been ousted by competition from
1For example, more than sixty percent of all AMI deaths in the U.S. occur outside a hospital (AmericanHeart Association, 2012).
2

more e�ciently driven hospitals (Dranove et al., 1996; Succi et al., 1997; Evans-Cuellar
and Gertler, 2003). In countries with mandatory and, mainly, public provision of health
care such as Sweden, rapidly increasing costs of health care and public budget de�cits
have been, along with general technological progress and innovations in health care, a
driving factor behind the structural changes. Examples of such changes are increased
reliance on outpatient care, and on paramedic and emergency ambulance services (Land-
stingsförbundet, 2002; Sveriges Kommuner och Landsting, 2008). Hence, irrespective of
the institutional context, the long-run trend in the organization of inpatient health care
has been a considerable increase in centralization of resources. One noteworthy feature of
these recent trends have been the tendency of an increase in the number of rural hospital
closures and a corresponding growth in size of urban hospitals. While potentially leading
to e�ciency gains, these consolidation trends are likely to also entail adverse e�ects on
health care quality; in particular a deterioration of geographical access to care.2
The focus of this paper is to empirically assess the impact of geographical access to
health care on AMI survival for individuals who su�ered an AMI in Sweden between
1990 and 2010. Previous research on this topic have typically found that ambulance
response time increases the chance of surviving an out-of-hospital AMI (Bachmann et al.,
1986; Piette and Moos, 1996; Norris, 1998; Pell et al., 2001). However, this conclusion
mainly stems from evidence based on case studies, i.e. studies using data on single
hospitals and/or data culled at one particular point in time, and results inferred from
these studies may potentially su�er appreciably from limitations associated with both
the external and internal validity of any estimated parameters. Furthermore, location
data on both patients and hospitals is likely to be subject to dynamic spatial sorting
where agents' choice of residence is based on factors related to AMI survival probabilities
2In this context it is interesting to note that Swedish health care authorities justi�ed the health careconsolidation policy with the argument that emergency hospitals, while traditionally important for healthcare equity policies, are less important today due to recent innovations in emergency medical treatment(Sveriges Kommuner och Landsting, 2004). For example, over the last few decades some therapeuticprogress has been made, including the introduction of speci�c MI wards, mobile de�brillators, moree�ective treatment of cardiac arrest and the introduction of drugs such as beta blockers, thrombolyticagents, aspirin, ACE inhibitors and lipid-lowering drugs (Julian, 1961; Dellborg et al., 1994; Herlitz,2000).
3
such as individual health and the quality of nearby hospitals. In particular, individuals
in poor health would, ceteris paribus, choose to reside closer to a hospital, compared
to individuals in good health. A few economic studies has taken the analysis a step
further and estimated the e�ect of hospital closures on health outcomes using large U.S.
administrative data sets (Buchmueller et al., 2006; Herr, 2009). However, one potential
di�culty with this approach is that hospitals in more market-oriented health care systems
are likely to be strategically located with regard to underlying patient characteristics and
competition aspects. For example, pro�t-maximizing hospitals are unlikely to be located
in impoverished areas where the patient population has poor general health (Dranove
et al., 1996; Succi et al., 1997). Hence, there is a risk that observed hospital closures
used to evaluate the consequences of health care access in such contexts may partly be
the result of selective referrals.
A second problem hampering the assessment of the impact of distance to hospital
on health in previous studies is the lack of out-of-hospital data. Using only inpatient
data when attempting to quantify the e�ect of distance implies that patients who expire
before reaching hospital are censored in the analysis. Clearly, if geographical access to
health care has an impact on survival probability, omitting patients that die en route to
hospital will underestimate any true distance e�ect, since patients admitted to hospital
living farther away from, relative to admitted patients living closer to, a hospital will, on
average, be in a better health state (Gillum, 1990; O'Neill, 2003).
The main contribution of this paper is to extend the relatively scarce literature on
the e�ects of geographical access to health care on health outcomes by utilizing very
detailed nationwide Swedish administrative data on all AMI occurrences over a twenty-
year long period. The data makes it possible to account for both cross-sectional and
time variation in AMI survival rates and to control for observed individual heterogeneity.
Moreover, the out-of-hospital AMI mortality sample selection problem are accounted
for by supplementing the Swedish national inpatient registry with the Swedish national
causes of deaths registry, which consists of detailed information on all deaths that occurred
4

in Sweden for all years of study.
A further contribution of this article is to obtain plausibly exogenous changes in hos-
pital distance by making use of a number of Swedish emergency hospital closures over the
studied time period. In the beginning of the 1990s, Sweden had a very large geographical
spread of emergency hospitals across the country. However, the economic crisis of the
1990s resulted in large public de�cits and, as a reaction to this, aggregate health care
spending was cut by more than ten percent. A large portion of these cost savings were
derived from centralization measures; in particular the closure of a number of emergency
hospitals. These closures, plausibly unrelated to individual AMI survival probabilities due
to the public nature of health care provision, entailed an implicit change in the distance
to an emergency hospital for patients residing in the catchment areas of a closed emer-
gency hospital. Utilizing variation in individual distances to hospitals generated from the
policy-induced closures, endogeneity problems arising from self-selection is circumvented
by estimating AMI survival probability as a function of the current geographical distance
to an emergency hospital while conditioning on pre-closure distance.
Results from estimation show that an increase in distance signi�cantly predicts a lower
AMI survival probability for patients residing in the catchment area of a closed emergency
hospital. Speci�cally, the estimates suggest that increasing geographical distance to an
emergency hospital from within a ten-kilometer radius to more than �fty kilometers radius
would result in a decrease in expected AMI survival probability of 11.5 percentage points,
corresponding to a 15 percent reduction at sample mean survival rates. Furthermore, this
e�ect is primarily driven by an increased risk of out-of-hospital mortality among a�ected
patients. Much smaller e�ects are found when estimating the impact of distance based
on actual distances to hospital, indicating that selective residential sorting is likely to
greatly dilute the e�ect of distance. Moreover, the e�ect is concentrated to the �rst
year after the closures, indicating that no long-run elevated AMI mortality from the
closures seems to have occurred. A causal interpretation is also supported by results
from relaxing the linear restriction of the distance e�ect and the �nding that the e�ect
5

is symmetric; i.e. that patients whom experienced a decrease hospital distance from the
closures also increased the probability of surviving an AMI. Finally, there is no evidence
that catchment area case-mix or quality of closed hospitals were any di�erent from the
characteristics of remaining hospitals prior to the closures.
The results from this study may to some extent be contrasted to the volume-outcome
literature in which resource consolidation may increase health care quality, due to e.g.
scale e�ects and learning-by-doing (Maerki et al., 1986; Luft et al., 1987; Hamilton and
Ho, 1998). According to this literature, consolidation increases health care quality and
is hence considered desirable. However, the disease context may be crucial as to which
of these e�ects is likely to dominate. In particular, while Thiemann et al. (1999) �nds a
positive association between hospital volume and survival of AMI patients, it is likely that
any positive quality e�ects from centralization in this context should be more counteracted
by the negative e�ects on survival, arising from a decrease in geographical access to health
care, than for planned surgery where the situation is less acute (e.g. organ transplants
and cancer surgery).
The remainder of the article begins with a brief summary of the Swedish health care
system in section two. Section three includes a presentation of the data and the sampling
methodology. Section four o�ers a careful review of the empirical approach, in particular
with respect to the various inferential problems encountered. Section �ve presents the
results from estimation while section six contains a short summary along with some
concluding remarks.
2 The Swedish health care system
In contrast to e.g. the U.S., health care in Sweden is highly regulated. The vast ma-
jority of Swedish hospitals are owned and run by the public sector. The Swedish health
care system is organized and �nanced by 21 independent regions, Stockholm being the
largest (with about 2 million inhabitants) and Gotland the smallest (with about 60,000
6

inhabitants). Health care is the single most important responsibility for the regional
administration; for instance, in 2012 on average 82 percent of the county budgets were
on health care spending. The regional administrations are governed by political councils
elected in national elections every four years. Besides following a few general guidelines
set by the national government (e.g., that health care should be provided to all Swedish
citizens) the regional authorities have high levels of discretion in organizing health care.
This institutional setting implies in practice that political representatives of the county
councils and bureaucrats, rather than competition among providers, largely determine
the number, size, location and coverage of hospitals in each region.
Another consequence of the highly regulated health care sector in Sweden is that
patients have little choice as to which hospital they are admitted to in an emergency
situation. As health care in Sweden is funded predominantly by direct taxes, there are
no individual contracts between patients and hospitals.3 Instead, depending on where a
patient lives, he or she will be directed to a speci�ed nearby hospital when in need of
health care. This institutional setting ensures that each patient has a designated �home
hospital� each year, which can be identi�ed by using aggregated historical admission data
for each municipality and linking this information to the patients' registered home.
The time period studied in this article, i.e. 1990-2010, was a period of strong con-
solidation of the Swedish health care sector. These measures were deemed necessary by
regional authorities in order to increase e�ciency and to cover public de�cits caused by
the economic turbulence in Sweden in the beginning of the 1990s.4 In total, government
3When seeking health care in Sweden a small fee is normally paid up front by the patient. In Stockholmcounty this fee currently (2013) ranges from 100 SEK (≈10 EUR) when e.g. visiting a physiotherapistto 400 SEK (≈40 EUR) when visiting an emergency room. However, when a patient has paid a total of1,100 SEK (≈110 EUR)in health care fees in one year, he or she receives a �free card� and health careis free for the remainder of the year. A similar payment system exists for pharmaceuticals in which thepatient's share of the drug cost decreases with the total amount spent. In 2013, the maximum amountpaid by the patient was 2,200 SEK (≈220 EUR). See e.g. http://www.vardguiden.se/Sa-funkar-det formore information.
4The Swedish 1990s economic crisis took place between 1990-1994 and was a combined banking,�nancial and housing market crisis which is said to have been primarily caused by an unfortunatederegulation of the Swedish credit markets in 1985 (Wohlin, 1998). The �nancial deregulation led tocurrency and housing speculation bubbles which de�ated in 1991 and resulted in a severe credit crunchand widespread bank insolvency. The cause and development of the Swedish 1990s crisis had much incommon with the U.S. subprime mortgage crisis of 2007-2008.
7

spending on health care decreased by 11 percent, from 8.8 to 7.7 percent of GDP, be-
tween 1990 and 2000. A signi�cant share of these savings were derived from structural
changes in health care organization within counties; in particular the closure of a number
of emergency hospitals across the country (Landstingsförbundet, 2002).
Importantly, due to the institutional features of the Swedish health care sector, the
hospital closures should be unrelated to the health characteristics of the underlying popu-
lation in the hospitals' catchment areas. Moreover, as each individual patient's designated
hospital is known at each point in time, the policy-induced closures can be used in order
to compute the shift in geographical distance to the new home hospital among patients
whose emergency hospitals were closed.
3 Data and sampling
The data used in this article is primarily based on administrative registers from the
Swedish National Board of Health and Welfare, covering all Swedish citizens for all years
of study. The registers include the Swedish National Patient Register (NPR), consisting of
detailed information on all recorded hospitalizations in Sweden, and the National Causes
of Death Register (NCDR), consisting of all recorded deaths that occurred in Sweden for
individuals with a permanent residence in the country.5,6 Speci�cally, the NPR includes
individual-level data, for each hospital, on date of admission and discharge, whether the
patient were admitted from home or from another clinic, a set of patient characteristics,
medical data on diagnoses classi�ed according to the ICD standard7 and any surgical
procedure(s) undertaken during the hospital visit. In addition, the NCDR includes the
5The population consists of all deaths that were reported to the Swedish Tax Agency, including allindividuals registered as Swedish residents at the time of death. Hence, registered citizens who diedoutside Sweden (e.g. vacationers) are included while unregistered citizens who died in Sweden are not.
6The number of deaths recorded in the NCDR is in practice equivalent to all deaths that occurredin the relevant population. The number of unrecorded deaths in the NCDR in e.g. 2007 amounted to0.84% (773) of all deaths.
7The diagnoses are made by physicians and classi�ed according to the World Health Organization'sInternational Statistical Classi�cation of Diseases and Related Health Problems (ICD-10). ICD-10 is aseven digit coding of diseases and signs, symptoms, abnormal �ndings, complaints, and external causesof injury or diseases. See e.g. http://www.who.int/classi�cations/icd/en.
8

date, place and primary and contributing causes for each death in the data.
The population of interest consists of all Swedish residents who su�ered an AMI be-
tween 1990 and 2010. Therefore, the analysis sample includes all hospitalization and
deaths records caused by ischemic heart diseases with a primary ICD-10 diagnosis code
of I.21 or I.22, corresponding to an acute myocardial infarction or re-infarction. Addi-
tional information from each hospitalization is also collected, such as patient age, gender,
residence, speci�c hospital and clinic as well as hospitalization and AMI histories for each
patient dating back to 1987. The date of death is added to this data from the NCDR
(if the individual died at some point).8 As the data contains individual identi�ers it is
possible to link the sample to other population registers from Statistics Sweden to include
additional patient characteristics. One crucial such characteristic is detailed geographical
coordinates for each individual's registered place of residence, measured according to the
RT-90 standard.9 These coordinates are subsequently used to compute the geographical
distance from the registered place of residence of each AMI patient included to his or her
designated home hospital for each analysis year.
Figure 3.1 illustrates the total number of recorded AMIs between 1990-2010 broken
down into relevant categories. As can be seen, out of approximately 817,000 AMIs, about
75 percent (626,000) show up in the NPR as inpatient care records while the remaining
quarter (191,000) consists of individuals who died before arriving at a hospital, and hence
only show up in the NCDR. In total, about 65 percent (535,000) of the AMI population
8As the main outcome of the empirical analysis is the probability of surviving an AMI, the followingpopulation breakdown is important; i) patients who survived until they were admitted to a hospital,survived the AMI and were discharged, ii) patients who survived until they were admitted to a hospitalbut died while in hospital and iii) individuals who died before reaching a hospital and hence were notadmitted. It is assumed that all AMI patients need inpatient care and hence that there are no patientswho survived the AMI but were not admitted. As the goal of the empirical analysis is to investigate thee�ects of the distance to hospital on AMI mortality, excluding out-of-hospital AMI deaths will entail anendogenous sample selection under the alternative hypothesis of the existence of an e�ect of distance.Therefore, the inclusion of all three categories, using data from both the NPR and the NCDR, is essentialto establish inference to the population of interest.
9Coordinates in �Rikets koordinatsystem� (RT-90) are computed using the Gauss conformal projec-tion or the Transverse Mercator map projection. In contrast to the Standard Mercator projection, thetransverse projection takes into account that the world is shaped as an ellipsoid and uses complicatedcalculations and so-called geodetic datums in order to deliver improved accuracy positioning measure-ments. According to the Swedish Ordnance Survey, the RT-90 measurements cover approximately 3800triangular points over the country with a relative distance accuracy of 1-2 ppm (mm/km).
9

survive the AMI while about 35 percent (281,000) die, either before (68 percent) or
after (32 percent) being admitted. Clearly, ignoring out-of-hospital mortality will greatly
underestimate total AMI mortality in Sweden during this period.
Figure 3.1: Acute Myocardial Infarctions in Sweden,1990-2010
Note.�Data source: Swedish National Board for Health and Welfare. An AMI is de�ned asan ICD-10 coding of either I.21 or I.22. The total number of AMIs are obtained by combiningthe inpatient registry (NPR) and the national causes for death registry (NCDR).
3.1 Home hospitals, emergency room closures and referral hos-
pitals
In order to compute an individual's distance to a hospital a �home hospital� is de�ned for
each individual and calendar year based on his or her place of residence. This hospital is
selected using historical data on AMI hospitalizations and municipality of residence from
the NPR for each municipality and year. In particular, the hospital to which most of the
inhabitants of a given municipality are admitted (i.e. the modal hospital) is de�ned as the
home hospital for all individuals residing in this municipal. For most municipalities this
procedure is straightforward. However, a few municipalities do not have a clearly de�ned
home hospital for all the years concerned and, for this reason, patients residing in these
municipalities are removed from the analysis.10 Rather than using the actual hospital a
10The dropped municipalities are: Salem, Håbo, Boxholm, Ödeshög, Vaggeryd, Hultsfred, Mönsterås,Aneby, Osby, Kungsbacka, Tanum, Färgelanda, Herrljunga, Örkelljunga, Svedala, Falkenberg, Lerum,Grästorp, Vansbro, Leksand and Jokkmokk. These municipalities constitute about seven percent of thetotal number of Swedish municipalities and much less of the total AMI population. Moreover, none ofthese municipalities are located in regions where an emergency hospital closure occurred.
10
patient visits to compute hospital distance, the distance to the designated home hospital
is used. In most cases, but not always, these are the same.11
The home hospital de�nition is used to compute distance changes due to hospital
closures in two steps: First, in order to identify individuals who were a�ected by an
emergency hospital closure and, subsequently, to compute the new distance to hospital
for these individuals by de�ning a new home hospital (the referral hospital) and the new
geographical distance to this hospital.12 The distance to the new home hospital after
closure is subsequently used in the empirical application to estimate the parameters of
interest. Emergency hospital closures are de�ned by the change in the number of AMI
admissions they receive across two consecutive years.13 I �nd a total of sixteen closures
between 1990-2010.14 The closures identi�ed in the data are also validated from other
sources such as o�cial documents, local media coverage and previous research.15
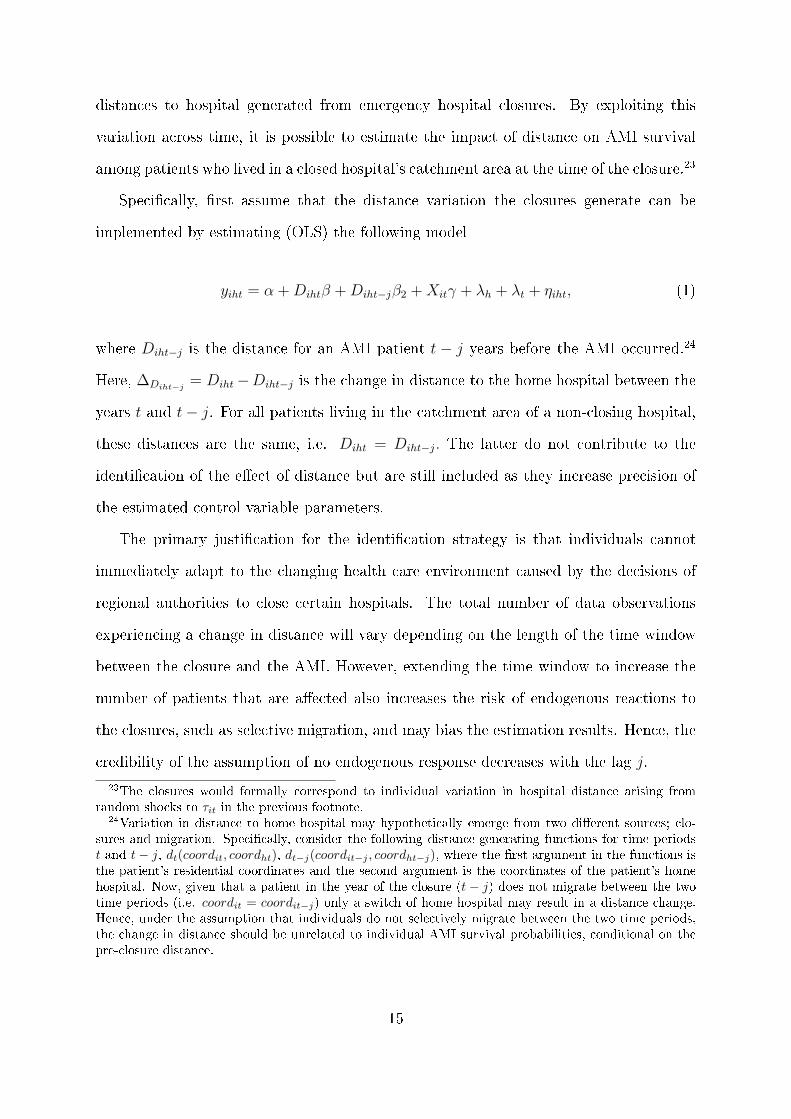
Figure 3.2 (and Figures A.1�A.6 in the Appendix) present the monthly number of
visits for each closed hospital and the corresponding referral hospital over the period of
study. The panel on the left of each closure plot displays the unadjusted raw number of
admissions while the panel on the right displays a six-month moving average of admission
frequency. The �gures show that the referral hospitals almost absorb the full reduction
of admissions of the hospitals that were closed.16
11This classi�cation is used for several reasons: First, a counter-factual hospital needs to be assignedfor AMI patients who expired before reaching a hospital. Second, patients observed to be treated atother hospitals than their designated home hospital are likely to be unrepresentative with regard tothe distance they actually traveled (e.g. because they were in another region when the AMI occurred).Third, the Swedish institutional setting makes the home hospital de�nition very reliable; more than 80percent of all admissions in the sample occurs at the home hospital.
12I use the same strategy to de�ne the referral home hospitals as the other home hospitals, i.e. usinghistorical admissions in the NPR, I infer which hospital patients living in closure-a�ected municipalitiesare referred to after a closure.
13Speci�cally, a hospital is classi�ed as closed if the number of AMI admissions between two yearsdecreases by more than 90 percent
14The closed emergency hospitals are Löwenströmska, Nacka, Finspång, Simrishamn, Landskrona,Strömstad, Falköping, Kristinehamn, Sä�e, Sala, Fagersta, Sandviken, Söderhamn, Härnösand, Bodenand Luleå hospitals
15Lindbom (2013) investigates protests movements in relation to the hospital closures over the sametime period. Moreover, Landstingsförbundet (2002) discusses Swedish emergency hospital closures be-tween 1992 and 2000.
16Note that the hospitals are plotted on di�erent axes.
11

Figure 3.2: Number of visits at closing hospitals and their referral hospitalsover time
020
4060
80
010
2030
40A
dmis
sion
s
1988
m1
1990
m1
1992
m1
1994
m1
1996
m1
1998
m1
2000
m1
2002
m1
2004
m1
2006
m1
2008
m1
2010
m1
Month
020
4060
80
010
2030
40
1988
m1
1990
m1
1992
m1
1994
m1
1996
m1
1998
m1
2000
m1
2002
m1
2004
m1
2006
m1
2008
m1
2010
m1
Month
Sabbatsbergs sjukhus S:t Göran MA: Sabbatsbergs sjukhus MA: S:t Göran
020
4060
80
05
1015
20A
dmis
sion
s
1988
m1
1990
m1
1992
m1
1994
m1
1996
m1
1998
m1
2000
m1
2002
m1
2004
m1
2006
m1
2008
m1
2010
m1
Month
020
4060
80
05
1015
2019
88m
1
1990
m1
1992
m1
1994
m1
1996
m1
1998
m1
2000
m1
2002
m1
2004
m1
2006
m1
2008
m1
2010
m1
Month
Löwenströmska sjukhuset Karolinska sjukhuset MA: Löwenströmska sjukhuset MA: Karolinska sjukhuset
Note.� Data source: Swedish National Board for Health and Welfare. The plots on the leftshow the monthly number of AMI visits at hospitals with closing emergency rooms (blue linesand left y-axis) and referral hospitals (red lines and right y-axis). The plots on the right showthe corresponding six-month moving averages of the same plots (three leads and three lags).
The left panel in Figure 3.3 shows the distribution of distance from a home hospital in
the data aggregated over all years of study. Approximately 95 percent of the population
lives within a sixty-kilometer radius of their home hospital with a median distance of
nine kilometers.17 As the distance distribution is highly right skewed, I trim the upper
�ve percentiles of the distribution in order to have a more homogeneous sample and to
avoid introducing estimation problems from extreme outliers. This restriction mainly
a�ects individuals living in the rural parts of northern Sweden.18 The panel on the right
in Figure 3.3 shows the corresponding distribution of the changes in distance generated
from the emergency hospital closures. These changes in distance have reasonably good
coverage over the support of the baseline distance distribution in the panel on the left.19
17I adopt the metric system as length measurement in this article. One English mile is approximately1.61 kilometers.
18Since the inhabitants of this region are typically older and have a lower level of education than theoverall Swedish population, it is likely that these individuals also have lower underlying AMI survivalprobabilities. Hence omitting them would, if anything, give a lower bound on the estimates.
19See also Table A.1 in the Appendix for some descriptive sample statistics.
12

Figure 3.3: Distribution of distance and changes in distance to home hospital
0.0
5.1
Den
sity
9
0 25 50Distance (km)
(a)
0.0
5.1
Den
sity
13
−50 −25 0 25 50Distance (km)
(b)
Raw Kernel weighted
Note.� Data source: Swedish National Board for Health and Welfare. Hospital distance isobtained by computing the distance from an individual patient's registered residence to his orher home hospital. The panel on the left shows the residential distance distribution to the homehospital for the analysis sample of AMI patients for the period 1990-2010. The panel on theright shows the distribution of the changes in distance generated by emergency room closures asde�ned in the data section. The dashed vertical lines indicate the median of the distribution. Thedashed smoothed lines are kernel density estimates using a standard Epanechnikov kernel with abandwidth of 3.9.
4 Empirical approach
Let D be the geographical distance from a patient's home to his or her designated (home)
hospital and let y be a binary variable indicating whether an AMI patient survived the
infarction or not. Speci�cally, y is coded as one if an individual survives a certain follow-
up period and as zero if the individual died during this period. The empirical focus of
this paper is to evaluate the impact of D on y.
There are several problems associated with empirically isolating the e�ect of hospital
distance on AMI survival. The main di�culty is, most likely, that an individual's choice
of where to live in relation to a hospital will depend on the health of the same. In
particular, any e�ect of distance would be biased downwards if individuals with poorer
health are more likely to take access to health care into consideration when choosing
place of residence.20 In addition to identi�cation problems arising from the optimizing
behavior of individuals there are also other problems related to the organization of health
20An upward bias could occur if individuals choosing to live further away from a hospital care ingeneral less about their health relative to people living closer to a hospital due to e.g. heterogeneoushealth preferences. I do not rule out this possibility in the estimations but consider it less likely from atheoretical point of view.
13

care and the population case-mix in the catchment areas. Average AMI survival rates
at a given hospital might vary both over time and with the location and quality of the
hospital.21
It is possible to control for heterogeneity and common trends across hospitals by
including �xed-e�ects for these factors in a regression model. Moreover, as the data
contains a number of individual health and socioeconomic characteristics, these can also
be added to the model in order to adjust for individual-level heterogeneity of the patient
population within catchment areas. For an individual i experiencing an AMI at calendar
time t with home hospital h the e�ect of distance on survival could hence be estimated
using the following regression model:
yiht = α +Dihtβ +Xitγ + λh + λt + νiht,
where λh and λt are hospital and time �xed e�ects. The e�ect of distance, β, would
be identi�ed in this model if the individual error νiht was uncorrelated with the distance
measure. Given that the health of individual patients is partly unobservable, residential
sorting within catchment areas is likely to exist also after includingXit, hence invalidating
the independence assumption.22
To further address the problem of residential sorting, we use variation in individual
21Hospitals located in rural areas admit patients with on average both longer distances to the hospitaland poorer health characteristics (e.g. older and with a lower level of education). In addition, thepreparedness levels for emergency situations may vary between hospitals (e.g. the number of turnkeyambulances) as a consequence of the geographical size of the catchment area.
22A simple example may be illustrative. Assume that (yit = AMI survival, κi = health status)
Pr(yit = 1|Dit) = 0 if I(κi < κ′i|Dit) (i)
and that ∂κ′i
∂Di< 0 so that patients in poor health have incentives to reside nearer to a hospital
Consider the following relation determining distance
Dit = α+ γκ∗i + τit
where health is measured with error, i.e.
κ∗i = κi + πit
Then distance will be endogenously related to health if (i) applies, i.e. Cov(πit, Dit) < 0.
14
distances to hospital generated from emergency hospital closures. By exploiting this
variation across time, it is possible to estimate the impact of distance on AMI survival
among patients who lived in a closed hospital's catchment area at the time of the closure.23
Speci�cally, �rst assume that the distance variation the closures generate can be
implemented by estimating (OLS) the following model
yiht = α +Dihtβ +Diht−jβ2 +Xitγ + λh + λt + ηiht, (1)
where Diht−j is the distance for an AMI patient t − j years before the AMI occurred.24
Here, ∆Diht−j= Diht−Diht−j is the change in distance to the home hospital between the
years t and t− j. For all patients living in the catchment area of a non-closing hospital,
these distances are the same, i.e. Diht = Diht−j. The latter do not contribute to the
identi�cation of the e�ect of distance but are still included as they increase precision of
the estimated control variable parameters.
The primary justi�cation for the identi�cation strategy is that individuals cannot
immediately adapt to the changing health care environment caused by the decisions of
regional authorities to close certain hospitals. The total number of data observations
experiencing a change in distance will vary depending on the length of the time window
between the closure and the AMI. However, extending the time window to increase the
number of patients that are a�ected also increases the risk of endogenous reactions to
the closures, such as selective migration, and may bias the estimation results. Hence, the
credibility of the assumption of no endogenous response decreases with the lag j.
23The closures would formally correspond to individual variation in hospital distance arising fromrandom shocks to τit in the previous footnote.
24Variation in distance to home hospital may hypothetically emerge from two di�erent sources; clo-sures and migration. Speci�cally, consider the following distance-generating functions for time periodst and t− j, dt(coordit, coordht), dt−j(coordit−j , coordht−j), where the �rst argument in the functions isthe patient's residential coordinates and the second argument is the coordinates of the patient's homehospital. Now, given that a patient in the year of the closure (t− j) does not migrate between the twotime periods (i.e. coordit = coordit−j) only a switch of home hospital may result in a distance change.Hence, under the assumption that individuals do not selectively migrate between the two time periods,the change in distance should be unrelated to individual AMI survival probabilities, conditional on thepre-closure distance.
15
In model (1) the distance and the lagged distance are both included linearly. This
speci�cation is highly restrictive since the outcome y is a binary variable. To increase the
validity of the regression model, the linearity restriction is relaxed by instead including
a set of indicator variables for each ten-kilometer distance. Speci�cally,
yiht = α + Imihtβm + Imiht−jβ
m2 +Xitγ + λh + λt + ηiht,m = 1, ...,M, (2)
where
Imiht−j = 1((m− 1)× 10) < Diht ≤ m× 10),m = 1, ...,M and j = 0, 1.
As the emergency room closures also generated distance cuts to their home hospital for
some patients, it is possible to investigate the symmetry of the e�ect of distance. One way
of investigating e�ect symmetry is to regress the e�ect of a positive change and a negative
change separately and statistically test whether the coe�cients di�er. Speci�cally, the
following model is estimated
yiht = α + δ1(∆Dit× I−∆) + δ2(∆Dit
× I+∆) +Xitγ + λh + λt + ηiht,m = 1, ...,M (3)
where I+∆ = 1(∆Dit
> 0) and I−∆ = 1(∆Dit< 0). To test the symmetry of the estimated
e�ect, a simple Wald test of equality of δ1 and δ2 is performed.25
5 Results
We begin this section with a simple descriptive analysis of the observed distance-survival
relationship in the data. Figure 5.1 plots correlations of distance to home hospital and
25Importantly, since the dependent variable in the models is dichotomous, the linear probability modelsare an approximation of an unknown data generating process. In an attempt to test the validity ofthe model approximation, all the results below were also estimated using non-linear (logit) regressionmodels. The results remain qualitatively unchanged by this particular change in speci�cation. The linearestimates are presented throughout the paper to facilitate coe�cient interpretation.
16

AMI survival rates for di�erent parameterizations. Speci�cally, the gray dots indicate the
average survival rate for each kilometer to hospital while the dotted, dashed and solid
lines illustrate the relationship under a linear regression model, a locally smoothed and
a kernel weighted parameterization, respectively. The �gure suggests a negative, albeit
weak, correlation between distance and AMI survival with slightly higher survival rates
for individuals living closer to their home hospital. The estimate from the linear model,
reported below the plot, suggests a decreased survival probability of 0.03 percentage
points for each additional kilometer a patient resides from his or her home hospital.
With a mean survival rate in the analysis sample of about 78 percent, this is clearly
a small di�erence. However, the upward sloping survival trend at the lower end of the
distance distribution raises some doubt about whether the plotted relationship can be
interpreted causally. For example, Figures A.7�A.8 in the Appendix show substantial
heterogeneity in survival rates both across hospitals and over time. If these factors are
correlated with the distance to the home hospital, any estimated e�ect of distance will
be confounded unless they are accounted for.
17

Figure 5.1: Correlations of distance to home hospital and survival
probability from an AMI under various parametric assumptions
.7.7
5.8
.85
Sur
viva
l pro
b.
0 20 40 60Distance (km)
Raw kilometer average Polynomial smooth Linear Non−parametric
Linear coeff: −.0003t−stat: −6.20
Note.� Data source: Swedish National Board for Health and Welfare. The �gures dis-play the observed correlation between distance to home hospital and survival probabilityfor the sample of AMI patients used in the empirical analysis under di�erent parametricassumptions. The dots indicate the raw kilometer average while the lines show the re-lationship for di�erent models; the dotted line shows the linear relationship, the dashedline the non-parametric relationship with a dummy indicator for each ten kilometers andthe solid line shows a kernel density estimator using a standard Epanechnikov kernelwith a bandwidth of 3.9.
5.1 Main results
Table 5.1 presents the main results from the estimation of the e�ect of distance for
di�erent models using the full analysis sample (scaled with a factor of ten for presentation
reasons). The �rst through third columns include only the observed current distance to
the home hospital, i.e. the observed distance in the year the AMI occurred. The �rst
column reproduces the linear estimate of the distance-survival correlation from Figure
5.1, while the second and third columns include covariate adjustments for a number of
health-related characteristics and hospital and calendar time �xed e�ects, respectively.
The estimated distance coe�cient remains approximately the same in all speci�cations,
implying relatively small variations in average AMI survival rates over di�erent distances
to home hospital.
The fourth column of Table 5.1 additionally includes the lagged distance for patients
in the year before they were the subject of an AMI, corresponding to equation (1) with
18

j = 1 from the empirical section. The coe�cient on current distance now increases
in magnitude by a factor of four while the lagged distance coe�cient is estimated to be
slightly lower and with opposite sign. Comparing over speci�cations, note that netting out
the predicted e�ect for individuals with the same distance in both periods reproduces, as
expected, the distance coe�cient displayed in column (3). The estimated current distance
coe�cient is now interpreted as the marginal e�ect for an AMI patient of increasing the
distance to his or her home hospital by ten kilometers. Hence, this estimate shows a
di�erence in AMI survival probability of about 15 percent for individuals at the lower
and upper support of the distance distribution, i.e. zero and sixty kilometers, at mean
survival rates.
One theoretical prediction for the e�ects of geographical access to health care on AMI
survival is that it should be monotonously decreasing with hospital distance. The last
two columns of Table 5.1 evaluate this prediction by relaxing the assumption of linearity
of the e�ect by replacing the continuous distance measure with a set of dummy variables
for each ten-kilometer distance (with the closest distance group, 0-10 kilometers from the
hospital, as reference category). The results from estimating model (2) without and with
the full set of controls are reported in the right and left of these columns respectively.
The estimation result, irrespective of the inclusion of controls, shows a remarkably clear
monotonous pattern on AMI survival probability of experiencing a change in distance
to home hospital.26 The estimated coe�cients are highly signi�cant and the pattern
corresponds quite well with a linear speci�cation, except for distances between 11 and
20 and 21 and 30 kilometers where there seem to be a discontinuous shift in survival
probability. In other words, this �nding suggests a critical distance threshold where the
risk of AMI mortality increases dramatically.27 Thus, the conforming of the results to
26It is interesting to note that including health controls in the last column does not change the resultsqualitatively. This �nding suggests that the endogeneity between the changes in distance and pre-closuredistance may not be a severe problem in this application.
27This threshold is plausible since, according to Nationellt register för hjärtstopp (2011), if medicalassistance is not received within 15 minutes after su�ering from a cardiac arrest, death is almost certain.Doing a back-of-the envelope calculation assuming that an ambulance has an average speed of 100 km/hit will take emergency medical personnel about 15 minutes to travel a distance of 25 kilometers, whichis exactly in the middle of the empirical threshold where the distance e�ect kicks in.
19

the theoretical prediction with respect to the pattern of the e�ect of distance provides
some evidence for the empirical design.
Table 5.1: Estimated e�ects of distance on AMI survival probability from emergency room
closures: Di�erent estimators
Estimator
β̂OLS β̂OLS β̂FE β̂D β̂NPD β̂NPD
Current distance -0.004*** -0.003*** -0.005*** -0.021***(0.001) (0.001) (0.001) (0.005)
Lagged distance 0.016***(0.005)
Current Distance Dummies11-20 km 0.015 0.002
(0.020) (0.020)21-30 km -0.036* -0.041**
(0.020) (0.020)31-40 km -0.064*** -0.051**
(0.024) (0.023)41-50 km -0.073** -0.086***
(0.032) (0.031)51-60 km -0.109** -0.115**
(0.047) (0.046)
Lagged Distance Dummies11-20 km -0.002 0.001
(0.020) (0.020)21-30 km 0.033* 0.031
(0.020) (0.020)31-40 km 0.055* 0.036
(0.024) (0.023)41-50 km 0.053 0.065**
(0.032) (0.031)51-60 km 0.087* 0.095**
(0.048) (0.047)
Covariates X X X XFixed e�ects X X X
Observations 331,515 331,515 331,515 331,515 331,515 331,515
Note.� The table reports point estimates (standard error) of the e�ect of distance on survival probability from an acutemyocardial infarction for di�erent estimators as explained in the empirical section and using the full sample of all AMIsover the time period 1990-2010. Geographical coordinates are obtained by linking the patient/death data to the populationregister. Distance is obtained by computing the distance from an individual patient's registered residence to his or herhome hospital. For more information see the data section. The current distance variable is de�ned as the residentialdistance in kilometers from an individual's home hospital in the current year while lagged distance corresponds to the same
distance in the previous year. The last three columns, β̂D and β̂NPD, estimate the e�ect of distance using variation inthe distance to an individual's home hospital arising from closures of emergency rooms as explained in the data section.The last two columns include a number of distance dummies for each ten kilometers instead of the linear speci�cation.Included covariates are gender, age, the number of previous hospitalizations (AMIs) and the number of years since the lasthospitalization (AMI). Fixed e�ects include hospital and calendar year dummies. Standard errors are estimated using arobust covariance matrix. *, ** and *** denote signi�cance at the 10, 5 and 1 percent levels.
Under the more restrictive assumption of additive separability between hospital dis-
tance and health, the di�erence of the coe�cients of Table 5.1 can be given a causal
20

interpretation. Table 5.2 tabulates all possible combinations of these di�erences for given
lagged and current distances under the additional assumption of homogeneity of the e�ect
of distance across lagged distance. These e�ects are also graphically presented using a
contour plot in Figure 5.2. Speci�cally, the brighter (darker) areas of the plot show for
which combinations of lagged and current distance AMI survival probabilities decrease
(increase). Going from the upper-left corner (illustrating the e�ect of an increase in geo-
graphical distance of 50 kilometers) to the lower-right corner (illustrating the e�ect of a
decrease in geographical distance of 50 kilometers) the �gure shows a clear monotonous
and symmetric pattern of the distance e�ect.
Table 5.2: Estimated e�ects of distance on AMI survival probability for di�erent pre-closure
hospital distances
Lagged Distance (km)
Current distance (km) 0-10 11-20 21-30 31-40 41-50 51-60
0-10 0.000 0.001 0.031 0.036 0.065 0.09511-20 0.002 0.003 0.033 0.038 0.067 0.09721-30 -0.041 -0.041 -0.010 -0.005 0.024 0.05431-40 -0.051 -0.050 -0.019 -0.015 0.014 0.04441-50 -0.086 -0.086 -0.055 -0.050 -0.021 0.00951-60 -0.115 -0.114 -0.083 -0.079 -0.050 -0.020
Note.� The table shows the estimated e�ect derived from the last column in Table 5.1 of experiencing a change inhome hospital distance from a distance indicated in a given column to a distance indicated in a given row. Geographicalcoordinates are obtained by linking the patient/death data to the population register. Distance is obtained by computingthe distance from an individual patient's registered residence to his or her home hospital. For more information see thedata section. See Table 5.1 for estimation details. See also Figure A.8 for a graphical illustration of the e�ect.
21

Figure 5.2: Contour plot of the estimated e�ects of distance
1020
3040
5060
Lagg
ed d
ista
nce
from
hom
e ho
spita
l (km
)
10 20 30 40 50 60Current distance from home hospital (km)
−0.10
−0.09
−0.07
−0.06
−0.04
−0.03
−0.02
−0.00
0.01
0.03
0.04
0.05
0.07
0.08
Dis
tanc
e ef
fect
Note.� Data source: Swedish National Board for Health and Welfare. The �gure showsa three-dimensional contour plot of the estimated e�ect from Table 5.1 and Table 5.2.The darker areas in the plot correspond to a lower probability of survival while a brighterarea corresponds to a higher probability of survival. The �gure can be interpreted asshowing the estimated e�ect of going from a given distance to home hospital in timeperiod t− 1 indicated on the y-axis to a given distance to home hospital in time periodt indicated on the x-axis. See the data section for a de�nition of a home hospital, thecomputation of distance to home hospital and an explanation of the sample used in theanalysis and the empirical section for an explanation of the estimated e�ects.
Finally, the model from equation (3) was estimated to statistically test the symmetry
of the distance e�ect. The result from this exercise is shown in Table 5.3. The �rst column
of the table reports the estimated coe�cients for the change in distance and an indicator
variable for a negative change interacted with the change in distance. Similarly, the second
column reports results from regressing AMI survival on the absolute change in distance
interacted with a dummy variable for a positive and a negative change respectively. Since
the hypothesis that the coe�cients are the same cannot be rejected for any conventional
statistical signi�cance levels (p = 0.7990), this suggests that the magnitude of the e�ect
of distance is the same, regardless of whether an individual experienced an increase or a
decrease in the distance to hospital.
22

Table 5.3: Estimated e�ects of distance on AMI survival probability: Symmetry of the e�ect
(1) (2)
∆D -0.014***(0.004)
I[∆D < 0]×∆D 0.004(0.015)
I[∆D > 0]×Abs[∆D] = b1 -0.014***(0.004)
I[∆D < 0]×Abs[∆D] = b2 0.010(0.014)
Test b1 = −b2χ2-statistic (1 df) 0.06p-value 0.7990
Observations 331,515 331,515
Note.� The table reports point estimates (standard error) from a linear regression model including the full sample ofAMI patients as explained in the empirical section over the time period 1990-2010. Geographical coordinates are obtainedby linking the patient/death data to the population register. Distance is obtained by computing the distance from anindividual patient's registered residence to his or her home hospital. For more information see the data section. The I[·]functions are indicator functions that evaluate to one if the arguments within the brackets are true and zero otherwise.The lower part of the table displays the statistics from a Wald test on parameter equality between the e�ects of distancefrom a positive and a negative change in distance, (b1 and b2) respectively. Included covariates are gender, age, the numberof previous hospitalizations (AMIs) and the number of years since the last hospitalization (AMI). Fixed e�ects includehospital and calendar year dummies. Standard errors are estimated using a robust covariance matrix. *, ** and *** denotesigni�cance at the 10, 5 and 1 percent levels.
5.2 Extensions and robustness checks
The speci�c outcome studied so far has been the probability of surviving until discharged
from a hospital after su�ering an AMI. Table 5.4 presents the results for a number of
alternative survival de�nitions using the same analysis sample and the speci�cation from
the last column of Table 5.1. The �rst column of the table reproduces the main results
while the second column reports the results for the probability of surviving the initial
phase before being admitted to a hospital, i.e. the out-of-hospital phase. The four
right-most columns reports results when the outcome is de�ned as a binary indicator for
whether the patient was alive after one day, one month, one hundred days and one year
from the AMI, respectively.28
The table reveals interesting e�ect mechanisms; �rst, comparing the �rst two columns
of the table, it is clear that most of the e�ect on survival seem to arise from an increased
probability of out-of-hospital mortality.29 This �nding is not unexpected since a longer
28As a complement to this analysis, Figure A.9 in the Appendix plots the distribution of deaths in thesample for the �rst hundred days after the AMI occurred. Day one is excluded in the �gure for scalingreasons as the majority of all deaths occur within the �rst day of the AMI.
29The estimated coe�cients are much smaller in magnitude and barely statistically signi�cant when us-
23

geographical distance to hospital will increase both the time it takes to reach the patient
and the time it takes to transport him or her to the hospital. Furthermore, the last
four columns of Table 5.4 investigate whether the estimated e�ect is primarily driven
by patients in very poor health, in which the additional distance is simply �the straw
that broke the camel's back�, i.e. a harvesting e�ect, by comparing results from di�erent
survival time horizons after the AMI. Interestingly, the pattern in the last four columns of
Table 5.4 indicate that distance to hospital slightly decreases the probability of surviving
more than one month, compared with surviving only the �rst day. This result suggests
that the estimated e�ect is not due to harvesting, in which case we would rather see a
substantial e�ect just after the AMI and thereafter a diminishing and even reversed sign
of the e�ect for the more long-term outcomes.
Table 5.4: Estimated e�ects of distance on AMI survival probability from emergency room
closures: Di�erent survival outcomes
Survival Outcome
Hospitalization Survival time
Baseline(AMI=1)
OOH Survival(AMI6= 2)
Survives> 1 day
Survives> 30 days
Survives> 100 days
Survives> 365 days
Current Distance Dummies11-20 km 0.002 0.001 -0.003 0.001 0.003 -0.003
(0.020) (0.018) (0.019) (0.020) (0.020) (0.021)21-30 km -0.041** -0.031* -0.030 -0.041** -0.053*** -0.070***
(0.020) (0.018) (0.019) (0.020) (0.020) (0.020)31-40 km -0.051** -0.057*** -0.054** -0.055** -0.064*** -0.075***
(0.023) (0.021) (0.022) (0.023) (0.024) (0.024)41-50 km -0.086*** -0.052* -0.061** -0.089*** -0.085*** -0.098***
(0.031) (0.029) (0.030) (0.032) (0.032) (0.033)51-60 km -0.115** -0.090** -0.104** -0.166*** -0.158*** -0.159***
(0.046) (0.044) (0.044) (0.047) (0.047) (0.048)
Observations 331,515 331,515 331,515 331,515 331,515 331,515
Note.� The table reports point estimates (standard error) of the e�ect of distance on survival probability from an acutemyocardial infarction as explained in the empirical section and using the full sample of all AMIs over the time period1990-2010. Geographical coordinates are obtained by linking the patient/death data to the population register. Distance isobtained by computing the distance from an individual patient's registered residence to his or her home hospital. For moreinformation see the data section. The current distance variable is de�ned as the residential distance in kilometers froman individual's home hospital in the current year while lagged distance corresponds to the same distance in the previousyear. Outcomes are de�ned as indicator functions for being alive when discharged from the hospital following the infarctionor surviving until admitted (in the �rst two columns) and as being alive after a certain time after the AMI occurred (incolumns 3-5). Reported coe�cients in each column are a number of distance dummies for each ten kilometers. Includedcovariates are gender, age, the number of previous hospitalizations (AMIs) and years since the last hospitalization (AMI).Fixed e�ects include hospital and calendar year dummies. Standard errors are estimated using a robust covariance matrix.*, ** and *** denote signi�cance at the 10, 5 and 1 percent levels.
ing the probability of in-hospital mortality as the outcome. The monotonous pattern remains unchanged,however.
24

Another interesting extension is to investigate whether the estimated e�ects of dis-
tance vary over the time span between an emergency hospital closure and the AMI.
Over time, potential coping strategies from both individuals and the health care ad-
ministrations may arise in order to accommodate any perceived or real distance e�ects
subsequent to the closures. For instance, patients with relatively poor health who expe-
rienced reduced access to emergency health care may decide to move closer to the new
home hospital. Another possibility is that health care authorities may ex post invest
more in emergency health care. Both these potential coping behaviors would then serve
to diminish the distance e�ect on survival over time from the closure.
Table 5.5 presents estimation results for AMI patients living in a region in year t
where an emergency hospital closure occurred t − j years earlier, with j = 1, ..., 5 and
where j = 1 has been the baseline case studied so far. The sample size is di�erent as
the �ve �rst years of the sampling period, i.e. 1987-1992, are dropped from the analysis.
These �ve years are excluded in all the speci�cations in the table in order to facilitate
comparison of the results. The header of each column indicates the number of years from
closure evaluated and the reported results are based solely on variation in distance for
AMI patients who experienced a shift in distance to their home hospital for this particular
number of years since hospital closure.
The results from the estimation are striking; there is only a clear e�ect of distance
for the �rst year after a hospital closure. At each subsequent leading year, the e�ect is
smaller in magnitude and statistically insigni�cant while measured with similar precision.
This pattern indicates that long-run e�ects of distance from the closures on AMI survival
are unlikely to prevail, perhaps as a consequence of various coping strategies among the
involved agents. This result is somewhat reassuring for policy-makers since, besides from
the initial shock, the hospital closures does not seem to have entailed long-lasting elevated
AMI mortality rates.30
30A back-of-the-envelope analysis might bring some further insights regarding the cost-bene�t trade-o� of the closures. In particular, a regression model was estimated of the survival measure including adummy variable for being a�ected by a hospital closure on the right hand side (along with the othercovariates), which subsequently was related to the average survival rates and AMI incidence in the
25

Table 5.5: Estimated e�ects of distance on AMI survival probability from emergency room
closures: Short and long-term e�ects
Time Horizon (years from closure)
One Two Three Four Five
Current Distance Dummies11-20 km -0.002 -0.013 -0.037** -0.040** 0.031
(0.019) (0.019) (0.018) (0.018) (0.019)21-30 km -0.036* -0.024 -0.017 -0.000 -0.030
(0.019) (0.019) (0.018) (0.019) (0.020)31-40 km -0.038* -0.001 -0.016 -0.004 -0.010
(0.022) (0.022) (0.022) (0.021) (0.021)41-50 km -0.082*** -0.052 -0.034 -0.021 -0.027
(0.031) (0.032) (0.030) (0.029) (0.029)51-60 km -0.116** 0.013 -0.061 0.087** 0.080
(0.046) (0.044) (0.049) (0.044) (0.050)
Observations 285,883 286,030 286,020 286,120 285,988
Note.� The table reports point estimates (standard error) of the e�ect of distance on survival probability from an acutemyocardial infarction as explained in the empirical section and using the full sample of all AMIs over the time period1990-2010. Geographical coordinates are obtained by linking the patient/death data to the population register. Distance isobtained by computing the distance from an individual patient's registered residence to his or her home hospital. For moreinformation see the data section. The current distance variable is de�ned as the residential distance in kilometers from anindividual's home hospital in the current year while lagged distance corresponds to the same distance in the previous year.Outcome is de�ned as an indicator function for being alive when discharged from a hospital following the infarction. Eachspeci�cation pertains to a speci�c time horizon from an emergency room closure (the number of lagged years). Reportedcoe�cients in each column are a number of distance dummies for each ten kilometers. Included covariates are gender, age,the number of previous hospitalizations (AMIs) and the number of years since the last hospitalization (AMI). Fixed e�ectsinclude hospital and calendar year dummies. Standard errors are estimated using a robust covariance matrix. *, ** and*** denote signi�cance at the 10, 5 and 1 percent levels.
A potential problem caused by restricting the sample to only include individuals who
su�ered an AMI is that the closures may have endogenously changed the population at
risk of having an AMI. This could occur, for example, if admissions for other reasons
than AMI may change a patient's general perception of his or her health risks and induce
a more proactive behavior. In this respect, the closures may have a�ected the population
at risk for an AMI through the reduced access to health care which, in turn, might have
induced a downward bias on the estimated distance e�ect.
To evaluate whether the closures a�ected the population at risk for an AMI we can
study AMI incidence rates in closing hospitals' catchment areas over time. Figure 5.3
relevant population. The e�ect of being a�ected by a hospital closure reduced the average survivalprobability with an estimated two percentage points, i.e. from 0.79 to 0.77 at mean survival rates.As the annual average number of AMIs is about 20,000, this estimate suggests that about 320 extradeaths would have occurred had the closures a�ected the full AMI patient population. However, asthe underlying population of the relevant catchment areas is only about ten percent of the total AMIpopulation in a given year, the closures caused only an estimated 32 additional deaths. Hence, the totalof 16 closures in the data meant an additional two deaths per closure. Assuming that the value of astatistical life is about e 2 million, the closures could thus be deemed �cost-e�ective� if the cost savingswere more than e 4 million per closed hospital.
26

shows the empirical relationship between AMI admission frequency in municipalities
where a closure occurred in years from the time of the closures after adjusting for calendar
year trends in AMI incidence. The dots in the �gure indicate yearly averages and the
solid line plots the piece-wise linear relationship allowing for a discontinuity in the year
of the closure (indicated by the vertical line). The �gure reveals a small increase in AMI
incidence after, as compared to before, the hospital closures. However, the change is not
signi�cantly di�erent from zero at any conventional levels of statistical signi�cance.
Figure 5.3: E�ect of the closures on AMI incidence
120
140
160
180
200
Adm
issi
ons
−18 −14 −10 −6 −2 2 6 10 14 18Years since closure
Fitted values 95% CI
Difference at time zero: 8.05t−statistic for difference at time zero: 1.25
Note.�Data source: Swedish National Board of Health and Welfare. The �gure showsthe relationship between the average number of admissions in a closing hospital's catch-ment area over time since the closure occurred, adjusting for calendar time trends in AMIincidence. The dots show the average values for each particular time period and the solidline pertains to a piece-wise linear relationship allowing for discontinuity at the time ofclosure, indicated by the vertical line. The shaded area marks the 95% con�dence intervalof the linear estimate.
Finally, one potential concern of the empirical design is that the closing hospitals used
to generate variation in hospital distance were selectively shut down with respect to the
underlying survival probability of population case-mix in the respective catchment area.
As mentioned earlier, this is unlikely due to the public nature of the health care provi-
sion in Sweden. Moreover, average hospital quality is also controlled for in the analysis.
Nevertheless, the concern is further investigated by analyzing aggregate health charac-
teristics in closing and referral hospital's catchments areas. Figure 5.4 shows the average
27

values of a number of aggregate health characteristics for closing and referral hospital
catchment areas (left panel) and their di�erence along with a 95-percent con�dence band
(right panel) for years prior to the hospital closures. The results are reassuring; both
types of regions have, on average, similar health characteristics, indicating that regions
where closures occurred are observationally unrelated to underlying patient population
health characteristics.
Figure 5.4: Aggregate health indicators in closing and referral hospital catchment
areas
0.13
0.06
0.43
0.51
0.23
0.65
0.83
0.74
0.13
0.07
0.44
0.53
0.24
0.65
0.80
0.74
Visits/10
Heart surgeries
Years since visit/10
Years since heart surgery/10
Share females
Average age/100
Hospital days/10
Survival probability
1 .75 .5 .25 0 .25 .5 .75 1Mean
Referral
Closing
(a)
Visits/10
Heart surgeries
Years since visit/10
Years since heart surgery/10
Share females
Average age/100
Hospital days/10
Survival probability
.1 .075 .05 .025 0 .025 .05 .075 .1Mean difference
Range (95% CI)
Difference in mean
(b)
Note.� Data source: Swedish National Board of Health and Welfare. See the data section for a de�nitionof a home hospital, closing hospital and referral hospital. The left panel of the �gure shows the average valuesfor a number of health indicators for each type of region and the right panel shows the cross-regional meandi�erence for each of these indicators (point estimate and 95 percent con�dence band). Some variables havebeen scaled to make the plot readable.
6 Summary and concluding remarks
Ischemic heart disease, with acute myocardial infarction (AMI) as one of its more serious
manifestations, is the most common cause of death in Sweden as well as in most of the
Western world. Since infarctions often occur relatively unexpectedly and rapid medical
assistance is fundamental for recovery, the probability of surviving an AMI is highly
dependent on a well-functioning health care system which can provide quick access to
health care in emergency situations. This is particularly important in relatively sparsely
populated countries like Sweden, where distances to medical care facilities with emergency
room capacity vary greatly between individual residents.
28

This paper evaluates the existence and magnitude of the impact of geographical access
to health care on health using AMI patients as the empirical application. Both the
problem of missing mortality data and the likely residential sorting of individuals are
circumvented by; i) adding nationwide information on AMI deaths from the Swedish
national causes of death registry to supplement the national inpatient registry; and ii)
utilizing geographical variation in distance to hospital arising from a number of emergency
hospital closures during a period of strong centralization of the publicly administered
Swedish health care sector. In Sweden, virtually all inpatient health care is publicly
provided and �nanced, implying that competition e�ects on the number and placing of
hospitals in the country should be negligible. Moreover, as individuals are directed to
a speci�c hospital based on their place of residence, variation over time with respect
to which hospital patients are directed to can be used to obtain plausibly exogenous
shifts in individual distances to hospital. As the full AMI population over a twenty-year
period is included in the analysis, i.e. both admitted patients and patients who die before
reaching a hospital, the empirical design accounts for both of the presumably most serious
identi�cation problems in evaluating the health e�ects of geographical access to health
care.
Using data on more than 300,000 AMI cases and sixteen emergency hospital closures
over the period 1990-2010, we �nd a substantial, statistically signi�cant and monotonously
decreasing e�ect of emergency hospital proximity on AMI survival probability. In par-
ticular, patients who experienced an increase in the distance to their home hospital of
between 51 and 60 kilometers ran an estimated 15 percent lower risk of surviving the AMI
than patients who lived within ten kilometers of their home hospital during both periods.
This e�ect is, as expected, primarily driven by an increased risk of out-of-hospital mor-
tality. Moreover, much smaller e�ects are found when estimating the e�ects of distance
based on actual distances to hospital, indicating that selective residential sorting is likely
to dilute the distance e�ect. When varying the time window between the closures and
AMI occurrence, the e�ect is shown to be only statistically signi�cant in the �rst year
29

after the closures. Perhaps reassuring for policy makers, the closures thus only seem
to have had a short-run e�ect, which might later have been counteracted with various
types of coping behavior among the involved agents. Finally, as a number of patients
experienced a cut in hospital distance due to the closures, the symmetry of the distance
e�ect is evaluated. The estimated e�ect is indeed reversed for patients who experienced
a decrease in distance and symmetry cannot be rejected.
To conclude, in times when health care expenditure increased in most Western coun-
tries, Sweden went in the opposite direction and reduced its health care spending by
approximately 11 percent between 1990 and 2000. Most of the cost savings were derived
from structural changes in the health care sector; from inpatient to outpatient care and
from increased resource consolidation of many care services. These tendencies were per-
haps necessary given the public sector budget de�cits, a consequence of the economic
depression in Sweden at the time, but the question remains whether the reduction in
health care expenditure came at the cost of a decrease in access to health care among
individuals living in more remote parts of the country. The results in this paper provide
some evidence for the notion that geographical access to health care does have an impact,
albeit only temporarily, on the survival rates of AMI patients, and hence that health care
centralization may have important side e�ects that should be taken into account. Per-
haps more importantly, this e�ect of distance may be more persistent in other countries
with more unregulated health care sectors due to the strategical positioning of pro�t-
maximizing hospitals. Speci�cally, hospitals in these markets may abandon geographical
areas in which aggregate incidence rates of costly emergency health care is higher, thus
creating a �health care desert� similar to the phenomenon of food deserts recognized in
many countries.
30

References
American Heart Association (2012). Heart Disease and Stroke Statistics � 2013Update. Annual report, American Heart Association.
Bachmann, J., McDonald, G. and O'Brien, P. (1986). A Study of Out-of-HospitalCardiac Arrests in Northern Minnesota. The Journal of the American Medical Associ-ation, 256 (4), 477�483.
Buchmueller, T. C., Jacobson, M. andWold, C. (2006). How Far to the Hospital?The E�ect of Hospital Closures on Access to Care. Journal of Health Economics, 25 (4),740�761.
Dellborg, M., Eriksson, P., Riha, M. and Swedberg, K. (1994). Declining Hos-pital Mortality in Acute Myocardial Infarction. European Heart Journal, 15 (1), 5�9.
Dranove, D., Durac, A. and Shanley, M. (1996). Are Multihospital Systems MoreE�cient? Health A�airs, 15 (1), 100�104.
Evans-Cuellar, A. and Gertler, P. J. (2003). Trends In Hospital Consolidation:The Formation Of Local Systems. Health A�airs, 22 (6), 77�87.
Gillum, R. F. (1990). Geographic Variation in Sudden Coronary Death. American HeartJournal, 119 (2), 380�389.
GUSTO Investigators (1993). An International Randomized Trial Comparing FourThrombolytic Strategies for Acute Myocardial Infarction. New England Journal ofMedicine, 329 (10), 673�682.
Hamilton, B. and Ho, V. (1998). Does Practice Make Perfect? Examining the Rela-tionship Between Hospital Surgical Volume and Outcomes for Hip Fracture Patientsin Quebec. Medical Care, 36 (6), 892�903.
Herlitz, J. (2000). One Hundred Years' of Progress in the Treatment of Acute Myocar-dial Infarction. Läkartidningen, 97, 3369-3372.
Herr, A. (2009). On Hospital Competition: Quality, E�ciency, and Ownership. Ph.D.thesis, Friedrich-Alexander-University of Erlangen-Nuremberg (FAU).
Julian, D. G. (1961). Treatment of Cardiac Arrest in Acute Myocardial Ischaemia andInfarction. The Lancet, 278 (7207), 840 � 844.
Landstingsförbundet (2002). Svensk Hälso- och Sjukvård Under 1990-talet: Utveck-lingstendenser 1992-2000. Tech. rep.
Lindbom, A. (2013).Waking Up the Giant? Hospital Closures and Electoral Punishmentin Sweden. mimeo, The Institute for Housing and Urban Research (IBF), Uppsala,Sweden.
Luft, H. S., Hunt, S. S. and Maerki, S. C. (1987). The Volume-Outcome Relation-ship: Practice-Makes-Perfect or Selective-Referral Patterns? Health Services Research,22 (2), 157�182.
31

Maerki, S. C., Luft, H. S. and Hunt, S. S. (1986). Selecting Categories of Patientsfor Regionalization. Implications of the Relationship Between Volume and Outcome.Medical Care, 24 (2), 148�158.
Nationellt register för hjärtstopp (2011). Årsrapport 2011. Annual report, Sven-ska Rådet för Hjärt-lungräddning.
Norris, R. M. (1998). Fatality Outside Hospital from Acute Coronary Events in ThreeBritish Health Districts, 1994-5. British Medical Journal, 316 (7137), 1065�1070,United Kingdom Heart Attack Study Collaborative Group.
O'Neill, L. (2003). Estimating Out-of-Hospital Mortality Due to Myocardial Infarction.Health Care Management Science, 6, 147�154.
Pell, J. P., Sirel, J. M., Marsden, A. K., Ford, I. and Cobbe, S. M. (2001).E�ect of Reducing Ambulance Time on Deaths from Out-of-Hospital Cardiac Arrest:Cohort Study. British Medical Journal, 322 (7299), 1385�1388.
Piette, J. and Moos, R. (1996). The In�uence of Distance on Ambulatory Care Use,Death, and Readmission Following a Myocardial Infarction. Health Services Research,31 (5), 573�591.
Socialstyrelsen (2009). Myocardial Infarctions in Sweden 1987-2007. O�cial Statis-tics of Sweden: Statistics � Hälso- och Sjukvård.
Succi, M. J., Lee, S. Y. and Alexander, J. A. (1997). E�ects of Market Position andCompetition on Rural Hospital Closures. Health Services Research, 31 (6), 679�699.
Sveriges Kommuner och Landsting (2004). Utvecklingen i Svensk Hälso- ochSjukvård : En Redovisning av hur Sjukvården Använder sina Resurser. Tech. rep.,Swedish Association of Local Authorities and Regions (SALAR).
Sveriges Kommuner och Landsting (2008). Utvecklingen i Svensk Hälso- ochSjukvård : Struktur och Arbetssätt för bättre resultat. Tech. rep., Swedish Associationof Local Authorities and Regions (SALAR).
Thiemann, D. R., Coresh, J., Oetgen, W. J. and Powe, N. (1999). The AssociationBetween Hospital Volume and Survival After Acute Myocardial Infarction in ElderlyPatients. The New England Journal of Medicine, 340 (21), 1640�1648.
Wohlin, L. (1998). Bankkrisens Upprinnelse. Ekonomisk Debatt, 26 (1), 21�30.
32

Appendix A Tables and �gures
Table A.1: Descriptive sample statistics
Group averages Group di�erence
Variable No distancechange
Distancechange
Mean di�erence P (|Z| ≤ z)
Heart surgeries 0.137 0.141 0.004 0.780(0.537) (0.525) (0.012)
Years since hospital visit 5.841 6.231 0.390 <0.001(3.001) (3.104) (0.072)
Years since heart surgery 8.549 9.360 0.811 <0.001(2.450) (1.615) (0.058)
Female 0.313 0.298 -0.015 0.188Age 71.12 70.75 -0.37 0.165
(1.113) (1.123) (0.027)Days in hospital 6.728 6.408 -0.320 0.067
(6.607) (5.198) (0.176)Hospital distance in j 14.175 14.076 -0.100 0.757
(13.516) (11.163) (0.323)Hospital distance in j + 1 14.175 26.085 11.909 <0.001
(13.516) (12.659) (0.323)Survived AMI 0.773 0.760 -0.013 0.194OOH AMI death 0.174 0.194 0.020 0.027IH AMI death 0.054 0.047 -0.007 0.191
Observations 329,756 1,759 331,515 -
Note.�The table reports estimated means, mean di�erences and (standard deviations) of included covariates for sampledAMI patients who did or did not experience a change in distance from an emergency hospital closure respectively. Thevariables are; the historical number of heart surgeries, number of years since the last hospital visit, years since the lastreported heart surgery, the individual's gender and age, the historical number of days in hospital since 1987, the observeddistance from an individual's registered residence to his or her designated home hospital in time period j and j+ 1 where jindicates the year of the hospital closure respectively, and �nally the proportion of patients who survived, died outside andinside a hospital respectively. The last two columns report the di�erence in group means and the result from a standardt-test of equality of means across the groups.
33

Figure A.1: Visits at closing hospitals and their referral hospitals
over time
050
100
150
010
2030
Adm
issi
ons
1988
m1
1990
m1
1992
m1
1994
m1
1996
m1
1998
m1
2000
m1
2002
m1
2004
m1
2006
m1
2008
m1
2010
m1
Month
050
100
150
010
2030
1988
m1
1990
m1
1992
m1
1994
m1
1996
m1
1998
m1
2000
m1
2002
m1
2004
m1
2006
m1
2008
m1
2010
m1
Month
Södersjukhuset Nacka sjukhus MA: Södersjukhuset MA: Nacka sjukhus
020
4060
80
05
1015
Adm
issi
ons
1988
m1
1990
m1
1992
m1
1994
m1
1996
m1
1998
m1
2000
m1
2002
m1
2004
m1
2006
m1
2008
m1
2010
m1
Month
020
4060
80
05
1015
1988
m1
1990
m1
1992
m1
1994
m1
1996
m1
1998
m1
2000
m1
2002
m1
2004
m1
2006
m1
2008
m1
2010
m1
Month
Vrinnevisjukhuset Finspångs lasarett MA: Vrinnevisjukhuset MA: Finspångs lasarett
Note.� Data source: Swedish National Board for Health and Welfare. The plots onthe left show the monthly number of AMI visits at hospitals with closing emergencyrooms (blue lines and left y-axis) and referral hospitals (red lines and right y-axis).The plots on the right show the corresponding six-month moving averages of thesame plots (three leads and three lags).
Figure A.2: Visits at closing hospitals and their referral hospitals
over time
020
4060
05
1015
2025
Adm
issi
ons
1988
m1
1989
m1
1990
m1
1991
m1
1992
m1
1993
m1
1994
m1
1995
m1
1996
m1
Month
020
4060
05
1015
2025
1988
m1
1989
m1
1990
m1
1991
m1
1992
m1
1993
m1
1994
m1
1995
m1
1996
m1
Month
Skövde sjukhus Falköpings sjukhus MA: Skövde sjukhus MA: Falköpings sjukhus
010
2030
4050
010
2030
40A
dmis
sion
s
1988
m1
1990
m1
1992
m1
1994
m1
1996
m1
1998
m1
2000
m1
2002
m1
2004
m1
2006
m1
2008
m1
2010
m1
Month
010
2030
4050
010
2030
40
1988
m1
1990
m1
1992
m1
1994
m1
1996
m1
1998
m1
2000
m1
2002
m1
2004
m1
2006
m1
2008
m1
2010
m1
Month
Ystads lasarett Simrishamns sjukhus MA: Ystads lasarett MA: Simrishamns sjukhus
Note.� Data source: Swedish National Board for Health and Welfare. The plots onthe left show the monthly number of AMI visits at hospitals with closing emergencyrooms (blue lines and left y-axis) and referral hospitals (red lines and right y-axis).The plots on the right show the corresponding six-month moving averages of thesame plots (three leads and three lags).
34

Figure A.3: Visits at closing hospitals and their referral hospitalsover time
020
4060
8010
0
010
2030
Adm
issi
ons
1988
m1
1990
m1
1992
m1
1994
m1
1996
m1
1998
m1
2000
m1
2002
m1
2004
m1
2006
m1
2008
m1
2010
m1
Month
020
4060
8010
0
010
2030
1988
m1
1990
m1
1992
m1
1994
m1
1996
m1
1998
m1
2000
m1
2002
m1
2004
m1
2006
m1
2008
m1
2010
m1
Month
Universitetssjukhuset i Lund Landskrona MA: Universitetssjukhuset i Lund MA: Landskrona
010
2030
40
05
1015
2025
Adm
issi
ons
1988
m1
1990
m1
1992
m1
1994
m1
1996
m1
1998
m1
2000
m1
2002
m1
2004
m1
2006
m1
2008
m1
2010
m1
Month
010
2030
40
05
1015
2025
1988
m1
1990
m1
1992
m1
1994
m1
1996
m1
1998
m1
2000
m1
2002
m1
2004
m1
2006
m1
2008
m1
2010
m1
Month
Kristinehamn Karlskoga lasarett MA: Kristinehamn MA: Karlskoga lasarett
Note.� Data source: Swedish National Board for Health and Welfare. The plotson the left show the monthly number of AMI visits at hospitals with closing emer-gency rooms (blue lines and left y-axis) and referral hospitals (red lines and righty-axis). The plots on the right show the corresponding six-month moving averagesof the same plots (three leads and three lags).
Figure A.4: Visits at closing hospitals and their referral hospitals
over time
020
4060
80
05
1015
2025
Adm
issi
ons
1988
m1
1990
m1
1992
m1
1994
m1
1996
m1
1998
m1
2000
m1
2002
m1
2004
m1
2006
m1
2008
m1
2010
m1
Month
020
4060
80
05
1015
2025
1988
m1
1990
m1
1992
m1
1994
m1
1996
m1
1998
m1
2000
m1
2002
m1
2004
m1
2006
m1
2008
m1
2010
m1
Month
Säffle Karlstads sjukhus MA: Säffle MA: Karlstads sjukhus
020
4060
05
1015
20A
dmis
sion
s
1988
m1
1990
m1
1992
m1
1994
m1
1996
m1
1998
m1
2000
m1
2002
m1
2004
m1
2006
m1
2008
m1
2010
m1
Month
020
4060
05
1015
20
1988
m1
1990
m1
1992
m1
1994
m1
1996
m1
1998
m1
2000
m1
2002
m1
2004
m1
2006
m1
2008
m1
2010
m1
Month
Västerås lasarett Sala lasarett MA: Västerås lasarett MA: Sala lasarett
Note.� Data source: Swedish National Board for Health and Welfare. The plots onthe left show the monthly number of AMI visits at hospitals with closing emergencyrooms (blue lines and left y-axis) and referral hospitals (red lines and right y-axis).The plots on the right show the corresponding six-month moving averages of thesame plots (three leads and three lags).
35

Figure A.5: Visits at closing hospitals and their referral hospitals
over time
010
2030
40
05
1015
20A
dmis
sion
s
1988
m1
1990
m1
1992
m1
1994
m1
1996
m1
1998
m1
2000
m1
2002
m1
2004
m1
2006
m1
2008
m1
2010
m1
Month
010
2030
40
05
1015
20
1988
m1
1990
m1
1992
m1
1994
m1
1996
m1
1998
m1
2000
m1
2002
m1
2004
m1
2006
m1
2008
m1
2010
m1
Month
Köpings lasarett Fagersta lasarett MA: Köpings lasarett MA: Fagersta lasarett
020
4060
80
010
2030
Adm
issi
ons
1988
m1
1990
m1
1992
m1
1994
m1
1996
m1
1998
m1
2000
m1
2002
m1
2004
m1
2006
m1
2008
m1
2010
m1
Month
020
4060
80
010
2030
1988
m1
1990
m1
1992
m1
1994
m1
1996
m1
1998
m1
2000
m1
2002
m1
2004
m1
2006
m1
2008
m1
2010
m1
Month
Sandvikens sjukhus Gävle sjukhus MA: Sandvikens sjukhus MA: Gävle sjukhus
Note.� Data source: Swedish National Board for Health and Welfare. The plots onthe left show the monthly number of AMI visits at hospitals with closing emergencyrooms (blue lines and left y-axis) and referral hospitals (red lines and right y-axis).The plots on the right show the corresponding six-month moving averages of thesame plots (three leads and three lags).
Figure A.6: Visits at closing hospitals and their referral hospitals
over time
010
2030
05
1015
20A
dmis
sion
s
1988
m1
1989
m1
1990
m1
1991
m1
1992
m1
1993
m1
1994
m1
1995
m1
1996
m1
1997
m1
1998
m1
Month
010
2030
05
1015
20
1988
m1
1989
m1
1990
m1
1991
m1
1992
m1
1993
m1
1994
m1
1995
m1
1996
m1
1997
m1
1998
m1
Month
Söderhamns sjukhus Bollnäs sjukhus MA: Söderhamns sjukhus MA: Bollnäs sjukhus
020
4060
80
05
1015
Adm
issi
ons
1988
m1
1990
m1
1992
m1
1994
m1
1996
m1
1998
m1
2000
m1
2002
m1
2004
m1
2006
m1
2008
m1
2010
m1
Month
020
4060
80
05
1015
1988
m1
1990
m1
1992
m1
1994
m1
1996
m1
1998
m1
2000
m1
2002
m1
2004
m1
2006
m1
2008
m1
2010
m1
Month
Sundsvalls sjukhus Härnösands sjukhus MA: Sundsvalls sjukhus MA: Härnösands sjukhus
Note.� Data source: Swedish National Board for Health and Welfare. The plots onthe left show the monthly number of AMI visits at hospitals with closing emergencyrooms (blue lines and left y-axis) and referral hospitals (red lines and right y-axis).The plots on the right show the corresponding six-month moving averages of thesame plots (three leads and three lags).
36

Figure A.7: Survival probability by home hospital
.82
.85
.88
.91
.94
Mea
n su
rviv
al r
ate
5301
161
013
5201
727
011
1101
452
011
5501
153
013
2701
054
011
5101
154
013
5001
054
014
5401
251
010
4101
021
014
1301
013
012
2201
113
011
5701
165
012
2501
128
012
2801
361
012
5201
263
010
6201
162
013
4201
057
013
6401
028
010
5701
211
011
6501
465
013
4101
128
011
2601
041
012
5501
221
013
6401
164
001
2401
011
012
2301
053
014
6201
012
001
1001
355
010
2201
054
010
5101
225
010
5601
061
015
1100
222
012
1001
123
011
5601
242
011
1201
065
015
5701
061
010
3000
151
013
2100
141
013
6101
111
001
5100
141
001
5101
427
012
6501
611
010
Hospital
Note.� Data source: Swedish National Board for Health and Welfare. AMI sur-vival probability for each hospital is measured as the share of individuals who werethe subject of an AMI living in the hospitals catchment area and were dischargedfrom the hospital alive. Individual hospitals are shown on the x-axis in ascendingorder with respect to survival probability aggregated over the period 1990-2010.The horizontal dashed line indicates hospital average survival probability in thesample of hospitals.
Figure A.8: AMI frequency and average survival rates, 1990-
2010
7000
7500
8000
8500
9000
9500
Fre
quen
cy
.6.6
5.7
.75
.8S
urvi
val p
roba
bilit
y
1988
q1
1990
q1
1992
q1
1994
q1
1996
q1
1998
q1
2000
q1
2002
q1
2004
q1
2006
q1
2008
q1
2010
q1
Quarter
Quarter average Polynomial smooth Total AMI:s
Note.� Data source: Swedish National Board for Health and Welfare. The�gure plots (on the left y-axis) average survival rates as a raw quarterly averageand as a smoothed kernel density estimate using an Epanechnikov kernel with abandwidth of 3.8. The quarterly number of AMIs over the period is plotted onthe right y-axis.
37

Figure A.9: Distribution of deaths by days after an AMI
05
1015
20P
erce
nt
0 20 40 60 80 100Days until death
Note.� Data source: Swedish National Board of Health and Welfare. The�gure shows the distribution of the observed number of deaths in the analysissample of AMI patients excluding individuals that die on the same day as theAMI occurred (due to scaling issues). The number of AMI cases ending in deathon the same day as the AMI occurred is approximately 191,000 or 58 percent ofthe total number of deaths.
38