a low-power, atmospheric pressure, pulsed plasma source for molecular emission spectrometry
TRANSCRIPT
A Low-Power, Atmospheric Pressure, PulsedPlasma Source for Molecular EmissionSpectrometry
Zhe Jin, Yongxuan Su, and Yixiang Duan*
Chemical Science and Technology Division, CST-9, MS K484, Los Alamos National Laboratory,Los Alamos, New Mexico 87545
A low-power, plasma source-based, portable molecularemission detector is described in this paper. The detectoremploys a pulsed-plasma source operated at atmosphericpressure for molecular fragmentation and excitation. Theplasma was generated with a home-built high-voltagepulsed power supply. The average operational power ofthe detector was less than 0.2 W. The effects of opera-tional parameters such as plasma gas, voltage, and plasmagas flow rate were investigated. Molecular emissionspectra of a variety of organic compounds were studied.The features of the emission spectra obtained with thepulsed plasma source were significantly different fromthose obtained with direct current (dc) discharge at apower higher than 10 W. The spectra obtained in thiswork showed strong CH emission at 431.2 nm; however,the typical CN emission observed with a conventional dcplasma source at 383-388 nm was very weak in mostcases. The strong CN emission was only obtained forcompounds containing nitrogen, such as aniline. Dimethylsulfoxide can be detected at a limit of 200 ppb usinghelium plasma by observing the emission band of the CHradical. The detector was very stable and did not experi-ence electrode fouling even with the introduction oforganic vapors. Such a detector is very promising fororganic vapor detection.
Innovative, field-portable monitoring technologies are requiredin the chemical industry, national defense, and environmentalprotection in order to obtain real-time data on chemical emissionsin air, identify the sources of chemicals, and reduce or eliminatethe emissions of toxic chemicals. Large platform analyticalequipment such as gas chromatography (GC), high-performanceliquid chromatography (HPLC), mass spectrometer (MS), induc-tively coupled plasma atomic emission spectrometer (ICP-AES),ICPMS, and GC/MS have been used to analyze chemical emis-sions in the environment. However, most of the equipmentcurrently commercially available is large, expensive, and notsuitable for real-time field use. Therefore, there is a strong needto develop miniature, field-portable analytical instruments.
By employing a separation technique such as capillary gaschromatography, it is possible to develop a compact separationinstrument. A field-portable gas chromatography/mass spectrom-eter was developed by Sinha and Guinikov.1 A short microborecolumn 3 m in length and 50 µm in inner diameter was used forseparation. Such a design lowers the flow rate of carrier gas to0.05 atm cm3 min-1 and significantly reduces the weight and powerneeds of the mass spectrometer, thus making the system portable.However, the cost of the system, which is much higher than GCequipped with other detectors such as flame ionization detectorsor electron capture detectors, significantly limits its applications.
Plasma-based emission spectrometry was first used in a GCdetector by McCormack et al.2 A microwave-induced plasma(MIP) was used as an energy source for molecular fragmentationand excitation. Detection limits as low as 10-16 g/s were obtainedfor hexane. Because these emission detectors are very sensitiveand able to simultaneously detect a wide variety of analytes, theiruse has been studied recently.3,4 Eijkel et al.3 prepared a directcurrent (dc) microplasma detector on a glass chip. Plasma wasgenerated in a chamber of 50-nL volume. Methane could bedetected to 600 ppm. Because of the sputtering of cathode materialat reduced pressure (130 Torr), the lifetime of the detector waslimited to ∼2 h. The emission intensity also showed considerablequantitative variation; therefore, the microplasma detector was notsuitable for practical use in GC.
A low-power microwave plasma detector was recently devel-oped by Engel et al.4 A plasma with a longitudinal extension of2-3 cm was generated with a forward power of 10-40 W. Becausethe power consumption is low, it is possible to operate the detectorwith a semiconductor microwave source powered by a car battery.Because of the low operational power, the rotational temperatureof the plasma was reported to be ∼650 K; thus, the plasma hasvery low tolerance for water-loaded aerosols. Additionally, gaspressure and sample vapor clouds had a strong effect on plasmacharacteristics. Therefore, the performance of the detector wouldstrongly depend on the sample types.
* Corresponding author: (fax) 505-665-5982; (e-mail) [email protected].
(1) Sinha, M. P.; Gutnikov, G. Anal. Chem. 1991, 63, 2012-2016.(2) McCormack, A. J.; Tong, S. C.; Cooke, W. D. Anal. Chem. 1965, 37, 1470-
1476.(3) Eijkel, J. C. T.; Stoeri, H.; Manz, A. Anal. Chem. 1999, 71, 2600-2606.(4) Engel, U.; Bilgic, A. M.; Haase, O.; Voges, E.; Broekaert, A. C. Anal. Chem.
2000, 72, 193-197.
Anal. Chem. 2001, 73, 360-365
360 Analytical Chemistry, Vol. 73, No. 2, January 15, 2001 10.1021/ac000678x CCC: $20.00 © 2001 American Chemical SocietyPublished on Web 11/30/2000

Direct current,5-6 alternating current,7 and high-voltage pulsed8
plasma detectors have been developed. These detectors are simpleto build and consume less power than other plasma sources. Thepossibility of constructing a compact and low-power plasmadetector has been pointed out;7,8 however, to our best knowledge,there has been no report on a compact plasma source-basedemission detector that can be operated with an energy sourcesuch as alkaline batteries.
This work describes a new low-power pulsed plasma detectorfor molecular emission spectrometry. This detector is simple, lowcost, and sensitive to organic vapors. The detector was designedto have very low power consumption. A home-built, high-voltagepulsed power supply that can be operated with alkaline batterieswas used to generate the plasma for molecular fragmentation andexcitation. The influence of plasma gases, flow rates, and dischargevoltages on the performance of the detector was studied. Thereproducibility and sensitivity of the detector to organic vaporswas studied using dimethyl sulfoxide (DMSO).
EXPERIMENTAL SECTIONDetector and High-Voltage Pulsed Power Supply. A
schematic diagram of the detector is shown in Figure 1. Twoplatinum plate electrodes (0.04 mm in thickness and 3 mm inwidth) were placed face to face inside Teflon tubing (40 mm longand 7 mm o.d.). The distance between these two dischargeelectrodes was ∼1.5 mm. A high-voltage pulse was applied to theelectrodes for atmospheric pressure plasma generation. Epoxywas used to seal the outside wall of the Teflon tubing to preventgas leakage.
To reduce the weight of the power supply, a small powertransformer (T1, primary voltage 230 V; secondary voltage 6.3 V)was used to generate high voltage. The transformer and drivercircuitry for generating the high-voltage pulse was housed in ashielded 21 cm × 15 cm × 5.5 cm aluminum box. The total weightof the pulsed power supply is ∼3 lbs. High voltage is generatedwith a transformer in a manner similar to that of an ignition coil8
and a neon transformer.9 To generate high voltage, the secondarywires of the transformer were used as primary wires, and theprimary wires were used as secondary wires. The experimental
parameters such as charging time and discharging time weremodulated with a home-built pulse generator based on a 555 timer,which is a device for generating accurate time delays or oscillation.A low voltage from a 15 V dc power supply or alkaline batterieswas applied to the transformer (see Figure 1), and a high-voltageoutput was obtained during charging and discharging cycles,which were controlled by the pulse generator and a powertransistor (Q1). The adjustable parameters that are important fordischarging performance include charging time (Tc), dischargingtime (Td), and voltage applied to the primary wires (Epri). Theoperating frequency ranged from 350 to 1000 Hz. A stable pulsedplasma source could be generated with this power supply.
Emission Spectrum Measurement. Plasma was generatedusing plasma gas such as helium, argon, or nitrogen when a high-voltage pulse was applied to the discharge electrodes. Theemission spectrum from the plasma was monitored with an OceanOptics PC2000 spectrometer system (Dunedin, FL) as shown inFigure 1. The light collection system included a collimating lens,which converts divergent beams of light into a parallel beam andfocuses the beam into an optical fiber. The spectrometer systemwas optimized for the wavelength range of 200-480 nm. A SonyILX511 liner CCD-array detector with 2048-element pixels wasused for light detection. A 200-µm-diameter fiber and 2400grooves/nm gratings were used for the instrument. A Windows-based OOIChem operating software was used for data acquisitionand signal processing. A notebook computer with a 100-kHzsampling frequency DAQ-700 card (National Instruments Inc.) wasused to show real-time spectrum and store data. An interface cablewas used to make a connection between the spectrometer andthe computer.
Discharge Voltage and Current Measurements. A HP54520A oscilloscope (Palo Alto, CA) was used to monitor dischargeparameters. The discharge voltage was measured with a 100:1voltage divider, and the current was determined by measuringthe voltage drop across a 100 Ω resistor with the ground return.
Organic Vapor Introduction. Two different methods wereused for organic vapor introduction. Since DMSO has a vaporpressure of 0.4 Torr at 20 °C, helium gas saturated with DMSOvapor could be introduced directly into the plasma withoutaffecting the plasma stability. However, when helium gas saturatedwith other highly volatile organic vapors such as methanol oracetone was continuously fed into the plasma, the plasma becameunstable. When helium saturated with ethanol was used, plasmacould not be generated at a discharge pulse of 4000 V, whichrequired that these volatile compounds be introduced into theplasma by a different method. First, a piece of Tygon tubing wasrinsed with a volatile organic solvent. The Tygon tubing with theorganic solvent adsorbed into it was then connected to the plasmagas line. Helium gas passed through the gas line, carrying theorganic compounds adsorbed on the surface of the Tygon tubinginto the plasma. Using this method, volatile organic compoundscan be introduced and the plasma can be maintained. Caution:aniline is highly toxic and care should be taken in the handling,analysis, and disposal of aniline and its oxidation products.
Chemicals and Reagents. High-purity argon, helium, andnitrogen (99.999%, Trigas Industrial Gases) were used as plasmagases. Methanol, ethanol, acetone, dichloromethane, aniline, andDMSO (Aldrich, Milwaukee, WI) were used as received.
(5) Braman, R. S.; Dynako, A. Anal. Chem. 1968, 40, 95-106.(6) Decker, R. J. Spectrochim. Acta 1980, 35B, 19-31.(7) Costanzo, R. B.; Barry, E. F. Anal. Chem. 1988, 60, 826-829.(8) Wentworth, W. E.; Vasnin, S. V.; Stearns, S. D.; Meyer, C. J. Chromatographia
1992, 34, 219-225.
Figure 1. Schematic diagram of the experimental setup.
Analytical Chemistry, Vol. 73, No. 2, January 15, 2001 361

All the experiments were performed at room temperature andatmospheric pressure.
RESULTS AND DISCUSSIONPlasma Gas and Plasma Generation. The no-load output
voltage of the home-built, high-voltage pulsed power supply rangesfrom 2000 to 4000 V. The pulse parameters of 1100 µs chargingtime (Tc) and 100 µs discharging time (Td) were commonly used.With an input voltage (Epri) of 2.5 V, a pulse height of ∼2000 Vwas obtained. At a pulse height of 2000 V, bright plasma wasinstantly observed when argon or helium was used as the plasmagas at a flow rate of 0.5 L/min. However, no discharge wasobserved when nitrogen was used as the plasma gas under thesame conditions. A stable nitrogen plasma could only be generatedwhen the Epri was further increased to 7.92 V, corresponding to apulse height of ∼3000 V.
The operational power increases linearly with Epri up to 5.53V and then levels off with a further increase of Epri. The averageoperational power ranges from 0.04 W at an Epri of 2.5 V to 0.16W at an Epri of 7.91 V. To reduce the power consumption of thedetector, either argon or helium was needed as the plasma gas.Because helium has a higher metastable-state energy for excitationand ionization of organic compounds, we selected it as the plasmagas for our studies.
Two Duracell size D batteries (1.5 V) were used to power thetransformer circuitry. A stable helium plasma was maintained formore than 10 h in our preliminary test with a He flow rate of 0.1L/min, a pulse frequency of 670 Hz, and Epri of 1.5 V. Since asingle size D battery has a capacity of 15 000 MAH and themaximum average discharge current in the experiment is ∼50mA, the operational time was estimated to be ∼600 h with twosize D alkaline batteries. However, because a voltage regulatorand additional circuitry were used to adjust the output voltage,the practical operational time should be shorter than the estimatedvalue due to the additional power consumption by these addedelectric components.
Plasma Background. Figure 2 shows the emission spectrumof the atmospheric pressure helium plasma for the wavelength
region between 240 and 500 nm. The spectrum shows typicalhelium emission lines and significant molecular bands of OH, NH,N2, and N2
+ species10-13 due to the presence of impurities suchas water, N2, O2, and hydrocarbons. The C(I) atomic line at 247.86nm,10,11,13 which is commonly observed in other plasmas such asmicrowave-induced plasma, is absent. This result may be due toseveral factors, such as high purity of helium, low dischargepower, and short residence time (6.9 ms at a plasma gas flow rateof 1 L/min).
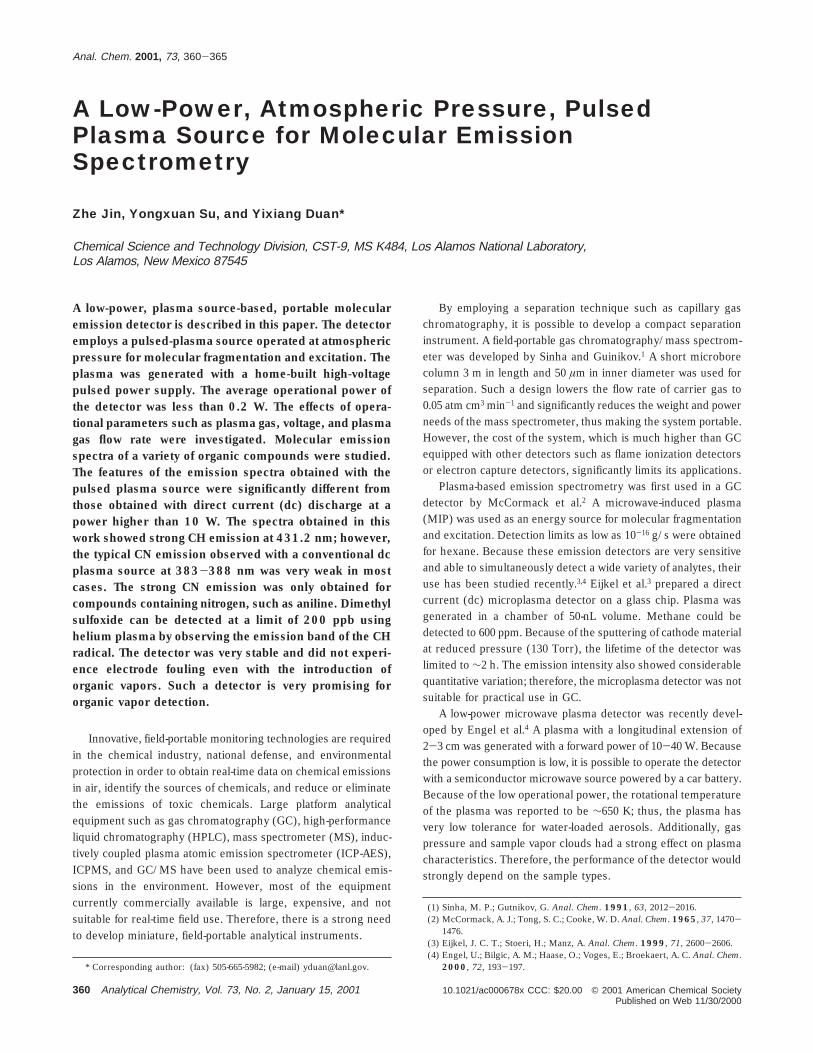
To simplify the design of the detector, no glass or quartz opticalwindow was placed in the gas outlet of the detector; therefore,back-diffusion of air into the detector at low flow rates is expected.As shown in Figure 3, at a flow rate of 0.5 L/min, the spectrumis dominated by the molecular emission bands of N2 between 340and 360 nm. When the flow rate is increased, the intensity of N2
bands decreases gradually. However, even at a flow rate of 5.0L/min, weak N2 bands still exist. Since it is very unlikely that theN2 bands at such a high flow rate are contributed by the back-diffusion of air into the detector, the nitrogen bands are probablydue to the trace impurities of N2 in helium.14 The influence of theback-diffusion of air can be reduced by using a higher plasmagas flow rate, reducing the inner diameter of the detector, orshielding the detector gas outlet with an optical window.
Current/Voltage Characteristics. The impurities introducedinto the detector through back-diffusion can affect the dischargecharacteristics. To minimize the effect of impurities on thedischarge voltage and current measurements, it is best to reducethe amount of impurities in the plasma. We can reduce theinfluence of impurities introduced by back-diffusion of air byincreasing the flow rate of helium to above 3 L/min. Figure 4shows the current/voltage curve at a flow rate of 4.0 L/min. Thedrop of plasma voltage with increasing plasma current wasreported for a dc microplasma due to heating of the plasma gas.3
In this work, the discharge voltage increases with the dischargecurrent (see Figure 4). The characteristics of current and voltageobserved for the detector indicate that the plasma gas temperatureis low. The gas temperature can be estimated from the rotationaltemperature, which is measured from the intensity distributionof the rotational lines in the OH bands.15 The rotational temper-ature of the current plasma source was determined to be 320 (20 K. The low gas temperature can be associated with the lowpower used for the discharge and relatively high gas flow rates.Because of the low gas temperature, the surface of the detectorbody did not become warm to the touch even after continuouslyrunning the detector for several hours.
Plasma Stability. A stable helium plasma can be generatedwith an Epri in the range of 2.5-9 V independent of pulse widthand pulse frequencies. The intensity of the molecular emissionof nitrogen at 357.69 at 0.5 L/min is strongly dependent on theinput voltage. At Epri ) 2.5 V, a stable helium plasma was obtained;however, the emission intensity was low. The emission intensity
(9) Yu, T.; Winefordner, J. D. Spectrosc. Lett. 1988, 21, 465-476.(10) Estes, S. A.; Uden, P. C.; Barnes, R. M. Anal. Chem. 1981, 53, 1829-1837.(11) Patel, B. M.; Heithmar, E.; Winefordner, J. D. Anal. Chem. 1987, 59, 2374-
2377.(12) Rice, G. W.; D′Silva, A. P.; Fassel, V. A. Spectrochim. Acta 1985, 40B, 1573-
1584.(13) Quimby, B. D.; Sulliva, J. J. Anal. Chem. 1990, 62, 1027-1034.(14) Ogino, H.; Seki, T. Anal. Chem. 1997, 69, 3636-3640.(15) Ishii, I.; Montaser, A. Spectrochim. Acta 1991, 46B, 1197-1206.
Figure 2. Typical background of emission spectrum of the pulsedhelium plasma: He flow rate, 3.0 L/min; discharge frequency, 830Hz; Tc, 1100 µs; Td, 100 µs; Epri, 4.55 V; integration time, 200 ms;spectrum average number, 10.
362 Analytical Chemistry, Vol. 73, No. 2, January 15, 2001
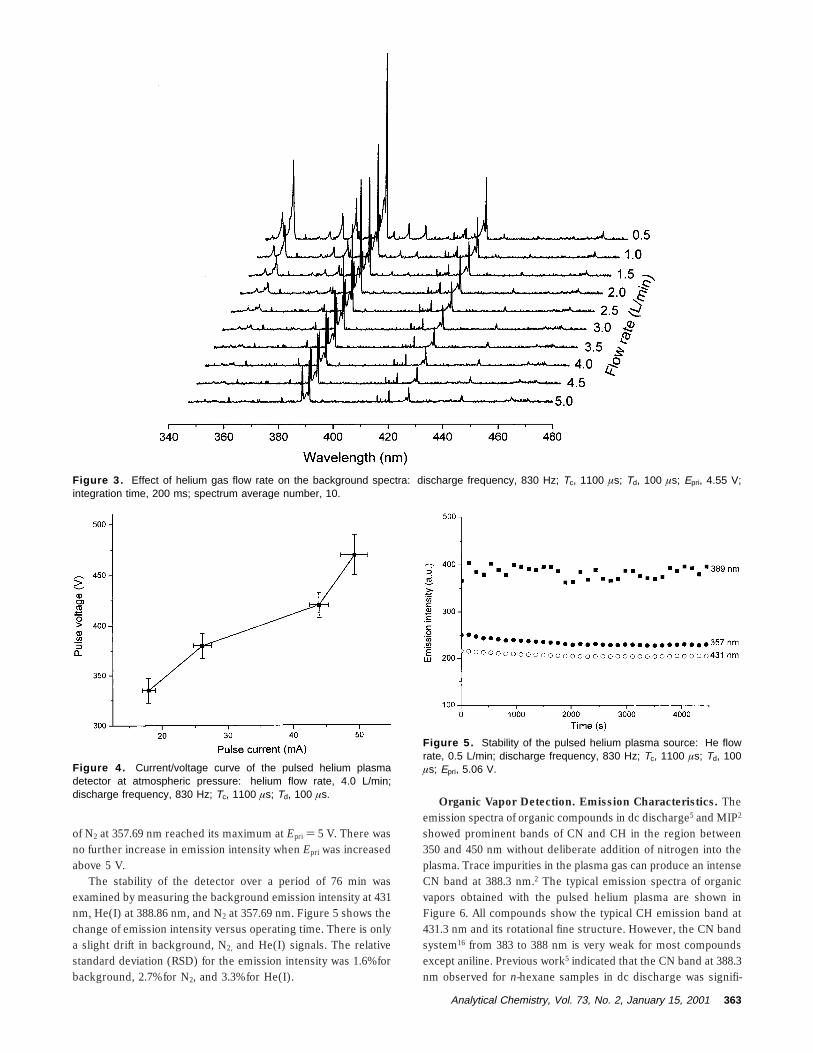
of N2 at 357.69 nm reached its maximum at Epri ) 5 V. There wasno further increase in emission intensity when Epri was increasedabove 5 V.
The stability of the detector over a period of 76 min wasexamined by measuring the background emission intensity at 431nm, He(I) at 388.86 nm, and N2 at 357.69 nm. Figure 5 shows thechange of emission intensity versus operating time. There is onlya slight drift in background, N2, and He(I) signals. The relativestandard deviation (RSD) for the emission intensity was 1.6% forbackground, 2.7% for N2, and 3.3% for He(I).
Organic Vapor Detection. Emission Characteristics. Theemission spectra of organic compounds in dc discharge5 and MIP2
showed prominent bands of CN and CH in the region between350 and 450 nm without deliberate addition of nitrogen into theplasma. Trace impurities in the plasma gas can produce an intenseCN band at 388.3 nm.2 The typical emission spectra of organicvapors obtained with the pulsed helium plasma are shown inFigure 6. All compounds show the typical CH emission band at431.3 nm and its rotational fine structure. However, the CN bandsystem16 from 383 to 388 nm is very weak for most compoundsexcept aniline. Previous work5 indicated that the CN band at 388.3nm observed for n-hexane samples in dc discharge was signifi-
Figure 3. Effect of helium gas flow rate on the background spectra: discharge frequency, 830 Hz; Tc, 1100 µs; Td, 100 µs; Epri, 4.55 V;integration time, 200 ms; spectrum average number, 10.
Figure 4. Current/voltage curve of the pulsed helium plasmadetector at atmospheric pressure: helium flow rate, 4.0 L/min;discharge frequency, 830 Hz; Tc, 1100 µs; Td, 100 µs.
Figure 5. Stability of the pulsed helium plasma source: He flowrate, 0.5 L/min; discharge frequency, 830 Hz; Tc, 1100 µs; Td, 100µs; Epri, 5.06 V.
Analytical Chemistry, Vol. 73, No. 2, January 15, 2001 363

cantly affected by discharge power, and the CN emission intensitywas small at relatively low power levels. Because the averagepower used for our plasma detector was less than 0.2 W, whichis much lower than that employed in dc discharge,5 only very weakCN emission peaks were observed at 383-388 nm in most cases.
For an organic compound that does not contain nitrogen, theformation of CN species can be attributed to chemical reactionsfollowing fragmentation of the compound into C and CH species.Because multistep reactions are involved in the formation of CN
species, the emission of CN is closely related to experimentalconditions such as operational power. In helium plasma, heliumions (21.2 eV) and metastable helium species (19 eV) havesufficient energy to break molecular bonds; therefore, CN canbe directly produced from nitrogen-containing organic compoundssuch as aniline. The high emission intensity of CN for aniline istentatively attributed to the direct formation of CN under theimpact of highly energetic helium ions and metastable heliumspecies.
The formation of CN from an organic compound in heliumplasma was represented by the following reactions:5
reactions 1 and 2 were believed to be the major source of CN,and reactions 3 and 4 were relatively less important.5 However,while we observed relatively intense CH, N2, and NH emissionswith the low-power helium plasma, we did not observe significantCN bands. It seems that there is no direct correlation betweenCH and CN; therefore, we believe that CN formation is mainlythrough reactions 3 and 4 rather than reactions 1 and 2.
Carbon Deposition. Reagents gases such as oxygen, hydro-gen, nitrogen, or air are usually added to the helium plasma inorder to prevent or reduce carbon deposition inside a plasma-based detector.17,18 In this work, we studied whether there wassignificant carbon deposition inside the detector following organicvapor introduction. Helium gas saturated with DMSO vapor wascontinuously delivered to the detector for more than 30 min. Weobserved very little carbon deposition inside the detector. Severalfactors can account for low carbon deposition in the newlydeveloped plasma detector. The plasma gas temperature is only∼320 K. At such a low temperature, it is difficult to produce carbonfrom organic vapors. Additionally, there is no optical windowenclosing the gas exit of the detector, causing a back-diffusion ofair into the detector, which reduces or eliminates carbon deposi-tion. Finally, the short residence time of the analyte in the detectormay also lessen carbon deposition.
Analytical Performance. The back-diffusion of air into thedetector generates no observable signal at 431.2 nm; therefore,the emission lines originating from the most common compoundsin air do not interfere with organic vapor detection. A molecularemission detector based on pulsed discharge helium plasmasource is well suited for trace organic vapor detection in air.
The reproducibility for organic vapor detection was studied.The CH emission was monitored at 431.2 nm following DMSOvapor injections into the helium plasma (Figure 7). The RSD forthe emission intensity of CH was calculated to be 4.5% (N ) 21).
The detection limit for DMSO in ppm (v/v) was calculatedfrom the emission intensity of 61.6 ppm DMSO as 2N/S usinghelium plasma,3 where N is the noise level of the plasma
(16) Sutton, D. G.; Westberg, K. R.; Melzer, J. E. Anal. Chem. 1979, 51, 1399-1401.
(17) McLean, W. R.; Stanton, D. L. Penketh, G. E. Analyst 1973, 98, 432-442.(18) Ebdon, L.; Hill, S.; Ward, R. W. Analyst 1986, 111, 1113-1138.
Figure 6. Typical emission spectra of various organic compoundsobtained with the pulsed helium plasma detector: He flow rate, 1.0L/min; sischarge frequency, 830 Hz; Tc, 1100 µs; Td, 100 µs; Epri,6.92 V; integration time, 500 ms; spectrum average number, 5.
Figure 7. Investigation of the stability of the pulsed helium plasmadetector for a 60 ppm DMSO: He flow rate, 0.5 L/min; integrationtime, 100 ms; discharge frequency, 830 Hz; Tc, 1100 µs; Td, 100 µs;Epri, 5.06 V.
CH + N2 f CN + NH (1)
NH + CH f CN + H2 (or 2H) (2)
2C + N2 f 2CN (3)
2C + 2NH f 2CN + H2 (or 2H) (4)
364 Analytical Chemistry, Vol. 73, No. 2, January 15, 2001

background at 431.2 nm and S is expressed as the emissionintensity at 431.2 nm per ppm of DMSO. A detection limit of 0.20ppm for DMSO could be achieved. This result is much better thanthat reported for methane (600 ppm) in a dc microplasma basedon the same CH band.3
CONCLUSIONSA molecular emission detector has been developed based on
a pulsed helium plasma source. The detector has an averageoperating power less than 0.2 W. Because of the low powerrequirement, the detector can be operated with two 1.5-V alkalinebatteries for more than 10 h. This low-power pulsed plasmadetector was evaluated for organic vapor detection. Organic vaporscan be detected by monitoring the CH emission at 431.2 nm.Typical emission bands of C and CN originating from organiccompounds are very weak for organic compounds that do notcontain nitrogen. The advantages of the pulsed plasma detector
include (1) low power consumption (<0.2 W), (2) good toleranceto organic vapors, (3) small size, (4) high sensitivity to organicvapors, and (5) field-portable and real-time detection capabilities.The detector is well suited for various applications that requirehigh sensitivity and low power consumption.
ACKNOWLEDGMENT
The authors thank Joshua Smith for technical editing of themanuscript. The authors gratefully acknowledge financial supportfrom the Department of Energy and the Los Alamos NationalLaboratory program offices.
Received for review June 14, 2000. Accepted October 19,2000.
AC000678X
Analytical Chemistry, Vol. 73, No. 2, January 15, 2001 365