a low-luminosity type-1 qso sample - arxiv · pdf filethe low-luminosity type-1 qso sample ......
TRANSCRIPT

Astronomy & Astrophysics manuscript no. llqso5 c©ESO 2018April 17, 2018
A low-luminosity type-1 QSO sample
V. Overluminous host spheroids and their excitation mechanisms?
Gerold Busch1, Nastaran Fazeli1, Andreas Eckart1, 2, Mónica Valencia-S.1, Semir Smajic1, 2, Lydia Moser2, 1, JuliaScharwächter3, Jens Dierkes4, Sebastian Fischer5
1 I. Physikalisches Institut der Universität zu Köln, Zülpicher Str. 77, 50937 Köln, Germanye-mail: [email protected]
2 Max-Planck-Institut für Radioastronomie, Auf dem Hügel 69, 53121 Bonn, Germany3 LERMA, Observatoire de Paris, PSL, CNRS, Sorbonne Universités, UPMC, F-75014, Paris, France4 Niedersächsische Staats- und Universitätsbibliothek Göttingen, 37070 Göttingen, Germany5 Deutsches Zentrum für Luft- und Raumfahrt (DLR), Königswinterer Str. 522-524, 53227 Bonn, Germany
Accepted ???. Received ???; in original form ???
ABSTRACT
We present near-infrared (NIR) H + K-band longslit spectra of eleven galaxies which are obtained with SOFI at the NTT (ESO). Thegalaxies are chosen from the low-luminosity type-1 quasi-stellar object (LLQSO) sample which comprises the 99 closest (z ≤ 0.06)QSOs from the Hamburg/ESO survey for bright UV-excess QSOs. These objects are ideal targets to study the gap between localSeyfert galaxies and high-redshift quasars, since they show much stronger AGN activity compared to local objects but are still closeenough for a detailed structural analysis.We fit hydrogen recombination, molecular hydrogen, and [Fe ii] lines after carefully subtracting the continuum emission. From thebroad Paα components, we estimate black hole masses and enlarge the sample of LLQSOs that show a deviation from the MBH−Lbulgerelations of inactive galaxies from 12 to 16 objects.All objects show emission from hot dust (T ∼ 1200 K) as well as stellar contribution. However, the particular fractions vary a lotbetween the objects. More than half of the objects show H2 emission lines that are indicating a large reservoir of molecular gas whichis needed to feed the AGN and star formation. In the NIR diagnostic diagram all objects lie in the location of AGN dominatedobjects. However, most of the objects show indications of star formation activity, suggesting that their offset location with respect toMBH − Lbulge relations of inactive galaxies may be a consequence of overluminous bulges.
Key words. galaxies: active — galaxies: starburst — galaxies: nuclei — galaxies: Seyfert — infrared: galaxies.
1. Introduction
Numerous studies have shown that the mass of the supermassiveblack hole (BH), which is believed to be hosted in the center ofevery galaxy, correlates well with several properties of the hostgalaxy or at least its central spheroidal component (e.g., Kor-mendy & Richstone 1995; Magorrian et al. 1998; Gebhardt et al.2000; Ferrarese & Merritt 2000; Marconi & Hunt 2003; Häring& Rix 2004; Graham & Driver 2007; Graham 2012; Kormendy& Ho 2013; Savorgnan et al. 2013; Läsker et al. 2014). The roleof active galactic nuclei (AGN) in this context is still unclear.
AGN feedback has been suggested as a possible regulatingmechanism between BHs and their host galaxies, which couldcontribute to the formation of the local scaling relations throughthe quenching of star formation. Studies that help to understandthe interplay of star formation, black hole accretion and outflowsin AGN host galaxies are therefore of high importance. Overthe last years, several studies using integral-field spectroscopy(IFS) in the near-infrared (NIR) have shown that many activegalaxies show recent or on-going star formation in the centralkiloparsec (e.g. Böker et al. 2008; Riffel et al. 2009b; Bedregalet al. 2009; Valencia-S. et al. 2012a; Falcón-Barroso et al. 2014;Busch et al. 2015; Smajic et al. 2015). Also, IFS has allowed
? Based on observations with ESO-NTT, proposal no. 83.B-0739
to spatially resolve inflows and outflows in many galaxies (e.g.Riffel et al. 2008; Storchi-Bergmann et al. 2010; Müller-Sánchezet al. 2011; Davies et al. 2014; Riffel et al. 2015; Diniz et al.2015).
From a sample of ∼ 10 galaxies, the AGNIFS team (Storchi-Bergmann, Riffel, and collaborators) find that the molecular gasis mostly situated in a disk-like structure and often shows in-flow patterns (“feeding”) while the ionized gas is often moreperturbed and more affected by outflows from the AGN (“feed-back”).
It is still under debate whether outflows have positive or neg-ative influence on star formation. Most probable is that outflowscan be responsible for both: initiating and quenching star for-mation (e.g. Nesvadba et al. 2010; Maiolino et al. 2012; Silk2013; Rashed et al. 2013; Cresci et al. 2015a,b, and referencestherein). Furthermore, it has been shown that the presence of apowerful AGN can significantly boost the outflow rate (Ciconeet al. 2014).
Most of these studies are based on nearby Seyfert galaxies orlow-luminosity AGN (redshift z . 0.01). However, these objectsmay not be representative of the higher-redshift AGN popula-tion, since the AGN power (and star formation rate) is expectedto increase with redshift. With today’s instrumentation, it is notpossible to resolve the centers of AGNs on sub-kpc scale at the
Article number, page 1 of 18
arX
iv:1
511.
0090
4v1
[as
tro-
ph.G
A]
3 N
ov 2
015

A&A proofs: manuscript no. llqso5
102 103
angular scale (pc/'')
1041
1042
1043
1044
1045
bol. lum
inosi
ty (
erg
/s)
LLQSO
Mueller-S+13
NUGA
AGNIFS
10-5 10-4 10-3 10-2 10-1 100 101
Eddington ratio
0
5
10
15
20
25
30
35LLQSO
Mueller-S+13
NUGA
AGNIFS
Fig. 1. Left: Bolometric luminosity as a function of the linear scalepc/arcsec. Right: Histogram of the Eddington ratios of the LLQSO sam-ple in comparison to the recent study of Müller-Sánchez et al. (2013),the NUGA sample (García-Burillo et al. 2003), and the work of the AG-NIFS group (Storchi-Bergmann, Riffel, et al.).
peak of AGN and star formation activity (z ∼ 2; e.g., Aird et al.2015).
The low-luminosity type-1 QSO sample (LLQSO sample),was selected in order to fill the gap between the local Seyfertpopulation and more powerful QSOs at higher cosmological dis-tances. It is a subsample of the Hamburg/ESO survey (HES;Wisotzki et al. 2000) and contains only the closest 99 objectswith z ≤ 0.06 which are still close enough to achieve a sub-kpcspatial resolution.
The bolometric luminosity of LLQSOs is systematicallyhigher by at least a magnitude compared to other AGN samplesat lower redshift which compensates the lower physical resolu-tion due to the higher redshift. Furthermore, the Eddington ratiowhich traces the BH accretion rate, is higher by up to severalmagnitudes (Fig. 1). Therefore, the impact of the AGN on thesurrounding interstellar medium (“feedback”) is expected to bemuch stronger than in local low-luminosity AGN. This makesLLQSOs the ideal targets to study the interplay between the cen-tral engine and the host galaxy (Moser et al. 2012). A moredetailed description about the sample can be found in the pre-vious near-infrared imaging study (Busch et al. 2014). Severalsources have already been observed in molecular gas (Bertramet al. 2007), H i (König et al. 2009), and H2O-maser emission(König et al. 2012). A previous NIR spectroscopy study wasdone by Fischer et al. (2006), while single objects from the sam-ple have been studied in Krips et al. (2007), Scharwächter et al.(2011), Busch et al. (2015), and Moser et al. (in press). A largefraction of the LLQSOs are included in the new Close AGN Ref-erence Survey (CARS, B. Husemann in prep., http://www.cars-survey.org/).
In this paper, we present and analyse NIR spectroscopic ob-servations of eleven sources from the LLQSO sample, for whichimaging data were discussed in Busch et al. (2014). LLQSOswere found to lie below the MBH − Lbulge relations of inactivegalaxies, as a possible consequence of enhanced star formation(overluminous bulges) or undermassive BHs (deviations of ac-tive galaxies from the MBH − Lbulge relations have been foundin the optical by Nelson et al. 2004; Kim et al. 2008; Bennertet al. 2011; Urrutia et al. 2012). Recent NIR integral-field spec-troscopy of the LLQSO HE 1029–1831 shows that, at least inthis particular case, the deviation is caused by an overluminosityof the bulge due to young stellar populations (Busch et al. 2015).
Near-infrared spectroscopy is a useful tool to assess extinc-tion, the dominating stellar populations, excitation mechanisms,and the contributions of stellar and non-stellar components tothe emission of the galaxy (e.g. Zuther et al. 2007; Smajic et al.2012; Valencia-S. et al. 2012a; Smajic et al. 2014; Busch et al.2015, Fazeli et al., in prep.). The NIR H + K-band contains sev-
eral diagnostic lines: Hydrogen recombination lines (Paα andBrγ) can be excited by the AGN (in the broad and narrow lineregion) but are also tracers of young star formation. Shockscan be traced by molecular hydrogen (H2) rotational-vibrationallines and the forbidden [Fe ii] line. Stellar CO absorption bands(12CO(6-3) in the H-band and 12CO(2-0) in the K-band) giveconstraints on the stellar population, while the forbidden [Si vi]line is a clear AGN tracer (e.g. Riffel et al. 2006; Mason et al.2015).
Molecular hydrogen H2 emission is either of thermal or non-thermal origin. The main thermal excitation mechanisms are:shocks, UV radiation in dense clouds, or X-rays (e.g., Brandet al. 1989; Sternberg & Dalgarno 1989; Draine & Woods 1990)while UV-pumping (Black & van Dishoeck 1987) is a possi-ble non-thermal excitation mechanism. The H2 line ratio 2-1S(1)/1-0 S(1) can be used to distinguish between thermal andnon-thermal excitation, while the [Fe ii]/Brγ ratio can be used toestimate the importance of X-ray excitation (e.g. Colina 1993;Alonso-Herrero et al. 1997; Reunanen et al. 2002, 2003).
A number of studies have focussed on developing a diag-nostic diagram in the NIR (comparable to the BPT-diagramin the optical) that distinguishes between excitation from starformation, AGN, and shocks. For this, line ratios betweenshock tracers (H2 or [Fe ii]) and star formation tracers (Paα,Paβ, Brγ) are used (e.g., Larkin et al. 1998; Rodríguez-Ardilaet al. 2004, 2005; Riffel et al. 2013). Using integral-field spec-troscopy, Colina et al. (2015) could spatially separate line emit-ting regions with different ionization mechanisms (AGN/youngstars/supernova dominated) and show that they occupy differentregions in the log([Fe ii/Brγ) − log(H2/Brγ) diagram. The ob-served line ratios could be well reproduced with photoionizationmodels by Dors et al. (2012). Furthermore, they find that X-rayemission from the AGN can be considered as most importantexcitation mechanisms of these lines.
Here, we use H + K longslit spectra to study extinction, starformation activity, and black-hole masses via NIR diagnosticlines in a sample of 11 LLQSOs. This paper is structured as fol-lows: In Sect. 2, we describe the observations as well as the datareduction and calibration. In Sect. 3.1, we explain our contin-uum subtraction, followed by a description of the emission linefits which are based on the continuum subtracted spectra fromSect. 3.1. Excitation mechanism are discussed in Sect. 4.1. InSect. 4.2 we estimate black hole masses and discuss the posi-tions of the galaxies in the black hole mass - bulge luminosityrelation. In Sect. 4.3 we discuss the far-infrared (FIR) propertiesand finally draw conclusions in Sect. 5. Individual objects arediscussed in the Appendix.
2. Observation, reduction, and calibration
Eleven galaxies from the low-luminosity type-1 QSO samplehave been observed in seeing limited mode with the Son ofISAAC (SofI) infrared spectrograph and imaging camera on theNew Technology Telescope (NTT, ESO, Chile) during Septem-ber 2009. The 1024 × 1024 Hawaii HgCdTe array provides apixel scale of 0.288′′/pixel with a field-of-view of 4.9 × 4.9arcmin2. NIR imaging data are presented in Busch et al. (2014).The data analysed in this work consist of H + K-band low reso-lution longslit spectroscopy with a slit width of 1′′, resulting ina spectral resolution of about R = λ/∆λ = 600.
For host galaxies showing prominent structures like bars, theslit was preferably aligned along those structures. In some cases,the slit position was chosen to include neighbouring objects. Thepositions of the slit superimposed on the H-band images from
Article number, page 2 of 18

Gerold Busch et al.: LLQSO sample: V. NIR spectroscopy
Table 1. Source information: Coordinates, morphological classification, redshift, and observation parameters.
source RA (J2000) DEC (J2000) classification redshift tint [s] seeing [′′] PA slit [◦] tell./calibr. star05 HE0036–5133 00h39m15.8s -51d17m01s E 0.0288 7200 0.9 56 HD 183908 HE0045–2145 00h47m41.2s -21d29m28s SB 0.0214 7200 1.5 25 HD 22469311 HE0103–5842 01h05m16.7s -58d26m14s Irr 0.0257 7200 1.4 112 HD 1447416 HE0119–0118 01h21m59.8s -01d02m24s SB 0.0547 7200 1.2 65 HD 1576031 HE0323–4204 03h25m02.2s -41d54m18s S 0.0580 8400 1.7 136 HD 183980 HE2112–5926 21h15m51.5s -59d13m54s E 0.0317 7200 1.6 0 HD 20955281 HE2128–0221 21h30m49.9s -02d08m15s E 0.0528 7200 1.3 0 HD 19827382 HE2129–3356 21h32m02.2s -33d42m54s E 0.0293 7200 1.5 10 HD 19761283 HE2204–3249 22h07m44.7s -32d34m56s E 0.0594 6300 1.0 110 HD 19761284 HE2211–3903 22h14m42.0s -38d48m23s SB 0.0398 7200 1.0 44 HD 22125085 HE2221–0221 22h23m49.5s -02d06m13s E 0.0570 7200 1.3 62 HD 198273
Notes. The source designation consists of the ID from our LLQSO sample and the name from the Hamburg/ESO survey (HE survey; Wisotzkiet al. 2000). Morphological classification is taken from Busch et al. (2012). The redshift is taken from the HE survey. The position angles aremeasured counter-clockwise from North to East.
10''
Gal 05
30''
Gal 08
20''
Gal 11
40''
Gal 16
30''
Gal 31
30''
Gal 80
20''
Gal 81
30''
Gal 82
10''
Gal 83
30''
Gal 84
10''
Gal 85
Fig. 2. SofI H-band images of the eleven analysed galaxies with slitposition indicated. The slit width is 1′′. North is up, East is left.
Busch et al. (2014) are shown in Fig. 2. Integration times, seeingconditions, and the position angles of the slit are presented inTable 1. The integration time was typically two hours and theseeing ranged from 0′′.9 to 1′′.7.
The spectra were taken with a nodding technique. Sky-subtraction was done by subtracting consecutive frames fromeach other. Flat-fielding, and the correction for tilt and curvaturewere done by Iraf/Pyraf standard procedures. Subsequently, theframes were shifted on top of each other and a median frame wascalculated.
Telluric correction was performed with G2V-stars whichwere observed before and after the science objects at similar
airmass (Table 1). The G2V class was chosen since they havethe same spectral type as the Sun whose spectral lines are wellknown. For the telluric correction, the science spectra were di-vided by the telluric spectra (taking into account the differentexposure times) and then multiplied by a solar reference spec-trum (Maiolino et al. 1996) in order to correct for the black bodyshape and lines inserted by the telluric spectrum. We shifted thespectra manually on subpixel-scale to match the absorption fea-tures and optimise the telluric correction. Since the solar ref-erence spectrum was only available in the H- and K-band, weinterpolated the region in between with a black body functionwith temperature T = 5800 K. This means in the bandgap, wecannot correct for absorption lines of the G2V-type spectrum.Therefore, our telluric correction leaves residuals, especially inthe bandgap between H- and K-band as well as in the region be-tween 1.8 − 2 µm which has particularly low transmission. Linedetections and measurements in this region have therefore tobe taken with caution (however, the Paα-line that is located inthe bandgap is quite strong and therefore well detected in mostgalaxies).
Wavelength calibration was done using the lines of a Xenonlamp observed every night. Flux calibration was done by scalingthe solar reference spectrum to the 2MASS flux (Skrutskie et al.2006) of the telluric star. In three nights, two or three standardstars were observed during the same night. In order to estimatethe reliability of the flux calibration, we calibrated the standardstars with each other. The resulting calibrations varied by a factorof 10%−35% likely caused by seeing variations during the night(for a discussion of slit-loss corrections see Rashed et al. 2015).
3. Analysis and results
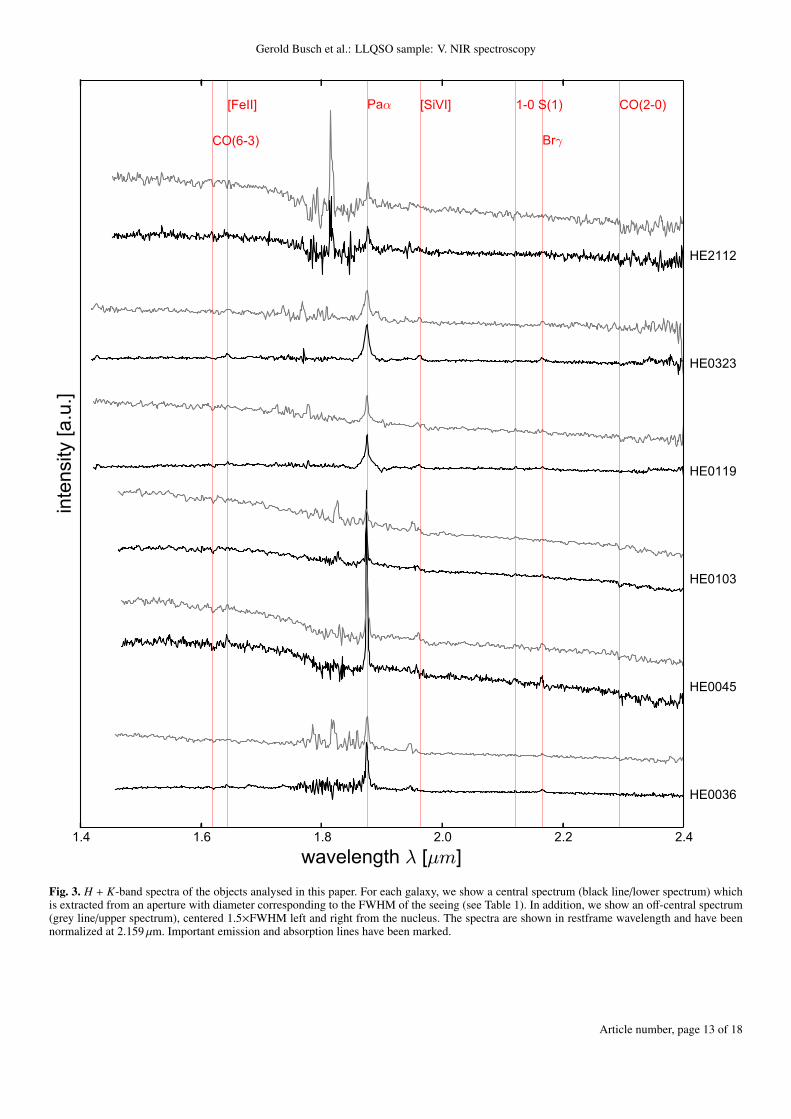
In Figure 3, we compare the central spectra which are extractedfrom an aperture with a diameter corresponding to the seeingFWHM (see Table 1) to off-nuclear spectra which are extractedusing the same aperture size for regions centred at 1.5×FWHMleft and right from the nucleus.
As expected, the continuum shapes of the off-nuclear spec-tra are bluer than those of the nuclear spectra which are muchmore affected by the hot dust emission from the obscuring torus.However, the difference in continuum shape between the elevengalaxies is much higher than the difference in continuum shapebetween different apertures. This hints at different excitationmechanisms and/or different impact of the central AGN emissionon the galaxies’ spectra that will be analysed in the following.
Article number, page 3 of 18

A&A proofs: manuscript no. llqso5
3.1. Continuum subtraction
The continuum emission of active galaxies is usually fitted bya multicomponent model, consisting of (1) an underlying powerlaw, (2) thermal emission from hot dust, and (3) star light fromthe host galaxy. As pointed out in Barvainis (1987), the promi-nent bump in the NIR (peaking in the K-band at ∼ 2 µm) canbe produced by hot dust close to its sublimation temperature(T ∼ 1500 K) that is predicted from the Unified Model (An-tonucci 1993; Urry & Padovani 1995). The power law emissionis believed to originate from the accretion disk (e.g. Malkan &Sargent 1982; Malkan 1983). While it is prominent in the opti-cal/UV, it becomes negligible in the NIR for Seyfert-2s (RamosAlmeida et al. 2009). However, in type-1 sources there mightstill be a significant contribution (e.g. Riffel et al. 2009a; Landtet al. 2011). Glikman et al. (2006) construct a spectral templatefor quasars from observations of 27 sources. In this template, thecontinuum emission in the NIR is best fitted by a combination ofa power law ( fν ∝ να with power-law index α = −0.92) and ablack body with temperature T = 1260 K.
In the following, we fit the continuum shape, using themethod described in Smajic et al. (2012). The continuum sub-tracted spectra are then used for emission line fits. Further-more, the different fractions of the fitted functions give indica-tion which processes contribute to the emission of the galaxies.
In the continuum fit, we include three components: hot dust,star light and a power law. Additionally, we consider extinction(Cardelli et al. 1989)
τ(λ, AV ) = −AV
1.086
[0.574λ1.61 −
0.527λ1.61RV
](1)
with the standard value RV = 3.1 and λ in µm. The hot dustcontribution is modelled as black body radiation with the Planckfunction
BB(sdust, λ,T ) = sdust2hc2
λ5
1
exp(
hcλkT
)− 1
(2)
with a scale factor sdust. The contribution of the accretion disk ismodelled by a power law
PL(sAGN, λ, α) = sAGN λ−α−2 (3)
with the power-law index α and the scale factor sAGN. We fixedthe power law index to the value from the quasar template ofGlikman et al. (2006) (α = −0.92). To account for the stellarcontribution, we used stellar templates from the NASA InfraredTelescope Facility (IRTF) spectral library for cool stars (Rayneret al. 2009). The library offers spectra of 210 cool stars (mainlyF, G, K, M spectral type) at an resolving power of R ≈ 2000.The spectra are not normalized, i.e. the shape of the continuumis preserved.
The spectra had to be convolved with a Gaussian functionin order to account for the lower resolution of our spectra andintrinsic effects such as broadening due to velocity dispersion orDoppler displacement:
Star(sstar, σ,∆λ) = Spec ∗1
σ√
2πexp
(−
(λ − ∆λ)2
2σ2
)(4)
In total, we use the following function and fit it to the spectrausing a python implementation of the amoeba-routine (downhillsimplex method, Press et al. 1992):
Cont(AV , sdust,T, sAGN, α, sstar, σ,∆λ) = exp (τ(λ, AV ))×[BB(sdust, λ,T ) + PL(sAGN, λ, α) + Star(sstar, σ,∆λ)] (5)
1.5 1.6 1.7 1.8 1.9 2.0 2.1 2.2 2.3 2.4wavelength λ [µm]
1
0
1
2
3
4
5
6
7
8
flux d
ensi
ty [
10−
15 W
m−
2 µ
m−
1]
datadustAGNM-starmodelresiduum
Fig. 4. Continuum fit. HE0103–5842 is shown as an example.
The function has six fitting parameters: visual extinction AV ,temperature of the dust T , width σ and displacement ∆λ of theGaussian function used to convolve the stellar templates, and thescale factors sdust, sAGN and sstar of the dust, power law, and stel-lar continuum.
One example of a continuum fit is displayed in Fig. 4. Table2 shows the results of our continuum fits, i.e. the relative contri-butions of the contributing functions, as well as extinction, anddust temperature. The fits give a first estimation of the contribut-ing components and moreover, they are used for continuum sub-traction before fitting the emission lines. We point out that the fitmight not always have a numerically unique solution since dustemission (T ≈ 1200 K) and strong extinction will both producea red shape, while stellar emission and power law will both pro-duce a blue spectrum. As pointed out by e.g. Cid Fernandes et al.(2004) and Riffel et al. (2009a) young reddened starbursts are notdistinguishable from a power law. Generally, for a more detailedanalysis of the stellar content, a larger set of stellar populations isnecessary. Using only one star as template often results in lowervalues for the stellar velocity dispersion (see e.g. Riffel et al.2008; Valencia-S. et al. 2012a). However, stellar kinematics orstellar population synthesis is not the goal of this work. The onlyaim is to subtract the continuum emission and get first estimateson the contributions of the different components. Our methodsserves this purpose despite the mentioned limitations and degen-eracies.
In all galaxies (with exception HE0045-2145, see discus-sion below), we fitted a black body function with temperatures1000 K ≤ Tdust ≤ 1400 K that are typical for Seyfert-1 galax-ies (Riffel et al. 2009a, 2010; Landt et al. 2011, and referencestherein). In some galaxies, also a power-law component was fit-ted. All spectra show stellar components which contribute from30% up to almost 90%. This shows the diversity of objects interms of dominance of the nuclear component in the LLQSOsample. We point out that the resulting stellar fractions are con-sistent with the AGN/host fractions derived from the decompo-sition of the NIR imaging data (Busch et al. 2014) and with theamount of dilution in the CO band heads (see e.g. Davies et al.2007; Riffel et al. 2009a) observed in the K-band spectra (i.e.galaxies with dominant stellar component show prominent COband heads, while the band heads are completely diluted by theunderlying black body and/or power law in galaxies which aredominated by the AGN).
Article number, page 4 of 18
Gerold Busch et al.: LLQSO sample: V. NIR spectroscopy
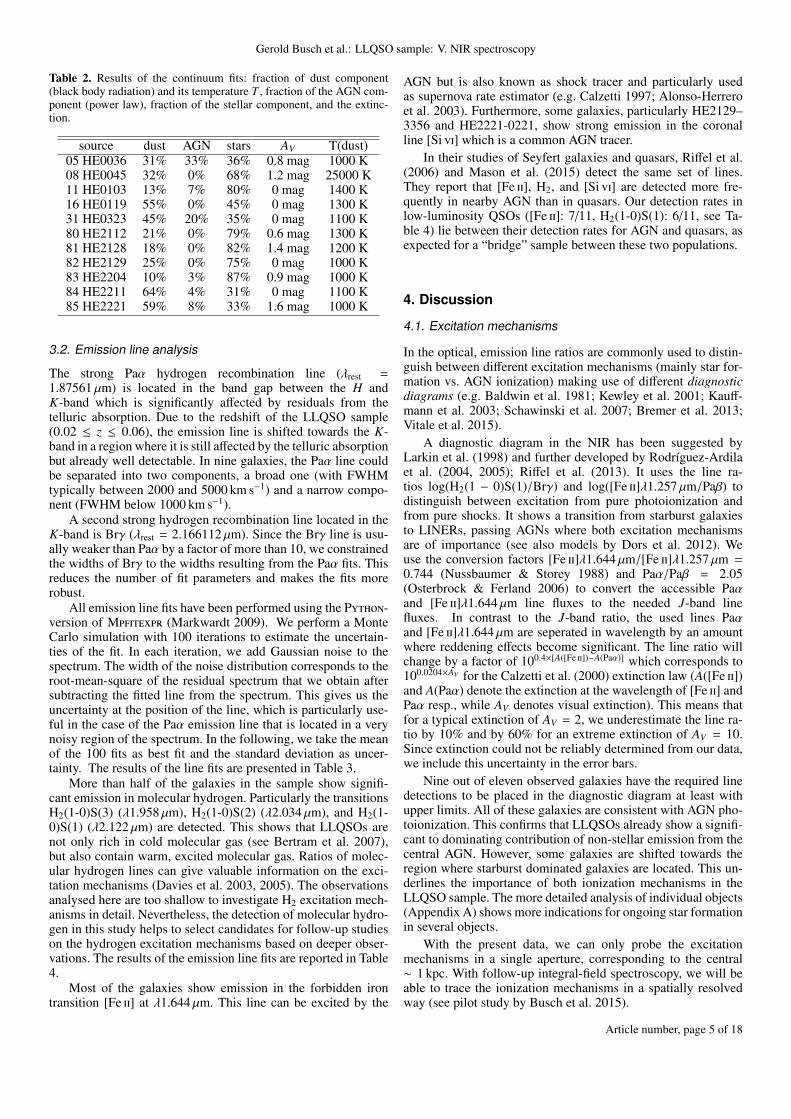
Table 2. Results of the continuum fits: fraction of dust component(black body radiation) and its temperature T , fraction of the AGN com-ponent (power law), fraction of the stellar component, and the extinc-tion.
source dust AGN stars AV T(dust)05 HE0036 31% 33% 36% 0.8 mag 1000 K08 HE0045 32% 0% 68% 1.2 mag 25000 K11 HE0103 13% 7% 80% 0 mag 1400 K16 HE0119 55% 0% 45% 0 mag 1300 K31 HE0323 45% 20% 35% 0 mag 1100 K80 HE2112 21% 0% 79% 0.6 mag 1300 K81 HE2128 18% 0% 82% 1.4 mag 1200 K82 HE2129 25% 0% 75% 0 mag 1000 K83 HE2204 10% 3% 87% 0.9 mag 1000 K84 HE2211 64% 4% 31% 0 mag 1100 K85 HE2221 59% 8% 33% 1.6 mag 1000 K
3.2. Emission line analysis
The strong Paα hydrogen recombination line (λrest =1.87561 µm) is located in the band gap between the H andK-band which is significantly affected by residuals from thetelluric absorption. Due to the redshift of the LLQSO sample(0.02 ≤ z ≤ 0.06), the emission line is shifted towards the K-band in a region where it is still affected by the telluric absorptionbut already well detectable. In nine galaxies, the Paα line couldbe separated into two components, a broad one (with FWHMtypically between 2000 and 5000 km s−1) and a narrow compo-nent (FWHM below 1000 km s−1).
A second strong hydrogen recombination line located in theK-band is Brγ (λrest = 2.166112 µm). Since the Brγ line is usu-ally weaker than Paα by a factor of more than 10, we constrainedthe widths of Brγ to the widths resulting from the Paα fits. Thisreduces the number of fit parameters and makes the fits morerobust.
All emission line fits have been performed using the Python-version of Mpfitexpr (Markwardt 2009). We perform a MonteCarlo simulation with 100 iterations to estimate the uncertain-ties of the fit. In each iteration, we add Gaussian noise to thespectrum. The width of the noise distribution corresponds to theroot-mean-square of the residual spectrum that we obtain aftersubtracting the fitted line from the spectrum. This gives us theuncertainty at the position of the line, which is particularly use-ful in the case of the Paα emission line that is located in a verynoisy region of the spectrum. In the following, we take the meanof the 100 fits as best fit and the standard deviation as uncer-tainty. The results of the line fits are presented in Table 3.
More than half of the galaxies in the sample show signifi-cant emission in molecular hydrogen. Particularly the transitionsH2(1-0)S(3) (λ1.958 µm), H2(1-0)S(2) (λ2.034 µm), and H2(1-0)S(1) (λ2.122 µm) are detected. This shows that LLQSOs arenot only rich in cold molecular gas (see Bertram et al. 2007),but also contain warm, excited molecular gas. Ratios of molec-ular hydrogen lines can give valuable information on the exci-tation mechanisms (Davies et al. 2003, 2005). The observationsanalysed here are too shallow to investigate H2 excitation mech-anisms in detail. Nevertheless, the detection of molecular hydro-gen in this study helps to select candidates for follow-up studieson the hydrogen excitation mechanisms based on deeper obser-vations. The results of the emission line fits are reported in Table4.
Most of the galaxies show emission in the forbidden irontransition [Fe ii] at λ1.644 µm. This line can be excited by the
AGN but is also known as shock tracer and particularly usedas supernova rate estimator (e.g. Calzetti 1997; Alonso-Herreroet al. 2003). Furthermore, some galaxies, particularly HE2129–3356 and HE2221-0221, show strong emission in the coronalline [Si vi] which is a common AGN tracer.
In their studies of Seyfert galaxies and quasars, Riffel et al.(2006) and Mason et al. (2015) detect the same set of lines.They report that [Fe ii], H2, and [Si vi] are detected more fre-quently in nearby AGN than in quasars. Our detection rates inlow-luminosity QSOs ([Fe ii]: 7/11, H2(1-0)S(1): 6/11, see Ta-ble 4) lie between their detection rates for AGN and quasars, asexpected for a “bridge” sample between these two populations.
4. Discussion
4.1. Excitation mechanisms
In the optical, emission line ratios are commonly used to distin-guish between different excitation mechanisms (mainly star for-mation vs. AGN ionization) making use of different diagnosticdiagrams (e.g. Baldwin et al. 1981; Kewley et al. 2001; Kauff-mann et al. 2003; Schawinski et al. 2007; Bremer et al. 2013;Vitale et al. 2015).
A diagnostic diagram in the NIR has been suggested byLarkin et al. (1998) and further developed by Rodríguez-Ardilaet al. (2004, 2005); Riffel et al. (2013). It uses the line ra-tios log(H2(1 − 0)S(1)/Brγ) and log([Fe ii]λ1.257 µm/Paβ) todistinguish between excitation from pure photoionization andfrom pure shocks. It shows a transition from starburst galaxiesto LINERs, passing AGNs where both excitation mechanismsare of importance (see also models by Dors et al. 2012). Weuse the conversion factors [Fe ii]λ1.644 µm/[Fe ii]λ1.257 µm =0.744 (Nussbaumer & Storey 1988) and Paα/Paβ = 2.05(Osterbrock & Ferland 2006) to convert the accessible Paαand [Fe ii]λ1.644 µm line fluxes to the needed J-band linefluxes. In contrast to the J-band ratio, the used lines Paαand [Fe ii]λ1.644 µm are seperated in wavelength by an amountwhere reddening effects become significant. The line ratio willchange by a factor of 100.4×[A([Fe ii])−A(Paα)] which corresponds to100.0204×AV for the Calzetti et al. (2000) extinction law (A([Fe ii])and A(Paα) denote the extinction at the wavelength of [Fe ii] andPaα resp., while AV denotes visual extinction). This means thatfor a typical extinction of AV = 2, we underestimate the line ra-tio by 10% and by 60% for an extreme extinction of AV = 10.Since extinction could not be reliably determined from our data,we include this uncertainty in the error bars.
Nine out of eleven observed galaxies have the required linedetections to be placed in the diagnostic diagram at least withupper limits. All of these galaxies are consistent with AGN pho-toionization. This confirms that LLQSOs already show a signifi-cant to dominating contribution of non-stellar emission from thecentral AGN. However, some galaxies are shifted towards theregion where starburst dominated galaxies are located. This un-derlines the importance of both ionization mechanisms in theLLQSO sample. The more detailed analysis of individual objects(Appendix A) shows more indications for ongoing star formationin several objects.
With the present data, we can only probe the excitationmechanisms in a single aperture, corresponding to the central∼ 1 kpc. With follow-up integral-field spectroscopy, we will beable to trace the ionization mechanisms in a spatially resolvedway (see pilot study by Busch et al. 2015).
Article number, page 5 of 18
A&A proofs: manuscript no. llqso5
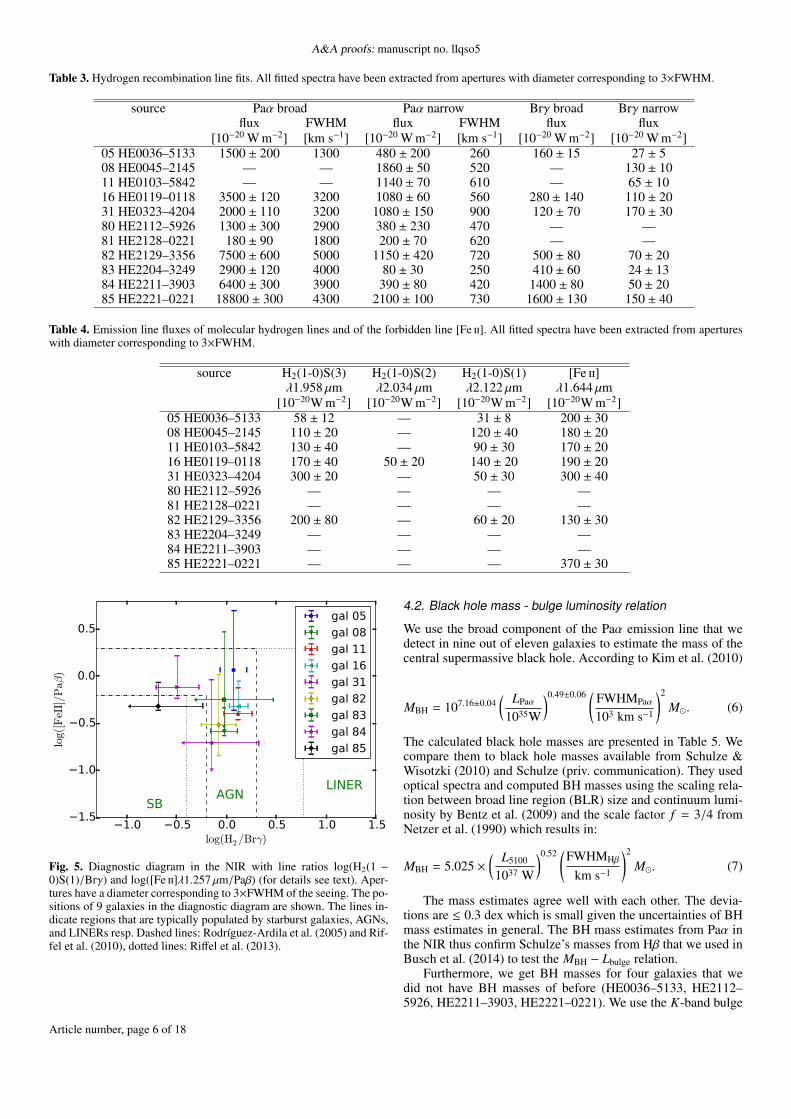
Table 3. Hydrogen recombination line fits. All fitted spectra have been extracted from apertures with diameter corresponding to 3×FWHM.
source Paα broad Paα narrow Brγ broad Brγ narrowflux FWHM flux FWHM flux flux
[10−20 W m−2] [km s−1] [10−20 W m−2] [km s−1] [10−20 W m−2] [10−20 W m−2]05 HE0036–5133 1500 ± 200 1300 480 ± 200 260 160 ± 15 27 ± 508 HE0045–2145 — — 1860 ± 50 520 — 130 ± 1011 HE0103–5842 — — 1140 ± 70 610 — 65 ± 1016 HE0119–0118 3500 ± 120 3200 1080 ± 60 560 280 ± 140 110 ± 2031 HE0323–4204 2000 ± 110 3200 1080 ± 150 900 120 ± 70 170 ± 3080 HE2112–5926 1300 ± 300 2900 380 ± 230 470 — —81 HE2128–0221 180 ± 90 1800 200 ± 70 620 — —82 HE2129–3356 7500 ± 600 5000 1150 ± 420 720 500 ± 80 70 ± 2083 HE2204–3249 2900 ± 120 4000 80 ± 30 250 410 ± 60 24 ± 1384 HE2211–3903 6400 ± 300 3900 390 ± 80 420 1400 ± 80 50 ± 2085 HE2221–0221 18800 ± 300 4300 2100 ± 100 730 1600 ± 130 150 ± 40
Table 4. Emission line fluxes of molecular hydrogen lines and of the forbidden line [Fe ii]. All fitted spectra have been extracted from apertureswith diameter corresponding to 3×FWHM.
source H2(1-0)S(3) H2(1-0)S(2) H2(1-0)S(1) [Fe ii]λ1.958 µm λ2.034 µm λ2.122 µm λ1.644 µm
[10−20W m−2] [10−20W m−2] [10−20W m−2] [10−20W m−2]05 HE0036–5133 58 ± 12 — 31 ± 8 200 ± 3008 HE0045–2145 110 ± 20 — 120 ± 40 180 ± 2011 HE0103–5842 130 ± 40 — 90 ± 30 170 ± 2016 HE0119–0118 170 ± 40 50 ± 20 140 ± 20 190 ± 2031 HE0323–4204 300 ± 20 — 50 ± 30 300 ± 4080 HE2112–5926 — — — —81 HE2128–0221 — — — —82 HE2129–3356 200 ± 80 — 60 ± 20 130 ± 3083 HE2204–3249 — — — —84 HE2211–3903 — — — —85 HE2221–0221 — — — 370 ± 30
1.0 0.5 0.0 0.5 1.0 1.5log(H2/Brγ)
1.5
1.0
0.5
0.0
0.5
log(
[FeI
I]/P
aβ)
SBAGN
LINER
gal 05
gal 08
gal 11
gal 16
gal 31
gal 82
gal 83
gal 84
gal 85
Fig. 5. Diagnostic diagram in the NIR with line ratios log(H2(1 −0)S(1)/Brγ) and log([Fe ii]λ1.257 µm/Paβ) (for details see text). Aper-tures have a diameter corresponding to 3×FWHM of the seeing. The po-sitions of 9 galaxies in the diagnostic diagram are shown. The lines in-dicate regions that are typically populated by starburst galaxies, AGNs,and LINERs resp. Dashed lines: Rodríguez-Ardila et al. (2005) and Rif-fel et al. (2010), dotted lines: Riffel et al. (2013).
4.2. Black hole mass - bulge luminosity relation
We use the broad component of the Paα emission line that wedetect in nine out of eleven galaxies to estimate the mass of thecentral supermassive black hole. According to Kim et al. (2010)
MBH = 107.16±0.04( LPaα
1035W
)0.49±0.06 (FWHMPaα
103 km s−1
)2
M�. (6)
The calculated black hole masses are presented in Table 5. Wecompare them to black hole masses available from Schulze &Wisotzki (2010) and Schulze (priv. communication). They usedoptical spectra and computed BH masses using the scaling rela-tion between broad line region (BLR) size and continuum lumi-nosity by Bentz et al. (2009) and the scale factor f = 3/4 fromNetzer et al. (1990) which results in:
MBH = 5.025 ×( L5100
1037 W
)0.52 (FWHMHβ
km s−1
)2
M�. (7)
The mass estimates agree well with each other. The devia-tions are ≤ 0.3 dex which is small given the uncertainties of BHmass estimates in general. The BH mass estimates from Paα inthe NIR thus confirm Schulze’s masses from Hβ that we used inBusch et al. (2014) to test the MBH − Lbulge relation.
Furthermore, we get BH masses for four galaxies that wedid not have BH masses of before (HE0036–5133, HE2112–5926, HE2211–3903, HE2221–0221). We use the K-band bulge
Article number, page 6 of 18

Gerold Busch et al.: LLQSO sample: V. NIR spectroscopy
magnitudes derived in Busch et al. (2014) to plot them in theMBH − Lbulge diagram (Fig. 6). The new data points confirm theresults found in the previous studies (Busch et al. 2014, 2015).With the new data we enlarged the sample from 12 to 16 LLQ-SOs that systematically lie below published MBH − Lbulge rela-tions of inactive galaxies which makes the findings even morerobust.
Recently, specific growth rates of the BH and the stellar hosthave been used to explore the time evolution (or “flow patterns”)in the MBH − M∗ relation. AGN that are offset from the rela-tion mostly have evolutionary vectors which are anti-correlatedwith their positions. That means, that they are moving back to-wards the relation (Merloni et al. 2010; Sun et al. 2015). Asdiscussed in Busch et al. (2014), possible explanations for a de-viation of active galaxies from a near-linear MBH − Lbulge rela-tion are (a) bulges which contain young stellar populations (asopposed to the usual picture that bulges are mainly consisting ofold stars) and are therefore brighter at given mass, or (b) under-massive black holes that are in a growing phase. Both scenariosfit into a framework of bulge and black hole coevolution that isnot solely based on a “classical” merging of galaxies but includesinteraction of the black hole and the surrounding host galaxy viaAGN feeding and feedback. The offset of the LLQSOs in theBH - bulge relation might thus shed light on the sequence of starforming and BH fuelling/feedback phases which is an importantcomponent for understanding the BH - bulge coevolution.
According to the NIR diagnostic diagram (Sect. 4.1) theanalysed galaxies are dominated by the AGN. However, someobjects are shifted towards the location of star formation domi-nated sources. Furthermore, in the discussion of individual ob-jects (see Appendix) we point out that many objects show indi-cations for ongoing star formation. This could indicate overlu-minous bulges associated with lower mass-to-light ratios.
As pointed out in Bertram et al. (2007), LLQSOs are rich incold molecular gas. Here, we find more than half of our objectsto show molecular hydrogen emission in the near-infrared, whichindicates that part of the molecular gas content is also excited.Furthermore, several of the objects can be classified as (ultra-)luminous infrared galaxies ((U)LIRGs). While the presence ofmolecular gas and star formation are related (e.g. see the famousKennicutt-Schmidt law; Kennicutt 1998) and molecular gas istherefore a prerequisite for star formation, the role of moleculargas in the context of AGN fueling is not fully understood. Onthe one hand, Riffel et al. (2015, and references therein) showthat H2 is usually located in a disk in the plane of the galaxy andoften shows inflows to the center (is a tracer of AGN fueling). Onthe other hand, cold molecular gas can also be found in outflows(feedback; García-Burillo et al. 2014).
Recently, an alternative explanation for the offset in theMBH − Lbulge relation has been proposed (Graham 2012; Gra-ham & Scott 2013; Scott et al. 2013; Graham & Scott 2015).They suggest that the relation between BH mass and stellar mass(and luminosity) of the host spheroid is a “broken” relation, witha near-linear MBH − Mbulge,∗ relation only for high BH masses(MBH & 108 M�). Galaxies with lower BH masses are found tofollow a different, steeper relation which indicates that the blackhole is growing more rapidly than the surrounding spheroid. Gra-ham (2015) states that the LLQSOs presented in Busch et al.(2014) follow the relation of lower-mass galaxies. We see that alleleven galaxies (plus the five galaxies added since then) are sys-tematically shifted below the relation though. This indicates thatLLQSOs are also offset from the new relation. However, reliablemass-to-light ratios are indispensable to decide on the validity ofthe offset of active galaxies. As discussed above, a lower mass-
22 23 24 25 26MK,bulge
5.5
6.0
6.5
7.0
7.5
8.0
8.5
9.0
9.5
10.0
log(M
BH/M
¯)
05
80
81
82 8384
85
ellipticals
bulges
Marconi&Hunt 2003
Vika+ 2012
Graham+ 2013
Kormendy&Ho 2013
Busch+14
Busch+15
this work
Fig. 6. Correlation between black hole mass MBH and absolute K-band magnitude MK of the spheroidal component. Bulge magnitudesare from Busch et al. (2014). Black hole masses for the red points arefrom A. Schulze (data points already published in Busch et al. 2014).The green point is taken from Busch et al. (2015). Four data pointswith black hole masses derived from NIR spectroscopy in this work areadded in blue.
to-light ratio would be expected in the case of enhanced nuclearstar formation.
By using integral-field spectroscopy, Busch et al. (2015)show that in the case of HE 1029–1831 circumnuclear star for-mation shifts the LLQSO away from the MBH − Lbulge relation ofinactive galaxies. Only by using spatially resolved data at highestangular resolution (using-adaptive optics assisted integral-fieldspectroscopy with e.g. SINFONI at the Very Large Telescope)as done in the mentioned pilot study, central AGN emission andcircumnuclear star formation can be reliably disentangled.
4.3. Far-infrared properties
Seven galaxies are listed in the IRAS Faint Source Catalog(Moshir 1990). We present the fluxes measured at 12 µm, 25 µm,60 µm, and 100 µm in Table 6. From these, infrared luminosities
LIR(8 − 1000 µm)[W] = 4π(DL[Mpc]
)2× 1.72 × 1031
×(13.48 F12 µm + 5.16 F25 µm + 2.58 F60 µm + F100 µm
)(8)
and far-infrared luminosities
LFIR(40 − 500 µm)[W]
= 4π(DL[Mpc]
)2× 1.2 × 1031
(2.58 F60 µm + F100 µm
)(9)
can be calculated (Sanders & Mirabel 1996). With the calibra-tion of Panuzzo et al. (2003), we can further calculate FIR-starformation rates:
SFR(FIR)M� yr−1 =
LFIR
1.134 × 1036W. (10)
One has to keep in mind that the far-infrared (FIR) luminos-ity LFIR traces the star formation rate on 100 Myr-timescales andcan therefore not directly be compared to star formation ratesfrom the often used estimators Hα and Brγ that trace recent star
Article number, page 7 of 18

A&A proofs: manuscript no. llqso5
Table 5. BH mass estimates from the broad Paα line compared with A. Schulze’s BH mass estimates from Hα. Bolometric luminosities are derivedfrom ROSAT soft X-ray luminosities.
source log(LPaα[W] FWHMPaα log(MBH/M�) log(L5100[W]) FWHMHα log(MBH/M�) log(Lbol[W])[km s−1] [km s−1]
05 HE0036–5133 33.5 1300 6.6 — — — 38.1a
08 HE0045–2145 — — — 36.2 682 6.0 —11 HE0103–5842 — — — 36.2 1729 6.8 37.716 HE0119–0118 34.4 3200 7.9 36.8 4192 7.9 38.031 HE0323–4204 34.2 3200 7.8 36.8 3030 7.6 38.080 HE2112–5926 33.5 2900 7.4 — — — —81 HE2128–0221 33.1 1800 6.7 36.5 1485 7.0 37.782 HE2129–3356 34.2 5000 8.2 36.5 5197 7.9 38.583 HE2204–3249 34.4 4000 8.1 36.9 5770 8.2 38.784 HE2211–3903 34.4 3900 8.0 — — — 38.085 HE2221–0221 35.2 4300 8.5 — — — —
Notes. The bolometric luminosities are derived from the unabsorbed ROSAT fluxes (Mahony et al. 2010), using a bolometric correction factorof ∼ 50 (Hopkins et al. 2007). (a) HE0036 is an X-ray transient source (Grupe et al. 1995) and was at its peak luminosity during the ROSATobservations.
formation. Furthermore, the far-infrared luminosity LFIR, partic-ularly if measured in galaxy-wide apertures, can be heavily af-fected by AGN emission and should therefore rather be seen asan upper limit.
In an attempt to constrain the contribution of the AGN to theFIR luminosity, we place the galaxies in the FIR colour-colourdiagrams, taken from Kewley et al. (2000) (see Fig. 7). In these,the typical area of starburst galaxies is indicated by a dashedline. Furthermore, a reddening line is marked by a solid line.The mixing line corresponds to the mixture of a typical unred-dened Seyfert-1 spectrum with a “warm” starburst. Although thediagrams show an ambiguity between the mixing of AGN andstarburst and reddening, we can make the following statements:HE0045 is completely dominated by the starburst which is fullyconsistent with the findings discussed notes on the individualobject in the Appendix. All other galaxies have significant con-tributions from the AGN. For HE0103, HE0119, and HE2112,this contribution is less than 50% while it is higher than 50% forHE0323 and HE2211. HE2221 is completely dominated by theAGN which is consistent with the finding in the imaging study(Busch et al. 2014) where it is the galaxy with the highest AGNfraction in the sample of 20 galaxies.
5. Conclusions
In this paper, we analysed near-infrared H + K-band longslitspectra of eleven galaxies from the low-luminosity type-1 QSOsample. Low-resolution spectroscopy provides an insight intothe gas reservoirs and possible excitation mechanisms. Our mainresults are the following:
1. All galaxies show the hydrogen recombination line Paα andmost galaxies also Brγ. In nine out of eleven galaxies, we de-tect broad components as expected for type-1 AGN. In twogalaxies, only narrow components are visible. One of those,HE0045–2145, is clearly a misclassification and rather a star-burst galaxy than an AGN. Therefore, it has to be removedfrom the LLQSO sample.
2. From the broad components of the Paα emission line, wehave estimated black hole masses. For those galaxies withprevious black hole mass estimates, the masses agree wellwith our new masses. We can add four more data points inthe black hole mass - bulge luminosity diagram which we
discussed in Busch et al. (2014), supporting the finding thatLLQSOs do not follow the black hole mass - bulge luminos-ity relations of inactive galaxies. We discuss that the natureof this offset is essential for the understanding of the BH -host galaxy evolution.
3. From continuum fits, we derived estimates for the contribu-tions of stars, hot dust (from obscuring torus) and power law.The stellar component is significant in all galaxies, rangingfrom ∼ 30% (AGN dominated) to ∼ 90% (dominated bystellar component). Dust temperatures are in the range of1000 − 1400 K which is typical for type-1 AGN.
4. More than half of the galaxies show strong molecular hydro-gen lines which is indicative for a large reservoir of warm,excited molecular gas. The detection of molecular hydrogenin this study motivates deeper follow-up observations in or-der to study the H2 excitation mechanisms in LLQSOs inmore detail.
5. We analyse the gas excitation mechanisms in the galax-ies using a near-infrared diagnostic diagram (log(H2(1 −0)S(1)/Brγ) vs. log([Fe ii]λ1.257 µm/Paβ)). All galaxies fallin a region populated by AGN. However, several tend to-wards the region of star forming galaxies, emphasising therelevance of both, star formation and AGN, in LLQSOs.
To conclude, the here analysed spectra point at the impor-tance of both, non-stellar continuum emission as well as stellarradiation, in the LLQSO sample. From our data, however, noclear trend can be seen which means some galaxies are clearlydominated by stellar radiation, others by non-stellar continuumemission while others are a mixture. The diversity of radiationmechanisms confirms the theory that the LLQSO sample con-stitutes a transition between the clearly AGN dominated QSOsat higher redshift and the probably mainly secularly evolvinggalaxies with - if at all - only very weak nuclear activity.
The analysed sources are all offset from the MBH − Lbulgerelation. At the same time, they show signs for ongoing or recentstar formation, which may indicate overluminous bulges due tolower mass-to-light ratios.
Additional multi-wavelength data and spatially resolvedintegral-field spectroscopy will be analysed to further investi-gate the interplay between AGN activity and star formation inthe observed LLQSOs.Acknowledgements. The authors thank the anonymous referee for commentsthat helped to improve the paper. This work was supported by the Deutsche
Article number, page 8 of 18

Gerold Busch et al.: LLQSO sample: V. NIR spectroscopy
Table 6. IRAS fluxes and derived quantities: IR and FIR luminosity, FIR star formation rate.
source F12 µm F25 µm F60 µm F100 µm LIR LFIR SFRFIR[mJy] [mJy] [mJy] [mJy] [1010 L�] [1010 L�] [M� yr−1]
08 HE0045–2145 127 ± 23 642 ± 58 3570 ± 220 5320 ± 320 9.6 ± 0.4 5.0 ± 0.2 1711 HE0103–5842 170 ± 36 281 ± 43 1470 ± 160 2380 ± 260 7.0 ± 0.5 3.1 ± 0.3 1016 HE0119–0118 ≤ 147 271 ± 49 1460 ± 100 1800 ± 250 ≤ 31 13 ± 1 4431 HE0323–4204 ≤ 111 168 ± 21 290 ± 32 672 ± 121 ≤ 17 3.8 ± 0.4 1380 HE2112–5926 ≤ 121 ≤ 95 585 ± 47 1340 ± 90 ≤ 5.4 2.2 ± 0.2 784 HE2211–3903 264 ± 48 365 ± 55 794 ± 79 1070 ± 140 15 ± 2 3.8 ± 0.3 1385 HE2221–0221 208 ± 29 264 ± 48 290 ± 32 ≤ 1030 ≤ 22 ≤ 4.6 —
Forschungsgemeinschaft (DFG) via SFB 956, subproject A2. G. Busch andN. Fazeli are members of the Bonn-Cologne Graduate School for Physics andAstronomy (BCGS). S. Smajic is member of the International Max PlanckResearch School for Astronomy and Astrophysics Bonn/Cologne (IMPRS). M.Valencia-S. received funding from the European Union Seventh Framework Pro-gramme (FP7/2007-2013) under grant agreement No. 312789. J. Scharwächteracknowledges the European Research Council for the Advanced Grant ProgramNumber 267399-Momentum. This publication makes use of data products fromthe Two Micron All Sky Survey, which is a joint project of the University ofMassachusetts and the Infrared Processing and Analysis Center/California In-stitute of Technology, funded by the National Aeronautics and Space Adminis-tration and the National Science Foundation. This research has made use of theNASA/IPAC Extragalactic Database (NED) which is operated by the Jet Propul-sion Laboratory, California Institute of Technology, under contract with the Na-tional Aeronautics and Space Administration.
ReferencesAird, J., Coil, A. L., Georgakakis, A., et al. 2015, MNRAS, 451, 1892Alonso-Herrero, A., Rieke, G. H., Rieke, M. J., & Kelly, D. M. 2003, AJ, 125,
1210Alonso-Herrero, A., Rieke, M. J., Rieke, G. H., & Ruiz, M. 1997, ApJ, 482, 747Antonucci, R. 1993, ARA&A, 31, 473Baldwin, J. A., Phillips, M. M., & Terlevich, R. 1981, PASP, 93, 5Barvainis, R. 1987, ApJ, 320, 537Bedregal, A. G., Colina, L., Alonso-Herrero, A., & Arribas, S. 2009, ApJ, 698,
1852Bennert, V. N., Auger, M. W., Treu, T., Woo, J.-H., & Malkan, M. A. 2011, ApJ,
726, 59Bentz, M. C., Peterson, B. M., Netzer, H., Pogge, R. W., & Vestergaard, M. 2009,
ApJ, 697, 160Bertram, T., Eckart, A., Fischer, S., et al. 2007, A&A, 470, 571Black, J. H. & van Dishoeck, E. F. 1987, ApJ, 322, 412Böker, T., Falcón-Barroso, J., Schinnerer, E., Knapen, J. H., & Ryder, S. 2008,
AJ, 135, 479Brand, P. W. J. L., Toner, M. P., Geballe, T. R., et al. 1989, MNRAS, 236, 929Bremer, M., Scharwächter, J., Eckart, A., et al. 2013, A&A, 558, A34Busch, G., Smajic, S., Scharwächter, J., et al. 2015, A&A, 575, A128Busch, G., Zuther, J., Valencia-S., M., Moser, L., & Eckart, A. 2012, in Proceed-
ings of Nuclei of Seyfert galaxies and QSOs - Central engine & conditions ofstar formation (Seyfert 2012). 6-8 November, 2012. Max-Planck-Insitut fürRadioastronomie (MPIfR), Bonn, Germany. Online at http://pos.sissa.it/cgi-bin/reader/conf.cgi?confid=169, id.60, 60
Busch, G., Zuther, J., Valencia-S., M., et al. 2014, A&A, 561, A140Calzetti, D. 1997, AJ, 113, 162Calzetti, D., Armus, L., Bohlin, R. C., et al. 2000, ApJ, 533, 682Cardelli, J. A., Clayton, G. C., & Mathis, J. S. 1989, ApJ, 345, 245Cicone, C., Maiolino, R., Sturm, E., et al. 2014, A&A, 562, A21Cid Fernandes, R., Gu, Q., Melnick, J., et al. 2004, MNRAS, 355, 273Colina, L. 1993, ApJ, 411, 565Colina, L., Piqueras López, J., Arribas, S., et al. 2015, A&A, 578, A48Cresci, G., Mainieri, V., Brusa, M., et al. 2015a, ApJ, 799, 82Cresci, G., Marconi, A., Zibetti, S., et al. 2015b, A&A, 582, A63Davies, R. I., Maciejewski, W., Hicks, E. K. S., et al. 2014, ApJ, 792, 101Davies, R. I., Müller Sánchez, F., Genzel, R., et al. 2007, ApJ, 671, 1388Davies, R. I., Sternberg, A., Lehnert, M., & Tacconi-Garman, L. E. 2003, ApJ,
597, 907Davies, R. I., Sternberg, A., Lehnert, M. D., & Tacconi-Garman, L. E. 2005, ApJ,
633, 105Diniz, M. R., Riffel, R. A., Storchi-Bergmann, T., & Winge, C. 2015, MNRAS,
453, 1727
Dopita, M. A., Heisler, C., Lumsden, S., & Bailey, J. 1998, ApJ, 498, 570Dors, Jr., O. L., Riffel, R. A., Cardaci, M. V., et al. 2012, MNRAS, 422, 252Draine, B. T. & Woods, D. T. 1990, ApJ, 363, 464Eckart, A., van der Werf, P. P., Hofmann, R., & Harris, A. I. 1994, ApJ, 424, 627Falcón-Barroso, J., Ramos Almeida, C., Böker, T., et al. 2014, MNRAS, 438,
329Ferrarese, L. & Merritt, D. 2000, ApJ, 539, L9Fischer, S., Iserlohe, C., Zuther, J., et al. 2006, A&A, 452, 827García-Burillo, S., Combes, F., Hunt, L. K., et al. 2003, A&A, 407, 485García-Burillo, S., Combes, F., Usero, A., et al. 2014, A&A, 567, A125Gebhardt, K., Bender, R., Bower, G., et al. 2000, ApJ, 539, L13Glikman, E., Helfand, D. J., & White, R. L. 2006, ApJ, 640, 579Graham, A. W. 2012, ApJ, 746, 113Graham, A. W. 2015, To appear in "Galactic Bulges", E. Laurikainen, R.F.
Peletier, and D.A. Gadotti (eds.), Springer Publishing [arXiv:1501.02937]Graham, A. W. & Driver, S. P. 2007, ApJ, 655, 77Graham, A. W. & Scott, N. 2013, ApJ, 764, 151Graham, A. W. & Scott, N. 2015, ApJ, 798, 54Grupe, D., Beuerman, K., Mannheim, K., et al. 1995, A&A, 300, L21Häring, N. & Rix, H.-W. 2004, ApJ, 604, L89Helou, G. 1986, ApJ, 311, L33Hopkins, P. F., Richards, G. T., & Hernquist, L. 2007, ApJ, 654, 731Kauffmann, G., Heckman, T. M., Tremonti, C., et al. 2003, MNRAS, 346, 1055Kennicutt, Jr., R. C. 1998, ApJ, 498, 541Kewley, L. J., Dopita, M. A., Sutherland, R. S., Heisler, C. A., & Trevena, J.
2001, ApJ, 556, 121Kewley, L. J., Heisler, C. A., Dopita, M. A., et al. 2000, ApJ, 530, 704Kim, D., Im, M., & Kim, M. 2010, ApJ, 724, 386Kim, M., Ho, L. C., Peng, C. Y., et al. 2008, ApJ, 687, 767König, S., Eckart, A., García-Marín, M., & Huchtmeier, W. K. 2009, A&A, 507,
757König, S., Eckart, A., Henkel, C., & García-Marín, M. 2012, MNRAS, 420, 2263Kormendy, J. & Ho, L. C. 2013, ARA&A, 51, 511Kormendy, J. & Kennicutt, Jr., R. C. 2004, ARA&A, 42, 603Kormendy, J. & Richstone, D. 1995, ARA&A, 33, 581Krips, M., Eckart, A., Neri, R., et al. 2007, A&A, 464, 187Landt, H., Elvis, M., Ward, M. J., et al. 2011, MNRAS, 414, 218Larkin, J. E., Armus, L., Knop, R. A., Soifer, B. T., & Matthews, K. 1998, ApJS,
114, 59Läsker, R., Ferrarese, L., van de Ven, G., & Shankar, F. 2014, ApJ, 780, 70Leighly, K. M., Hamann, F., Casebeer, D. A., & Grupe, D. 2009, ApJ, 701, 176Magorrian, J., Tremaine, S., Richstone, D., et al. 1998, AJ, 115, 2285Mahony, E. K., Croom, S. M., Boyle, B. J., et al. 2010, MNRAS, 401, 1151Maiolino, R., Gallerani, S., Neri, R., et al. 2012, MNRAS, 425, L66Maiolino, R., Rieke, G. H., & Rieke, M. J. 1996, AJ, 111, 537Malkan, M. A. 1983, ApJ, 268, 582Malkan, M. A. & Sargent, W. L. W. 1982, ApJ, 254, 22Marconi, A. & Hunt, L. K. 2003, ApJ, 589, L21Markwardt, C. B. 2009, in Astronomical Society of the Pacific Conference Se-
ries, Vol. 411, Astronomical Data Analysis Software and Systems XVIII, ed.D. A. Bohlender, D. Durand, & P. Dowler, 251
Mason, R. E., Rodríguez-Ardila, A., Martins, L., et al. 2015, ApJS, 217, 13Mehdipour, M., Branduardi-Raymont, G., & Page, M. J. 2012, A&A, 542, A30Merloni, A., Bongiorno, A., Bolzonella, M., et al. 2010, ApJ, 708, 137Moser, L., Zuther, J., Busch, G., Valencia-S., M., & Eckart, A. 2012, in Proceed-
ings of Nuclei of Seyfert galaxies and QSOs - Central engine & conditions ofstar formation (Seyfert 2012). 6-8 November, 2012. Max-Planck-Insitut fürRadioastronomie (MPIfR), Bonn, Germany. Online at http://pos.sissa.it/cgi-bin/reader/conf.cgi?confid=169, id.69, 69
Moshir, M. e. 1990, in IRAS Faint Source Catalogue, version 2.0 (1990), 0Müller-Sánchez, F., Prieto, M. A., Hicks, E. K. S., et al. 2011, ApJ, 739, 69Müller-Sánchez, F., Prieto, M. A., Mezcua, M., et al. 2013, ApJ, 763, L1Nelson, C. H., Green, R. F., Bower, G., Gebhardt, K., & Weistrop, D. 2004, ApJ,
615, 652
Article number, page 9 of 18

A&A proofs: manuscript no. llqso5
0.4 0.2 0.0 0.2 0.4 0.6 0.8 1.0 1.2log(f25µm/f12µm)
0.4
0.2
0.0
0.2
0.4
0.6
0.8
1.0
1.2
1.4
log(
f 60µm
/f 25µ
m)
Starburst Line
0%
50%
90%
100%
Extreme MixingLine
τ=0
τ=1
τ=2
τ=3
τ=4
τ=5τ(12µm)
Sy1Sy2HBLRSB
0.0 0.5 1.0 1.5log(f100µm/f25µm)
0.0
0.5
1.0
1.5
2.0
log(
f 60µm
/f 12µ
m) Starburst Line
Extreme MixingLine0% 50%
90%
100%
τ=0
τ=1
τ=2
τ=3
τ=4
τ=5τ(12µm)
gal 08gal 11gal 16gal 31gal 80gal 84gal 85
Fig. 7. Far-infrared colour-colour diagrams, modified from Kewleyet al. (2000). Left: log( f60 µm/ f25 µm) vs. log( f25 µm/ f12 µm) diagram.Right: log( f60 µm/ f12 µm) vs. log( f100 µm/ f25 µm) diagram. In both plots, thesolid line is the reddening line calculated by Dopita et al. (1998). Thestraight dashed line marks the typical area of starbursts. The “ExtremeMixing Line” corresponds to the mixture of a typical Seyfert-1 spec-trum and a starburst component (with denoted percentage). The opensymbols are Seyfert-1, Starburst, and Seyfert-2 galaxies with (HBLR)and without (Sy2) broad line components observed in polarised light,taken from the sample of Rush et al. (1993). The positions of the anal-ysed galaxies are indicated by the coloured data points.
Nesvadba, N. P. H., Boulanger, F., Salomé, P., et al. 2010, A&A, 521, A65Netzer, H., Maoz, D., Laor, A., et al. 1990, ApJ, 353, 108Nussbaumer, H. & Storey, P. J. 1988, A&A, 193, 327Osterbrock, D. E. & Ferland, G. J. 2006, Astrophysics of gaseous nebulae and
active galactic nucleiPanuzzo, P., Bressan, A., Granato, G. L., Silva, L., & Danese, L. 2003, A&A,
409, 99Press, W. H., Teukolsky, S. A., Vetterling, W. T., & Flannery, B. P. 1992, Numer-
ical recipes in FORTRAN. The art of scientific computingRamos Almeida, C., Pérez García, A. M., & Acosta-Pulido, J. A. 2009, ApJ, 694,
1379Rashed, Y. E., Eckart, A., Valencia-S., M., et al. 2015, MNRAS, in press
[arXiv:1509.01403]Rashed, Y. E., Zuther, J., Eckart, A., et al. 2013, A&A, 558, A5Rayner, J. T., Cushing, M. C., & Vacca, W. D. 2009, ApJS, 185, 289Reunanen, J., Kotilainen, J. K., & Prieto, M. A. 2002, MNRAS, 331, 154Reunanen, J., Kotilainen, J. K., & Prieto, M. A. 2003, MNRAS, 343, 192Riffel, R., Pastoriza, M. G., Rodríguez-Ardila, A., & Bonatto, C. 2009a, MN-
RAS, 400, 273
Riffel, R., Rodríguez-Ardila, A., Aleman, I., et al. 2013, MNRAS, 430, 2002Riffel, R., Rodríguez-Ardila, A., & Pastoriza, M. G. 2006, A&A, 457, 61Riffel, R. A., Storchi-Bergmann, T., Dors, O. L., & Winge, C. 2009b, MNRAS,
393, 783Riffel, R. A., Storchi-Bergmann, T., & Nagar, N. M. 2010, MNRAS, 404, 166Riffel, R. A., Storchi-Bergmann, T., & Riffel, R. 2015, MNRAS, 451, 3587Riffel, R. A., Storchi-Bergmann, T., Winge, C., et al. 2008, MNRAS, 385, 1129Rodríguez-Ardila, A., Pastoriza, M. G., Viegas, S., Sigut, T. A. A., & Pradhan,
A. K. 2004, A&A, 425, 457Rodríguez-Ardila, A., Riffel, R., & Pastoriza, M. G. 2005, MNRAS, 364, 1041Rush, B., Malkan, M. A., & Spinoglio, L. 1993, ApJS, 89, 1Sanders, D. B. & Mirabel, I. F. 1996, ARA&A, 34, 749Savorgnan, G., Graham, A. W., Marconi, A., et al. 2013, MNRAS, 434, 387Scharwächter, J., Dopita, M. A., Zuther, J., et al. 2011, AJ, 142, 43Schawinski, K., Thomas, D., Sarzi, M., et al. 2007, MNRAS, 382, 1415Schoenmakers, A. P., de Bruyn, A. G., Röttgering, H. J. A., van der Laan, H., &
Kaiser, C. R. 2000, MNRAS, 315, 371Schulze, A. & Wisotzki, L. 2010, A&A, 516, A87Scott, N., Graham, A. W., & Schombert, J. 2013, ApJ, 768, 76Silk, J. 2013, ApJ, 772, 112Skrutskie, M. F., Cutri, R. M., Stiening, R., et al. 2006, AJ, 131, 1163Smajic, S., Fischer, S., Zuther, J., & Eckart, A. 2012, A&A, 544, A105Smajic, S., Moser, L., Eckart, A., et al. 2015, A&A, in press [arXiv:1508.02664]Smajic, S., Moser, L., Eckart, A., et al. 2014, A&A, 567, A119Sternberg, A. & Dalgarno, A. 1989, ApJ, 338, 197Storchi-Bergmann, T., Lopes, R. D. S., McGregor, P. J., et al. 2010, MNRAS,
402, 819Sun, M., Trump, J. R., Brandt, W. N., et al. 2015, ApJ, 802, 14Urrutia, T., Lacy, M., Spoon, H., et al. 2012, ApJ, 757, 125Urry, C. M. & Padovani, P. 1995, PASP, 107, 803Valencia-S., M., Zuther, J., Eckart, A., et al. 2012a, A&A, 544, A129Valencia-S., M., Zuther, J., Eckart, A., et al. 2012b, in Proceedings of Nu-
clei of Seyfert galaxies and QSOs - Central engine & conditions of starformation (Seyfert 2012). 6-8 November, 2012. Max-Planck-Insitut für Ra-dioastronomie (MPIfR), Bonn, Germany. Online at http://pos.sissa.it/cgi-bin/reader/conf.cgi?confid=169, id.17, 17
Véron-Cetty, M.-P. & Véron, P. 2006, A&A, 455, 773Vitale, M., Fuhrmann, L., García-Marín, M., et al. 2015, A&A, 573, A93Wisotzki, L., Christlieb, N., Bade, N., et al. 2000, A&A, 358, 77Xu, D., Komossa, S., Zhou, H., et al. 2012, AJ, 143, 83Zuther, J., Iserlohe, C., Pott, J.-U., et al. 2007, A&A, 466, 451
Appendix A: Discussion of individual objects
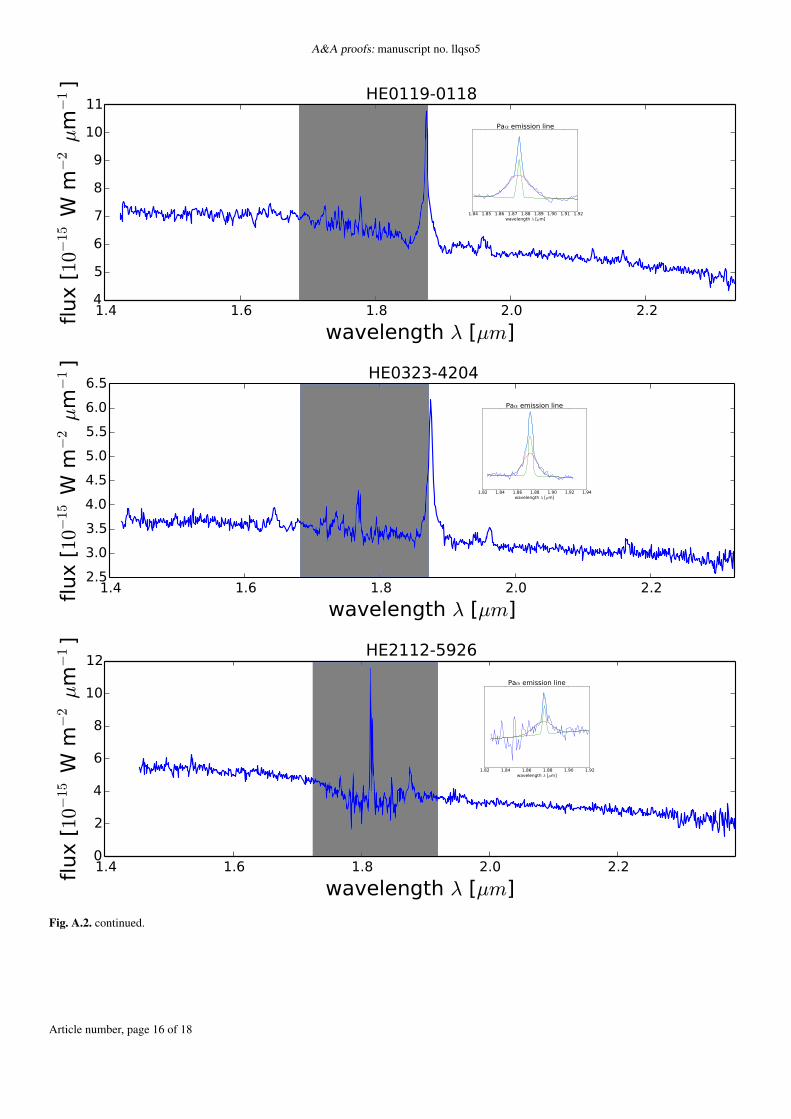
In the following section, we discuss individual objects. Spectraof all galaxies are shown in Fig. A.2. All spectra have been ex-tracted from an aperture with radius corresponding to 3× FWHMof the seeing.
05 HE0036–5133
The galaxy HE0036–5133 (also known as WPVS7) at z =0.0288, corresponding to DL = 126.1 Mpc, has been classifiedas Narrow-line Seyfert-1 (NLS1 Véron-Cetty & Véron 2006)and found to be X-ray transient with a broad-absorption lineoutflow (Leighly et al. 2009). Fitting the hydrogen recombina-tion line Paα yields a width of the broad component of around1300 km s−1, confirming the classification as NLS1 (but see alsodiscussion about NLS1 in Valencia-S. et al. 2012b).
08 HE0045–2145
HE0045–2145 (also known as ESO 540-27) is a barred spiralgalaxy at redshift z = 0.0214, corresponding to DL = 93.2 Mpc,i.e. one of the closest objects in our sample. An elongated,patchy structure in the direct neighbourhood indicates tidal in-teraction with a possibly disrupted companion. However, moredetailed information about this object is missing and the galaxyitself does not show further indications for interaction. The NIRcolours suggest a low AGN contribution. Prominent stellar ab-sorption features in the analysed nuclear spectrum support the
Article number, page 10 of 18

Gerold Busch et al.: LLQSO sample: V. NIR spectroscopy
8 6 4 2 0 2 4 6 8radius [arcsec]
0
200
400
600
800
flux
[10−
20 W
m−
2 a
rcse
c−1]
star formation region?
Paα
Fig. A.1. HE0045–2145: Radial distribution of the intensity of the Paαemission line. The off-central bump at ∼ 4′′ south-west of the nucleus(see Fig. 2) could be attributed to a circumnuclear star forming region.
importance of the stellar contribution also in the central region.We could not find broad components in the hydrogen recombi-nation lines that should be visible in a type-1 galaxy.
The IRAS colours are log( fν(12 µm)/ fν(25 µm)) = −0.7 andlog( fν(60 µm)/ fν(100 µm)) = −0.17. In the IRAS colour-colourdiagrams by Helou (1986), this lies in a region characteristic forstarburst dominated galaxies. Also in the FIR colour-colour di-agram of Kewley et al. (2000) (Fig. 7), this galaxy lies on thestarburst line.
The galaxy has a H i gas mass of 5.7 × 10⁹ M� (König et al.2009) and a H2 gas mass of 2.9 × 10⁹ M� (Bertram et al. 2007).This means that stars are formed quite efficiently with a star for-mation efficiency (SFE) of LFIR/MH2 = 17 L� M−1
� (Eckart et al.1994).
In the continuum fit (Sect. 3.1), the resulting black body tem-perature of T ∼ 25 000 K is much higher than expected for adusty torus with a temperature T ∼ 1200 K. This is the blackbody temperature of O and B stars, indicative for a recent star-burst. All these arguments indicate that HE0045–2145 is ratherdominated by its stellar components and ongoing star formationand that the classification as Seyfert 1 is invalid.
In Fig. A.1 we show the radial distribution of the Paα emis-sion which shows a bump at a distance of ∼ 4′′ from the center,which could be attributed to a star formation region.
11 HE0103–5842
HE0103–5842 (also known as ESO 113-10) has a redshift ofz = 0.0257 (DL = 112.2 Mpc). At first view, it looks like a barredgalaxy. However, the morphological study (Busch et al. 2014) re-veals a more complex underlying structure. The galaxy has beenclassified as Seyfert 1.8 by Véron-Cetty & Véron (2006). Nobroad components could be resolved in our NIR spectra. Theblue continuum and deep stellar absorption features indicate thatthe nuclear non-stellar component is weak in comparison to thestellar component. In the continuum fit, the stellar componenthas indeed a fraction of ∼ 90%.
Mehdipour et al. (2012) measure the Balmer decrement andfind a significant amount of reddening in the line of sight. How-ever, neither our NIR Paα/Brγ line ratios nor our continuum fitshow a significant contribution from extinction.
16 HE0119–0118
HE0119–0118 (also known as Mrk1503 or II Zw 1) isa barred spiral galaxy at z = 0.0547, correspondingto DL = 244 Mpc and can be classified as luminousinfrared galaxy (LIRG) based on the IRAS fluxes. The
IRAS colours of log( fν(12 µm)/ fν(25 µm)) ≤ −0.3 andlog( fν(60 µm)/ fν(100 µm)) = −0.1 lie in the region of star-burst dominated galaxies. In the FIR colour-colour diagrams ofKewley et al. (2000) (Fig. 7), the galaxy consistently shows astarburst contribution of at least 50%. The H2 mass is MH2 =5.4 × 10⁹M� (Bertram et al. 2007). This results in a star for-mation efficiency of 24 L� M−1
� , almost the maximum detectedSFE found in Galactic star forming regions (≤ 30 L� M−1
� ; Eckartet al. 1994, and references therein).
The broad hydrogen recombination lines (FWHMBLR ≈
3000 km s−1) and the position in the diagnostic diagram (Fig. 5)indicate black hole accretion and that the classification as Seyfertgalaxy (Sy1.5, Véron-Cetty & Véron 2006) is correct. However,the mentioned arguments show that star formation is a significantfactor.
In the imaging study (Busch et al. 2014), we found the cen-tral stellar component (bulge) to be very compact and we werenot able to disentangle it from the nuclear non-stellar com-ponent. This could indicate the presence of a compact, diskypseudo-bulge. These objects are products of secular evolutionand often star-forming, contrary to classical bulge components(see review of Kormendy & Kennicutt 2004). The coexistenceof prominent non-stellar (e.g. broad lines) and stellar (CO ab-sorption) features in the spectrum indicate that even in the nu-clear region, star formation could be of importance, motivatingmore detailed investigation of this source, e.g. by integral fieldspectroscopy.
The black hole mass estimates for this source range fromlog(MBH/M�) = 7.1 (Xu et al. 2012) over log(MBH/M�) = 7.58(Bennert et al. 2011) and log(MBH/M�) = 7.9 (Schulze, priv.communication) to log(MBH/M�) = 7.9 (this study), demon-strating the uncertainty of black hole mass estimates.
31 HE0323–4204
HE0323–4204 is classified as Seyfert 1.5 by Véron-Cetty &Véron (2006). The prominent broad emission line componentsof Paα and Brγ, the significant power-law and hot dust contribu-tion to the continuum flux, and the forbidden [Fe ii] line indicatestrong nuclear activity.
The IRAS colours are log( fν(12 µm)/ fν(25 µm)) ≤ −0.18and log( fν(60 µm)/ fν(100 µm)) = −0.36, i.e. between the typ-ical colours of starburst galaxies and elliptical galaxies. In theFIR colour-colour diagrams (Fig. 7), they lie on the ExtremeMixing Line with a starburst contribution of & 50%. The con-tinuum fit yields a stellar contribution of ∼ 30%. Furthermore,stellar absorption lines and the position in the diagnostic diagram(Fig. 5) close to the location of starburst galaxies indicate an atleast moderate contribution of star formation.
The galaxy at redshift z = 0.058 (DL = 259.3 Mpc) is veryinclined and probably a spiral galaxy. In direct neighbourhood,there is a companion galaxy that shows signs of interaction. Insome astronomical databases, the galaxy is sometimes confusedwith another spiral galaxy in the neighbourhood. This galaxyalso falls into the slit but shows no signs for non-stellar con-tribution.
80 HE2112–5926
HE2112–5926 is part of the interacting galaxy pair ESO144-21.It has an elliptical shape, the interacting partner is a spiral galaxy.The source has redshift z = 0.0317 (DL = 139.1).
Article number, page 11 of 18

A&A proofs: manuscript no. llqso5
The stellar contribution to the continuum emission is ∼ 80%.This is in agreement with the low luminosity fraction of the non-stellar point source found in the imaging study (Busch et al.2014).
81 HE2128–0221
HE2128–0221 appears as an elongated elliptical at redshift z =0.0528 (DL = 235.2 Mpc) and is the least luminous object ob-served in this study. This explains the low signal-to-noise ra-tio. The continuum is blue and shows clear stellar absorptionlines. The hydrogen recombination line Paα is weak compared tothe continuum emission. However, a broad component is clearlyseen. The Brγ line almost vanishes in the noise and shows astrange (boxy) shape.
82 HE2129–3356
HE2129–3356 is an elliptically shaped galaxy at redshift z =0.0293 (DL = 128.3 Mpc), classified as Seyfert 1.2 by Véron-Cetty & Véron (2006). The galaxy is surrounded by several ob-jects it is most probably interacting with. Stellar absorption fea-tures are present and the stellar component contributes ∼ 75% tothe continuum emission. Nevertheless, the position in the diag-nostic diagram (Fig. 5) is that of an AGN-dominated galaxy andthe presence of the coronal line [Si vi] emission indicates a type-1 AGN. Also the hydrogen recombination lines are very strongand show the broadest line widths (∼ 5000 km s−1) in this study.
83 HE2204–3249
HE2204–3249, also known as ESO 404-29, has a redshift ofz = 0.0594 (DL = 265.9 Mpc) and is the most distant object ob-served in this study. In the imaging study (Busch et al. 2014), thedecomposition revealed a non-axisymmetrical residuum whichcould be interpreted as dust lane. From the line ratio Paα/Brγ,we get a high extinction of AV ≈ 50 mag. 1 The continuum fitshows no sign of extinction (but see comment on reliability ofthis fit in Sect. 3.1).
Several objects located in direct neighbourhood are probablyin a tidal interaction with the galaxy. The spectrum shows a veryblue continuum shape and deep stellar absorption lines are seen.From the continuum fit we get a stellar contribution to the con-tinuum of about 90%. Additionally, the hydrogen recombinationlines are rather weak compared to the continuum flux. Neverthe-less, we detect broad components (FWHMBLR ≈ 4000 km s−1),consistent with the classification as Seyfert 1.2 in Véron-Cetty& Véron (2006).
84 HE2211–3903
HE2211–3903 (also known as ESO 344-16) is a barred spi-ral galaxy, classified as Seyfert 1.5 galaxy by Véron-Cetty &
1 Assuming a case B recombination scenario, and the low-densitylimit with typical temperatures of T = 10 000 K, we expect a lineratio of about Paα/Brγ = 12.5 (Osterbrock & Ferland 2006). Fur-thermore, assuming a dust-screen-model fobs(λ) = fintr(λ) × 10−0.4Aλ
and the mean RV -dependent extinction law by Cardelli et al. (1989)〈A(λ)/A(V)〉 = a(λ) + b(λ)/RV with RV = 3.1, a(λ) = 0.574λ−1.61 andb(λ) = −0.527λ−1.61, by using hydrogen recombination lines we can
estimate the extinction AV =−2.5 log
(( f ′Paα/ f ′Brγ)/( fPaα/ fBrγ)
)a(λPaα)+b(λPaα)/RV−a(λBrγ)+b(λBrγ)/RV
with ob-served fluxes f ′Paα, f ′Brγ and the expected line ratio fPaα/ fBrγ ≈ 12.5.
Véron (2006). The redshift is z = 0.0398, corresponding toDL = 175.6 Mpc. In the previous imaging study (Busch et al.2014), we reveal an additional spiral arm and an inner ring thatcan also be found in emission line maps by Scharwächter et al.(2011).
Confirming the results from Fischer et al. (2006), the spec-trum is very red, due to black body radiation coming from hotdust at a temperature of ∼ 1100 K which makes up about 60% ofthe continuum radiation. Probably due to this high contributionof hot dust, the spectrum does not show any other features thanthe hydrogen recombination lines Paα and Brγ.
Scharwächter et al. (2011) report that based on unresolvednarrow-line ratios (log([N ii]/Hα) = −0.2, log([O iii]/Hβ) = 0.2and log([S ii]/Hα) = −0.5), the galaxy would be classified as“composite”. However, through spatially resolved spectroscopy,they find an extended narrow-line region on scales up to 8 kpc.
Based on IRAS fluxes, the galaxy is a LIRG. The H2 mass isMH2 = 9.3 × 10⁹M� (Bertram et al. 2007), resulting in a SFE of4 M� L−1
� . We see that the IRAS data suggest ongoing star for-mation activity. Since there is no evidence for any strong inter-action, HE2211–3903 is likely to be an example for a secularlyevolving galaxy.
85 HE2221–0221
HE2221–0221 is also known as 3C 445 and classified as a “dou-ble double” radio galaxy (Schoenmakers et al. 2000). It has aredshift of z = 0.057 (DL = 254.7 Mpc). In near-infrared im-ages, it appears as round elliptical with very bright unresolvednucleus. Our imaging study (Busch et al. 2014) shows that thehost is almost over-shone by the nucleus. The Paα line is verybroad and strong. However, the Brγ line is rather weak. Thiscould be induced by reddening. Indeed, the shape and the NIRcolours are extremely red and the continuum fit yields an extinc-tion of AV = 1.6 mag. Nevertheless, the spectrum shows somestellar features, and the stellar contribution is around ∼ 30%.The presence of strong [Si vi] emission is indicative of nuclearactivity.
Article number, page 12 of 18
Gerold Busch et al.: LLQSO sample: V. NIR spectroscopy
1.4 1.6 1.8 2.0 2.2 2.4wavelength λ [µm]
inte
nsity
[a.u
.]
HE0036
HE0045
HE0103
HE0119
HE0323
HE2112
CO(6-3)
[FeII] Paα [SiVI] 1-0 S(1)
Brγ
CO(2-0)
Fig. 3. H + K-band spectra of the objects analysed in this paper. For each galaxy, we show a central spectrum (black line/lower spectrum) whichis extracted from an aperture with diameter corresponding to the FWHM of the seeing (see Table 1). In addition, we show an off-central spectrum(grey line/upper spectrum), centered 1.5×FWHM left and right from the nucleus. The spectra are shown in restframe wavelength and have beennormalized at 2.159 µm. Important emission and absorption lines have been marked.
Article number, page 13 of 18

A&A proofs: manuscript no. llqso5
1.4 1.6 1.8 2.0 2.2 2.4wavelength λ [µm]
inte
nsity
[a.u
.]
HE2128
HE2129
HE2204
HE2211
HE2221
CO(6-3)
[FeII] Paα [SiVI] 1-0 S(1)
Brγ
CO(2-0)
Fig. 3. continued
Article number, page 14 of 18

Gerold Busch et al.: LLQSO sample: V. NIR spectroscopy
Fig. A.2. Spectra of all analysed galaxies. Spectra have been extracted from an aperture with radius corresponding to 3× FWHM. The regionbetween H- and K-band with low transmission has been marked in grey.
Article number, page 15 of 18
A&A proofs: manuscript no. llqso5
Fig. A.2. continued.
Article number, page 16 of 18

Gerold Busch et al.: LLQSO sample: V. NIR spectroscopy
Fig. A.2. continued.
Article number, page 17 of 18

A&A proofs: manuscript no. llqso5
Fig. A.2. continued.
Article number, page 18 of 18