a low frequency electron paramagnetic … paramagnetic resonance (epr) spectroscopy is used to study...
TRANSCRIPT
Electron Paramagnetic resonance (EPR) spectroscopy is used to
study materials with unpaired electrons such as paramagnetic
transition metal ions. Conventional EPR operates at a frequency (n)
of 9 GHz and accommodates samples of a few mm3. We used low
frequency EPR (LFEPR) operating at 250 < n < 300 MHz. LFEPR
accommodates samples of several liters and is a good nondestructive
tool for studying ceramic materials with cultural heritage significance.
EPR measures the absorption of electromagnetic radiation at n by
unpaired electrons when placed in a magnetic field (Bo). Bo is related
to n by the Planck’s constant (h), the nuclear magneton (b), and the
Landé g-factor of the specific electron spin.
hn = g b Bo
Signals are recorded by applying a constant n and sweeping Bo. Bo
modulation and phase sensitive detection result in first derivative
spectra. Spectral peaks are characterized by their g-factor, peak-to-
peak width (G), and peak-to-peak height (SPP).
Redart clay is a plastic pottery clay commonly used for terracotta
earthenware. It contains 65% silicon dioxide (SiO2), 15.5% aluminum
oxide (Al2O3), and 7% iron oxide (Fe2O3), the latter being responsible
for its deep red color. We studied the change in the LFEPR spectra of
Redart clay as a function of firing temperature (TF). By making
observations of Redart clay with LFEPR, we can draw conclusions
about pottery artifacts with a similar composition.
Cedar Heights Redart clay (Resco, Pittsburgh, PA) was hydrated,
mixed, and formed into rods and flat samples for analysis. Samples
were heated in an oven for 8 hours at the indicated TF, cooled to 20
°C, and analyzed. The LFEPR spectrometer was built in the RIT
Magnetic Resonance Laboratory and operates at 250 and 300 MHz.1
Thermogravimetric analysis (TGA) was performed in air between 20
and 1000 °C using a TA Instruments Q500 TGA. Values at 1100 and
1200 ºC were measured manually.
A LOW FREQUENCY ELECTRON PARAMAGNETIC RESONANCE SPECTROSCOPY
STUDY OF THE FIRING TEMPERATURE OF REDART CLAY
1The RIT Magnetic Resonance Laboratory, 2The Harley School, 3Independent Consultant, Rochester, NY
L. Switala1, E.I. Hornak2, W.J. Ryan1, N. Zumbulyadis3, J.P. Hornak1
Introduction
Methods
Results and Discussion
1. J.P. Hornak, et al., Meas. Sci. Technol. 2:520-522 (1991).
2. L.E. Halliburton, Applied Radiation Isotopes 40:859-863 (1989).
3. J.A. Weil, Physics and Chemistry of Minerals 10:149-165 (1984).
4. M. Terwilliger, et al., The Potential of Low Frequency Electron
Paramagnetic Resonance for the Analysis of Cultural Heritage
Artifacts. Rochester Academy of Science Symposium, (2013).
Fired clay samples changed color from a brownish red to a
terracotta red at ~400 °C, then to a dark brown starting at 1100 °C.
(See Fig. 1.) The TGA of the clay (Fig. 2) showed a 2% weight loss at
100 °C from the loss of the water used to plasticize the clay, a 3% loss
at 500 °C from the loss of waters of hydration, and a 0.5% loss at
1100 ºC corresponding to a weight loss that occurs during vitrification.
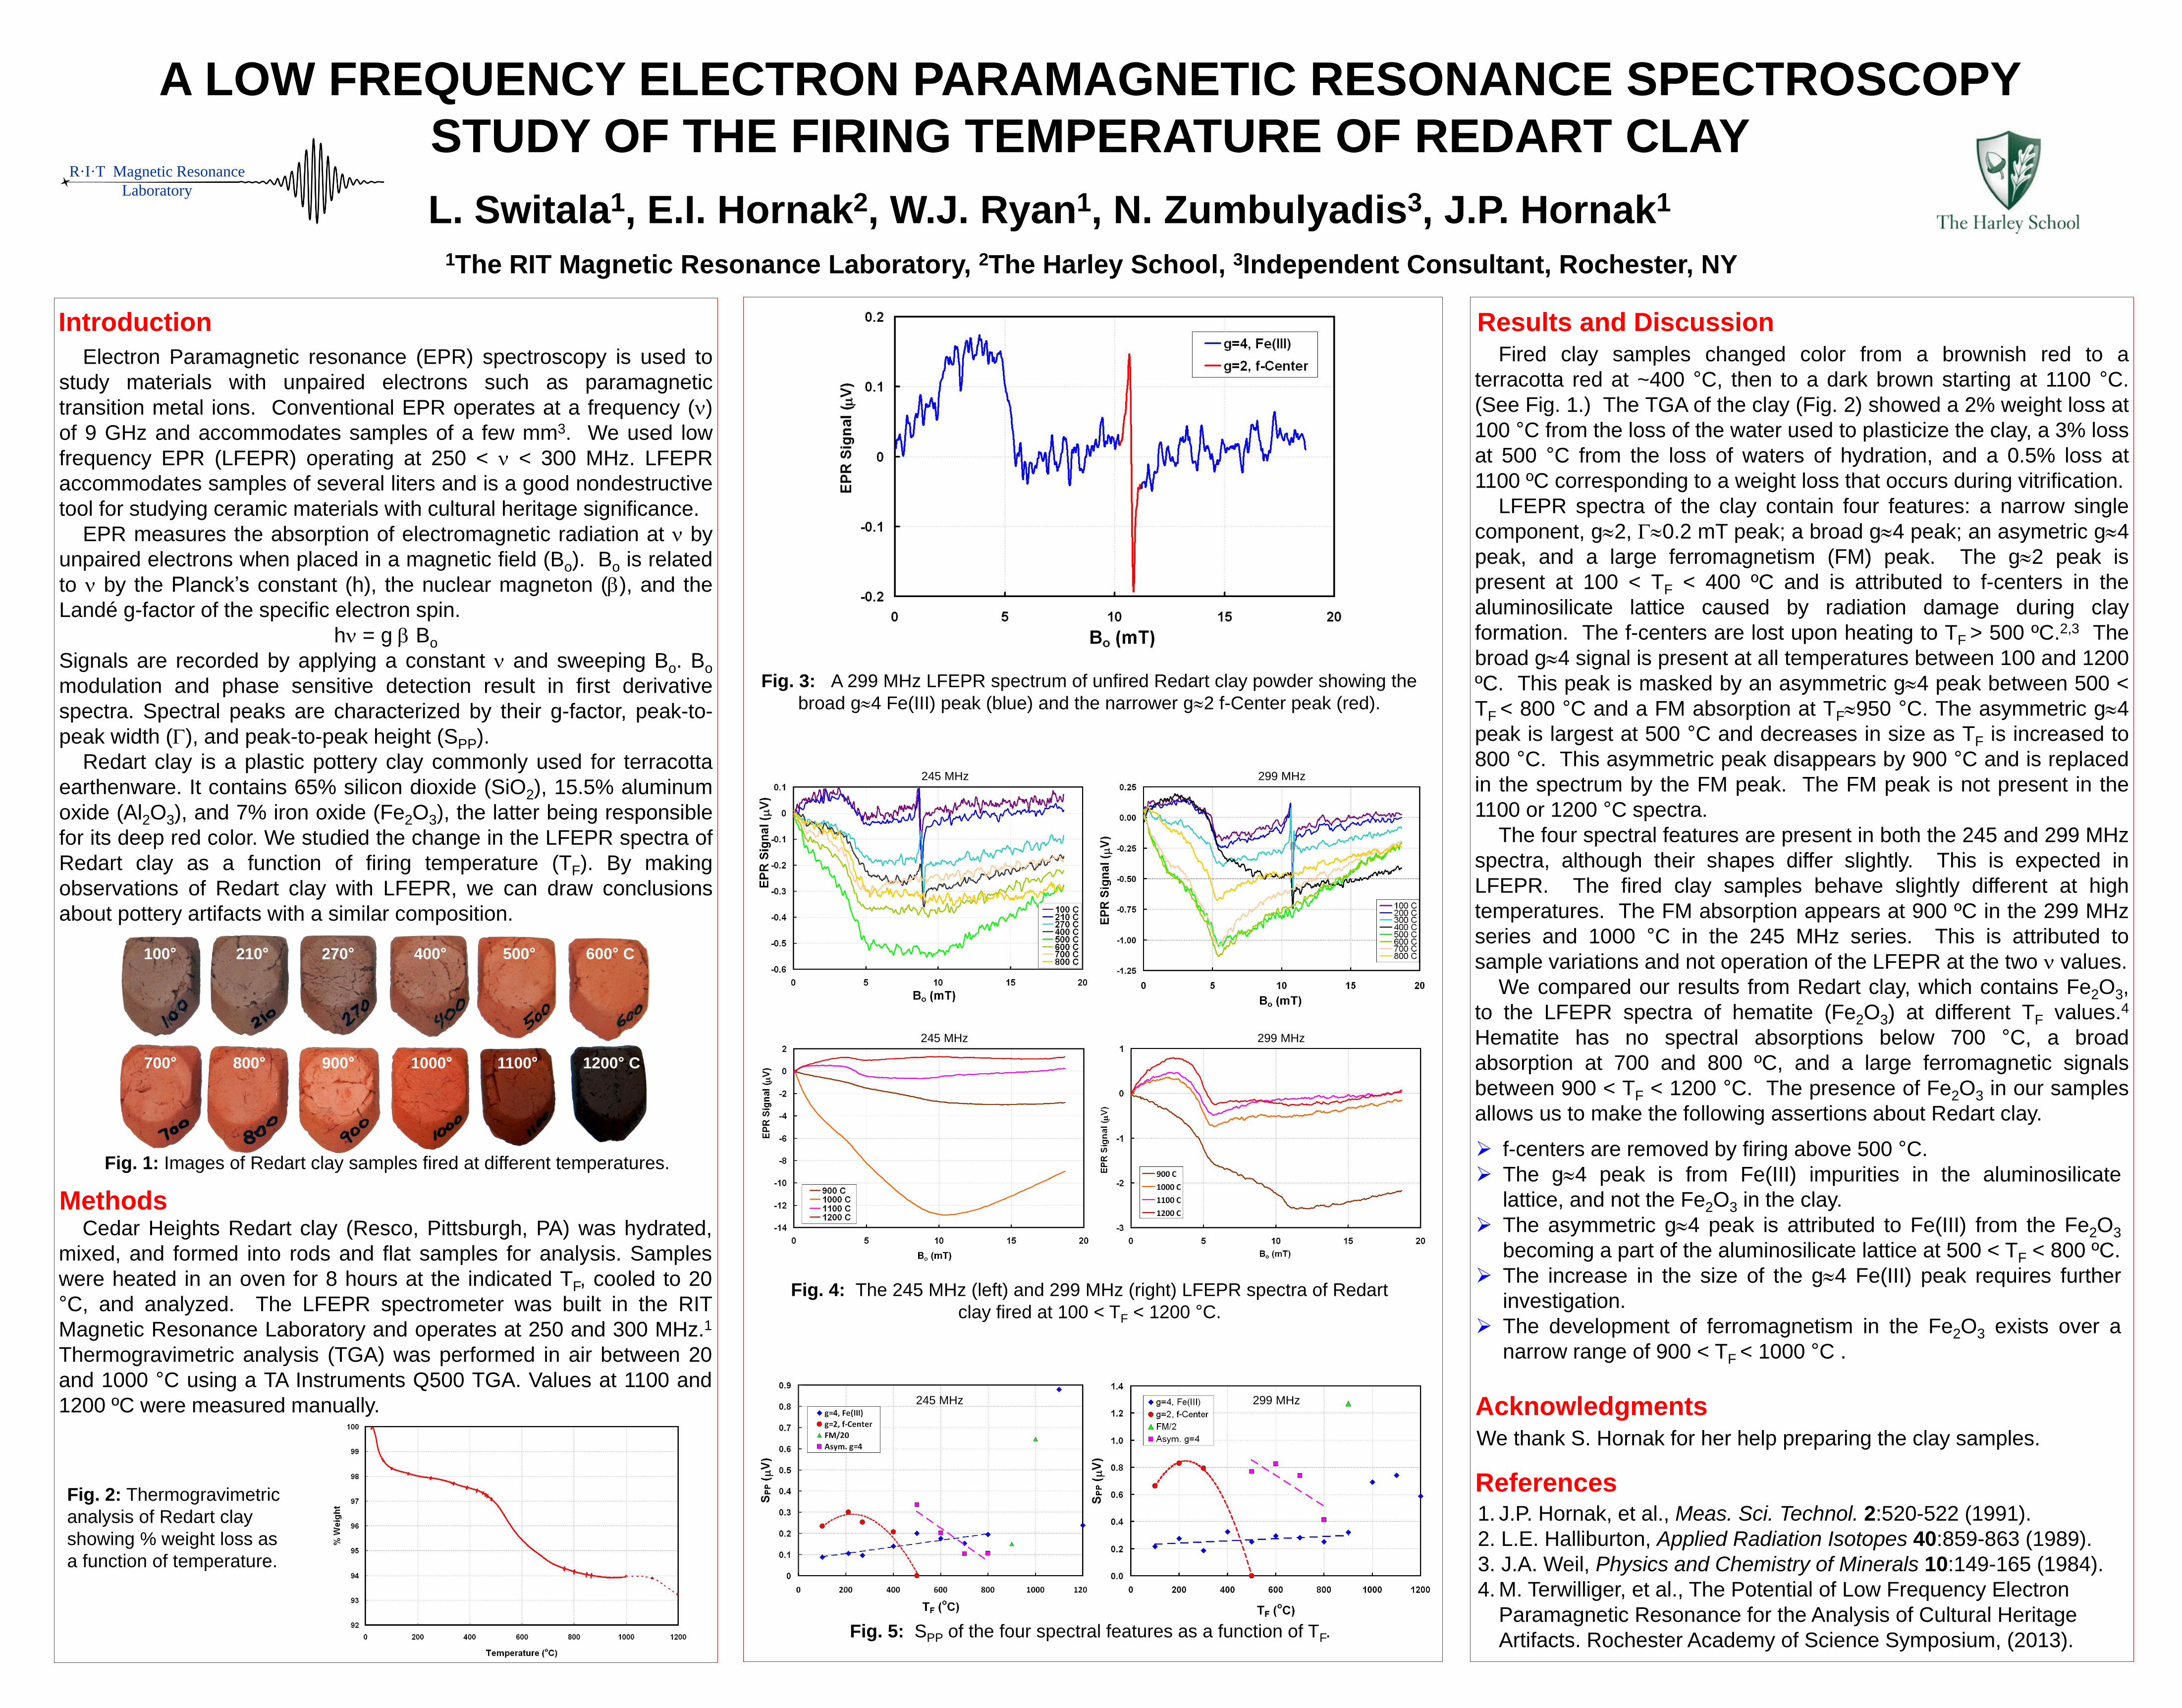
LFEPR spectra of the clay contain four features: a narrow single
component, g2, G0.2 mT peak; a broad g4 peak; an asymetric g4
peak, and a large ferromagnetism (FM) peak. The g2 peak is
present at 100 < TF < 400 ºC and is attributed to f-centers in the
aluminosilicate lattice caused by radiation damage during clay
formation. The f-centers are lost upon heating to TF > 500 ºC.2,3 The
broad g4 signal is present at all temperatures between 100 and 1200
ºC. This peak is masked by an asymmetric g4 peak between 500 <
TF < 800 °C and a FM absorption at TF950 °C. The asymmetric g4
peak is largest at 500 °C and decreases in size as TF is increased to
800 °C. This asymmetric peak disappears by 900 °C and is replaced
in the spectrum by the FM peak. The FM peak is not present in the
1100 or 1200 °C spectra.
The four spectral features are present in both the 245 and 299 MHz
spectra, although their shapes differ slightly. This is expected in
LFEPR. The fired clay samples behave slightly different at high
temperatures. The FM absorption appears at 900 ºC in the 299 MHz
series and 1000 °C in the 245 MHz series. This is attributed to
sample variations and not operation of the LFEPR at the two n values.
We compared our results from Redart clay, which contains Fe2O3,
to the LFEPR spectra of hematite (Fe2O3) at different TF values.4
Hematite has no spectral absorptions below 700 °C, a broad
absorption at 700 and 800 ºC, and a large ferromagnetic signals
between 900 < TF < 1200 °C. The presence of Fe2O3 in our samples
allows us to make the following assertions about Redart clay.
R·I·T Magnetic Resonance
Laboratory
100° 210° 270° 400° 500° 600° C
700° 800° 900° 1000° 1100° 1200° C
Fig. 1: Images of Redart clay samples fired at different temperatures.
Fig. 3: A 299 MHz LFEPR spectrum of unfired Redart clay powder showing the
broad g4 Fe(III) peak (blue) and the narrower g2 f-Center peak (red).
Acknowledgments We thank S. Hornak for her help preparing the clay samples.
Fig. 2: Thermogravimetric
analysis of Redart clay
showing % weight loss as
a function of temperature.
References
f-centers are removed by firing above 500 °C.
The g4 peak is from Fe(III) impurities in the aluminosilicate
lattice, and not the Fe2O3 in the clay.
The asymmetric g4 peak is attributed to Fe(III) from the Fe2O3
becoming a part of the aluminosilicate lattice at 500 < TF < 800 ºC.
The increase in the size of the g4 Fe(III) peak requires further
investigation.
The development of ferromagnetism in the Fe2O3 exists over a
narrow range of 900 < TF < 1000 °C .
Fig. 5: SPP of the four spectral features as a function of TF.
245 MHz 299 MHz
245 MHz 299 MHz
Fig. 4: The 245 MHz (left) and 299 MHz (right) LFEPR spectra of Redart
clay fired at 100 < TF < 1200 °C.
245 MHz 299 MHz