a longitudinal study of self-esteem: implications for
TRANSCRIPT

Journal of Youth and Adolescence, Vol. 26, No. 2, 1997
This study used a cluster analytic approach to identify self-esteem trajectoriesamong adolescents over a four-year period from sixth to tenth grades (N =1,160). Four self-esteem trajectories were identified thai replicated previous re-search: (1) consistently high, (2) moderate and rising, (3) steadily decreasing,and (4) consistently low. Female adolescents were more likely to be in thesteadily decreasing self-esteem group while male adolescents were more likefyto be in the moderate and rising ffoup. African American and white youthwere equally distributed across groups. Using repeated measures analysis, wefound that youth with consistently high and moderate and rising self-esteemreported developmentalfy healthier outcomes in Grade 10 than youth in theother two clusters. Outcomes included susceptibility to peer pressure, school
This study is based on research supported by the National Institute on Alcohol Abuse andAlcoholism Grant No. AA06324 (John E. Schulenberg, P.I.) and partially supported by theNational Institute on Alcohol Abuse and Alcoholism Grant No. AA09026 (Jean T. Shops,P.I.).
'Associate Professor, Department of Health Behavior and Health Education, School of PnblicHealth, University of Michigan, 1420 Washington Heights, Ann Arbor, Michigan 48109-2029.Received Ph.D. from University of Illinois. Research interests include adolescent health andresiliency and empowerment theory. To whom correspondence should be addressed.
'•Research Specialist, Health Services Research and Development, Veterans Affairs MedicalCenter, Ann Arbor, Michigan, and doctoral student, Department of Health Behavior andHealth Education, School of Public Health, University of Michigan. Received M.PJH. fromUniversity of Michigan. Research interests include adolescent alcohol and substance use,driving behavior, and injury prevention.
3Associate Research Scientist, University of Michigan Transportation Research Institute andthe School of Public Health Department of Health Behavior and Health Education. ReceivedPkD. from Wayne State University. Research interests Include adolescent alcohol andsubstance use, driving injury prevention, and school health promotion.
4Retked from the Department of Postgraduate Medicine and Health Professions Education,University of Michigan. Received Ph.D. from University of Hawaii. Research interestsfocused on school-based alcohol and substance use prevention.
117
0047-289l/97/04«M)imi2.5OT © 1S97 Plenum PuMtWag Corporation
A Longitudinal Study of Self-Esteem:Implications for Adolescent Development
Mare A. Zimmerman,1 Laurel A. Copeland,2 Jean T. Shope,3and T. E. Dlelmnn4
Received March 3, 1996; accepted May 4, 1996

grades, and alcohol use. Implications of these results for studying self-esteemand developmental change more generally are discussed.
INTRODUCTION
Self-esteem is generally regarded as the evaluation that persons makeabout themselves that expresses a self-judgment of approval, disapproval,and personal worth (Demo and Savin-Williams, 1992; Rosenberg, 1965;Suls, 1989). Researchers also suggest that a universal human desire existsto protect and enhance one's self-worth (Covington, 1984; Maslow, 1970).The role of self-esteem in adolescent development is well documented(Harter, 1990; Suls, 1989). Low self-esteem has been associated with de-pression (Harter, 1986; Reinherz et al., 1989; Rosenberg, 1965), suicide(Kazdin et al., 1983), delinquency (Bynner et al., 1981; Rosenberg et al.,1989; Wells and Rankin, 1983), substance use (Dielman et al., 1989a; Sel-now, 1985; Stacy et al., 1992), and poorer academic outcomes (Barnes andWelte, 1986; Hawkins et al., 1992; Johnston and O'Malley, 1986; Kandel,1980). Consequently, the successful development of a positive sense of self-worth may help enhance healthy outcomes or protect youth from engagingin problem behaviors.
Much of the research on adolescent self-esteem, however, has beencross-sectional (Demo and Savin-Williams, 1992). Research that has in-cluded longitudinal analysis of self-esteem change over time has producedinconsistent results. Demo and Savin-Williams (1992) report that over ex-tended periods of time "there is remarkable consistency and stability toself-concept and overall judgments of self-regard" (p. 135). They foundslight increases, however, in self-esteem from ninth to tenth grades usingboth the Rosenberg and Coopersmith measures and also peer ratings(Savin-Williams and Demo, 1984). Other investigators who have reportedchanges in self-esteem over time have also found gradual increases fromGrades 7 to 12 with no apparent decrease during the adolescent years(McCarthy and Hoge, 1982; Nottelmann, 1987; O'Malley and Bachman,1983; Rosenberg, 1986; Simmons et al., 1973). Simmons et al. (1973), how-ever, found that when transition from elementary to junior high school in-cluded a change in school context, youths' self-esteem tended to decreaseduring this period. Conversely, when school context did not change betweensixth and eighth grades, researchers have found increases in self-esteem(Demo and Savin-Williams, 1983; Simmons et al., 1979).
In longitudinal studies examining change or developmental stability,researchers have focused on average self-esteem scores for all respondentsto detect mean change over time. Developmental stability has been studied
118 Zimmerman et al.

using across-occasion correlations of a single variable measured repeatedly.Correlations of .60 are typically presented as evidence of stability over time(Simmons and Blyth, 1987). Yet, both of these approaches have seriouslimitations (Hirsch et al., 1993).
Hirsch and DuBois (1991) pointed out that these two approaches maynot be sensitive to intragroup variation. Studies of average change overtime in a sample cannot determine if evidence of no change is due to noreal change, or to the offsetting increases and decreases of individuals inthe sample on the variable of interest. Correlational studies of stability arealso limited because they typically account for less than half of the variationin the variable of interest (Dusek and Flaherty, 1981; O'Malley and Bach-man, 1983). This leaves open the possibility that subgroup differences exist.As a way to address these concerns, Hirsch and DuBois (1991) used a clus-ter analytic approach to identify subgroup variation. They found that youthcould be characterized by one of four self-esteem trajectories—consistentlyhigh, consistently low, slightly increasing, and steeply decreasing. Their re-sults suggest that self-esteem may be stable over time for some youths, butvary considerably for others.
One goal of this study was to replicate the finding of subgroup vari-ation among self-esteem trajectories reported by Hirsch and DuBois (1991).Like Hirsch and DuBois (1991), the present study also used a cluster ana-lytic approach to examine these trajectories. The sample consisted of over1000 youth from sixth through tenth grades, almost 14% of whom wereAfrican American. This study builds on Hirsch and DuBois' work in twosignificant ways. First, the sample was considerably different. They studied128 youth from a single school district. The sample in this study was larger,included more African American youth, and consisted of youth from sev-eral different communities and schools. Hirsch and DuBois (1991) recom-mended that their study be replicated with a larger, more representativesample. Second, Hirsch and DuBois' time frame for their study coveredGrades 6-8, while the current analysis extended through Grade 10.
Another goal of the study was to see if youth with different self-esteemtrajectories reported different attitudinal and behavioral outcomes. Severaltheories attempt to explain adolescent development including a storm andstress model (Offer and Offer, 1977), problem behavior theory (Jessor andJessor, 1977), and a resiliency model (Rutter, 1987; Zimmerman andArunkumar, 1994). One reason no single theory fully explains adolescentdevelopment may be that adolescents are not a developmentally homoge-neous group. Different self-esteem trajectories may correspond with differ-ent explanations of youths' response to peer influence, school performance,and engagement in problem behaviors.
Longitudinal Study of Self-Esteem 119

Positive relationships with peers have been associated with enhancedself-esteem (Hirsch and DuBois, 1991; Savin-Williams and Berdt, 1990),and rejection by peers has been associated with low self-esteem (Demoand Savin-Williams, 1992). Youth with low self-esteem may gain peer ap-proval and avoid rejection by conforming to peer norms and yielding topeer pressure. This may help them increase their positive sense of self be-cause they feel validated by their peers.
Researchers have also found that high levels of self-esteem are asso-ciated with high levels of academic achievement (Bachman and O'Malley,1984; Faunce, 1984; Rosenberg et al., 1989; Wylie, 1979). It is quite possiblethat good grades help youth maintain or develop a positive sense of self.Finally, delinquency (Harter, 1986; Reinherz et al., 1989) and alcohol anddrag use have been associated with low levels of self-esteem (Dielman etal., 1989a; Selnow, 1985; Stacy et al., 1992).
In view of this prior research, our hypotheses related to the psychoso-cial outcomes are as follows:
1. Youth with high levels of self-esteem will be less susceptible to peerpressure over time than youth with low or decreasing levels of self-esteem.
2. Better school grades will be associated with higher levels of self-esteem.
3. Alcohol use, alcohol misuse, and tolerance for deviance will begreatest among those youth with trajectories that indicate decreas-ing self-esteem.
METHODS
Sample and Procedure
The results presented represent secondary analyses conducted on datagathered as part of a large-scale project to develop, implement, and evalu-ate a school-based alcohol prevention program (Dielman et al., 1989b;Shope et al., 1992). All youth from six school districts in southeastern Michi-gan were asked to participate. The communities ranged in population sizefrom 7120 to 104,199. Youth completed questionnaires in sixth, seventh,eighth, and tenth grades. Data used in the current study were collected atthe end of each school year for sixth, seventh, and eighth grades, and atthe beginning of the school year for tenth grade. Data collection in ninthgrade was not funded. Students completed the paper and pencil question-naires in classrooms. The questionnaires for the four occasions included
120 Zimmerman et al.

demographic information, alcohol use and misuse, self-esteem, susceptibil-ity to peer pressure, grades, and tolerance for deviance.
The sixth-grade sample size was 2511; however, absence on the daythat the survey was administered, and departure from the school district,resulted in a smaller longitudinal sample. The final sample consisted of1160 youth with data for all four years. This resulted in a 46% responserate over four years. The final sample included 13.8% African Americans(n = 160) and 82.5% whites (n - 957). The remaining 3.7% (n = 43)self-identified their race as "other." The sample was approximately evenlydivided by sex (males = 585; females = 575). Sample sizes for differentanalyses were smaller than the total four-year sample because of missingdata, but no systematic differences across analyses were found. All studentsin the sample experienced school transition from elementary to junior highschool between the sixth and seventh grades. In addition, all youth movedfrom junior high school to high school between eighth and tenth grades.
Measures
Self-Esteem
Self-esteem was assessed using a shortened version of Coopersmith'sself-esteem scale (Coopersmith, 1967; Dielman et al., 1984). Kokenes(1978) conducted a factor analysis of the original scale and identified foursubstantive domains represented in the measure: global, school, peers, andfamily. Dielman et al. (1984) shortened the original scale to 17 items duringpilot testing using factor analytic techniques. The shortened version in-cluded items from all four domains: 6 global items, 4 school items, 3 peeritems, and 4 family items. Sample items included the following: "Do youlike the way you are?" "Are you proud of your school work?" "Do kidsyour age like you?" "Do you get a lot of attention at home?" Also, re-sponses for the 17-item scale were dichotomized (yes = 1/no = 0) to pre-sent youth with a forced choice. Item responses were summed to create ascale with a range of 0-17. Internal reliability of the measure was .73 insixth grade, and .77 in seventh, eighth, and tenth grades.
Susceptibility to Peer Pressure
Measures from Rachal et al. (1975) and Davies and Stacey (1972) wereused to develop a measure of susceptibility to peer pressure (Dielman etal., 1987). The 7 items in the scale used a 4-point response scale (no, prob-ably not, probably, yes). A sample item is, "If your best friend is skipping
Longitudinal Study of Self-Esteem 121

school, would you skip too?" The Items also Included other areas such asdrinking alcohol and smoking cigarettes. Cronbach alphas for Grades 6, 7,8, and 10 were .79, .84, .82, and .79, respectively. The sample means forsusceptibility to peer pressure were 10.20 (SD = 3.55) in sixth grade, 12.15(SD = 4.56) in seventh grade, 13.82 (SD = 4.87) in eighth grade, and 14.90(SD = 4.83) in tenth grade.
School Grades
Youth were asked to report their usual grades. The nine response cate-gories for this item were: mostly A's (9), mostly A's and B's (8), mostly B's(7), mostly B's and C's (6), mostly C's (5), mostly C's and D's (4), mostly D's(3), mostly D's and F's (2), and mostly F's (1). The sample means for gradeswere 7.05 (SD = 1.57) in sixth grade, 6.61 (SD = 1.59) in seventh grade,6.58 (SD = 1.64) in eighth grade, and 6.75 (SD = 1.53) in tenth grade.
Alcohol Use
Alcohol use was measured at each occasion with a composite index ofbeer, wine, and hard liquor use. Each beverage was measured with the samethree items: (1) "In the past twelve months, did you drink any (beer, wine,hard liquor)?" (2) "How often have you had a drink of (beer, wine, hardliquor) in the past twelve months?' (3) "When you drank (beer, wine, hardliquor) during the past twelve months, how many (cans, glasses, drinks) didyou usually have at one time?" The frequency item (No. 2 above) used a5-point scale (a few times a year or less to every day), and the quantity item(No. 3 above) used a 6-point scale (less than 1 to 7 or more).
Responses were recoded, multiplied, and summed across the threebeverage types to yield total drinks per week. This value was recoded intoa 7-point scale ranging from zero to 6 or more drinks per week. A score ofzero indicates no alcohol use, 1.00 represents an average past-year con-sumption of less than one drink per week, and 6.00 indicates an averageof 10 or more drinks per week (Dielman et al., 1989b). The average alcoholuse reported by the total sample was .35 (SD = .75), .52 (SD = .94), .85(SD = 1.24) and 1.43 (SD = 1.65) for Grades 6-10, respectively.
Alcohol Misuse
Alcohol misuse was measured with 10 items developed from Rachalet al. (1975) and Greenwald (1982), designed to assess problems that youth
122 Zimmerman et al.

experience as a result of drinking alcohol. The measure included problemswith peers (same- and opposite-sex friends), problems with adults (police,parents, teachers), and overindulgence (drank more than planned, sickfrom drinking). Sample items were as follows: "During the past 12 months,how many times did you get into trouble with your parents because ofdrinking?" "During the past 12 months, how many times did you get verydrank?" Responses to these Likert-scaled items were primarily bimodal, soeach item was recoded to never (0) or at least once (1) and then summed(Dielman et al., 1989b). The total sample mean at each occasion was .48(SD = 1.04), .66 (SD = 1.25), 1.10 (SD = 1.70), and 1.55 (SD = 2.03) forGrades 6-10, respectively. The Cronbach alphas for the misuse scale were.67, .68, .73, and .79 for Grades 6-10, respectively.
Tolerance for Deviance
A modified version of the tolerance for deviance measure developedby Rachal et al. (1975) was also included. Tolerance for deviance assessesa youth's judgment that specified deviant behaviors are wrong. The fiveitems were Likert scaled (very wrong to not wrong). The summary scale,ranging from 0 to 15, had Cronbach alphas of .74, .80, .83, and .82 inGrades 6-10, respectively. A low score indicates low tolerance for devianceand strong disapproval of the behaviors cited. A sample item was, "Howwrong do you think it is to smoke without your parent's permission?"Other behaviors included going to a movie instead of studying for a test,skipping school without an excuse, tearing a page out of a library book,and drinking alcohol before age 21. The sample means for tolerance fordeviance were 2.43 (SD = 2.55) in sixth grade, 3.72 (SD = 3.14) in seventhgrade, 4.83 (SD = 3.48) in eighth grade, and 6.08 (SD = 3.53) in tenthgrade.
Data Analytic Procedure
Data were analyzed in four stages. First, we conducted attrition analy-ses comparing youth with all four years of data and youth who did nothave complete longitudinal data. Second, a cluster analysis of the raw self-esteem data for all four years was performed to explore the possibility ofdifferent self-esteem trajectories within the sample. Thus, each youth hadfour data points—self-esteem scores in Grades 6, 7, 8, and 10—that wereentered in a cluster analysis. Cluster analysis is a statistical procedure thatclassifies respondents by the pattern or profile defined by their responseson specific variables (e.g., self-esteem scores from four waves of data). The
Longitudinal Study of Self-Esteem 123

profiles may differ in shape or scale. A difference in shape for longitudinaldata on the same variable might indicate that one respondent has similarvalues on all measures over time (a flat line) while another respondentmight have successively increasing values on all measures over time (asloped line). A difference in scale occurs when an individual has consis-tently higher scores as compared to another individual.
As suggested by Aldenderfer and Blashfield (1984), two randomly di-vided subsamples (approximately a 50% split) were analyzed separately tocross-validate the cluster solutions. Then, the total sample was clusteredusing initial centroids set to the weighted averages of thecentroids obtainedfrom the split-half analyses. This procedure was used for the total sampleanalysis because the split-sample results provided an empirical basis fordefining initial parameters. The number of youths who were assigned todifferent groups in the split and total sample analyses were then examinedto assess cluster stability. Two procedures were used to determine the num-ber of clusters to retain. These were (1) inspecting the change in valuesof the proximity coefficients, and (2) examining the theoretical meaning-fulness of different solutions (see Aldenderfer and Blashfield, 1984; Everitt,1980).
Ward's method, which uses squared euclidean distance as a proximitymeasure, was the clustering technique chosen to identify the initial clustersolution. Ward's method was especially suitable because it maximizeswithin-group homogeneity and between-group heterogeneity (i.e., definesgroups that are highly dissimilar from each other). We also used Ward'smethod because it does not require specification of the number of clustersas other methods (e.g., k-means) typically do. Although the study by Hirschand Dubois (1991) suggests that a four-cluster solution would be appropri-ate, we did not wish to constrain our solution based on a single study. Inaddition, enough differences existed between the studies (e.g., sample,measures) that specification of clusters might not be warranted. Finally, webelieved an effort to replicate should not impose the results from earlierwork because it would create a biased situation in which similar findingswould be more likely.
The third analytic step used chi-square analyses to explore the possi-bility that self-esteem trajectories differed by race or sex. If differences ex-isted, then a factorial design (e.g., cluster group by race or sex) would bewarranted for the next analytic step.
The fourth analytic stage used repeated measures analyses of variance(MANOVA) to examine both main effects for cluster group and interactioneffects between cluster group and time (i.e., change over time across clustergroups). We examined main effects for cluster, gender, and time, two-wayinteractions of cluster and gender by time, and three-way interactions of
124 Zimmermanet al.

duster by gender by time. Where significant MANOVA effects were found,post hoc comparisons with Duncan's correction for joint confidence inter-vals were run to pinpoint group differences. The dependent variables weresusceptibility to peer pressure, school grades, alcohol use and misuse, andtolerance for deviance.
RESULTS
Attrition Analyses
No differences were found between attrited students and those withdata for all four years for race (x2 = 2.29; ns) or gender (x2 = .14; ns).Attrited students reported more alcohol use (t = 4.16; p < .01), more al-cohol misuse (t = 5.79; p < .01), more susceptibility to peer pressure (t =3.31; p < .01), and more tolerance for deviance (t = 3.21; p < .01) thanyouth included in the study (all analyses based on sixth-grade data). At-triters also reported lower self-esteem in sixth grade than youth with datafor all four years (t — 5.51; p < .01).
Correlations Across Occasions
Table I reports the intercorrelations of the self-esteem measures foreach study year, and total sample means and standard deviations. The larg-est correlation among self-esteem measures from one year to the next is.56. The correlations between self-esteem assessments that are two or moreyears apart range from .29 to .41 and indicate decreasing temporal consis-tency with increasing passage of time.
Longitudinal Study of Self-Esteem 125
Table I. Intercorrelations of self-estandard devi
steem measuations for ea
res, total sample means, andch yeara
Grade 6
Grade 7
Grade 8
Grade 10
Grade 6
-
.53
.41
.29
Grade 7
—
.58
.38
Grade 8
—
.52
Grade 10
-
Mean
13.23
12.92
12.72
11.87
SB
2.43
2.66
2.78
2.83
aAll correlations are significant bey ond the .01level.

Cluster Analysis
The split-sample analyses resulted in two similar four-group cluster so-lutions that were theoretically meaningful and distinct. When the total sam-ple was clustered, the same four groups emerged. Group membership wasunchanged for 81% of the sample between the split-half and total-groupanalyses; instability was noted among those students with consistently highself-esteem and those with moderate and rising self-esteem. The shapesand scales of the self-esteem profiles were similar in all three analyses.Figure 1 depicts the self-esteem trajectory profiles from the total sampleand group means for each year.
One group had consistently high (n = 531; 48%), one group had mod-erate and rising (n = 204; 19%), one group had steadily decreasing (n =223; 20%) and the fourth group had consistently low self-esteem scores(n = 143; 13%). For the total sample, youths' self-esteem decreased fromsixth (X = 13.26; SD = 2.42) to tenth grades (X = 11.87; SD = 2.82;t[1130] = 14.87; p < .01). A repeated measures analysis of variance onself-esteem scores also indicated that the pattern of self-esteem change overtime (group by time interaction) differed across the four trajectory groups(F[9, 3297] = 326.53; p < .001) and that their overall level of self-esteem(main effect) also differed (F[3, 3297] = 431.77; p < .001).
Demographic Differences
African American and white youths were equally distributed acrossgroups defined by their self-esteem trajectory (x2[3] = 3.34; ns). Males andfemales, however, were not equally distributed across groups (x2[3] = 27.94;p < .01). Cell chi-square values indicated that more males (n = 124) andfewer females (n = 80) than expected were in the moderate and risingself-esteem group; conversely, more females (n = 82) and fewer males (n= 61) than expected were in the steadily decreasing group. Subsequentanalyses included a gender by trajectory factorial design.
Self-Esteem Trajectories and Longitudinal Measures
Susceptibility to Peer Pressure
A self-esteem trajectory by time interaction was found for susceptibilityto peer pressure (F[9, 3252] = 6.97; p < .01), but gender by time (F[3,3252] = .23; ns), and trajectory by gender by time (F[9, 3252] = 1.21; ns)effects were not found. Cluster (F[3, 1084] = 30.40; p < .01) and time
126 Zimmerman et at

Longitudinal Study of Self-Esteem 127

(F[3, 3252] = 429.62; p < .01) main effects were also found. The consis-tently high self-esteem group scored significantly lower at all occasions thanthe other three groups (p < .05). All post hoc differences were significantexcept moderate and rising vs. consistently low in Grades 6 and 7, moderateand rising vs. steadily decreasing in Grade 8, and steadily decreasing versusconsistently low in tenth grade. Susceptibility to peer pressure rose the leastfor the moderate and rising group, while the greatest increase over timeoccurred in the steadily decreasing group. Figure 2 displays the means atall occasions for the four self-esteem groups' susceptibility to peer pressure.
Grades
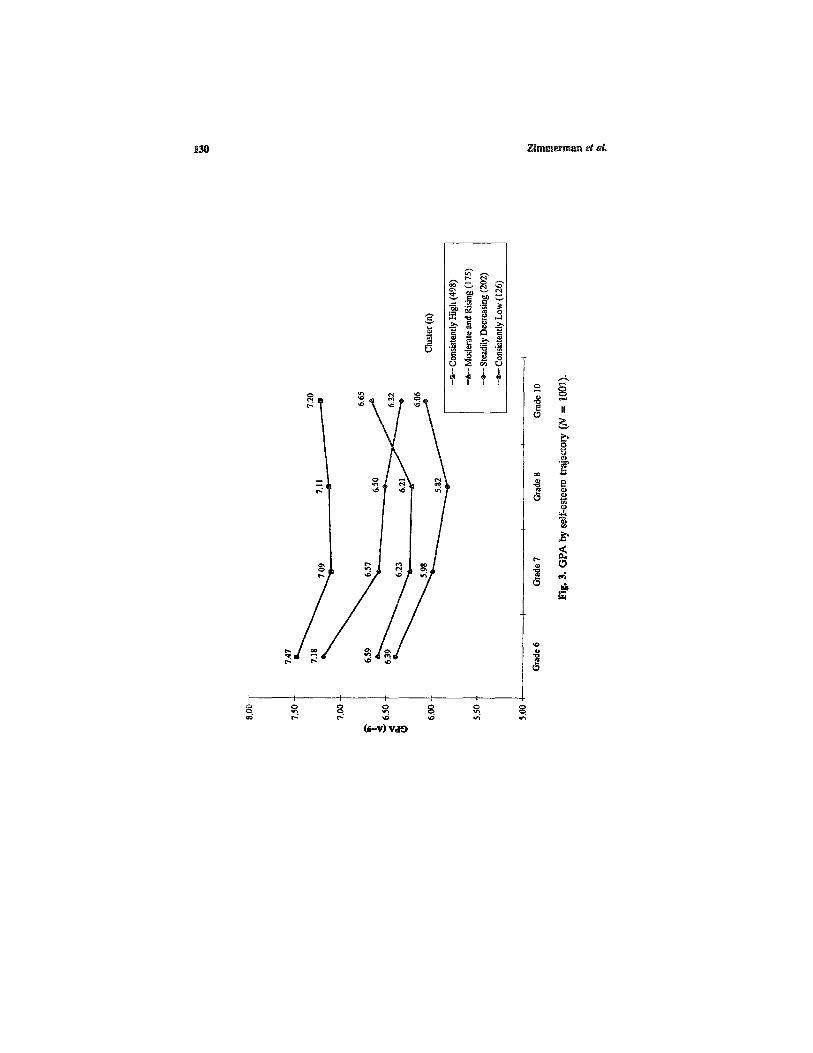
A self-esteem group by time interaction for school grades was found(F[9, 2979] = 5.37; p < .01), but the gender by time (F[3, 2979] = .66;ns) and three-way (F[9, 2979] = .88; ns) interactions were not significant.Cluster (F[3, 993] = 43.22; p < .01) and time (F[3, 2979] = 34.54; p <.01) main effects were found. Grades decreased from Grade 6 to Grade8, with various outcomes in tenth grade. All means were significantly dif-ferent except for moderate and rising vs. consistently low in sixth and eighthgrades, moderate and rising vs. steadily decreasing in eighth grade, andsteadily decreasing vs. consistently low in Grade 10, in the same patternas was seen above with susceptibility to peer pressure. The steadily de-creasing group had the greatest drop in grades from sixth to eighth grade,and the consistently high group had the smallest decrease over time. Youthin the moderate and rising group were the only ones to show an increasein grades from Grade 6 to Grade 10. Youth in the steadily decreasing groupwere the only ones to have grades decrease every year. Figure 3 reportsmean school grades over time for the self-esteem trajectory groups.
Alcohol Use
A three-way interaction (self-esteem trajectory by gender by time) wasfound for alcohol use (F[9, 2943] = 1.97; p < .05). Cluster group by timeinteraction was also found (F[9, 2943] = 5.22; p < .01), but no gender bytime interaction was found (F[3, 2943] = .63; ns). Main effects were foundfor time (F[3, 2943] = 228.74; p < .01), cluster (F[3, 981] = 14.17; p <.01) and gender (F[l, 981] = 4.56; p < .05). Thus average scores differedacross cluster and gender groups, and the change in alcohol use over timediffered across the cluster groups as well. Initially, male adolescents in themoderate and rising group reported the most alcohol use, but they weresurpassed by both males and females in the steadily decreasing and con-
128 Zimmerman et al.

Longitudinal Study of Self-Esteem 129
130 Zimmerman et al.

sistently low groups. By the eighth grade, however, male and female ado-lescents in the steadily decreasing and consistently low groups reported themost alcohol use for their respective sexes. Males in the steadily decreasinggroup had the greatest increase in alcohol use over time. Females in themoderate and rising group and males in the consistently high group hadthe least increase in alcohol use over time. Generally, the higher levels ofreported drinking occurred among males and in those groups reporting lowself-esteem. Figure 4 depicts the means for males and females in eachgroup over time.
Alcohol Misuse
Both self-esteem trajectory by time (F[9, 3150] = 5.29; p < .01) andgender by time interactions (F[3, 3150] = 4.76; p < .01) were found foralcohol misuse. A three-way interaction was not found (F[9, 3150] = .76;ns). Main effects for time (F[3, 3150] = 137.13; p < .01) and cluster (F[3,1050] = 11.11; p < .01) were also found. Figure 5 reports the group meansover time for alcohol misuse. The pattern of results are similar to thosefor susceptibility to peer pressure and grades. The steadily decreasing groupreported the greatest increase in alcohol misuse over time, but in Grade6 they started at the same level as the consistently high group. Interestingly,the consistently low and moderate and rising groups also started at thesame place, but diverged over time. The moderate and rising group re-ported the smallest increase over time, and the consistently high group re-ported the lowest levels of misuse at every point in time.
Tolerance for Deviance
A self-esteem group by time interaction for tolerance for deviance wasfound (F[9, 3162] = 4.94; p < .01), but no gender by time (F[3, 3162] =1.43; ns) or three-way interaction (F[9,,3162] = .60; ns) effects were seen.Cluster (F[3, 1054] = 16.83; p < .01) and time (F[3, 3162] = 380.0; p <.01) main effects were found. All youth became more tolerant of devianceover time, but higher levels of self-esteem were associated with lower tol-erance of deviance. Significant differences (p < .05) were found betweenthe more extreme pairs of means at each occasion. The consistently highgroup reported the least tolerance for deviance in each grade as comparedto all the other groups but the moderate and rising. The pattern of changefor each group was similar to that for alcohol misuse. Figure 6 reports themeans and standard deviations over time for each group.
Longitudinal Study of Self-Esteem 131

132 Zimmerman et al.

Longitudinal Study of Self-Esteem 133
Fig. 5. Alcohol misuse by self-esteem trajectory (N = 1058).
DISCUSSION
The current study replicated findings reported by Hirsch and DuBois(1991). In fact, it is remarkable how similar the self-esteem trajectories werein our study and the Hirsch and DuBois (1991) study in spite of the factthat we used different measures of self-esteem, the samples are quite dif-ferent, and our clustering algorithm differed. Our largest self-esteem group,as in Hirsch and DuBois (1991), comprised youth with consistently highself-esteem. Similarly, our smallest group included those youth with lowself-esteem, although in our sample, this group also displayed steadily fall-ing levels of self-esteem. This difference from the Hirsch and Dubois (1991)study may well be attributed to the fact that our study included self-esteemassessment in tenth grade, but most of the decrease occurred from sixthto eighth grade. It is also possible that this difference is due to the factthat we did not use the same self-esteem measures. Both studies, however,revealed a group of youth who show a steady decline in their self-esteemover time, and a group that show an increase in self-esteem over time.

134 Zimmerman et al.

The results also provide additional evidence that whether self-esteemchanges over time may not be of primary concern; rather, how individualdifferences in changing adolescent self-esteem arise may be more vital. Ex-ploration of subgroup variation may be useful for determining how differentpatterns of change in self-esteem influence and are influenced by otherdevelopmental outcomes.
Revisiting our hypotheses for psychosocial outcomes, the groups dif-fered in both their average score (main effect) and their change in scoresover time (Time x Dependent Variable interaction effect). The followingsupport was found for them:
1. Youth with high levels of self-esteem will be less susceptible to peerpressure over time than youth with low or decreasing levels of self-es-teem. Youth in the consistently high and moderate and rising groupsreported less susceptibility to peer pressure over time than youthwith consistently low or decreasing self-esteem. The rate of changefor susceptibility to peer pressure was the lowest for youth in themoderate and rising group.
2. School grades will be correlated positively with self-esteem trajectories.Grades decreased for all groups through Grade 8, but the steadilydecreasing group also reported the greatest decrease in grades overtime. The consistently high group not only reported the highestgrades at each point in time, but also had the smallest drop ingrades over time.
3. Alcohol use, alcohol misuse, and tolerance for deviance will be greatestamong those youth with trajectories that indicate decreasing self-es-teem, and least among those with high self-esteem. Youth in the con-sistently high and moderate and rising groups reported lesstolerance for deviance, alcohol use, and alcohol misuse over timethan youth with consistently low or decreasing self-esteem. Themoderate and rising group consistently reported less increase inthese measures than the other groups. Main effects for clustergroup were also found. The consistently high group reported thelowest levels of each of these measures.
This study suggests that overall trends of self-esteem (either stable,increasing, or decreasing) may not adequately characterize the typical ado-lescent experience. In fact, the results are not consistent with earlier reportsthat self-esteem is either relatively stable during adolescence or increasesslightly from Grades 7 to 12 (McCarthy and Hoge, 1982; Nottelmann, 1987;O'Malley and Bachman, 1983; Rosenberg, 1986; Savin-Williams and Demo,1984). Self-esteem in this sample actually declined slightly from Grade 6to Grade 10. The results, however, are consistent with Alsaker and Olweus
Longitudinal Study of Self-Esteem 135

(1992), who found that self-esteem was relatively stable for short periodsof time (up to a year), but changed over longer periods (3 years) amongearly adolescents. Studying how change occurred for subgroups of adoles-cents enables researchers to distinguish between no change in self-esteemand the countervailing effects of increasing and decreasing scores.
African American and white youth were equally distributed across theself-esteem groups. Although the number of African Americans in the sam-ple was small, it corresponded with the proportion found in the generalpopulation. Nevertheless, future research should include a more diversesample in order to adequately explore possible race differences includingLatino, Asian American, and other ethnic groups. Perhaps more to thepoint, studying youth from varying socioeconomic backgrounds may bemore informative than simply examining race differences. Our results areconsistent with previously reported gender differences (Eccles, 1984; Sim-mons and Blyth, 1987). More female adolescents reported decreasing self-esteem trajectories than male adolescents and vice versa for increasingself-esteem. This seems to support findings by Eccles and Midgley (1990),who indicated that females were more likely than males to report a declinein self-esteem as a consequence of school transition. Youth in our sampleactually experienced two school transitions during the course of the study.
The longitudinal analyses suggest that self-esteem trajectory was re-lated to alcohol use differently for male adolescents than for female ado-lescents. Female adolescents in the consistently high self-esteem group hada level of increase in alcohol use similar to that of females in the steadilydecreasing group. Yet, males in these two groups were very different intheir use over tune. The timing of alcohol use increase among adolescentswith low or decreasing self-esteem also differed for males and females. Fe-males had their largest jump in Grade 8, while males' largest jump occurredin Grade 10. Females may use alcohol to maintain high self-esteem in theirsocial context, while males may use alcohol to cope with their decline inself-esteem. These interpretations are cautiously made, however, becausewe did not examine the causal direction among the variables studied.
The results suggest that a single model to describe adolescent devel-opment may inhibit the discovery of meaningful differences among adoles-cents. Findings from youth whose self-esteem steadily declines over timemay support a storm and stress model (Offer and Offer, 1977) of adoles-cence because they may not be effectively negotiating developmental ex-periences. A storm and stress model, however, may not be applicable toyouth with consistent self-esteem trajectories (either high or low). Youthwith consistently low self-esteem appear to fit a problem behavior model(Jessor and Jessor, 1977) in which adolescents exhibit multiple deleterious
136 Zimmerman et al.

behaviors and beliefs (e.g., alcohol use and misuse, low grades, suscepti-bility to peer pressure).
Youth with either consistently high or rising self-esteem may fit a re-siliency model (Rutter, 1987; Zimmerman and Arunkumar, 1994) whereinthey develop the skills and psychological resources necessary to cope withstressors experienced as part of their adolescence. For this group of ado-lescents, self-esteem may enhance the effects of other psychosocial factors,such as parental nurturance, in preventing detrimental outcomes (e.g., sub-stance abuse). This process has been referred to as a protective/protectivemechanism (Brook et al., 1992). Alternatively, self-esteem may be part ofa risk/protective mechanism (Brook et al., 1992) wherein the protective fac-tor (e.g., self-esteem) helps limit the potential negative effects of a riskfactor (e.g., family discord, peer pressure).
The interaction effects found for trajectory and time for all dependentvariables suggest a protective role of self-esteem. Every group experiencedan increase in susceptibility to peer pressure, for example, but the steadilydecreasing self-esteem group reported a faster increase. Self-esteem mayhelp limit the development of susceptibility to peer pressure, which hasbeen found to be a risk factor for problem behaviors (Dielman et al., 1992).Most strikingly, youth with increasing self-esteem also tended to show thegreatest improvement or least decline over time for all outcomes measured.Studies that explore the protective-protective and risk-protective mecha-nisms among youth with rising or consistently high self-esteem would beuseful.
The most striking effects of self-esteem change over time were foundfor the two groups that had either improving self-esteem (moderate andrising) or declining self-esteem (steadily decreasing). These two groupsoften started at a similar point, but went in the opposite direction for everydependent variable assessed except grades. The results of grades, however,for these two groups were even more divergent. The two groups essentiallyswitched places in high school for grades. These results suggest that effortseither to prevent and stabilize decreasing self-esteem or to build self-esteemmay have vital effects on other outcomes for youth. Hirsch et al. (1993)suggest that how self-esteem change relates to other negative outcomes maybe useful for understanding risk. This knowledge can then be used to focusresources on the group most likely to experience problem behaviors.
Prevention efforts may also have varying effects for youth with differ-ent self-esteem trajectories (Hirsch et al., 1993). Perhaps the notion thatone program design fits all is obsolete. One strategy might reach youthwith steadily decreasing self-esteem, while a different approach would bemore effective for youth with rising self-esteem. Limited resources may bemore effectively allocated as a result, taking fewer resources to reach youth
Longitudinal Study of Self-Esteem 137

with rising self-esteem and more resources to reach those on a downwardtrajectory.
Study Limitations
One limitation of the study is that self-report data were the only sourceof data available for analysis. This raises the unresolved issue of sharedmethod variance among the study variables. A related issue is that our tol-erance of deviance measure refers to an attitude about deviance and notdeviant (or delinquent) behavior. Future research could benefit from in-cluding behavioral measures for several problem behaviors such as delin-quency and assaultive violence.
Another limitation is that the split-half and total sample cluster solu-tions had only 81% agreement. This raises some question about the stabilityof the self-esteem trajectories identified in the study. The limitation is offsetby several points. First, the shapes of the profiles in the two split-half andfinal solutions were similar. Although some youth had profiles that wereborderline to two groups, the underlying patterns of self-esteem remainedthe same. Second, most disagreement between solutions occurred betweenthe consistently high and moderately increasing groups. In other words, themovement from one group to another was subtle, and probably a result ofthe clustering algorithm. Ward's method adjusts the group centroid as newcases are assigned and then uses that new information for assignment ofthe next case. Thus, respondents with values that are between two centroidseries may be assigned to different groups depending on who was enteredbefore them. Third, the cluster solution replicated previous research. Thesimilarity of the split-half and final trajectories to the Hirsch and DuBois(1991) findings (which resulted from a different clustering algorithm) sug-gests that the longitudinal self-esteem profiles found in this study accuratelycharacterize self-esteem patterns in early to middle adolescence.
Finally, the attrition analyses suggest that our data are not repre-sentative of all youth in the schools studied. That attriters reported lowerself-esteem also had the effect of reducing membership in trajectories char-acterized by a low initial self-esteem level. The omission of some youthwith low self-esteem in sixth grade may have made it more difficult to rep-licate trajectory results due to restricted range for defining self-esteemgroups. In addition, less variance in the trajectory groups may also havemade it more difficult to detect group and tune differences, although theresults suggest otherwise because they replicate previous research.
In sum, we concur with conclusions drawn by both Hirsch and DuBois(1991) and Simmons and Blyth (1987) that longitudinal analysis will benefit
138 Zimmerman et al.

from innovative and diverse methods, such as the one reported here. Acluster analytic approach may provide useful information about develop-mental change. It allows for the possibility of discovering intergroup vari-ation in a sample and avoids problems associated with studying averagechange over time. This strategy provides an opportunity to identify howdifferent models of adolescent development may be applicable for differentyouth. Consequently, the search for a global model of adolescent develop-ment may be modified to an analysis of which model is more appropriatefor a given subset of youth.
ACKNOWLEDGMENTS
The authors would like to thank David DuBois and the anonymousreviewers for their helpful and thoughtful comments on earlier drafts ofthis article.
REFERENCES
Aldenderfer, M. S., and Blashfield, R. K. (1984). Cluster Analysis. Sage, Newbury Park, CA.Alsaker, F. D., and Olweus, D. (1992). Stability and global self-evaluations in early adoles-
cence: A cohort longitudinal study. /. Res. Adolesc. 47: 123-145.Bachman, J. G., and O'Malley, P. M. (1984). Black-white differences in self-esteem: Are they
affected by response style? Am. J. Social, 90: 624-639.Barnes, G. M., and Welte, J. W. (1986). Patterns and predictors of alcohol use among 7-12th
grade students in New York State. J. Studies Alcohol 47: 53-60.Brook, J. S., Whiteman, M., Cohen, P., and Tanaka, J. S. (1992). Childhood precursors of
adolescent drug use: A longitudinal analysis. Genet. Social Gen. Psychol. Monogr. 118:195-213.
Bynner, J. M., O'Malley, P. M., and Bachman, J. C. (1981). Self-esteem and delinquencyrevisited. J. Youth and Adolesc. 10: 407-441.
Coopersmith, S. (1967). The Antecedents of Self-Esteem. W. H. Freeman, San Francisco.Covington, M. (1984). The motive for self-worth. In Ames, R., and Ames, C. (eds.), Research
on Motivation in Education, Vol. 1, Student Motivation. Academic Press, New York.Davies, J., and Stacey, B. (1972). Teenagers and Alcohol: A Developmental Study in Glasgow.
Office of Population Censuses and Surveys, Social Survey Division, London.Demo, D. H., and Savin-Williams, R. C. (1983). Situational and transnational determinants
of adolescent self-feelings. J. Personal Social Psychol 44: 824-833.Demo, D. H., and Savin-Williams, R. C. (1992). Self-concept stability and change during ado-
lescence. In Lipka, R. P., and Brinthaupt, T. M. (eds.), Self-Perspectives Across the LifeSpan. State University of New York Press, New York.
Dielman, T. E., Campanelli, P. C, Shope, J. T., and Butchart, A. T. (1987). Susceptibility topeer pressure, self-esteem, and health locus of control as correlates of adolescent sub-stance abuse. Health Educat. Quart. 14: 207-221.
Dielman, T. E., Kloska, D. D., Leech, S. L,, Schulenberg, J. E., and Shope, J. T. (1992).Susceptibility to peer pressure as an explanatory variable for the differential effectivenessof an alcohol misuse prevention program in elementary schools. J. School Health 62:233-237.
Longitudinal Study of Self-Esteem 139

Dielman, T. E., Leech S. L., Lorenger A. T., and Horvath W. 1. (1984). Health locus ofcontrol and self-esteem as related to adolescent health behavior and intentions. Adoles-cence. 19: 935-950.
Dielman, T. E., Shope, J. T., Butchart, A. T., Campanelli, P. C, and Caspar, R. A. (1989a).A covariance structural model test of antecedents of adolescent alcohol misuse and aprevention effort. J. Drug Educat. 19: 337-361.
Dielman, T. E., Shope, J. T., Leech, S. L., and Butchart, A. T. (1989b). Differential effec-tiveness of an elementary school-based alcohol misuse prevention program by type ofprior drinking experience. /. School Health 59: 255-263.
Dusek, J. B., and Flaherty, J. F. (1981). The development of self-concept during the adolescentyears. Monogr. Society Res. Child Develop. 46: (Serial No. 191).
Eccles, J. (1984). Sex differences in achievement patterns. In Sonderegger, T. (ed.), NebraskaSymposium on Motivation (Vol. 32). University of Nebraska Press, Lincoln.
Eccles, J., and Midgley, C. (1990). Changes in academic instruction and self-perception duringearly adolescence. In Montemayer, R., Adams, G. R., and Gullotta, R. P. (eds.), FromChildhood to Adolescence: A Transitional Period? Sage, Newbury Park, CA.
Everitt, B. (1980). Cluster Analysis. Halsted, New York.Faunce, W. A. (1984). School achievement, social status, and self-esteem. Social Psychol. Quart.
47: 3-14.Greenwald, M. A. (1982). Minimizing Alcohol Problems and Smoking: Final Report Year II.
University of Pittsburgh, Pittsburgh, PA.Harter, S. (1986). Cognitive-developmental processes in the integration of concepts about
emotions and the self. Social Cogn. 4: 119-151.Harter, S. (1990). Self and identify development. In Feldman, S. S., and Elliott, G. R. (eds.),
At the Threshold: The Developing Adolescent. Harvard University Press, Cambridge, MA.Hawkins, J. D., Catalano, R. F., and Miller, J. Y. (1992). Risk and protective factors for
alcohol and other drug problems in adolescence and early adulthood: Implications forsubstance abuse prevention. Psychol. Bull. 112: 64-105.
Hirsch, B. J., and DuBois, D. L. (1991). Self-esteem in early adolescence: The identificationand prediction of contrasting longitudinal trajectories. J. Youth Adolesc. 20: 53-72.
Hirsch, B. J., DuBois, D. L., and Brownell, A. B. (1993). Trajectory analysis of the transition tojunior high school: Implications for prevention and policy. Prevent. Human Serv. 10: 83-101.
Jessor, R., and Jessor, S. L. (1977). Problem Behavior and Psychosocial Development: A Lon-gitudinal Study of Youth. Academic Press, New York.
Johnston, L. D., and O'Malley, P. M. (1986). Why do the nation's students use drugs andalcohol: Self-reported reasons from nine national surveys. J. Drug Issues 16: 29-66.
Kandel, D. B. (1980). Drug and drinking behavior among youth. Ann. Rev. Sociol. 6: 235-285.Kazdin, A. E., French, N. H., Unis, A. S., and Esveldt-Dawson, K. (1983). Helplessness, de-
pression, and suicide intent among psychiatrically disturbed inpatient children. J. Consult.Clin. Psychol. 51: 504-510.
Kokenes, B. (1978). A factor analytic study of the Coopersmith self-esteem inventory. Ado-lescence 49: 149-155.
Maslow, A. (1970). Motivation and Personality (rev. ed.). Harper, New York.McCarthy, J., and Hoge, D. (1982). Analysis of age effects in longitudinal studies of adolescent
self-esteem. Develop. Psychol 18: 372-379.Nottelmann, E. D. (1987). Competence and self-esteem during transition from childhood to
adolescence. Develop. Psychol. 23: 441-450.Offer, D., and Offer, J. (1977). From Teenage to Young Manhood. New York, Basic Books.O'Malley, P. M., and Bachman, J. G. (1983). Self-esteem: Change and stability in adolescent
self-concept between the ages 13 and 23. Develop. Psychol. 19: 257-268.Rachal, J. V., Williams, J. R., Brehm, M. L., Cavanaugh, E., Moore, R. P., and Eckerman,
W. C. (1975). A National Study of Adolescent Drinking Behavior, Attitudes, and Correlates:Final Report. NIAAA, Rockville, MD.
Reinherz, B. Z., Stewart-Berghauer, G., Pakiz, B., Frost, A. K., Moeykens, B. A., and Holmes,W. M. (1989). The relationship of early risk and current mediators to depressive symp-tomatology in adolescence. J. Am. Acad. Child Adoles. Psychiat. 28: 942-947.
140 Zimmerman et al.
Rosenberg, M. (1965). Society and the Adolescent Self-Image. Princeton University Press,Princeton, NJ.
Rosenberg, M. (1986). Self-concept from middle childhood through adolescence. In Suls, J.,and Greenwald, A. G. (eds.), Psychological Perspectives on the Self. Earibaum, Hillsdale,NJ.
Rosenberg, M., Schooler, C, and Schoenbach, C. (1989). Self-esteem and adolescent prob-lems: Modeling reciprocal effects. Am. Sociol. Rev. 54: 1004-1018.
Rutter, M. (1987). Psychosocial resilience and protective mechanisms. Am, J. Orthopsychiat.57: 316-331.
Savin-Williams, R. C, and Berdt, T. J. (1990). Friendships and peer relations during adoles-cence. In Feldman, S. S., and Elliott, G. R. (eds.), At the Threshold: The Developing Ado-lescent. Harvard University Press, Cambridge, MA.
Savin-Williams, R. C, and Demo, D. H. (1984). Developmental change and stability in ado-lescent self-concept. Develop. Psychol, 20: 1100-1110.
Selnow, G. W. (1985). Using a stratified approach in substance intervention and preventionprograms among adolescents: An empirical analysis. /. Drug Educat. 15: 327-341.
Shope, J. T., Dielman, T. E., Butchart, A. T., Campanelli, P. C, and Kloska, D. D. (1992).An elementary school-based alcohol misuse prevention program: A follow-up evaluation.J. Studies Alcohol. 53: 106-121.
Simmons, R. G., and Blyth, D. A. (1987). Moving Into Adolescence: The Impact of PubertalChange and School Context. Aldine de Gruyter, New York.
Simmons, R. G., BIyth, D. A., Van Cleave, E. F., and Bush, D. M. (1979). Entry into earlyadolescence. Am. Sociol. Rev. 44: 948-967.
Simmons, R. G, Rosenberg, F., and Rosenberg, M. (1973). Disturbance in the self-image atadolescence. Am. Sociol. Rev. 38: 553-568.
Stacy, A. U., Newcomb, M. D., and Bentler, P. M. (1992). Interactive and higher-order effectsof social influences on drug use. J. Health Social Behav. 33: 226-241.
Suls, J. (1989). Self-awareness and self-identity in adolescence. In Worell, J., and Danner, F.(eds.), The Adolescent Decision-Maker. Academic Press, New York.
Wells, E. L., and Rankin, J. H. (1983). Self-concept as a mediating factor in delinquency.Social Psychol Quart. 46: 11-22.
Wylie, R. C. (1979). The Self Concept: Theory and Research on Selected Topics, Volume 2.University of Nebraska Press, Lincoln.
Zimmerman, M. A., and Arunkumar, R. (1994). Resiliency research: Models, issues, and policyimplications. Social Policy Rep. 8: 1-18.
Longitudinal Study of Self-Esteem 141