a life-course perspective on ethnic differences in women’s...
TRANSCRIPT

www.ccsr.ac.uk
A life-course perspective on ethnic differences in women’s economic activityin Britain
CCSR Working Paper 2005-08 Angela Dale, Joanne Lindley, Shirley Dex [email protected]
Research on women’s employment has demonstrated greater differentials between ethnic groups than for men, with economic activity highest for Black women and lowest for Pakistani and Bangladeshi women. Unemployment is higher for all minority ethnic groups than for white women (Table 1). How do we explain these differences and how are they changing across generations and over time? This paper will focus on explaining differences in economic activity between the white, Black Caribbean/Black other, Indian and Pakistani and Bangladeshi groups. A revised version of this paper will be published in the European Sociological Review, vol 22, no.3 (July 2006). Abstract: web page on esr.oxfordjournals.org or PDF.

A life-course perspective on ethnic differences in women’s economic activity in
Britain
Angela Dale, Centre for Census and Survey Research, University of Manchester
Joanne Lindley, Department of Economics, University of Sheffield
Shirley Dex, Institute of Education, University of London
Acknowledgements
We are grateful to the Leverhulme Trust for funding this research and to the Office for
National Statistics and the Economic and Social Data Service for making available the
data from the Quarterly Labour Force Survey.
We would like to thank Ken Clark, Ludi Simpson, Susan Kirkham and David Drew
for valuable comments on an earlier draft as well as two anonymous referees.
Contact: Angela Dale, CCSR, Crawford House, University of Manchester,
Manchester M13 9PL
Email: [email protected]
Phone: 0161-275-4891
21/11/2005
8,900 words
1

Abstract
A life-stage perspective on ethnic differences in women’s economic activity in
Britain
This paper examines the relationship between family formation, qualifications and
employment for women from white and minority ethnic groups using a lifecourse
approach. Cross-sectional data from the British Quarterly Labour Force Survey for
1992-2003 were used to estimate the relationships.
There are major differences between ethnic groups in the likelihood of being
economically active, after controlling for life-course and level of qualifications. These
are greatest for Pakistani and Bangladeshi women and least for Black Caribbean
women. However, predicted probabilities of being economically active are very
similar – over 90% - for all young women (19-34) with a degree level qualification
who have neither partner nor child.
For all women, rates of economic activity are lower with young children, but again
vary between ethnic groups. Employment patterns for Black Caribbean women are
consistent with economic migration and norms of motherhood that encompass both
roles of bread-winner and parent. In contrast, Pakistani and Bangladeshi women’s
patterns of economic activity reflect a strongly gendered division of labour where
motherhood is associated with full-time care for children.
2

A life-course perspective on ethnic differences in women’s economic activity in
Britain
1. Introduction
Much research on ethnic differences in employment in the UK has shown not just the
extent of inequalities but also the variation between ethnic groups (Berthoud, 2002;
Blackaby et al, 2002). Research on women’s employment has demonstrated greater
differentials between ethnic groups than for men, with economic activity highest for
Black women and lowest for Pakistani and Bangladeshi women. Unemployment is
higher for all minority ethnic groups than for white women (Table 1). How do we
explain these differences and how are they changing across generations and over
time? This paper will focus on explaining differences in economic activity between
the white, Black Caribbean/Black other, Indian and Pakistani and Bangladeshi groups.
These provide marked contrasts and represent the largest ethnic groups in Britain.
Longitudinal analysis has shown that UK women’s employment is strongly influenced
by both life-stage and cohort – and both are mediated by level of qualifications (Dex
et al, 1998; Dex and Joshi, 1996; Macran et al, 1996; Elliott et al, 2001). Theories that
explain women’s labour market behaviour focus on norms and assumptions that apply
to white women - for example, the division of labour within the household - but
differences between ethnic groups are rarely identified or explained. Qualifications
are recognised as playing an important explanatory role in the rise in women’s labour
market participation in recent decades, particularly amongst women with young
children. However, there has been little systematic analysis of employment
3

differences across the life-course for women from minority ethnic groups - in part
explained by the lack of longitudinal data in the UK that can provide a true life-course
analysis for minority ethnic groups. This paper uses the best evidence available –
repeat cross-sections of data from the Labour Force Survey (Office for National
Statistics, 2003) for Britain for 1992-2003 – to conduct a quasi-life course analysis of
variation in economic activity between ethnic groups.
In section two we set out a life course framework which brings together historical
experiences, cultural norms and expectations and individual agency. In section three
we introduce the data source, the way in which key variables are measured and
operationalised and the methods of analysis. The analysis is then discussed in two
separate sections. Section four provides the results from multivariate logistic models
that report predicted probabilities of economic activity for women at key life course
stages and with different levels of qualification. Following this descriptive analysis
we then define and test a series of theoretically derived hypotheses based on expected
relationships for specific ethnic groups. The final section draws some conclusions.
2. Life course framework
The life course paradigm set out by Giele and Elder (1998) provides an appropriate
explanatory framework within which to locate the analysis. Giele and Elder (1998:10)
define three key elements: location in time and place, that includes the cultural
background experienced by individuals; linked lives, referring to family norms and
cultural expectations, for example with respect to women’s roles concerning
employment and child-care; and individual agency - the decisions that an individual
makes and the priority that they give to different aspects of the lives, for example
4

decisions concerning education, employment and family formation. All these are
intimately linked and are therefore discussed together below.
2.1 Location in time and place
The main minority ethnic groups in Britain have very different locations in terms of
time and place. This is particularly evident in the timing and reasons for migration.
Thus Black Caribbean women not only came to Britain as economic migrants but
generally did so in the 1950s and early 1960s in response to a demand for labour that
could not be met by the existing UK work-force. For example, the expanding post-war
National Health Service directly recruited workers from Jamaica and the West Indies.
The ‘Black Other’ group, tend to be young and many are the children of Black
Caribbean marriages or of mixed parentage or mixed partnerships (Dale and
Holdsworth, 1997).
South Asian migrants are relatively recent settlers but with significant differences in
timing of migration between the key groups. The long association between India and
Britain means that many Indians have close links with the UK. East African Indians,
many expelled from Uganda in the 1960s, came to Britain with experience of running
businesses and with educational assets. The Pakistani and Bangladeshi population are
more recent migrants, many coming from poor rural areas of Mirpur and Syllhet with
few economic or educational resources. South Asian men came to Britain in the early
1960s to take jobs that were not attractive to white men – often in the declining
industrial areas of north-west England (Kalra, 2000). Women usually came to Britain
as dependents, from a culture where they were responsible for domestic life and men
were the bread-winners. The UK’s 1962 Commonwealth Immigrants Act imposed
5

very severe restrictions on movement between Britain and the Asian sub-continent
and thus encouraged families to form permanent homes in Britain (Ansari, 2004). The
vast majority of adults of Pakistani, Bangladeshi and Indian origin were therefore
born overseas, although a growing generation of young people are UK-born (Lindley
et al, 2004).
2.2 Family norms and expectations: life course influences on employment
In the 1950s it was still seen as an ‘ideal’ for women in the UK to give up work when
they got married (Dex, 1985). However, by the 1970s it was child-bearing rather than
marriage that interrupted women’s labour market activity. Britain was distinctive by
comparison with most other European countries, in that women’s employment was
strongly related to the age of the youngest child. Although this relationship is still
present, it is much more muted than in the past. For example, 55% of working age
women with children under 5 were in the labour market in 2003 and 73% of those
whose youngest child was aged 11-15 (ONSb, 2004). Better qualified women are
much more likely to be in work and working full-time than those with few or no
qualifications. Cohort comparisons show that women with few or no qualifications
have increased their labour market attachment much less in recent decades and are
much more likely to be working part-time than women with degree-level
qualifications (Dex and Joshi, 1996; Dex et al, 1998; Elliot et al, 2001). This has led
to a widening differential in the rates of women’s employment and in the returns to
employment. One aspect of this change has been a marked increase in employment
amongst women with degree-level qualifications and young children. The relationship
between qualifications and employment is likely to be influenced by a reduction in the
gender pay gap for full-time employees in the UK from 28% in 1982 to 18% in 2004
6

(Perfect and Hurrell, 2003; Equal Opportunities Commission, 2004) which has
increased the opportunity cost of giving up work for women with higher earnings.
The relationship between economic activity and the presence of dependent children
varies by whether or not women have a partner. Partnered mothers are much more
likely to be economically active than lone mothers (Summerfield and Babb, 2004).
Lone motherhood has increased steadily in recent decades in the UK and the lower
rates of economic activity for lone mothers have led to a succession of policy
measures to enable parents, and particularly lone parents, to take employment. These
have included welfare-to-work initiatives, in-work financial support and increased
availability of affordable childcare.1 Between 1994 and 2004, employment rates for
UK lone parents rose from 42% to 54% and for married or cohabiting mothers from
64% to 71% (Walling, 2005). However, this description of changing family forms and
their relationship with employment does not reveal the very marked differences
between ethnic groups.
Black Caribbean and Black Other women are much less likely to be in a partnership
than other ethnic groups and also have much higher rates of lone parenthood. This is
also evident in the USA and is often explained as a legacy of the effect of slavery on
family cohesion (Giele, 1998). Only 39% of Black Caribbean women in the UK aged
19-60 were married or cohabiting in 2000-2, compared with 74% of Pakistani and
Bangladeshi women, 73% of Indian women and 68% of white women (Lindley et al,
2004). In the same time period, 24% of Black Caribbean women aged 19-60 were
lone parents compared with 7% of white women and only 2% for Indian women
(Lindley et al, 2004). Thus the association between partnership and children is much
7

looser for black women than for white women and is consistent with black women’s
settlement in the UK as economic migrants, discussed above. Duncan and Irwin
(2004: 394) found that Black Caribbean mothers are more likely to see ‘substantial
hours in employment as a built-in component of good mothering’ and to take it for
granted that they have primary responsibility for family life and child-care (Duncan et
al, 2003). Black Caribbean women are also better qualified than their male
counterparts. In 2002/3 they outnumbered men by 2:1 as entrants to first degree
courses and Black Caribbean/Black Other women are more likely to have degree level
qualifications than white women (Lindley et al, forthcoming).
By contrast, South Asian families traditionally have strongly demarcated gender roles,
reinforced by a belief in the importance of the family and of the role of a mother in
bringing up children. Extended families may provide economic assistance and care for
elders and other family members. Pakistani and Bangladeshi women traditionally
marry at an early age and have larger families than women in other ethnic groups -
16% and 18% respectively of women aged 19-60 had three or more children under 16
in 2000-2 compared with 4% of white women and 4% of Indian women (Lindley et
al, 2004). However, figures for Pakistani and Bangladeshi women represent a
substantial decline in family size by comparison with a decade earlier (Lindley et al,
2004). Although family size contrasts greatly between Indian and Pakistani and
Bangladeshi women, rates of cohabitation are uniformly low and show no sign of
increasing over time (Lindley et al, 2004). The rate of lone motherhood is also very
low in all South Asian groups and is usually because of widowhood rather than pre-
marital conception or divorce.
8
Indian women differ from Pakistani and Bangladeshi women in the circumstances and
timing of their migration and are more likely to be Hindu or Sikh than Muslim in their
religious affiliation. Although family norms may be seen as traditional, Indian women
have degree level qualifications (in recent years) on a par with Black Caribbean
women and slightly higher than white women (Lindley et al, forthcoming).
Nonetheless, there is no evidence that Indian women’s level of education and thus
earnings potential, is associated with a loosening of the link between marriage and
child-bearing. Pakistani and Bangladeshi women are much less likely to have degree
level qualifications (only 13% of women aged 22-60 in 2000-3) and only 45% of UK
entrants to under-graduate study in 2002/3 were female. Nonetheless, these groups
recorded the greatest increase in entry to undergraduate courses between 1994/5 and
1998/9 and a rising proportion of female applicants (Dale et al, 2002).
These ethnic groups – white, black, Indian and Pakistani and Bangladeshi – show
marked contrasts despite living in the same country and therefore experiencing the
same institutional framework. Pakistani and Bangladeshi women may be
characterised as having the most traditional family life and we thus expect them to
show the greatest differences between older women who were first generation settlers,
often with little or no formal education and younger women who have experienced a
UK education and upbringing. Indian women, despite sharing some cultural norms
with Pakistani and Bangladeshis, have many similarities with white women. Also,
Indian women’s relatively high levels of education and employment do not seem to be
associated with the decline in two-parent families evident for white women. Black
Caribbean and white women also share similarities with respect to levels of education
and rates of employment, but Black Caribbean women are much less likely to be
9

partnered, with lone motherhood much more frequent than partnered motherhood.
Thus within the same societal structure there is evidence not just of different family
norms and different levels of education between ethnic groups but a suggestion of
differences in how women’s rates of economic activity relate to family and education.
In this paper we report both descriptive analyses and hypothesis testing to try to
increase our understandings of these complex relationships.
3. Data, variables and methods
3.1 The data source: The Quarterly Labour Force Survey (QLFS)
The Quarterly Labour Force Survey is conducted by the Office for National Statistics
and available for academic use through the UK Data Archive. Since 1992 the
Quarterly LFS (QLFS) has conducted repeat interviews at each sampled address at
three monthly intervals with the fifth interview taking place a year after the first. Each
quarter, interviews are achieved at about 59,000 addresses with about 138,000
respondents. A response rate of about 77 percent was achieved for the first wave of
the survey in 2002. All first interviews (with the exception of a very small sample
located north of the Caledonian Canal) are carried out by face-to-face interview.
Subsequent interviews are carried out by telephone. We use data for England, Wales
and Scotland for sweep 1 of each quarter.2 ONS calculate weights for the LFS which
are designed to produce population estimates in line with the latest census. Weighting
does not take into account ethnicity and, at the time of this analysis, weighting factors
were being revised for all years from 1992 based on the 2001 Census. As our analyses
focus on multivariate models and to not seek to provide descriptive population
estimates we have used unweighted data.
10

The QLFS collects family and demographic information on each member of the
household. This allows us to identify information about a woman’s partner and her
children. The QLFS also asks extensive information on employment and
qualifications that are consistent each year. In addition, questions on ethnicity,
country of birth and year of arrival in the UK are asked.
3.2 Ethnic group in the QLFS
By using the QLFS we are restricted to the definitions of ethnicity used in that study
and changes that have occurred to the categories over time. Creating consistent
categories for ethnic groups over the survey cross-sections involved grouping the two
mixed race categories `white and Caribbean’ and `white and African’ into ‘Black
Other’, and also grouping `white and Asian’ and `other mixed’ into a single ‘other
non-white’ composite group. A fuller discussion of this process is available in Lindley
et al (2004). In this paper we focus on the combined Black Caribbean / Black Other
group (sometimes referred to as ‘black’); an Indian group; and the combined Pakistani
and Bangladeshi group, as well as the white group. The QLFS sampling design and
large sample size means that reliable estimates can be obtained for ethnic minorities
by combining data for several years.
3.3 Operationalising a quasi life-course approach
The lack of any longitudinal data that can represent minority ethnic groups in the UK
means that we cannot follow individuals through the life-course. Instead we have had
to use repeat cross-section data to identify the current stage of the life-course for the
sample members. We cannot, therefore, assume that women will move through the
11

life-course in any predictable way and we cannot disentangle age, cohort and
generation. However, we have used information on whether women were born or
brought up in the UK as a way of distinguishing first and second generation
immigrants.
Table 2: Key life-course stages
(1) Women aged 19-34, no partner and no child under 16
(2) Women aged 19-34, with a partner, no child under 16
(3) Women with child under 5 and partner
(4) Woman with child under 5 and no partner
(5) Women with child 5-15 and partner
(6) Women with child 5-15 and no partner
(7) Women aged 35-59 with partner, no children under 16
(8) Women aged 35-59 with no partner and no children under 16
Women with a child under 16 in the household may be of any age from 19-60.
In Table 2, we present eight quasi life course stages which summarise demographic
and partnership information. Partnership is based on the respondent’s self-description
and includes either being married or cohabiting. A woman who reported herself as
married (but not separated) but had no partner in the household was classified as
married. This is particularly important for South Asian groups where a partner may be
temporarily overseas but is likely to be supporting his wife financially and where
norms associated with marriage still prevail.
12

A child is defined as under 16 and living in the same household as its mother. We
cannot distinguish step-children from biological children. For women without
dependent children at home we distinguish between those who are at a pre-family
formation stage and those whose children may now be 16 or over. Women who are
under 35 without children are assumed to be at a pre-family stage. The vast majority
of women in life-stages 7 and 8 either have older children still at home (29% in life-
stage 7 and 23% in life-stage 8 have children aged 16-19 at home) or will have
children who have left home3. We expect that the past influence of these children will
still be reflected in these women’s labour market behaviour. Our life stage variable
identifies whether a woman’s youngest child living in the household is under 5, or 5-
15 and also whether or not she has a partner.
3.4 Qualifications in the LFS
We have used the detailed information on qualifications in the LFS to develop a 5-
point classification that is consistent across time. Overseas qualifications are recorded
in the ‘other’ category - consistent with evidence that such qualifications have little if
any impact on employment in the UK for ethnic minorities (Dale et al, 2002).
13

Table 3: Classification of qualifications
Degree and higher qualification NVQ and key skills 4&5
Higher degrees, first degrees, teaching qualifications, nursing, HNC/HND, BTEC higher, NVQ levels 4 & 5
A level NVQ and key skills 3
‘A’ levels typically gained at age 18; required for university entrance; Scottish Highers, advanced craft certificates, NVQ level 3
O level NVQ and key skills 2
‘O’ levels, GCSE grades A-C, typically gained at age 16 at the end of compulsory schooling, NVQ level 2, GNVQ intermediate
Other qualification Key Skills level 1 and entry level
CSE below grade 1, NVQ 1, GNVQ/GSVQ foundation level Other qualifications incl. overseas qualifications
No qualifications No qualification reported, including don’t know and no answer
3.5 Generation, religion and fluency in English
We expect timing of settlement to play an important role in women’s propensity to be
active in the labour market, although to some extent this will be captured by
qualifications. The greatest distinction with respect to economic activity is between
those who were born in the UK or settled before the age of 16 and those who came to
the UK as adults (Dale et al, 2005). We have therefore created a binary variable that
distinguishes ‘born or brought up in the UK’ from later arrivals.
Ideally both religion and fluency in English should be included in our analyses
(Modood et al, 1997; Leslie and Lindley, 2001; Lindley, 2002; Dale et al, 2001) but
the LFS data do not allow this to be done reliably.
14
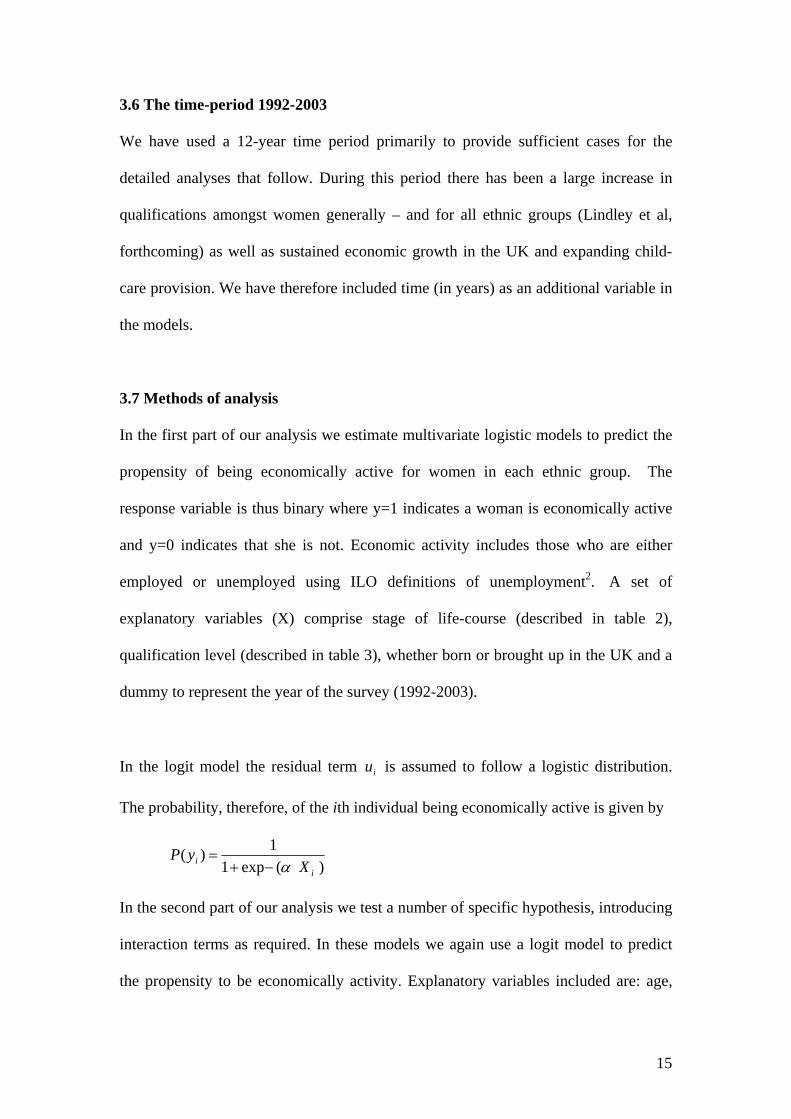
3.6 The time-period 1992-2003
We have used a 12-year time period primarily to provide sufficient cases for the
detailed analyses that follow. During this period there has been a large increase in
qualifications amongst women generally – and for all ethnic groups (Lindley et al,
forthcoming) as well as sustained economic growth in the UK and expanding child-
care provision. We have therefore included time (in years) as an additional variable in
the models.
3.7 Methods of analysis
In the first part of our analysis we estimate multivariate logistic models to predict the
propensity of being economically active for women in each ethnic group. The
response variable is thus binary where y=1 indicates a woman is economically active
and y=0 indicates that she is not. Economic activity includes those who are either
employed or unemployed using ILO definitions of unemployment2. A set of
explanatory variables (X) comprise stage of life-course (described in table 2),
qualification level (described in table 3), whether born or brought up in the UK and a
dummy to represent the year of the survey (1992-2003).
In the logit model the residual term is assumed to follow a logistic distribution.
The probability, therefore, of the ith individual being economically active is given by
iu
)(exp1
1)(i
i XyP
α−+=
In the second part of our analysis we test a number of specific hypothesis, introducing
interaction terms as required. In these models we again use a logit model to predict
the propensity to be economically activity. Explanatory variables included are: age,
15

age squared, age of children, qualification level, whether partnered, whether born or
brought up in the UK and a dummy to represent the year of the survey (1992-2003).
All models are run separately for each ethnic group. This reflects the fact that we are
interested in the differences between ethnic groups in the importance of the
explanatory variables used. We have restricted respondents to those aged 19-60 and
omitted all full-time students (irrespective of whether or not they are working).
Students’ employment status is likely to be secondary to their studies and based on a
different set of decisions than for non-students.
4. Multivariate descriptive models
We expect to see differences between ethnic groups in women’s rates of economic
activity within different life-stages. In this section we report the results from
multivariate models that establish the impact of different life-stage elements on the
outcome variable, economic activity, and make comparisons between different ethnic
groups. Thus we can establish the relative influence of each element (eg children
under 5). For example, the relationship between children and economic activity can be
compared across ethnic groups in a way that controls for differences in the level of
motherhood.
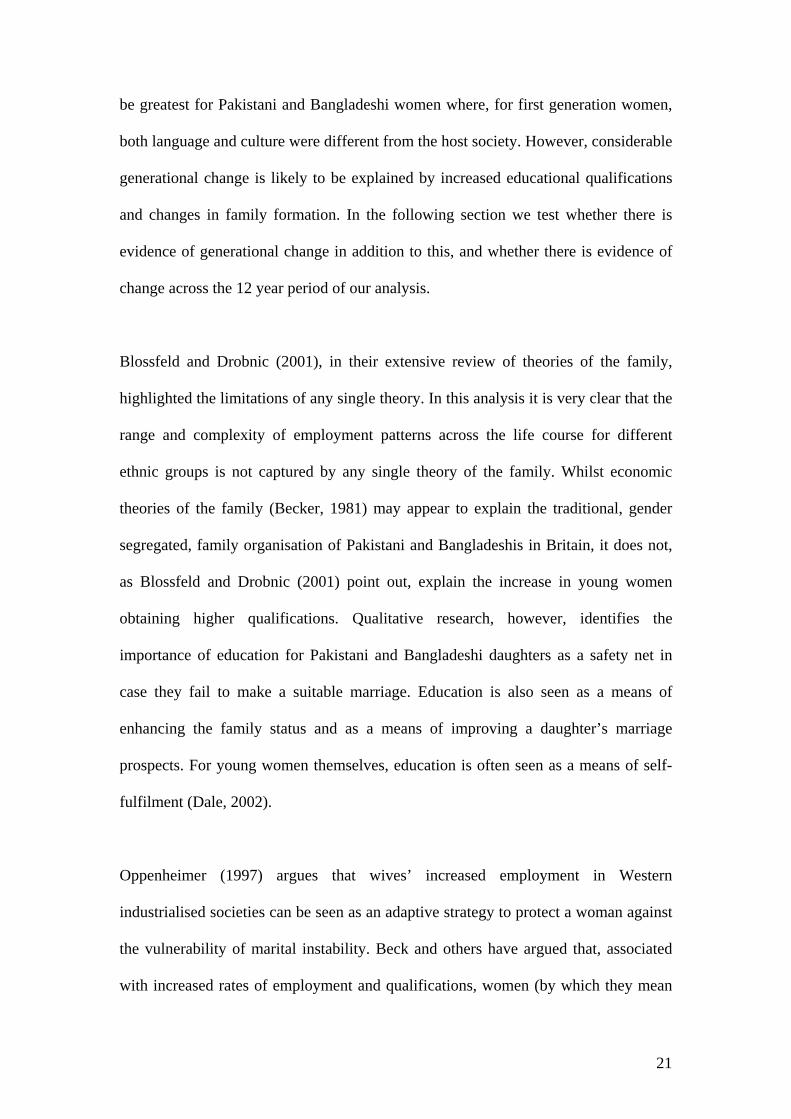
Table 4 reports coefficients and standard errors for each model and Table 5 reports
predicted probabilities of economic activity, based on these models, for each of our
key ethnic groups, within categories of life-stage and qualification for women aged
19-60. We discuss only Table 5.
16

4.1 Results
Amongst young women aged 19-34 with neither child not partner, probabilities of
being economically active are very similar in each ethnic group – between 94-96% for
women with degree level qualifications. This belies the widely accepted view of low
rates of labour market participation for Pakistani and Bangladeshi women generally
(eg as shown in Table 1), although there is much greater variation in rates of
economic activity with qualifications for this group than for other groups.
The role of partnership can be identified by comparing the former category (1) with
women of the same age with a partner but no child (2). For white and black women,
predicted probabilities of being economically active are consistently higher for
women with a partner, across all levels of qualification. However, for Indian and
Pakistani and Bangladeshi women, rates of activity are lower, and, for the latter
groups, much lower, (by 23 percentage points) for those with no qualifications.
The additional effect of a young child (under 5) is shown in lifestage 3. As expected,
activity rates are generally lower and show a steep gradient with level of
qualifications. Activity rates are higher and the gradient with qualifications least for
Black women whilst for Pakistani and Bangladeshi women, rates of activity are much
lower than for other ethnic groups across all qualification levels (only 5% for those
with no qualifications) with a range of nearly 50 percentage points between the
highest and lowest qualification groups.
17

Where the youngest child is of school-age (life-stage 4) women’s rates of activity are
higher and differentials by levels of qualification are less than for women with a pre-
school child - except for Pakistani and Bangladeshi women where activity for degree-
level women is 70% by comparison with only 11% for women with no qualifications.
Comparisons between single mothers (life-stages 5 and 6) and partnered mothers are
only possible for white and black women. For Indian, Pakistani and Bangladeshi
women, single parenthood is not usual and numbers do not support reliable analysis.
For white single mothers, rates of economic activity replicate those for partnered
mothers but at a much lower level. Single black women with children under 5 have
considerably higher rates of economic activity than white women.
Amongst women aged 35-60 with a partner but no child under 16, we expect that the
majority either have older children still at home or children who have left home. Rates
of activity are remarkably similar to women with a partner and children aged 5-15,
across levels of education and across ethnic groups. The final group, women aged 35-
60 with neither children under 16 nor a partner have rates of activity that are very
similar to their counterparts with a partner but consistently somewhat lower.
These results confirm that the ethnic differences shown in Table 1 are not simply the
result of ethnic differences in family formation, qualifications or generation.
4.2 Discussion
We use a discussion of these results to derive some hypotheses that test particular
theoretical formulations that relate to expected changes across generations or over
18

time bearing in mind, as seen above, that institutional structures are not sufficient to
produce uniform responses to life-stage or qualifications across these different ethnic
groups.
Table 5 confirms that black women have higher rates of economic activity across the
life course than white women; they are more likely to remain economically active
than white women when they have children and black single mothers have higher
rates of economic activity than white single mothers. This is consistent with the much
looser association between children and partnership, discussed above, where Black
women may be seen as taking the role of both bread-winner and carer. In a culture
where paid work is the ‘norm’ we expect to see only limited reduction in activity with
the presence of children and across levels of qualification. However, for single-
earners (lone mothers) high levels of unemployment and high costs of child-care may
deter women from being economically active when children are below school age. We
would expect, however, to see an increase in economic activity for black mothers,
particularly those with young children, following the reforms of the 1997 Labour
government.
Although Indian women’s patterns of family formation show a much more traditional
link between marriage and child-bearing, their rates of economic activity within life
stage and qualification categories resemble those of white women. Thus, whilst
economic activity is more responsive to partnership and children than Black
Caribbean women, Indian women have much higher rates of economic activity than
Pakistani and Bangladeshi women.
19

Pakistani and Bangladeshi women are distinctive in the strength of the relationship
between employment and qualifications, partnership and the presence of children,
resulting in much greater polarisation than for other ethnic groups. Whilst most
commentators assume that there is little generational change in women’s rates of
employment, we show that women at a pre-family formation stage (single, 19-34 and
with no partner) with higher levels of qualification, are as likely to be economically
active as women in other ethnic groups. However, rates of economic activity are much
lower for women with few or no qualifications. This is consistent with strongly
gendered roles and a male bread-winner model. In more traditional families unmarried
daughters may face considerable family resistance to taking a paid job outside the
home, although women with degree-level qualifications have more power within the
family, both in terms of decisions over employment and also in selecting a marriage
partner (Dale et al, 2002). This helps to explain the marked difference in rates of
economic activity with level of qualification shown in Table 5.
Dale et al’s (2002) research also provides strong support for the ideal of children and
maternal care of children among Pakistani and Bangladeshi mothers, irrespective of
their levels of qualification. This, again, is consistent with the very strong positive
effect of qualifications and, conversely, the strong negative effect of partnership and
children on economic activity shown in Table 5. Key questions to be tested in the
following section are whether women with higher qualifications are
disproportionately likely to retain employment while their children are young.
These results need to be set into a dynamic framework that recognises generational
differences and changes over the last decade. Generational change may be expected to
20
be greatest for Pakistani and Bangladeshi women where, for first generation women,
both language and culture were different from the host society. However, considerable
generational change is likely to be explained by increased educational qualifications
and changes in family formation. In the following section we test whether there is
evidence of generational change in addition to this, and whether there is evidence of
change across the 12 year period of our analysis.
Blossfeld and Drobnic (2001), in their extensive review of theories of the family,
highlighted the limitations of any single theory. In this analysis it is very clear that the
range and complexity of employment patterns across the life course for different
ethnic groups is not captured by any single theory of the family. Whilst economic
theories of the family (Becker, 1981) may appear to explain the traditional, gender
segregated, family organisation of Pakistani and Bangladeshis in Britain, it does not,
as Blossfeld and Drobnic (2001) point out, explain the increase in young women
obtaining higher qualifications. Qualitative research, however, identifies the
importance of education for Pakistani and Bangladeshi daughters as a safety net in
case they fail to make a suitable marriage. Education is also seen as a means of
enhancing the family status and as a means of improving a daughter’s marriage
prospects. For young women themselves, education is often seen as a means of self-
fulfilment (Dale, 2002).
Oppenheimer (1997) argues that wives’ increased employment in Western
industrialised societies can be seen as an adaptive strategy to protect a woman against
the vulnerability of marital instability. Beck and others have argued that, associated
with increased rates of employment and qualifications, women (by which they mean
21

white women), now expect to live an ‘individualised’ life, free to make their own
choices (Beck and Beck-Gernsheim, 2001; Esping-Anderson, 2002). They argue that
marriage is no longer a social or economic necessity; marriage and child-bearing can
be dissociated from each other and become a matter of individual choice.
Becker (1981) predicted that increased employment by wives would reduce the gains
from marriage and raise the risk of marital disruption. High rates of employment
amongst Black Caribbean women and their relative lack of responsiveness to
partnership and children are consistent with these ideas. However, the historical
evidence does not provide clear evidence that increased rates of women’s employment
preceded high rates of lone motherhood. Rather, the evidence suggests that structural
forces required women to take sole responsibility for children. Indian women, with
levels of education and economic activity very similar to white women, although
lower than black women, show no signs of increased marital instability and thus also
counter any necessary link between marital instability and increased rates of
employment.
5. Hypotheses to be tested
The analyses discussed so far give rise to a number of much more specific hypotheses
that are relevant to a dynamic life-course perspective. These are set out below. The
basic model used here contains each element of the life-course separately (age,
partner, children) and thus provides considerable flexibility in testing specific effects.
Results for each ethnic group are shown in Table 6. Other models either extend or
collapse this basic model. All models that include white women have been repeated
22

on a random sub-sample of 5,000. Only results that remain significant with this
sample size are discussed.
1. Generational changes in women’s rates of economic activity
We have already discussed the contrasts between Pakistani and Bangladeshi women
and Black Caribbean women in terms of migration history and cultural norms and
assumptions. We may, however, expect to see generational change for both groups,
but working in different directions. For Pakistani and Bangladeshi women we expect
an increase in levels of economic activity. In part this will be a result of increases in
levels of education and a reduction in fertility. However, we also predict an increase
in economic activity for women born or brought up in the UK compared with
overseas, after controlling for the structural effects of education and stage of life
course, which may be explained by a move towards the labour market norms of the
white majority.
For Black Caribbean women, those born or brought up in the UK may be more similar
to the white majority and thus levels of economic activity are expected to be lower for
second generation women than first generation – after controlling on other variables
in the model.
2. The effect of partnership
We expect partnership per se to have no impact in ‘modern’ families where women
expect to share domestic work with partners. Thus we expect no impact for white and
black women but a negative effect for Pakistani and Bangladeshi women for whom
gender roles are often still very distinct.
23

2a. However, we expect that, for Pakistani and Bangladeshi women only, the negative
effect of a partner will be less amongst women born or brought up in the UK. Young
women who have been exposed to white cultural norms during their adolescence may
be less likely to conform to traditional gender roles than for those who were born and
brought up overseas.
2b. If better educated Pakistani and Bangladeshi women are more likely to resist
traditional family gender roles (Dale, 2002), we expect to see a positive interaction
with partnership and qualifications. Thus we expect that the negative effect of
partnership will be less for well qualified women than for those not so qualified. To
test this we use an interaction term that combines degree and A level qualifications
(Table 8).
3. The effect of partner’s employment
In this section the effect of partnership is analysed further by distinguishing working
from non-working partners. Men from minority ethnic groups have much higher rates
of unemployment than white men. It is therefore important to establish what effect
partner’s employment status has on a woman’s own likelihood of being economically
active.
It is well established in the UK that women with employed partners are more likely to
be in paid work and, conversely, that women with partners not in paid work are less
likely to be in paid work themselves. The literature provides competing explanations
24

for the effect of partner’s employment, including a rational response to the benefit
system; a shared labour market; marital homogamy; and cultural norms about gender
roles (Davies et al, 1992; Birkelund and Heldal, 2000; Halpin and Chan, 2003;
Morris, 1990).
We test whether the positive effect of a working partner found for white women holds
across different ethnic groups. We also test whether the negative effect of a non-
working partner is the same across all groups. We expect that, for Black
Caribbean/Black Other women and for Indian women, as for white women, a working
partner will have a significant positive effect on economic activity. However, we
expect that the strength of labour market attachment of Black Caribbean/Black Other
women will not be influenced by a non-working partner and will over-ride any other
influences. For Pakistani and Bangladeshi women we expect the strength of gender
roles to result in a negative effect on economic activity irrespective of whether a
partner is working or not working.
Two dummy variables are used: whether a partner is in paid work; and whether a
partner is not in paid work (which may include unemployment, retirement or ill-
health), with the reference category as ‘no partner’.
4. Increasing economic activity over time
The data used covers 1992 – 2003. The new Labour Government of 1997 quickly
introduced more child-care facilities to make it easier for mothers to be in
employment. They also introduced active labour market policies to encourage
mothers, and especially lone mothers, to take paid work. Whilst these policies apply
25

equally to all ethnic groups, the uptake may vary across ethnic groups. For example,
formal child-care provision that is not sensitive to their cultural and religious norms is
unlikely to be acceptable to most Pakistani and Bangladeshi families. Similarly, where
policies cut against cultural norms they are unlikely to be effective. We do not,
therefore, expect to see a significant increase in economic activity levels of Pakistani
and Bangladeshi women. Similarly, the low levels of lone parenting within these
groups make is impossible for them to respond to the new incentives for lone parents
to be employed. By contrast, we expect that single Black mothers will take available
opportunities to increase their labour market participation and we expect a significant
increase over time for this group. We also expect to see an increase in the
employment of white mothers with young children over time.
5. Role of qualifications over time
Previous research has shown an increasing polarity in labour market activity between
(white) women in the UK with higher qualifications and those with few or no
qualifications (Dex and Joshi, 1996; Macran et al, 1996). In the previous section we
showed that for all ethnic groups there was a significant negative effect of year (from
1992-2003) on economic activity, holding constant other factors. We test whether
there has been a polarisation in the relationship between qualifications and economic
activity between 1992 and 2003 for each ethnic group, using an interaction term
between year and qualifications.
5.2 Results
1. Generational changes in women’s rates of economic activity
26

Logistic models using only age, age squared and whether UK born and brought up
show that the latter variable has a large positive effect on the probability of being
economically active for Pakistani and Bangladeshi and Indian women but not for
Black Caribbean/Black Other women (tables not reported). However, once children,
partner, qualifications and year are added, being UK born or brought up, the
significant positive effect on economic activity only remains for Pakistani and
Bangladeshi women (for white women the effect was not significant on a sample of
5,000) (Table 6). This suggests a significant cultural change across generations for
Pakistani and Bangladeshi women – but we must remember that fluency in English is
not measured and this may be a very important part of what is being measured by the
‘UK born or brought up’ variable (Leslie and Lindley, 2001; Dale et al, 2001).
For Black Caribbean/Black Other women, being UK born or brought up does not have
the predicted negative effect on economic activity. Similar results are found for
Indian women suggesting that any generational differences are explained by family
structure and levels of qualification.
2. The effect of partnership
We suggested that in ‘modern’ relationships partnership per se would not influence a
women’s likelihood to be economically active. However, table 6 shows that for white
and black women having a partner has a significant positive effect on economic
activity – controlling on other factors - whilst for Indian women there is no significant
effect. For Pakistani and Bangladeshi women, partnership has the expected significant
negative effect, consistent with a traditional family structure where women are more
likely to take on a home-making role on marriage.
27

2a. Table 7 reports the interaction to test whether the negative effect of a partner,
found for Pakistani and Bangladeshi women only, is less amongst women born or
brought in the UK. All other terms in the model are as for table 6. The interaction
term is not significant and thus, contrary to our expectations, provides no evidence of
a move towards white cultural norms for Pakistani and Bangladeshi women born and
brought up in the UK.
2b. Table 8 reports an interaction between higher qualifications (A levels and above)
and partnership for Pakistani and Bangladeshi women. The coefficient for the
interaction is positive and just significant at a 10% level. There is, therefore, tentative
support for our hypothesis that higher qualifications are having an effect on traditional
family roles that is additional to the effect of the qualifications alone.
3. The effect of partner’s employment
Table 9 extends table 6 by disaggregating ‘partner’ into ‘partner working’ and
‘partner not working’. The coefficients show that an employed partner has the
expected significant positive effect on activity for black, white and Indian women, by
comparison with the reference category – no partner. By contrast a working partner
has no significant effect for Pakistani and Bangladeshi women. The positive
relationship between economic activity and a partner being in paid work, found for
white, black and Indian women, may be explained by marital homogamy or by shared
labour market characteristics. The result does not provide any support for strong
gender roles whereby women provide domestic work in return for their partner’s paid
employment. For Pakistani and Bangladeshi women, having a partner in paid work is
28

not significantly different in terms of the likelihood to be economically active, than
having no partner. Thus the significant negative effect of partnership found in table 6
(and attributed to gender roles) is not found amongst Pakistani and Bangladeshi
women with a working partner.
The coefficients for a non-working partner, by comparison with the reference group,
are, as hypothesised, significant and negative for white, Indian and Pakistani and
Bangladeshi women. However, as predicted, there is no significant effect for Black
Caribbean/Black Other women.
The lack of any negative relationship with partner’s non-work status for black women
suggests that the welfare regime’s regulations cannot explain the negative relationship
found for other groups. Also, explanations of shared labour market characteristics or
marital homogamy are not supported. It is, however, entirely consistent with Black
Caribbean/Black other women’s independence from their partners and the assumption
that they take full economic responsibility for themselves and their children.
4. Increasing economic activity over time
Table 10 tests whether women with young children are increasing their labour market
participation over time. Adding an interaction term for the variables indicating child’s
age produced a significant coefficient for children aged 0-4 for both black and white
mothers. Thus the impact of government policies seems to have been significant for
women with pre-school age children in these ethnic groups but not significant for
women with children aged 5-15. However, for Indian and Pakistani and Bangladeshi
women, the interaction coefficient was not significant for either age-group, suggesting
29

there was no time-related increase in economic activity for women with a school-age
child, after controlling for other variables. We cannot, of course, determine whether
this is because of an unwillingness to participate in government schemes, a lack of
appropriate child care, an unwillingness to use formal child-care or an inability to
afford it.
5. Role of qualifications over time
Our standard model (table 6) showed that, for all minority groups there has been a
decrease in rates of economic activity over time, holding constant other factors. (For
white women the negative effect did not reach significance with a 5,000 sample). We
tested whether there has been a polarisation in the relationship between qualifications
and economic activity between 1992 and 2003 for each ethnic group, using an
interaction term between year and qualifications.
The results (not shown) suggested that there is, indeed, a polarisation over the 1992-
2003 period for white women but this is between women with any qualifications and
women with none. For Pakistani and Bangladeshi women there is evidence of a
polarisation between women with degree level qualifications and all others –
consistent with research that suggests degree level qualifications provide an incentive
to participant in the labour market (Dale et al, 2002). For Indian and Black
Caribbean/Black Other women no terms reach significance.
6. Conclusions
It is evident that qualifications and life-course are important elements explaining
women’s economic activity across all the ethnic groups examined here. However,
30

there are substantial differences between these groups in terms of the amount
explained by partnership and child-bearing. Also, within the life-stage categories that
these define, there are substantial differences in rates of economic activity. These
differences can be understood within a life-course perspective that considers the
cultural background and the timing of settlement of different ethnic groups and also
the cultural and family norms that influence gender roles.
Although government policy and state institutions provide a framework that applies to
all ethnic groups, the response to initiatives aimed at promoting employment for
women with children differs between ethnic groups. We provide evidence of an
increase in economic activity amongst white and black women with pre-school age
children, but no change for Indian or Pakistani and Bangladeshi women after
controlling on standard variables.
However, the rise in women’s level of educational qualifications is apparent across all
groups and has a large impact on rates of economic activity. Amongst Black
Caribbean/Black Other women all the evidence is consistent with women taking on
the dual role of mother and bread-winner. Whilst this dual role is also increasingly
common amongst white women, black women are distinctive in their low levels of
partnership and high rates of lone motherhood and in high rates of economic activity
across the life course. They are the only group where the effect of a partner who is not
in paid work does not differ significantly from having no partner – after controlling on
other factors. White women differ from black women in having much higher rates of
partnership and lower rates of lone parenthood than black women. Theories that
predict a link between higher levels of education, greater labour force participation
31

and a decline in rates of marriage may be consistent with evidence for black women
but, as argued earlier, the history of family disruption and separation pre-dates black
women’s increased levels of education.
Indian women have rates of economic activity that are similar to those for white
women, and similarly responsive to qualifications, but there is no evidence to support
a link between rates of economic activity and increased family disruption and lone
motherhood. Therefore theories that suggest women are increasing their education and
employment as protection against marital breakdown (Oppenheimer) get no support
from data on Indian women. Pakistani and Bangladeshi women, with the most
traditional backgrounds and lowest levels of education, provide the strongest evidence
for theories based on role separation. However there is generational change in rates of
economic activity, produced in part, but not entirely, by changing family formation
and increased qualifications. While Pakistani and Bangladeshi women show the
greatest differentiation based on level of qualification, the reasons for their increasing
participation in education are complex and include their own wish for self-fulfilment
as well as support from the family. Amongst Pakistani and Bangladeshi women,
maternal care for children is still seen as a priority, even amongst the most educated
group. However, there is tentative support for the hypothesis that the most highly
educated women in this group are increasing their economic activity
disproportionately to less educated women over time and that the negative role of
partnership may be somewhat reduced for better educated women. Whilst there is
some evidence that young Pakistani and Bangladeshi women may be delaying
marriage in order to fulfil their career ambitions (Dale at al, 2005), there is no
32

convincing evidence of a move towards an individualised life-style among these
women (Beck and Beck-Gernsheim, 2001).
In conclusion, therefore, our analyses of ethnic differences suggest that modern
theories of the relationships between women’s economic activity and their
partnerships appear over simplified when considered in a multi-cultural society and
need to be reconsidered.
References
Beck, U. & E. Beck-Gernsheim (2001): Individualization. London: Sage
Becker,G. S. (1981) A Treatise on the family, Cambridge, Mass. Harvard University
Press.
Berthoud, R. (2000), `Ethnic employment penalties in Britain’ Journal of Ethnic and
Migration Studies, Vol 26. No. 3. pp. 389-416.
Blackaby, D.H., Leslie, D.G., Murphy, P.D. and O’Leary, P.C. (2002), `White/ethnic
minority earnings and employment differentials in Britain: Evidence from the LFS’,
Oxford Economic Papers, 54, pp. 270-297
Blossfeld, H-P. and Drobnic,S. (2001) Careers of couples in contemporary society,
Oxford: Oxford University Press.
33

Brah, A. (1996) Cartographies of Diaspora: Contesting Identities, London: Routledge
Dale, A. and Holdsworth,C (1997): ‘Issues in the analysis of ethnicity in the 1991
British Census’. Ethnic and Racial Studies 20, 1, pp 160-181
Dale, A. and Holdsworth, C. (1998) ' Why don't minority ethnic women work part-
time?' in J. O'Reilly and C.Fagan, (eds) Part-Time Paradoxes, London: Routledge
Dale, A., Shaheen, N., Kalra, V. and Fieldhouse, E. (2001) `Labour Market Prospects
for Pakistani and Bangladeshi Women’ Work, Employment and Society. Vol. 16, No.
1.
Dale, A., Shaheen, N., Kalra, V. and Fieldhouse, E. (2002) `Routes into education and
employment for young Pakistani and Bangladeshi women in the UK’ Ethnic and
Racial Studies. Vol. 25, No. 6, November 2002. pp. 942-968.
Dale, A., J. Lindley and S. Dex (2005) ‘Ethnic differences in economic activity’,
Working Paper, http://www.ccsr.ac.uk/research/ethnic.htm
Davies, R.B., Elias, P., Penn, R. (1992) ‘The Relationship between a Husband's
Unemployment and His Wife's Participation in the Labour Force’, Oxford Bulletin of
Economics & Statistics, Vol 54, 2, pp. 145-71
Dex, S. (1985) The Sexual Division of Work, Brighton: Wheatsheaf
34

Dex, S. and Joshi,H. (1996) 'A widening gulf among Britain's mothers' in Oxford
Review of Economic Policy, Vol.12 No.1, pp.65-75.
Dex, S. Joshi, H. Macran, S. and McCulloch, A. (1998) 'Women's employment
transitions around childbearing' in Oxford Bulletin of Economics and Statistics,
Vol.60,No.1 pp.97-115.
Dex,S.and Joshi, H. (eds.) (2005) Children of the 21st century: From birth to nine
months, Bristol: The Policy Press.
Drew, D., Gray, J. and Sporton, D. (1997). ‘Ethnic differences in the educational
participation of 16-19 year olds’, in Karn,V. (ed) Employment, Education and
Housing amongst Ethnic Minorities in Britain, London: HMSO
Duncan, S. and Irwin, S. (2004) ‘The Social Patterning of Values and rationalities
Mothers’ choices in combining caring and employment’ Social Policy and Society,
3:4, 391-399
Duncan, S., Edwards, R., Reynolds, T. and Alldred, P. (2003 ) ‘Mothering, paid work
and partnering’, Work, Employment and Society, 17:2, 309-330
Elliott, J., Dale, A. and Egerton, M. (2001) ‘The influence of qualifications on
women’s work histories, employment status and earnings at age 33’ European
Sociological Review, 17, 2, pp. 145-168
35

Equal Opportunities Commission (2004) Facts about Women and Men in Great
Britain in 2004, Manchester: EOC
Esping-Andersen, G. (2002b): ‘A New Gender Contract’ in Esping-Andersen, G., D.
Gallie, A. Hemerijck & J. Myles (2002): Why We Need a New Welfare State. Oxford:
Oxford University Press.
Giele, J. and Elder, G. (1998) Methods of Life Course Research, (Thousand Oaks: Sage)
Halpin, B. and Chan, T.W. (2003) ‘Who marries whom in Great Britain?’ in
H-P. Blossfeld and A. Timm, Who Marries Whom? Educational Systems as Marriage
Markets in Modern Societies, Netherlands: Kluwer Academic
HESA (2005) Qualifications obtained by and examination results of higher education
students at higher education institutions in the United Kingdom for the academic year
2003/04, http://www.hesa.ac.uk/press/sfr82/sfr82.htm
Holdsworth, C. and Dale, A. (1997) `Ethnic differences in women’s employment.’
Work, Employment and Society. Vol. 11, No. 3. September 1997. pp. 435-457.
Kalra, V. (2000) From Textile Mills to Taxi Ranks: Experiences of Migration, Labour
and Social Change, Ashgate: Aldershot
36

Leslie, D. and Lindley, J (2001). `The impact of language ability on the employment
and earnings of Britain’s ethnic communities’. Economica, November 2001, pp.587-
606.
Leslie, D., Lindley, J. and Thomas. R.L. (2001) `Decline and fall: Unemployment
among Britain’s non-white ethnic communities 1963-1998’. Journal of Royal
Statistical Society, Series A (Statistics in Society) Vol 164 Part 2, 2001. pp.371-387.
Lindley, J. (2002) ‘Race or religion? The impact of religion on the employment and
earnings of Britain"s ethnic communities’, Journal of Ethnic and Migration Studies,
vol. 28, no. 3, pp. 427-442(16)
Lindley, J., Dale, A. and Dex, S. (2004) `Ethnic differences in women’s
demographic and family characteristics and economic activity profiles 1992-2002’
Labour Market Trends, April 2004.
Macran, S., Joshi, H. and Dex, S. (1996) 'Employment after childbearing: a survival
analysis' Work, Employment and Society, 10, 2, pp.273-296
Modood, T. (1997), Ethnic minorities in Britain: Diversity and disadvantage,
London: Policy Studies Institute.
Morris, L. (1990) The workings of the household, Cambridge: Polity Press
Office for National Statistics (2003) Labour Force Survey User Guide – Volume 1,
background and methodology
37

Web-site: www.statistics.gov.uk/downloads/theme_labour/LFSGU_Vol1_2003.pdf
Office for National Statistics (2004a) Focus on Ethnicity and Identity, January 2004
Web-site: www.statistics.gov.uk/downloads/theme_compendia/foe2004/ethnicity.pdf
Office for National Statistics (2004b) Focus on gender, January 2004
Web-site: www.statistics.gov.uk/downloads/theme_compendia/fog2004/gender.pdf
Oppenhiemer,V.K. (1993) ‘Women’s rising employment and the fate of family in
modern industrial societies’, Los Angeles: University of California.
Perfect, D. and Hurrell, K. (2003), Pay and Income (Women and Men in Britain
series), Manchester: Equal Opportunities Commission
Summerfield, C. and Babb, P. (eds) (2004) Social Trends, No. 34, London: The
Stationery Office
1 Policies and provisions include: New Deal for Lone Parents; Working Family Tax Credit (and its successors Working Tax Credit, Child Tax Credit and Child Care tax Credit), and National Child Care Strategy and Sure Start. 2 The longitudinal LFS data is not appropriate for this analysis because it only covers a 15-month time period and individuals who move address are not followed. 3 A comparison of rates of economic activity for women with no children under 16 by whether or not there were children 16-19 in the household showed almost identical rates of activity. This lends weight to our assumption that women under 35 are not the mothers of children who are 16 or older. Similarly, those women aged 35-60 with no children under 16 show the same levels of economic activity by whether or not 16-19 year olds are in the household.
38

Table 1 Economic activity and unemployment by ethnic group, women aged 19-60
Ethnic group % economically active Of those active:
% unemployed Total N in sample
White 74.5 5.0 363,932Black Caribbean 75.8 12.3 3,652 Black African 67.3 20.3 2,073 Black Other
72.7 15.5 835
Indian 66.7
8.7 6,394Pakistani 28.3 18.3 3,535Bangladeshi 18.6 27.3 1,159Chinese 67.2 6.1 1,099Other 62.3 11.1 4,718
Source: Quarterly Labour Force Survey, England, Wales and Scotland, QLFS, 1992-2003, unweighted, excludes FT students
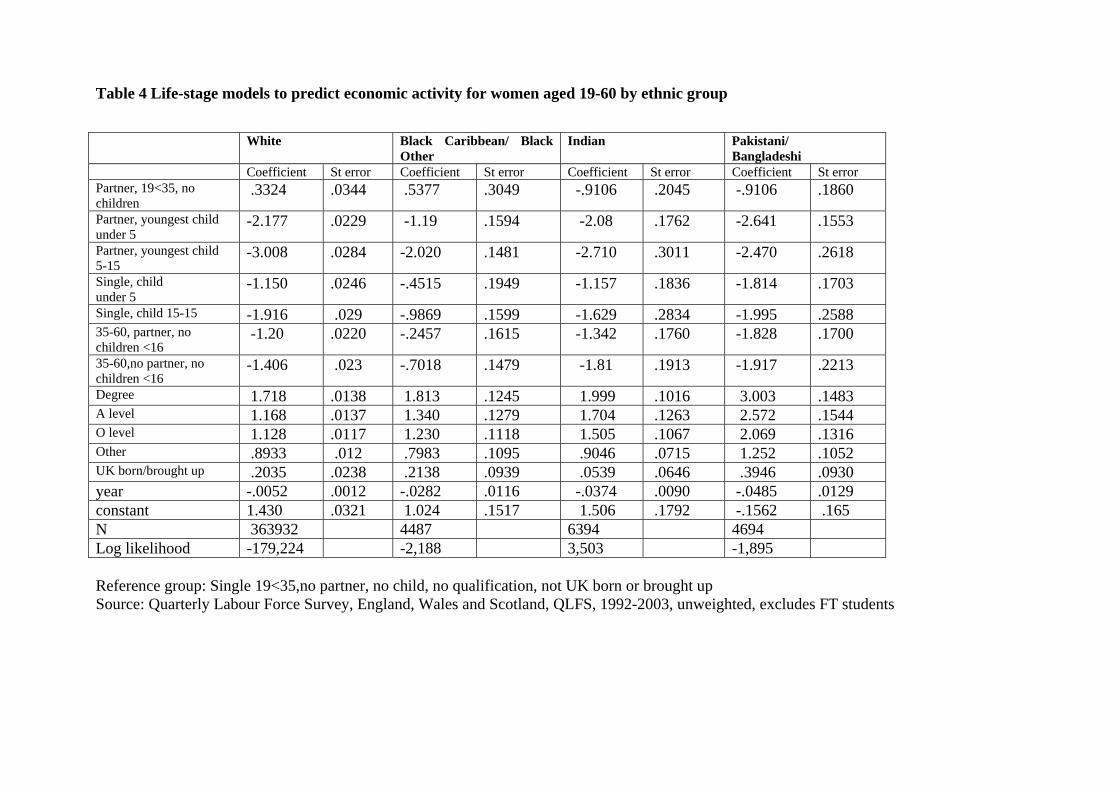
Table 4 Life-stage models to predict economic activity for women aged 19-60 by ethnic group White Black Caribbean/ Black
Other Indian Pakistani/
Bangladeshi Coefficient St error Coefficient St error Coefficient St error Coefficient St error Partner, 19<35, no children
.3324 .0344 .5377 .3049 -.9106 .2045 -.9106 .1860
Partner, youngest child under 5
-2.177 .0229 -1.19 .1594 -2.08 .1762 -2.641 .1553
Partner, youngest child 5-15
-3.008 .0284 -2.020 .1481 -2.710 .3011 -2.470 .2618
Single, child under 5
-1.150 .0246 -.4515 .1949 -1.157 .1836 -1.814 .1703
Single, child 15-15 -1.916 .029 -.9869 .1599 -1.629 .2834 -1.995 .2588 35-60, partner, no children <16
-1.20 .0220 -.2457 .1615 -1.342 .1760 -1.828 .1700
35-60,no partner, no children <16
-1.406 .023 -.7018 .1479 -1.81 .1913 -1.917 .2213
Degree 1.718 .0138 1.813 .1245 1.999 .1016 3.003 .1483 A level 1.168 .0137 1.340 .1279 1.704 .1263 2.572 .1544 O level 1.128 .0117 1.230 .1118 1.505 .1067 2.069 .1316 Other .8933 .012 .7983 .1095 .9046 .0715 1.252 .1052 UK born/brought up .2035 .0238 .2138 .0939 .0539 .0646 .3946 .0930 year -.0052 .0012 -.0282 .0116 -.0374 .0090 -.0485 .0129 constant 1.430 .0321 1.024 .1517 1.506 .1792 -.1562 .165 N 363932 4487 6394 4694 Log likelihood -179,224 -2,188 3,503 -1,895 Reference group: Single 19<35,no partner, no child, no qualification, not UK born or brought up Source: Quarterly Labour Force Survey, England, Wales and Scotland, QLFS, 1992-2003, unweighted, excludes FT students

Table 5: Predicted probabilities of being economically active from models in table 4.
White Black Caribbean/Other Indian Pakistani/ BangladeshiLevel of qualification
1 2 3 4 5 1 2 3 4 5 1 2 3 4 5 1 2 3 4 5Single 19<35,no partner, no child
96 94 94 92 83 94 92 91 86 75 96 95 94 90 79 94 92 87 74 46
Partner, 19<35, no children
97 96 95 94 87 97 95 94 91 83 91 89 87 78 61 87 81 73 51 23
Partner, youngest child under 5
76 64 63 56 34 83 76 74 65 45 77 71 67 53 32 53 44 31 16 5
Partner, youngest child 5-15
90 83 83 79 61 91 87 86 79 63 89 86 84 74 54 70 62 51 29 11
Single, child under 5
58 44 43 37 20 69 59 56 45 27 26 9
Single, child 15-15
80 70 69 64 42 86 79 78 69 51 19 6
35-60, partner, no children <16
89 83 82 78 57 92 89 87 81 67 87 83 80 70 49 69 61 49 28 10
35-60,no partner, no children <16
87 79 79 75 55 89 83 82 74 56 80 76 72 59 37 25 10
Shaded cells are based on less than 30 women and are not reported. Source: Quarterly Labour Force Survey, England, Wales and Scotland, QLFS, 1992-2003, unweighted, excludes FT students Key: 1 Degree and higher qualifications – NVQ and key skills 4&5 2 A level – NVQ and key skills 3 3 O level – NVQ and key skills level 2 4 Other qualification – NVQ and key skills level 1 5 No qualifications

Table 6 Basic model to predict economic activity for women aged 19-60 White Black Indian Pakistani/
Bangladeshi coeff St error coeff St error coeff St error coeff St error Age in years .1685 .00312 .1959 .02748 .1564 .0244 .1180 0335 Age squared -.0028 .0000 -.0028 .00034 -.002 .0003 -.0021 0004 child 0-4 -2.32 .0136 -1.858 .10843 -1.560 .0931 -1.85 1145 child 5-15 -.9190 .0124 -.742 .10791 -.2699 .0856 -.72 1209 Degree level 1.676 .013 1.716 .12543 1.968 .1014 2.971 1491 A level 1.086 .0139 1.246 .12892 1.635 .126 2.491 1536 O level 1.003 .0120 1.105 .1141 1.38 .1076 1.979 1315 Other qual .8052 .0127 .6964 .1110 .8396 .0729 1.163 1053 Partner .4399 .0099 .584 .08264 .1131 .0829 -.3828 0987UKborn/ brought up
.1473 .0242 .1291 .09735 .0112 .0661 .3956 0940
Year .0008 .0012 -.0288 .01176 -.0296 .0091 -.0475 .012 Constant -1.306 .0645 -2.127 .5070 -1.426 .4537 -2.07 5581 N cases 363932 4487 6394 4694Loglikelihood -175301 -2161 -3422 -1889 All coefficients are significant at a 5% level except those in shaded cells. (For white women coefficients are also significant with a 5,000 subsample of cases.) Source: Quarterly Labour Force Survey, England, Wales and Scotland, QLFS, 1992-2003, unweighted, excludes FT students

Table 7: Interaction to test effect of partner for women UK born/brought up, Pakistani and Bangladeshi women only Pakistani/ Bangladeshi
coeff St error
UKborn/ brought up .430 .1679 Partner -.3558 .147 UKborn * Partner -.0466 .188 Source: Quarterly Labour Force Survey, England, Wales and Scotland, QLFS, 1992-2003, unweighted, excludes FT students This model includes all the terms shown in table 6 and the additional interaction as shown. Table 8: Interaction to test effect of partner for women with higher qualifications, Pakistani and Bangladeshi women only Pakistani/ Bangladeshi
coeff St error
partner -.452 .1070 degree 2.704 .2177 A level 2.233 .2174 O level 1.978 .1320 Other qualificaton 1.167 .1056 Higher qual* partner
.3701 .2256
Higher qualifications = degree level or A level Source: Quarterly Labour Force Survey, England, Wales and Scotland, QLFS, 1992-2003, unweighted, excludes FT students This model includes all the terms shown in table 6 and the additional interaction as shown.

Table 9: Partner working or not working White Black Indian Pakistani/
Bangladeshi coeff St error Coeff St error coeff St error coeff St error Partner working
.7326 .01036 .9469 .0999 .4308 .0861 -.1169 .1047
Partner not working
-.5448 .01355 -.0907 .1185 -.6693 .0998 -.910 .1262
This model extends that in table 6 by splitting partner in to ‘working’ or ‘not working’. Reference category – no partner; other variables as in table 6. Source: Quarterly Labour Force Survey, England, Wales and Scotland, QLFS, 1992-2003, unweighted, excludes FT students Table 10: Interaction between age of child and time
White Black Indian Pakistani/Bangladeshi
coeff St error Coeff St error coeff St error coeff St error Child 0-4 -2.522 .0223 -2.217 .1955 -1.408 .1568 -1.83 .2253 Child 5-15 -.965 .0223 -.935 .2013 -.2113 .1548 -.5432 .232 Year -.009 .0017 -.0564 .0176 -.0204 .0129 -.0387 .0202 Child0-4*year .0331 .0029 .057 .0255 -.0246 .0204 -.0021 .0285 Child5-15*year .0081* .0030 .0312 .0268 -.009 .020 -.0274 .0298 This model extends that in table 6 by adding an interaction between age of youngest child and year. All other variables as in table 6. Source: Quarterly Labour Force Survey, England, Wales and Scotland, QLFS, 1992-2003, unweighted, excludes FT students *not significant with 5K sample