a joint initiative of the governance global practice and...
TRANSCRIPT
A Joint Initiative of the Governance Global Practice and the Development Impact Evaluation/Economics Research Group
September, 2019
THE BUREAUCRACY LAB
HOW CAN WE MEASURE PUBLIC-SECTORPRODUCTIVITY?

Our Mission
1
• To innovate bureaucracy through
better data and empirics.

2
What is productivity?
The ratio of outputs ($) to inputs ($)
How efficiently are inputs (labor, capital, and raw materials) being used to produce the final
good?

3
What are common measures of productivity in the private sector?
• Output per worker (number of shoes produced per employee)
• Output per expenditure on labor(number of shoes produced per dollar spent on labor)
• Output per expenditure on all inputs(number of shoes produced per dollar spent on labor, machines, and materials)

4
Administration-to-administration transactions (e.g. central government)Task completion rates and processing times
Individual-level indicators (employee performance)
Subjective assessments of performance
Staff satisfaction and tenure
Measures of corruption
Rasul and Rogger (2018); Lewis-Faupel et al (2016); Fenizia (2019)
Project completion rates (adjusted for complexity); road construction completion rates (quality-adjusted); process times (response times)
Ashraf et al (2014; 2016); Khan et al (2019); Deserranno (2019); Callen et al (2018)
Tax collection; performance evaluations; attendance
Bertrand et al (2018); Alonso & Lewis (2001); Brewer & Selden (2000)
Subjective assessments by multiple stakeholders; Employees’ subjective assessments of org. performance
Deserranno (2019); Janke et al (2019); Bright (2008)
Tenure/retention; Staff satisfaction; Job satisfaction and turnover intentions
Hanna & Wang (2017); Meyer-Sahling et al (2016); Olken (2007); Ferraz
Lab game; Perceptions of other public officials; Stated expenditure v audits

5
Budget execution
Mystery shoppers (comparing to a hypothetical/ideal benchmark)
The information, knowledge, or capacity of officials
Procurement outcomes (quality adjusted prices)
Experience satisfaction measures
Wages and promotion
Liebman and Mahoney (2017); European Commission
The rate of expenditure over the budget year (and the quality of expenditure)
Das and Hammer (2007); Bertrand et al (2007)
Compare `ideal’ process to actual process experienced by independent users (e.g. comparison against checklist; subjective measures of experience)
Rogger & Somani (2019); Hjort et al (19); Dal Bo et al (18); Das & Hammer (05)
Objective v subjective assessments of core quantities; Mayor beliefs regarding impacts of policy; Manager guesses of treatment effects; Clinical competence
Lewis-Faupel et al (2016); Best et al (2017)
Prices and quality of road construction; Prices paid for standardized good categories
Olken (2010); Boyne (2002); Andrews et al (2005)
Villager satisfaction, willingness to contribute, & perceived benefits; User satisfaction [% satisfied with how dealt with/service/access]
Alonso and Lewis (2001); Meier and O’Toole (2002)
Performance rating and grade level; Wages over and above “normal determinants”
Administration-to-administration transactions (e.g. central government)
6
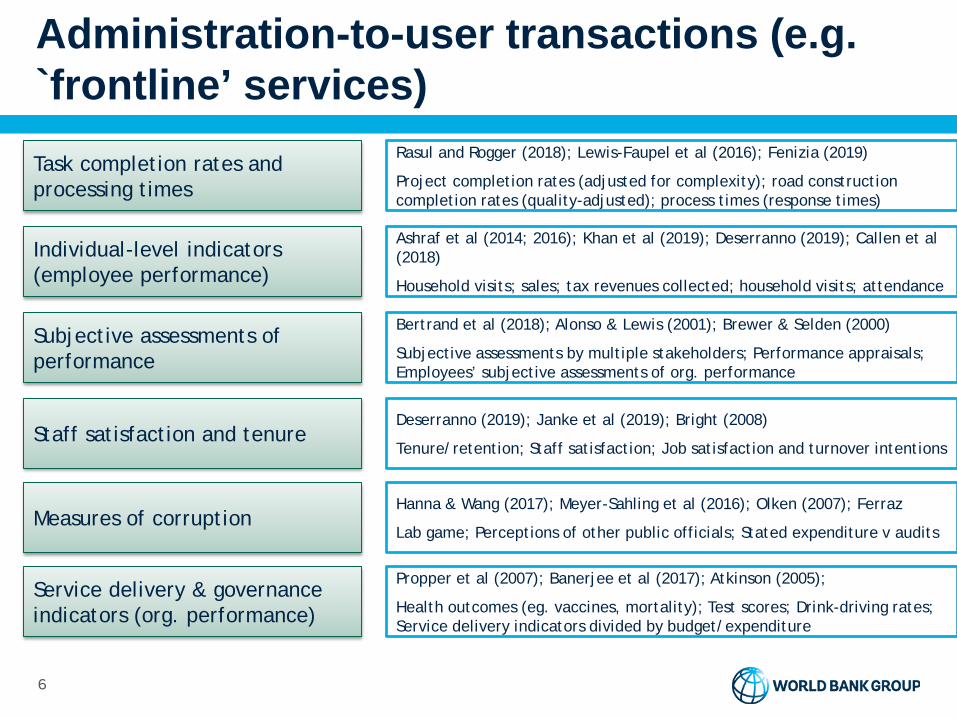
Administration-to-user transactions (e.g. `frontline’ services)Task completion rates and processing times
Individual-level indicators (employee performance)
Subjective assessments of performance
Staff satisfaction and tenure
Measures of corruption
Rasul and Rogger (2018); Lewis-Faupel et al (2016); Fenizia (2019)
Project completion rates (adjusted for complexity); road construction completion rates (quality-adjusted); process times (response times)
Ashraf et al (2014; 2016); Khan et al (2019); Deserranno (2019); Callen et al (2018)
Household visits; sales; tax revenues collected; household visits; attendance
Bertrand et al (2018); Alonso & Lewis (2001); Brewer & Selden (2000)
Subjective assessments by multiple stakeholders; Performance appraisals; Employees’ subjective assessments of org. performance
Deserranno (2019); Janke et al (2019); Bright (2008)
Tenure/retention; Staff satisfaction; Job satisfaction and turnover intentions
Hanna & Wang (2017); Meyer-Sahling et al (2016); Olken (2007); Ferraz
Lab game; Perceptions of other public officials; Stated expenditure v audits
Service delivery & governance indicators (org. performance)
Propper et al (2007); Banerjee et al (2017); Atkinson (2005);
Health outcomes (eg. vaccines, mortality); Test scores; Drink-driving rates; Service delivery indicators divided by budget/expenditure
7
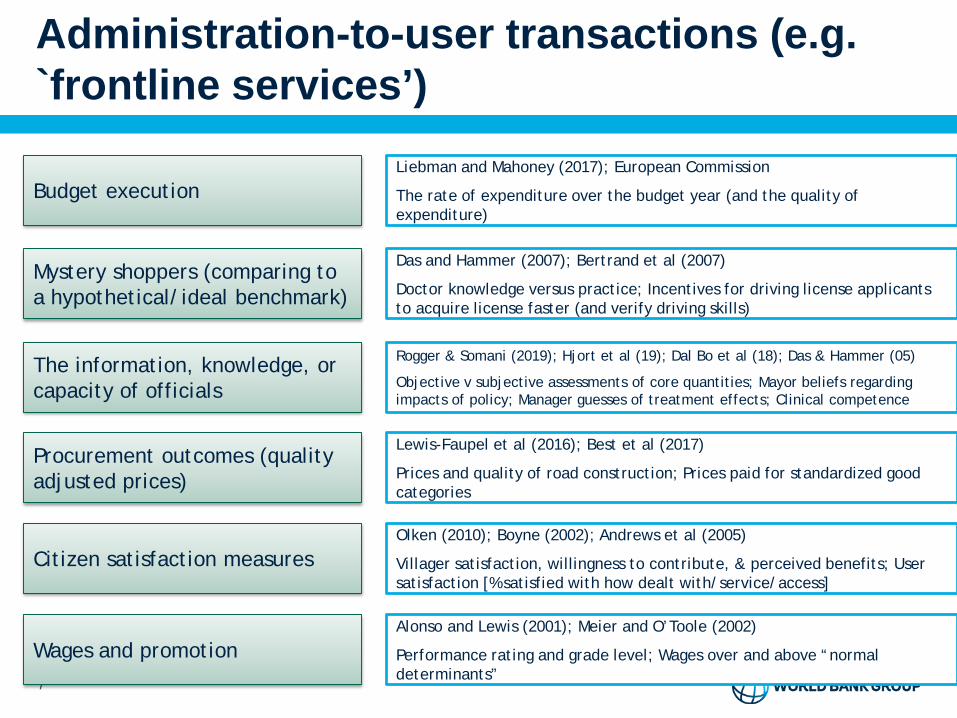
Budget execution
Mystery shoppers (comparing to a hypothetical/ideal benchmark)
The information, knowledge, or capacity of officials
Procurement outcomes (quality adjusted prices)
Citizen satisfaction measures
Wages and promotion
Liebman and Mahoney (2017); European Commission
The rate of expenditure over the budget year (and the quality of expenditure)
Das and Hammer (2007); Bertrand et al (2007)
Doctor knowledge versus practice; Incentives for driving license applicants to acquire license faster (and verify driving skills)
Rogger & Somani (2019); Hjort et al (19); Dal Bo et al (18); Das & Hammer (05)
Objective v subjective assessments of core quantities; Mayor beliefs regarding impacts of policy; Manager guesses of treatment effects; Clinical competence
Lewis-Faupel et al (2016); Best et al (2017)
Prices and quality of road construction; Prices paid for standardized good categories
Olken (2010); Boyne (2002); Andrews et al (2005)
Villager satisfaction, willingness to contribute, & perceived benefits; User satisfaction [% satisfied with how dealt with/service/access]
Alonso and Lewis (2001); Meier and O’Toole (2002)
Performance rating and grade level; Wages over and above “normal determinants”
Administration-to-user transactions (e.g. `frontline services’)

8

9
Measures used in the UK

10
Detailed Literature Review

11
Details: Service delivery indicators
Ashraf, N., Bandiera, O., & Lee, S. (2018). Losing prosociality in the quest for talent? Sorting, selection, and productivity in the delivery of public services.HOUSEHOLD VISITS; COMMUNITY MEETINGS; NUMBER OF WOMEN GIVING BIRTH AT HEALTH CENTRE; CHILD CARE; IMMUNIZATIONS; BREASTFEEDING RATES; DEWORMING TREATMENTS
Gulzar, S., & Pasquale, B. J. (2017). Politicians, bureaucrats, and development: Evidence from India. American Political Science Review, 111(1), 162-183.NUMBER OF DAYS WORKED UNDER NREGS AND TOTAL NUMBER EMPLOYED IN NREGS
Banerjee, A., Duflo, E., Keniston, D., & Singh, N. (2017). The efficient deployment of police resources: theory and new evidence from a randomized drunk driving crackdown in India. Working paper.DRINK-DRIVING RATES
Banerjee, A., Hanna, R., Kyle, J., Olken, B. A., & Sumarto, S. (2018). Tangible information and citizen empowerment: Identification cards and food subsidy programs in Indonesia. Journal of Political Economy, 126(2), 451-491.FOOD SUBSIDIES RECEIVED

12
Details: Service delivery indicators
Propper, C., Burgess, S., & Gossage, D. (2007). Competition and quality: evidence from the NHS internal market 1991–9. The Economic Journal, 118(525), 138-170.DEATH RATES FOLLOWING TREATMENT AFTER HEART ATTACKS
Boyne, G. A. (2002). Theme: Local Government: concepts and indicators of local authority performance: an evaluation of the statutory frameworks in England and Wales. Public Money and Management, 22(2), 17-24.REVIEW OF VARIOUS DIFFERENT MEASURES USED (LISTED IN ARTICLE TABLES)
Andrews, R., Boyne, G. A., Meier, K. J., O'Toole Jr, L. J., & Walker, R. M. (2005). Representative bureaucracy, organizational strategy, and public service performance: An empirical analysis of English local government. Journal of Public Administration Research and Theory, 15(4), 489-504.SEVEN-DIMENSION MEASURE OF ORGANIZATIONAL PERFORMANCE, INCLUDING SERVICE DELIVERY INDICATORS
Meier, K. J., Mastracci, S. H., & Wilson, K. (2006). Gender and emotional labor in public organizations: An empirical examination of the link to performance. Public Administration Review, 66(6), 899-909.TEST SCORES

13
Details: Service delivery indicators
Janke, K., Propper, C., & Sadun, R. (2019). The Impact of CEOs in the Public Sector: Evidence from the English NHS (No. w25853). National Bureau of Economic Research.FINANCIAL PERFORMANCE AND QUALITY OF CLINICAL CARE AND STAFF SATISFACTION
Best, M. C., Brockmeyer, A., Kleven, H. J., Spinnewijn, J., & Waseem, M. (2015). Production versus revenue efficiency with limited tax capacity: theory and evidence from Pakistan. Journal of political Economy, 123(6), 1311-1355.TAX REVENUE COLLECTED (ORGANIZATION)
Andersen, S. C., & Mortensen, P. B. (2009). Policy stability and organizational performance: Is there a relationship?. Journal of Public Administration Research and Theory, 20(1), 1-22.SCHOOL-LEVEL STUDENT TEST SCORES
Meier, K. J., & O'Toole Jr, L. J. (2002). Public management and organizational performance: The effect of managerial quality. Journal of Policy Analysis and Management: The Journal of the Association for Public Policy Analysis and Management, 21(4), 629-643.SCHOOL-LEVEL STUDENT TEST SCORES
14
Details: Service delivery indicators
Glewwe, P., Ilias, N., & Kremer, M. (2010). Teacher incentives. American Economic Journal: Applied Economics, 2(3), 205-27.STUDENT TEST SCORES
Muralidharan, K., & Sundararaman, V. (2011). Teacher performance pay: Experimental evidence from India. Journal of political Economy, 119(1), 39-77.STUDENT TEST SCORES
Forbes, M., & Lynn Jr, L. E. (2005). How does public management affect government performance? Findings from international research. Journal of Public Administration Research and Theory, 15(4), 559-584.EXAMPLES OF PERFORMANCE OUTPUTS AT THE INDIVIDUAL/SOCIETAL LEVEL INCLUDE HOMICIDE RATES, SCHOOL TEST PERFORMANCE, AND LIFE EXPECTANCY OF CLIENTS. SOME INDIVIDUAL/SOCIETAL OUTCOMES INCLUDE CHANGES IN WORKFORCE QUALITY AND PRODUCTIVITY, DEVELOPMENT OF ACTIVE CITIZENSHIP AMONG YOUNG PEOPLE, AND HEIGHTENED PUBLIC KNOWLEDGE ABOUT HEALTH ISSUES.

15
Details: Governance indicators
The following papers use one or more of these global indicators:
Government Effectiveness Index; Worldwide Governance Indicators; International Country Risk Guide; Business and Environmental Risk Intelligence; Business International.
Van de Walle, S. (2006). The state of the world's bureaucracies. Journal of Comparative Policy Analysis, 8(4), 437-448.
Jugl, M. (2018). Finding the Golden Mean: Country Size and the Performance of National Bureaucracies. Journal of Public Administration Research and Theory, 29(1), 118-132.
Kaufmann, D., Kraay, A., & Mastruzzi, M. (2009). Governance matters VIII: Aggregate and individual governance indicators 1996-2008. The World Bank.
Rauch, J. E., & Evans, P. B. (2000). Bureaucratic structure and bureaucratic performance in less developed countries. Journal of public economics, 75(1), 49-71.
Keefer, P., & Knack, S. (1997). Why don't poor countries catch up? A cross‐national test of an institutional explanation. Economic inquiry, 35(3), 590-602.

16
Details: Project and Task Completion
Rasul, I., & Rogger, D. (2018). Management of bureaucrats and public service delivery: Evidence from the nigerian civil service. The Economic Journal, 128(608), 413-446.PROJECT COMPLETION RATES AND COMPLEXITY
Rasul, I., Rogger, D., & Williams, M. J. (2018). Management and Bureaucratic Effectiveness: Evidence from the Ghanaian Civil Service. The World Bank.zPROJECT COMPLETION RATES AND COMPLEXITY
Lewis-Faupel, S., Neggers, Y., Olken, B. A., & Pande, R. (2016). Can electronic procurement improve infrastructure provision? Evidence from public works in India and Indonesia. American Economic Journal: Economic Policy, 8(3), 258-83.PRICES PAID AND QUALITY OF ROAD CONSTRUCTION PROJECTS (CONSULTANCY AND CONSTRUCTION PACKAGES IN INDIA AND INDONESIA). QUALITY = TIME OVERRUN; AUDIT REPORTS OF CONSTRUCTION QUALITY)

17
Details: Task-processing times
Fenizia, A. (2019). Managers and productivity in the public sector. Mimeo.CLAIMS PROCESSED, WEIGHTED BY COMPLEXITY AND ERROR RATE
Jerome Gallagher, L., Struyk, R. J., & Nikonova, L. (2003). Savings from integrating administrative systems for social assistance programmes in Russia. Public Administration and Development: The International Journal of Management Research and Practice, 23(2), 177-195.NUMBER OF BENEFITS PROCESSED EACH MONTH

18
Details: Individual-level outputs
Ashraf, N., Bandiera, O., & Jack, B. K. (2014). No margin, no mission? A field experiment on incentives for public service delivery. Journal of Public Economics, 120, 1-17.CONDOM SALES
Ashraf, N., Bandiera, O., & Lee, S. (2018). Losing prosociality in the quest for talent? Sorting, selection, and productivity in the delivery of public services.HOUSEHOLD VISITS; COMMUNITY MEETINGS; NUMBER OF WOMEN GIVING BIRTH AT HEALTH CENTRE; CHILD CARE; IMMUNIZATIONS; BREASTFEEDING RATES; DEWORMING TREATMENTS
Deserranno, E. (2019). Financial incentives as signals: experimental evidence from the recruitment of village promoters in Uganda. American Economic Journal: Applied Economics, 11(1), 277-317.HOUSEHOLD VISITS AND TENURE

19
Details: Individual-level outputs
Khan, A. Q., Khwaja, A. I., & Olken, B. A. (2019). Making moves matter: Experimental evidence on incentivizing bureaucrats through performance-based postings. American Economic Review, 109(1), 237-70.TAX COLLECTED
Andersen, L. B., & Pallesen, T. (2008). “Not just for the money?” How financial incentives affect the number of publications at Danish research institutions. International Public Management Journal, 11(1), 28-47.NUMBER OF PUBLICATIONS
20
Details: Attendance rates
Callen, M., Gulzar, S., Hasanain, A., Khan, M. Y., & Rezaee, A. (2018). Data and policy decisions: Experimental evidence from Pakistan. Technical Report, Stanford Institute of Economic Policy Research (SIEPR) 2018.DOCTOR ATTENDANCE
Kremer, M., Chaudhury, N., Rogers, F. H., Muralidharan, K., & Hammer, J. (2005). Teacher absence in India: A snapshot. Journal of the European Economic Association, 3(2-3), 658-667.TEACHER ATTENDANCE
Banerjee, A., & Duflo, E. (2006). Addressing absence. Journal of Economic perspectives, 20(1), 117-132.ATTENDANCE OF TEACHERS AND HEALTH WORKERS
21
Details: Subjective assessments
Bertrand, M., Burgess, R., Chawla, A., & Xu, G. (2018). The glittering prizes: Career incentives and bureaucrat performance. The Review of Economic StudiesSUBJECTIVE ASSESSMENTS OF CIVIL SERVANTS BY MULTIPLE STAKEHOLDERS ("IAS OFFICERS, STATE CIVIL SERVANTS, ELECTED POLITICIANS, REPRESENTATIVES OF BUSINESS ASSOCIATIONS, LOCAL TV AND PRINT MEDIA, AND CIVIL SOCIETY ORGANISATIONS. FOR EACH IAS OFFICER THEY KNOW, WE ASK STAKEHOLDERS TO GRADE THEM ON A 1 (LOW) TO 5 (HIGH) SCALE FOR: EFFECTIVENESS, PROBITY, THE ABILITY TO WITHSTAND ILLEGITIMATE POLITICAL PRESSURES, PRO-POOR ORIENTATION AND OVERALL RATING")
Somani, R. (2019). Efficiency Losses from Subjective Performance Evaluations and Supervisor Bias: Evidence from the Ethiopian Civil Service, Mimeo.ORGANIZATION PROVIDED PERFORMANCE APPRAISAL DOCUMENTS FOR INDIVIDUAL EMPLOYEES
Sung Min Park & Hal G. Rainey (2008) Leadership and Public Service Motivation in U.S. Federal Agencies, International Public Management Journal, 11:1, 109-142, DOI: 10.1080/10967490801887954SELF-ASSESSMENTS OF PERFORMANCE AND OWN QUALITY OF WORK
22
Details: Subjective assessments
Bright, L. (2008). Does public service motivation really make a difference on the job satisfaction and turnover intentions of public employees?. The American Review of Public Administration, 38(2), 149-166.SELF-ASSESSMENTS OF PERFORMANCE AND OWN QUALITY OF WORK
Alonso, P., & Lewis, G. B. (2001). Public service motivation and job performance: Evidence from the federal sector. The American Review of Public Administration, 31(4), 363-380.PERFORMANCE RATING (SCORE) AND GRADE LEVEL
Brewer, G. A., & Selden, S. C. (2000). Why elephants gallop: Assessing and predicting organizational performance in federal agencies. Journal of public administration research and theory, 10(4), 685-712.EMPLOYEE ASSESSMENTS OF ORGANIZATIONAL PERFORMANCE

23
Details: Subjective assessments
Kim, S. (2004). Individual-level factors and organizational performance in government organizations. Journal of public administration research and theory, 15(2), 245-261.EMPLOYEE ASSESSMENTS OF ORGANIZATIONAL PERFORMANCE
Kim, J. (2010). Strategic human resource practices: Introducing alternatives for organizational performance improvement in the public sector. Public Administration Review, 70(1), 38-49.EMPLOYEE ASSESSMENTS OF ORGANIZATIONAL PERFORMANCE
Abelson, J., Gold, S. T., Woodward, C., O’Connor, D., & Hutchison, B. (2004). Managing under managed community care: the experiences of clients, providers and managers in Ontario’s competitive home care sector. Health policy, 68(3), 359-372.CASE STUDIES INTERVIEWS OF PROVIDERS AND MANAGERS

24
Details: Subjective assessments: An example module
Brewer, G. A., & Selden, S. C. (2000): [Likert Scale]
My organization has made good use of my knowledge and skills in looking for ways to become more efficient.
In the past 2 years, the productivity of my work unit has improved.
The work performed by my work unit provides the public a worthwhile return on their tax dollars.
In general, people of my race/national origin group are treated with respect in my organization.
Overall, how would you rate the quality of work performed by your current coworkers in your immediate work group
My organization provides fair and equitable treatment for employees and applicants in all aspects of personnel management without regard to their political affiliation, race, color religion, national origin, sex, marital status age, or handicapping condition.

25
Details: Staff satisfaction and retention rates
Deserranno, E. (2019). Financial incentives as signals: experimental evidence from the recruitment of village promoters in Uganda. American Economic Journal: Applied Economics, 11(1), 277-317.HOUSEHOLD VISITS AND TENURE
Sung Min Park & Hal G. Rainey (2008) Leadership and Public Service Motivation in U.S. Federal Agencies, International Public Management Journal, 11:1, 109-142, DOI: 10.1080/10967490801887954JOB SATISFACTION, PERCEIVED PERFORMANCE, QUALITY OF WORK, TURNOVER INTENTIONS
Bram Steijn (2008) Person-Environment Fit and Public Service Motivation, International Public Management Journal, 11:1, 13-27, DOI: 10.1080/10967490801887863JOB SATISFACTION AND TURNOVER INTENTIONS

26
Details: Staff satisfaction and retention rates
Bright, L. (2008). Does public service motivation really make a difference on the job satisfaction and turnover intentions of public employees?. The American Review of Public Administration, 38(2), 149-166.JOB SATISFACTION AND TURNOVER INTENTIONS
Janke, K., Propper, C., & Sadun, R. (2019). The Impact of CEOs in the Public Sector: Evidence from the English NHS (No. w25853). National Bureau of Economic Research.FINANCIAL PERFORMANCE AND QUALITY OF CLINICAL CARE AND STAFF SATISFACTION

27
Details: Measures of corruptionBanerjee, R., Baul, T., Rosenblat, T. (2015). On self selection of the corrupt into the public sector. Econ.Lett. 127, 43e46.COMPARE RESULTS OF A CORRUPTION GAME AMONG PUBLIC AND PRIVATE SECTOR ASPIRANTS. HOW MUCH TO OVERREPORT AND TO UNDERPAY?
Hanna, R., & Wang, S. Y. (2017). Dishonesty and selection into public service: Evidence from India. American Economic Journal: Economic Policy, 9(3), 262-90.COMPARE THE STATED RESPONSE TO NUMBERS FROM DICE ROLLS TO A UNIFORM DISTIRBUTION.
Meyer‐Sahling, J. H., & Mikkelsen, K. S. (2016). Civil service laws, merit, politicization, and corruption: The perspective of public officials from five East European countries. Public administration, 94(4), 1105-1123.PERCEPTIONS OF PUBLIC OFFICIALS ABOUT THEIR ORGANIZATION: "OVER THE LAST 12 MONTHS THERE HAVE BEEN RUMOURS OF KICKBACKS IN MY MINISTRY"
Olken, B. A. (2007). Monitoring corruption: evidence from a field experiment in Indonesia. Journal of political Economy, 115(2), 200-249.COMPARE STATED EXPENDITURES TO INDEPENDENTLY-ESTIMATED EXPENDITURES ON INFRASTRUCTURE PROJECTS

28
Details: Measures of corruption
Olken, B. A., & Pande, R. (2012). Corruption in developing countries. Annu. Rev. Econ., 4(1), 479-509.
PERCEPTIONS OF CORRUPTION BY SERVICE USERS, EMPLOYEES AND BY EXPERTS (JOURNALISTS); COMPARE STATED EXPENDITURES TO INDEPENDENTLY-ESTIMATED EXPENDITURES ON INFRASTRUCTURE PROJECTS; SURVEY ESTIMATES OF BRIBES OR INFORMAL GIFTS; DIRECT OBSERVATIONS BASED ON PUBLIC RECORDS OR AUDITS OR BRIBE PAYERS; ESTIMATES OF GRAFT (MEASURE A QUANTITY BEFORE AND AFTER CORRUPTION IS SUPPOSED TO HAVE TAKEN PLACE, E.G. GRANT SENT V GRANT RECEIVED; COMPARE EXPORTS SENT VERSUS EXPORT RECEIVED; COMPARE STATED INPUTS V ACTUAL MEASURED INPUTS; ADMINISTRATIVE RECORDS OF GRANTS OR SUBSIDIES V HOUSEHOLD SURVEY); MARKET EQUILIBRIUM CONDITIONS (E.G. COST OF LOSING A POLITICAL CONNECTION; PUBLIC-SECTOR PAY RECEIVED VERSUS ASSETS OWNED; PROBABILITY OF RECEIVING PUBLIC PROGRAMME SUPPORT OR FUNDS BETWEEN PUBLIC AND PRIVATE EMPLOYEES, CONDITIONAL ON OBSERVABLES.
29
Details: Measures of corruption
Ferraz, C., & Finan, F. (2011). Electoral accountability and corruption: Evidence from the audits of local governments. American Economic Review, 101(4), 1274-1311.INDEPENDENT AUDITS OF CORRUPT PRACTICES (MISAPPROPRIATION OF RESOURCES).
Ferraz, C., & Finan, F. (2008). Exposing corrupt politicians: the effects of Brazil's publicly released audits on electoral outcomes. The Quarterly journal of economics, 123(2), 703-745.INDEPENDENT AUDITS OF CORRUPT PRACTICES (MISAPPROPRIATION OF RESOURCES).
Bertrand, M., Djankov, S., Hanna, R., & Mullainathan, S. (2007). Obtaining a driver's license in India: an experimental approach to studying corruption. The Quarterly Journal of Economics, 122(4), 1639-1676.INDEPENDENT SURPRISE DRIVING TESTS TO ASSESS CAPABILITIES OF THOSE THAT ATTAINED A LICENSE. APPLICANTS INCENTIVISED TO ACQUIRE A LICENSE FASTER WERE MORE LIKELY TO GET A LICENSE AND FAIL THE INDEPENDENT TEST.

30
Details: Budget execution and expenditure per unit
Liebman, J. B., & Mahoney, N. (2017). Do expiring budgets lead to wasteful year-end spending? Evidence from federal procurement. American Economic Review, 107(11), 3510-49.ARE EXPENDITURE RATES FASTER AS BUDGET DEADLINES APPROACH? DOES THE QUALITY OF EXPENDITURE DECLINE?
Afonso, A., Schuknecht, L., & Tanzi, V. (2005). Public sector efficiency: an international comparison. Public choice, 123(3-4), 321-347.PUBLIC-SECTOR PERFORMANCE MEASURES DIVIDED BY MEASURES OF "RELEVANT" PUBLIC EXPENDITURE. PERFORMANCE IS AN INDEX WHICH COMBINES SERVICE DELIVERY INDICATORS ACROSS EDUCATION, HEALTH AND PUBLIC INFRASTRUCTURE OUTCOMES AS WELL AS MEASURES OF ECONOMIC PERFORMANCE AND EQUALITY (INCOME DISTRIBUTION, STABILITY AND GROWTH) AND MEASURES OF CORRUPTION AND RED-TAPE, BASED ON MEASURES FROM THE WORLD ECONOMIC FORUM AND SCHNEIDER (2002) ON THE SIZE OF SHADOW ECONOMY.
31
Details: Budget execution and expenditure per unit
Giordano, R., Lanau, M. S., Tommasino, P., & Topalova, P. (2015). Does public sector inefficiency constrain firm productivity: evidence from Italian provinces (No. 15-168). International Monetary Fund.OUTPUTS DIVIDED BY INPUTS: CHANGE IN LIFE EXPECTANCY DIVIDED BY HEALTH EXPENDITURE; CHANGE IN TEST SCORES DIVIDED BY NUMBER OF TEACHERS PER STUDENT; AVERAGE TRIAL LENGTH DIVIDED BY NUMBER OF JUDGES PER 1000 INHABITANTS; NUMBER OF CHILDREN IN DAY CARE DIVIDED BY EXPENDITURE ON CHILD CARE; TONS OF WASTE COLLECTED AND RECYCLED DIVIDED BY EXPENDITURE ON WASTE.
Atkinson, A. B. (2005). The Atkinson review: final report. Measurement of government output and productivity for the national accounts. Palgrave Macmillan.SERVICE DELIVERY INDICATORS DIVIDED BY EXPENDITURE
Boyne, G. A. (2002). Theme: Local Government: concepts and indicators of local authority performance: an evaluation of the statutory frameworks in England and Wales. Public Money and Management, 22(2), 17-24.OUTPUTS DIVIDED BY INPUTS (TEST SCORES DIVIDED BY NUMBER OF TEACHERS PER STUDENT); OUTCOMES DIVIDED BY EXPENDITURE (EXPENDITURE ON JOB-SEEKER SUPPORT AND CHANGES IN UENMPLOYMENT RATES AND EARNINGS).
32
Details: Budget execution and expenditure per unit
Andrews, R., Boyne, G. A., Meier, K. J., O'Toole Jr, L. J., & Walker, R. M. (2005). Representative bureaucracy, organizational strategy, and public service performance: An empirical analysis of English local government. Journal of Public Administration Research and Theory, 15(4), 489-504.A SCORE/INDEX IS CREATED WHICH TAKES INTO ACCOUNT SIX DIMENSIONS OF PERFORMANCE (QUANTITY OF OUTPUTS; QUALITY; EFFICIENCY; OUTCOMES; VALUE FOR MONEY; AND CONSUMER SATISFACTION SCORES. THESE ARE QUALITATIVELY ASSESSED BY A COMMISSION AND ECH ORGANIZATION GIVEN A SCORE.)
Janke, K., Propper, C., & Sadun, R. (2019). The Impact of CEOs in the Public Sector: Evidence from the English NHS (No. w25853). National Bureau of Economic Research."MEASURES OF INPUTS, THROUGHPUTS (E.G. ACCESS TO CARE METRICS SUCH AS WAITING TIMES, WHICH ARE IMPORTANT IN A SYSTEM WHERE CARE IS RATIONED), OUTPUTS (FINANCIAL PERFORMANCE AND MEASURES OF THE QUALITY OF CLINICAL CARE) AND STAFF JOB SATISFACTION "... E.G. NUMBER OF BEDS, NUMBER OF ADMISSIONS, LENGTHS OF STAY, WAITING TIMES, CANCELLED OPERATIONS, DEATHS, DISEASE RATES, READMISSION RATES.
33
Details: Budget execution and expenditure per unit
Pina, V., & Torres, L. (2001). Analysis of the efficiency of local government services delivery. An application to urban public transport. Transportation Research Part A: Policy and Practice, 35(10), 929-944.KILOMETRES OF BUS ROUTE PER EMPLOYEE; ACCIDENT RATES
Lam, P. L., & Shiu, A. (2001). A data envelopment analysis of the efficiency of China’s thermal power generation. Utilities Policy, 10(2), 75-83.TECHNICAL EFFICIENCY OF POWER PLANTS
34
Details: Mystery shoppers
Mohanan, Manoj, Marcos Vera-Hernández, Veena Das, Soledad Giardili, Jeremy D. Goldhaber-Fiebert, Tracy L. Rabin, Sunil S. Raj, Jeremy I. Schwartz, and Aparna Seth. "The know-do gap in quality of health care for childhood diarrhea and pneumonia in rural India." JAMA pediatrics 169, no. 4 (2015): 349-357.COMPARE TREATMENT OFFERED TO STANDARDIZED PATIENTS (MYSTERY SHOPPERS) TO VIGNETTES ABOUT HYPOTHETICAL CASES TO MEASURE KNOW-DO GAP (INCENTIVES V TRAINING).
Das, Jishnu, Jeffrey Hammer, and Kenneth Leonard. 2008. "The Quality of Medical Advice in Low-Income Countries." Journal of Economic Perspectives, 22 (2): 93-114.VIGNETTES: MEDICAL PROVIDER PRESENTED WITH HYPOTHETICAL CASES AND COMPARE RESPONSES TO A CHECKLIST OF ESSENTIAL PROCEDURES. DIRECT OBSERVATIONS OF DOCTORS DURING A DOCTOR-PATEINT INTERACTION
Das, J., & Hammer, J. (2007). Money for nothing: the dire straits of medical practice in Delhi, India. Journal of Development Economics, 83(1), 1-36.COMPARE DOCTOR KNOWLEDGE (VIGNETTES) TO PRACTICE WITH COMPARABLECASE MIXES OF DISEASE.

35
Details: Mystery shoppers
Das, J., & Hammer, J. (2005). Which doctor? Combining vignettes and item response to measure clinical competence. Journal of Development Economics, 78(2), 348-383.COMPARE DOCTOR RESPONSES TO HYPOTHETICAL CASE VIGNETTES TO ASSESS CLINICAL COMPETENCE
Bertrand, M., Djankov, S., Hanna, R., & Mullainathan, S. (2007). Obtaining a driver's license in India: an experimental approach to studying corruption. The Quarterly Journal of Economics, 122(4), 1639-1676.INDEPENDENT SURPRISE DRIVING TESTS TO ASSESS CAPABILITIES OF THOSE THAT ATTAINED A LICENSE. APPLICANTS INCENTIVISED TO ACQUIRE A LICENSE FASTER WERE MORE LIKELY TO GET A LICENSE AND FAIL THE INDEPENDENT TEST.
36
Details: Information/knowledge of officials
Rogger, D., & Somani, R. (2018). Hierarchy and Information. The World Bank.COMPARE ESTIMATES PROVIDED BY PUBLIC OFFICIALS TO OBJECTIVE BENCHMARKS ON FUNDAMENTAL QUANTITES REQUIRED TO COMPLETE TASKS
Dal Bó, E., Finan, F., Li, N. Y., & Schechter, L. (2018). Government decentralization under changing state capacity: Experimental evidence from Paraguay (No. w24879). National Bureau of Economic Research.COMPARE ACTUAL TREATMENT EFFECTS TO SUPERVISOR ESTIMATES REGARDING A NEW MONITORING TECHNOLOGY AIMED AT IMPROVING THE PERFORMANCE OF AGRICULTURAL EXTENSION AGENTS (PERFORMANCE = SHARED OF ASSIGNED FARMERS VISITED IN A GIVEN WEEK).
Hjort, J., Moreira, D., Rao, G., & Santini, J. F. (2019). How Research Affects Policy: Experimental Evidence from 2,150 Brazilian Municipalities (No. w25941). National Bureau of Economic Research.MEASURE WILLINGNESS TO PAY FOR RESEARCH EVIDENCE AND EXTENT TO WHICH MAYORS UPDATE BELIEFS REGARDING POTENTIAL IMPACTSOF EARLY CHILDHOOD DEVELOPMENT PROGRAMMES. ALSO MEASURE PROBABILITY OF MUNICIPALITY IMPLEMENTING A POLICY AFTER A RANDOMIZED PRESENTATION OF THE EFFICACY OF TAXPAYER REMINDER LETTERS.

37
Details: Information/knowledge of officials
Mohanan, M., Vera-Hernández, M., Das, V., Giardili, S., Goldhaber-Fiebert, J. D., Rabin, T. L., Raj, S S.., Schwartz, J. I, & Seth, A. (2015). The know-do gap in quality of health care for childhood diarrhea and pneumonia in rural India. JAMA pediatrics, 169(4), 349-357.COMPARE TREATMENT OFFERED TO STANDARDIZED PATIENTS (MYSTERY SHOPPERS) TO VIGNETTES ABOUT HYPOTHETICAL CASES TO MEASURE KNOW-DO GAP (INCENTIVES V TRAINING).
Das, Jishnu, Jeffrey Hammer, and Kenneth Leonard. 2008. "The Quality of Medical Advice in Low-Income Countries." Journal of Economic Perspectives, 22 (2): 93-114.VIGNETTES: MEDICAL PROVIDER PRESENTED WITH HYPOTHETICAL CASES AND COMPARE RESPONSES TO A CHECKLIST OF ESSENTIAL PROCEDURES. DIRECT OBSERVATIONS OF DOCTORS DURING A DOCTOR-PATEINT INTERACTION
Das, J., & Hammer, J. (2007). Money for nothing: the dire straits of medical practice in Delhi, India. Journal of Development Economics, 83(1), 1-36.COMPARE DOCTOR KNOWLEDGE (VIGNETTES) TO PRACTICE WITH COMPARABLE CASE MIXES OF DISEASE.
Das, J., & Hammer, J. (2005). Which doctor? Combining vignettes and item response to measure clinical competence. Journal of Development Economics, 78(2), 348-383.COMPARE DOCTOR RESPONSES TO HYPOTHETICAL CASE VIGNETTES TO ASSESS CLINICAL COMPETENCE

38
Details: Procurement outcomes
Lewis-Faupel, S., Neggers, Y., Olken, B. A., & Pande, R. (2016). Can electronic procurement improve infrastructure provision? Evidence from public works in India and Indonesia. American Economic Journal: Economic Policy, 8(3), 258-83.PRICES PAID AND QUALITY OF ROAD CONSTRUCTION PROJECTS (CONSULTANCY AND CONSTRUCTION PACKAGES IN INDIA AND INDONESIA). QUALITY = TIME OVERRUN; AUDIT REPORTS OF CONSTRUCTION QUALITY)
Best, M. C., Hjort, J., & Szakonyi, D. (2017). Individuals and organizations as sources of state effectiveness, and consequences for policy (No. w23350). National Bureau of Economic Research.PRICES PAID FOR A SPECIFIC GOOD SPECIFICATION (QUALITY-ADJUSTED PRICES) --VARIOUS PROCUREMENT PRODUCTS (MEDICINES AS A HOMOGENOUS SET OF PRODUCTS)
39
Details: Citizen satisfaction measures
Olken, B. A. (2010). Direct democracy and local public goods: Evidence from a field experiment in Indonesia. American political science review, 104(2), 243-267.VILLAGER SATISFACTION; WILLINGNESS TO CONTRIBUTE; PERCEIVED BENEFITS
Boyne, G. A. (2002). Theme: Local Government: concepts and indicators of local authority performance: an evaluation of the statutory frameworks in England and Wales. Public Money and Management, 22(2), 17-24.EXAMPLES: PERCENTAGE OF BENEFIT CLAIMANTS SATISFIED WITH THE WAY THEY WERE DEALTH WITH; PERCENTAGE OF LIBRARY USERS SATISFIED WITH STAFF AND OPENING HOURS; PERCENTAGE OF USERS SATISFIED WITH LOCAL BUS SERVICE; PERCENTAGE OF APPLICANTS SATISFIED WITH PLANNING SERVICE; PERCENTAGE OF CITIZENS SATISFIED WITH OVERALL SERVICE PROVIDED BY LOCAL AUTHORITY
40
Details: Citizen satisfaction measures
Andrews, R., Boyne, G. A., Meier, K. J., O'Toole Jr, L. J., & Walker, R. M. (2005). Representative bureaucracy, organizational strategy, and public service performance: An empirical analysis of English local government. Journal of Public Administration Research and Theory, 15(4), 489-504.CITIZEN/CUSTOMER SATISFACTION MEASURES FROM USERS OF A LOCAL GOVERNMENT AUTHORITY
Abelson, J., Gold, S. T., Woodward, C., O’Connor, D., & Hutchison, B. (2004). Managing under managed community care: the experiences of clients, providers and managers in Ontario’s competitive home care sector. Health policy, 68(3), 359-372.CASE STUDY INTERVIEWS OF SERVICE USERS AND STAKEHOLDERS (FAMILIES OF CARE-RECEIVERS)

41
Details: Wages/grades/promotions
Alonso, P., & Lewis, G. B. (2001). Public service motivation and job performance: Evidence from the federal sector. The American Review of Public Administration, 31(4), 363-380.PERFORMANCE RATING (SCORE) AND GRADE LEVEL
Meier, K. J., & O'Toole Jr, L. J. (2002). Public management and organizational performance: The effect of managerial quality. Journal of Policy Analysis and Management: The Journal of the Association for Public Policy Analysis and Management, 21(4), 629-643.MANAGERIAL QUALITY MEASURED BY THE WAGES PAID TO SCHOOL PRINCIPALS OVER AND ABOVE "NORMAL DETERMINANTS OF SALARY"

42
• The conceptual problem of measuring public-sector productivity (ch4)• Progress in what countries do to measure this in national accounts (Ch2/3/5/6)• Leading to the need to classify services in to collective (hard to measure output) and individual (reasonable output
measures available)• Collective => Task Completion• Individual => Quality-adjusted outputs over expenditure
• Other classifications between services (Prendergast, 2007)• Those where organizational performance is better for individual “consumers” (social security, pensions, …• Those where organizational performance is worse for individual “consumers” (taxes, crime/justice,..)
• Importance of National Accounts => Macroeconomic policy decisions; => Measuring welfare• Measuring public-sector productivity may require different approaches for each of these purposes
• What about just ignoring the public sector in the accounts?• Opportunity cost of resources used as inputs into public production? (Public as substitute)• Indirect effects of public production on private production (health/educ of labor)? (Public as complement)• Activities are often without market prices but are still welfare-enhancing such that they should be counted
• Yet, increasing national accounts if often not the goal of major policy (peace, inequality, human rights)• There is a difference between output estimates (for national accounts, e.g.) and performance measures of public-service
management• They use much of the same data.
• But performance indicators need precise, transparent and simple measures that cannot be manipulated. They do not necessarily need to be stable over time and can be selective in their coverage
• Output measures used for accounting purposes need to try and cover all activities and be stable over time• Outputs versus Outcomes
• Outputs are useful performance targets (number of vaccinations per 1000 persons) and outcomes are a function of many external factors (GDP, diets/food/agriculture innovations, exercise habits, smoking/alcohol preferences,…). Assessing the performance of the NHS based on these is inaccurate
• National accounts measures are not a substitute for performance measures and can generate perverse incentives
The Atkinson Review 2005
43
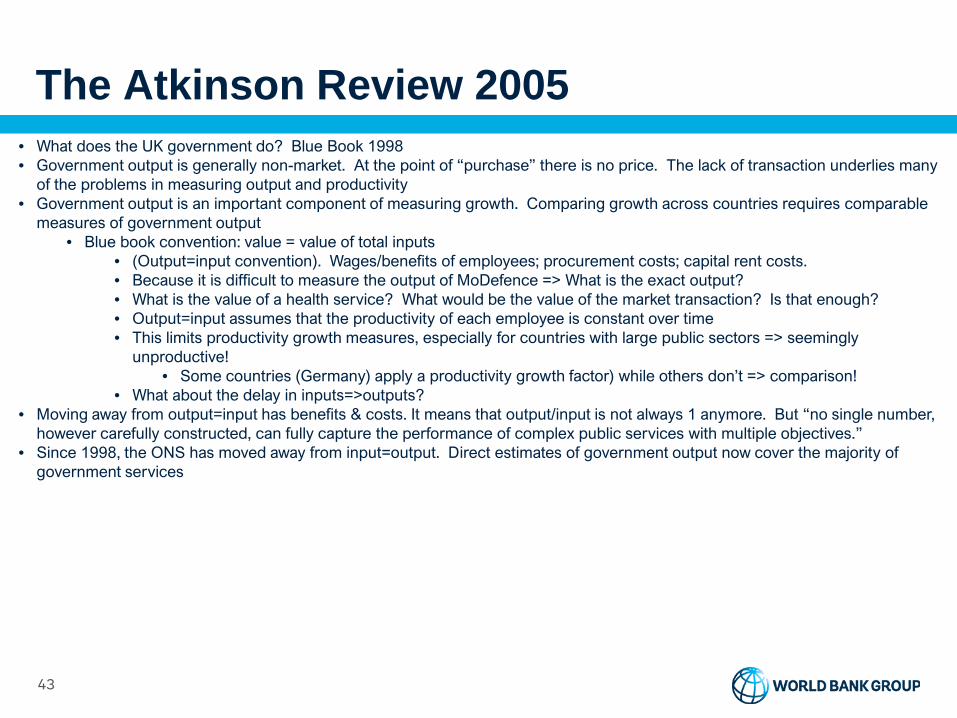
The Atkinson Review 2005• What does the UK government do? Blue Book 1998• Government output is generally non-market. At the point of “purchase” there is no price. The lack of transaction underlies many
of the problems in measuring output and productivity• Government output is an important component of measuring growth. Comparing growth across countries requires comparable
measures of government output• Blue book convention: value = value of total inputs
• (Output=input convention). Wages/benefits of employees; procurement costs; capital rent costs.• Because it is difficult to measure the output of MoDefence => What is the exact output?• What is the value of a health service? What would be the value of the market transaction? Is that enough?• Output=input assumes that the productivity of each employee is constant over time• This limits productivity growth measures, especially for countries with large public sectors => seemingly
unproductive!• Some countries (Germany) apply a productivity growth factor) while others don’t => comparison!
• What about the delay in inputs=>outputs?• Moving away from output=input has benefits & costs. It means that output/input is not always 1 anymore. But “no single number,
however carefully constructed, can fully capture the performance of complex public services with multiple objectives.”• Since 1998, the ONS has moved away from input=output. Direct estimates of government output now cover the majority of
government services
44
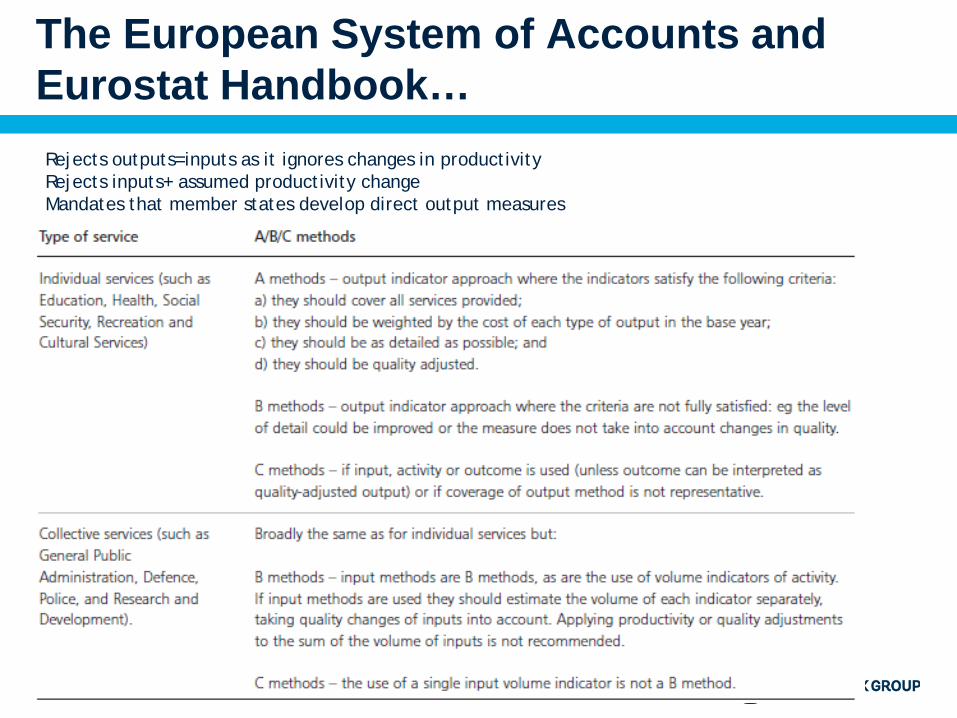
The European System of Accounts and Eurostat Handbook…Rejects outputs=inputs as it ignores changes in productivityRejects inputs+ assumed productivity changeMandates that member states develop direct output measures

45
The Atkinson Review 2005• They are attempting to measure changes in output (performance). No attachment of $$$ to the output (in levels or changes).• No attempt is made to assess how inputs ($$$) => outputs $$$• They need to be continuously monitored to ensure that they capture changes in quality and that there are no adverse
consequences in other dimensions. How to account for changes in labor productivity (e.g. through the increased use of tech)?
• Divide 1 by 3 to obtain cost per unit of government output (towards more classical measures of productivity)• The output=input method, only 1 and 2 are used (inputs). Used for Defence, General Public Administration, Economic services,
Environmental Protection, Recreation and Culture, Housing and Community Amenities
• Education inputs: labor (teachers, secretaries, caretakers, …) wages and national insurance/pensions. Good and services (books, pens, lighting, heating, transport…). Capital (buildings, equipment).
46
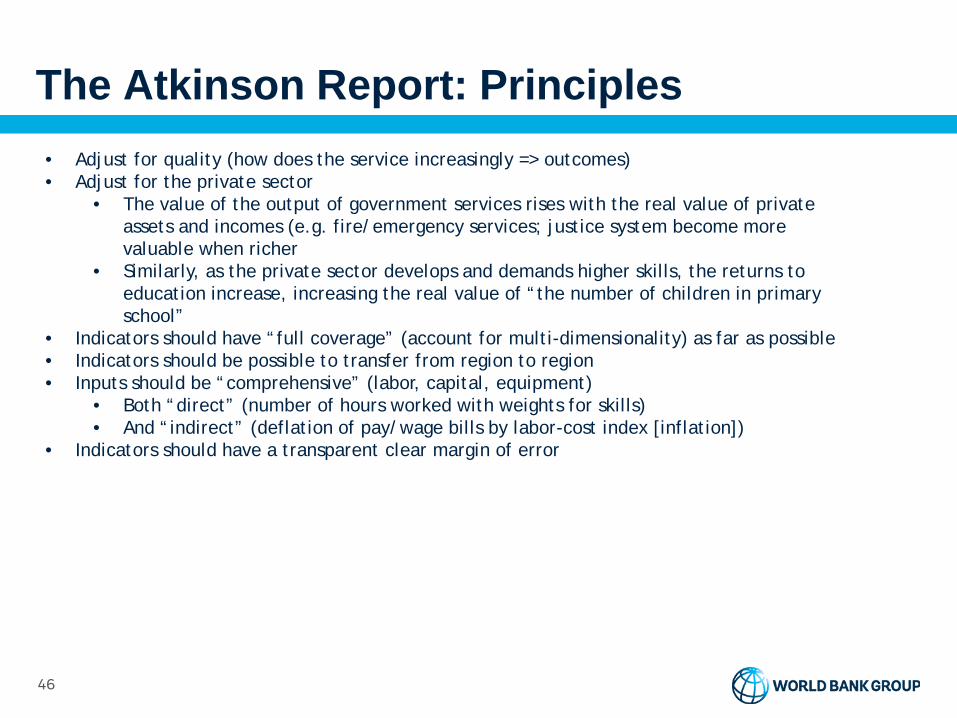
The Atkinson Report: Principles• Adjust for quality (how does the service increasingly => outcomes)• Adjust for the private sector
• The value of the output of government services rises with the real value of private assets and incomes (e.g. fire/emergency services; justice system become more valuable when richer
• Similarly, as the private sector develops and demands higher skills, the returns to education increase, increasing the real value of “the number of children in primary school”
• Indicators should have “full coverage” (account for multi-dimensionality) as far as possible• Indicators should be possible to transfer from region to region• Inputs should be “comprehensive” (labor, capital, equipment)
• Both “direct” (number of hours worked with weights for skills)• And “indirect” (deflation of pay/wage bills by labor-cost index [inflation])
• Indicators should have a transparent clear margin of error