a jmp-based user-friendly analysis and presentation … jmp-based user-friendly analysis and...
TRANSCRIPT

Consumer test Evaluation Tool
1
A JMP-Based User-Friendly Analysis and Presentation System for Consumer Test Evaluation & Interpretation in the Food Industry
Jeff Stagg- Kraft Foods
David Rose - SAS

Consumer test Evaluation Tool
Consumer Test Evaluation Tool
• A customised software interface that performs data handling / mathematical calculation to make a wider community more efficient / effective in work and increase the use of best practices
• A proprietary, user friendly, software tool created in collaboration between SAS and Kraft Foods for use by Kraft‟s consumer research scientists
• Executes customised JMP scripts for efficient consumer test evaluation
• Designed for world-wide application with a global user base
Description

Consumer test Evaluation Tool
Speed, quality, cost
• Analysis completed in half the time
• Increasing use of „best‟ practice procedures
• Consistent graphics in management/ client communication
• Global user capability replaces expert coverage from key sites
• More/ broader influence of experts via training/ advice/ coaching
• Software licensing/ deployment & management efficiencies
Consumer test Evaluation Tool
Benefits

Consumer test Evaluation Tool Consumer test Evaluation Tool
Example of Data Sources
Consumer Test
• Panel of 8-12 expert tasters
• 6+ products
• In-house
• 30+ sensory attributes [Intensity]
• 2-3 replicate sets of determinations
• Managed by Kraft sensory professionals
To analyse results from consumer studies in conjunction with sensory,
chemical, physical, process design data to deliver interpretations of consumer
preferences for product change/ portfolio optimisation decisions
Sensory Test (QDA)
Panel trained to evaluate products objectively
and are expected to be as homogeneous in
their assessments as possible
Consumer responses expected to be very heterogeneous in terms of their preferences.
[no one product expected to satisfy all]
Typical Project Objective
• 200+ consumers
• 6+ products
• Central location
• 20+ attributes [Liking, Intensity, JAR]
• No replication
• Managed by external market research agency
• Demographic, Usage, Attitudinal data

Consumer test Evaluation Tool
Product Code Product Type
X035 A1 A
X051 A1+3 A
X235 A2 A
X318 A2+3 A
X529 A2 A
X554 A2 A
X609 A3 A
X712 A3 A
X185 B4 B
X234 B5 B
X243 B6 B
X367 B4 B
X383 B6 B
X676 B6 B
X740 B7 B
X862 B6 B
2 beverage types: “A” and “B”
3 flavours of “A” (1 - 3)
4 flavours of “B” (4 - 7)
[ Flavours A ≠ B]
The product set is from a Category Appraisal Study on two different types of
beverage: multiple flavours
Case Study Product Set

Consumer test Evaluation Tool
Case Study Objective
• Obtain overall liking scores for products within the beverages category in a single study
• Determine if there are significant differences in the overall liking scores between:
• two key beverage types
• multiple flavours
• Identify consumer groups with different type/flavour preferences
• Determine differences in product usage / occasions in consumption for flavours and beverage type
• Identify potential opportunities for Quality Improvement (QI) or New Product Development (NPD) that would help shape strategic development

Consumer test Evaluation Tool
Case Study Workflow
Data validation
Create product colour profiles
Key attribute assessment
Cluster analysis
‘Drivers of liking’
Consumer Testing
[data collation]
Consumer Test Report
[data interpretation]
Distributions of variables are presented and
range properties assigned
Products are assigned colours for graphical output
Multi colour profile sets are possible that can
represent a property (origin, brand) or rank order of a
key measure
Graphical representation of data – histogram with range
test; star, scatter, stacked bar & distribution charts
Review of solutions : cluster method & number of
clusters- using dendrogram, 3D preference map and
product cluster scores
PCA map (external data) with key attribute overlay (liking)
& optional response surface model, single attribute
regression using scatter plot format

Consumer test Evaluation Tool
Data Scaler helps validate labelling assignment to data and variable
ranges versus consumer test questionnaire
Data validation

Consumer test Evaluation Tool
A central feature of the application makes available to users the means to
switch colour schemes at any point in the analysis, allowing them to
investigate different features of the data.
Each colour scheme constitutes a profile.
Multiple Colour Profiles
Overall Liking
Fisher's LSD (a=0.05); LSD=0.16; N=796
1 2 3 4 5 6 7 8 9
X185 - B4 6.33
X367 - B4 6.46
X234 - B5 6.58
X740 - B7 6.61
X383 - B6 6.73
X035 - A1 6.74
X051 - A1+3 6.76
X243 - B6 6.77
X862 - B6 6.80
X609 - A3 7.10
X554 - A2 7.17
X318 - A2+3 7.22
X712 - A3 7.35
X676 - B6 7.38
X529 - A2 7.52
X235 - A2 7.54
Profile to highlight differences in beverage
type (purple for “A” , grey for “B”). Profile to highlight extent of overall liking,
irrespective of product type.

Consumer test Evaluation Tool
Histogram plot of average overall liking scores with range test enables
fast/ simple interpretation of product performance in consumer test
Key measures assessment
All Test Persons
Overall Liking
Products „connected‟ by same bar are statistical parity for significance test applied

Consumer test Evaluation Tool
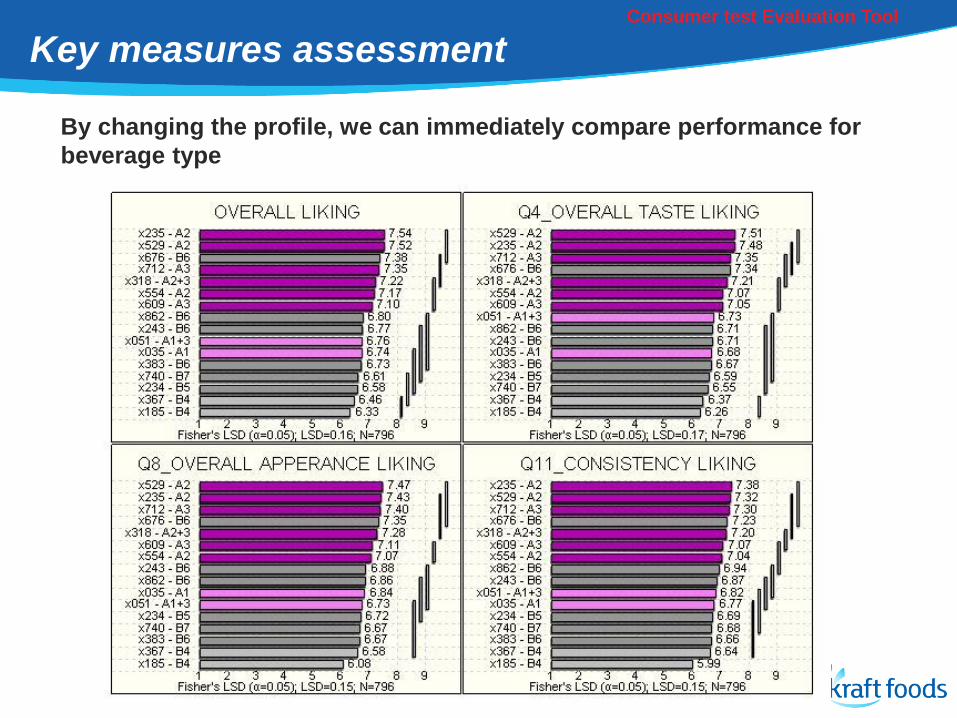
Colour coding by order of overall liking enables easier visual interpretation
=> Most liked products score well for taste, appearance and consistency
Key measures assessment
Consumer test Evaluation Tool
By changing the profile, we can immediately compare performance for
beverage type
Key measures assessment
Consumer test Evaluation Tool
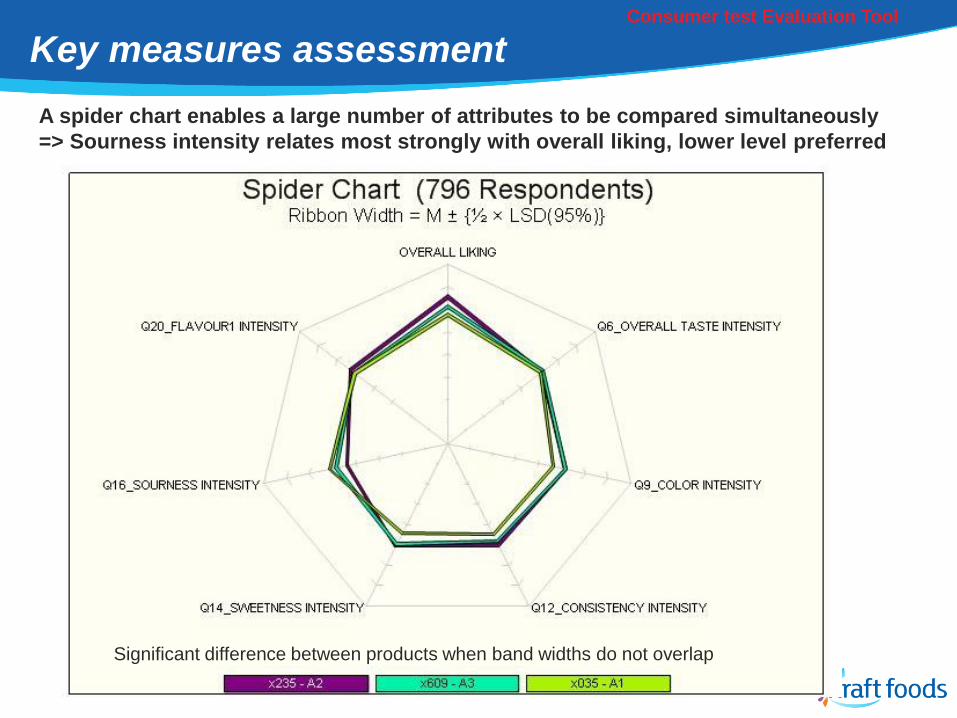
A spider chart enables a large number of attributes to be compared simultaneously
=> Sourness intensity relates most strongly with overall liking, lower level preferred
Key measures assessment
Significant difference between products when band widths do not overlap

Consumer test Evaluation Tool
All Test Persons
Liking score distribution charts illustrate „satisfaction profile‟ for each product
No single product completely satisfies all consumers: with approximately 35% of
ratings for most liked products scoring less than 8.0, could there be two or more
groups of consumers with different patterns of liking?
=> Cluster Analysis
Key measures assessment

Consumer test Evaluation Tool
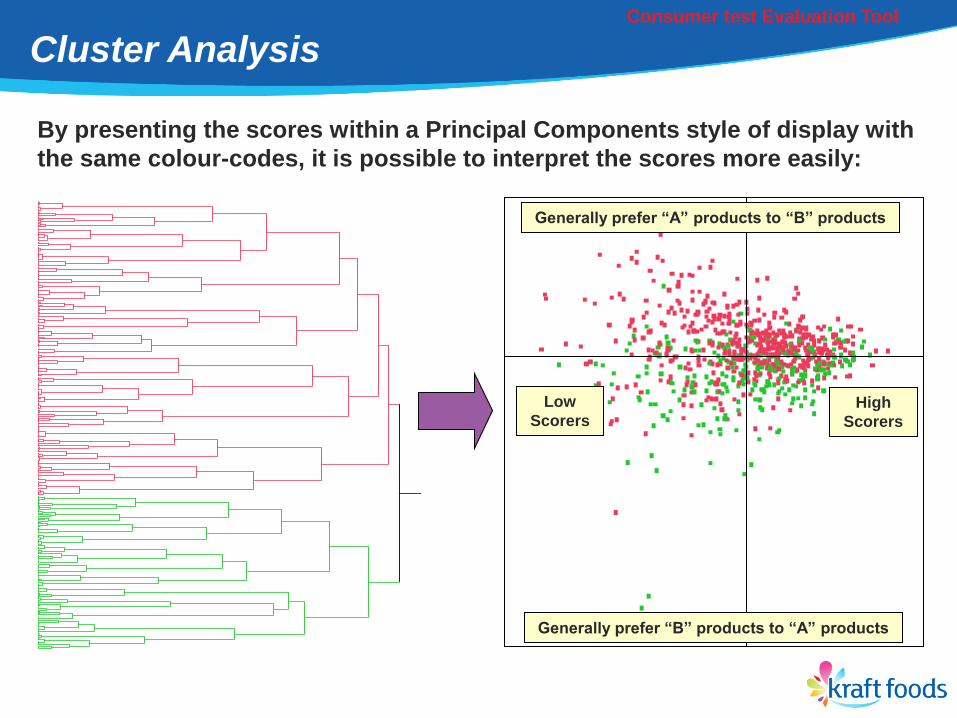
We can perform a cluster analysis on the respondents‟ data to identify groups
of like-minded individuals who score the products in similar ways:
• The dendrogram on the left shows how the
consumer study respondents cluster.
• Each “twig” on the left of the diagram represents
one respondent. The sooner these “twigs” join
up into branches, the more similar those
respondents are in terms of their scoring
patterns.
• Determining the actual number of clusters is
often somewhat subjective. In this example
there could be several clusters – but for
illustration purposes we have assumed that
there are just two: the “red” respondents and the
“green” respondents.
• We can show the same data in another format
which allows us to interpret the clusters more
easily…
Cluster Analysis
Consumer test Evaluation Tool
By presenting the scores within a Principal Components style of display with
the same colour-codes, it is possible to interpret the scores more easily:
Chart showing PC1 vs PC2 for 796 respondentsGenerally prefer “A” products to “B” products
Generally prefer “B” products to “A” products
High
Scorers
Low
Scorers
Cluster Analysis

Consumer test Evaluation Tool
We can also view the plot in three dimensions, and view it from different
angles. We can also incorporate the products into the plot to show which
ones are preferred by which groups of consumers:
Cluster Analysis

Consumer test Evaluation Tool
Should a „satisfactory‟ clustering solution be identified, products ratings
for each cluster group can be generated and compared PCA Plot of Scores (2 Clusters) Crosstabs (2 Clusters) Product Names & CodesDendrogram (2 Clusters)
Cluster 1 (66%) Cluster 2 (34%)
Overall Liking
Overall Liking
Larger cluster strongly prefer beverage type A
Smaller cluster like beverage type equally, their response driven by flavour – optimal levels of 6 & 2
Cluster 1 (66%)
Cluster 2 (34%)
Cluster Analysis

Consumer test Evaluation Tool
Clu
ste
r 1 (
66%
) Clu
ste
r 2 (
34%
) The clusters have different relationships with the 1st principal component, which
has a greater correlation with the data in both clusters than the 2nd or the 3rd
Drivers of liking

Consumer test Evaluation Tool
Drivers of liking
Combining range test with sensory data PCA helps to identify potential
„drivers of liking‟
Principle Components Map with Cluster 1 Liking Overlay Cluster 1 consumer overall liking ratings
Simple Conclusion : expert sensory attributes - viscous, flavour 2 & astringent are key descriptors that describe differences between beverage type hence product liking scores for consumers in Cluster 1 (66%)

Consumer test Evaluation Tool
Fitting a response surface to cluster 1 overall liking mean scores identifies
potential QI / NPD insights for developing Beverage type A
Drivers of liking
Key toOverlay
123456789
X035 - A1 (7.00)
X051 - A1+3 (6.62)
X185 - B4 (6.08)
X234 - B5 (6.39)
X235 - A2 (7.57)
X243 - B6 (6.69)X318 - A2+3 (7.41)
X367 - B4 (6.22)
X383 - B6 (6.64)
X529 - A2 (7.66)
X554 - A2 (7.38)
X609 - A3 (7.40)
X676 - B6 (7.26)
X712 - A3 (7.51)
X740 - B7 (6.58)
X862 - B6 (6.56)
Overall impact
Fl avour3a
Fl avour6a
Fl avour6b
Fl avour2
Fl avour4
Fl avour7
Fl avour8
Fl avour9
Cook_Processed
Medicinal _Chemi cal
Perfumey_Soapy
Sweet Sour
Bi tter
Astri ngent
Vi scous
Sour aftertaste
Bi tter aftertaste
Astri ngent aftertaste
1
2
2
1 Optimal product („me too‟ X529) on boundary of optimal cluster 1 sensory area
Optimal product central to optimal cluster 1 sensory area

Consumer test Evaluation Tool Consumer test Evaluation Tool
• User-specified product colour profiles (interactive switching)
• Full names or label option for chart output (interactive switching)
• Customised scripts for Kraft Foods analysis best practices
(example: identifying clustering solution)
• Business presentation chart formats
(interactive customisation – properties & layout)
• File/chart handling (combining and storage)
• Access to full JMP software functionality (DOE, regression, partitioning etc)
Analysis performed in half the time
=> A saving 3-5 man days per study
Efficiency Benefit

Consumer test Evaluation Tool
• Quality Improvement / New Product Development insights are generated from the co-analysis of objective and subjective data relating to a range of products, allowing for the possibility that different consumers have different preferences.
• The JMP application developed for Kraft Foods runs a series of customised scripts that perform this analysis efficiently, follows a best practice approach and delivers report-ready graphics and statistics at every step.
• The application allows researchers to spend substantially less time processing their data, and correspondingly more time considering what it means.
Summary
Consumer Test Evaluation Tool