a hydrologic study of ' a small suburban watershed
TRANSCRIPT

"',',.',',,', ' '
'"" ",
"
A HYDROLOGIC STUDY OF ' A SMALL SUBURBAN WATERSHED
by
M.W. Anderson B.E. Ross
PUBLICATION NO. 31
of the
FLORIDA WATER RESOURCES RESEARCH CENTER
RESEARCH PROJECT TECHNICAL COMPLETION REPORT
,OWRT Project Number A-019-FLA
Annual Allotment Agreement Numbers
14-31-0001-3809 1 4-31 -0001-4009 14-31-0001-5009
Report Submitted: October, 1975
The work upon which this report is based was supported in part by funds provided by the United States Department of the
Interior, Office of Water Research and Technology as Authorized under the Water Resources Research Act
of 1964 as amended.
~.,.
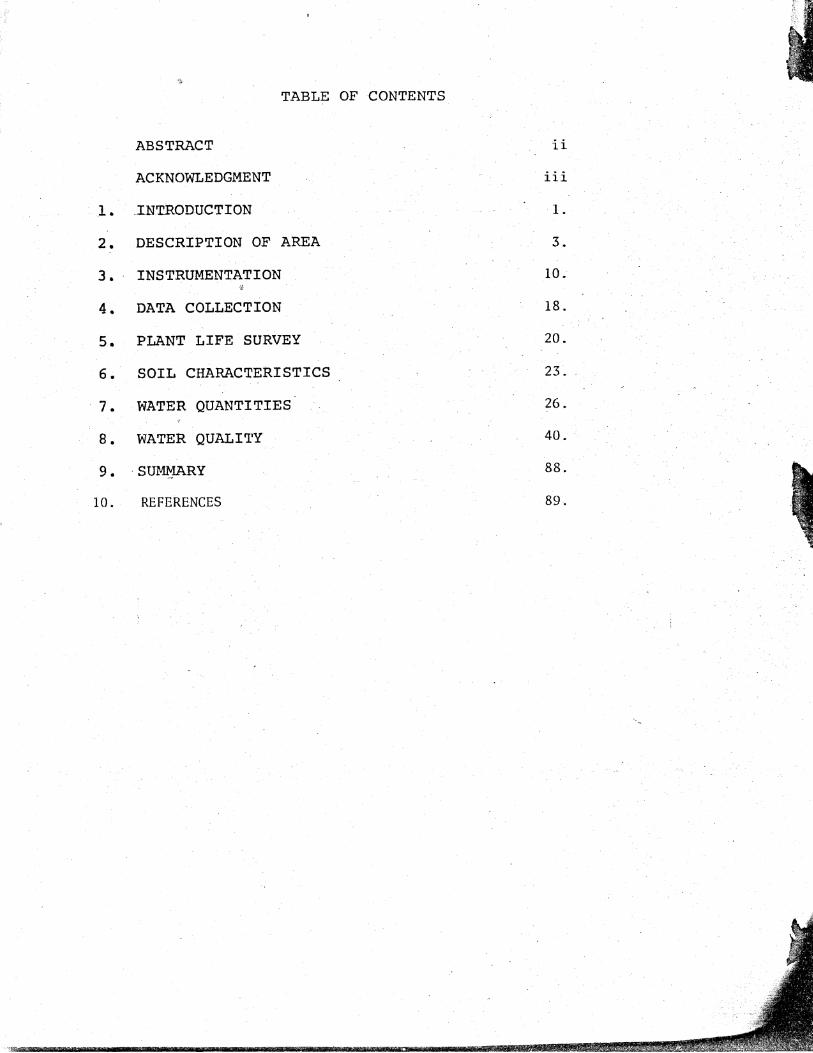
TABLE OF CONTENTS
ABSTRACT ii
ACKNOWLEDGMENT iii
1. INTRODUCTION l.
2. DESCRIPTION OF AREA 3.
3. INSTRUMENTATION 10.
4. DATA COLLECTION 18.
5. PLANT LIFE SURVEY 20.
6. SOIL CHARACTERISTICS 23 ..
7. WATER QUANTITIES 26.
8. WATER QUALI'l'Y 40.
9 • . SUMMARY 88.
10. REFERENCES 89.

J'.~~ :~-
:1-:',
'.·.:.·.1··· .. ··'.;··' ----~'!
.il r r
ABSTRACT
A 126 acre tract of land in a natural undisturbed state and the adjacent 239.3 acres that made up the watershed, were instrumented in November, 1971, in order to determine the effect of development on the hydrology of the 126 acre tract. Hydrologic quantity and quality data were collected until April, 1975.
The tract, which is located in Tampa, Florida, did not experience the planned extensive development due to financial problems of the developer. Consequently, the anticipated major hydrologic changes did not occur. However, significant alterations to the natural drainage pattern of the property were made and these caused changes in the runoff quality which were documented.
j 1
ACKNOWLEDGMENT
The authors wish to express their sincere appreciation to those who gave of their time and talent to make this report possible: Miss Paula Jerkins, Mrs. Sally Hammer,. Mr. Robert Moresi,Mr.
---Tom-Ros-kay, Mr. Charles Palmer, Jr., and many others too numerous to mention, who provided physical labor to install and maintain the structures and instruments, and those in other colleges who contributed their special knowledge for the collection and analysis of 'chemical and biological data.
Thanks are also extended to the developers who co-operated fully with this study. They showed a genuine interest: in the results, whether . good or bad, from their point of view. Their property was available without question to the many students who took
. part during the data collection phase of· this study.'

.J ...... ' .•. ~ ..... ' .. . :,f
... J .. ' ........................ . c~1:
~;;:,
" i~
-1-
1. INTRODUCTION
The purpose of this project was to document the changes in the quality and quantity of stormwater runoff from a watershed which was to be developed from a natural state into a high density apartment complex.
In order to accomplish this, rainfall gages, an evaporation gage, and flow measuring devices were installed within the watershed area,from which daily hydrologic data were obtained. In addition, water quality measurements were taken at the drainage exit of the study area. The parameters measured were dissolved oxygen, pH, carbon dioxide, temperature, hydrogen sulfide, color, turbidity, metaphosphate, orthophosphate, nitrate, nitrite and coliform count.
Shallow aquifer test wells were installed and monitored in order to establish ground water flow directions, ijround water storage changes and ground water quality changes.
Initially it was anticipated that the entire wqtershed being studied would be developed into a relatively high density apartment/townhouse complex. Due to the present slump in the housing industry less than 15% of the watershed was actually developed. The majority of these 64 units are still unoccupied. Therefore, the anticipated extensive quality and quantity changes in storm runoff did not occur. How~ver, unexpected construction activities have caused hydrologic changes which have been documented.
A major change occurred in the watershed during the initial phase of the investigation. A fifty-four inch diameter pipe was installed under the state highway ...,..,hich originally provided the southern hydrologic boundary for the study area. This necessitated an expansion in size of the study area and a relocation of gages. A portion of the region which is drained by use of this pipe consists of a medium density apartment complex. Data pertaining to the quality and quantity of storm runoff passing through this pipe have been obtained. On two occasions water quality measurements were taken at spaced time intervals throughout the storm, and quantities of pollutants per unit area were determined.
",;C''':!m. ___________________ _

-2-
During the final year of the study a small shallow lake on the property was greatly enlarged ·and deepened. The discharge from the study area was then routed by the developer into this lake rather than through the existing natural drainage channel. Water quality changes in the lake during this time have been recorded.

..
•.•.• )~ .. J
·····:.··.·· .• -·'1····.··-'·
/:' .~~
.-f !
-3-
2. DESCRIPTION OF AREA
The watershed chosen for this study is located near latitude 28° 04' north and longitude 82° 23' west on the west oentral coast of Florida. This is approximately 1.5 miles east of the University of South Florida, as shown on Figure 1.
The olimate of the region is basically subtropical characterized by long humid summers and mild winters. It is strongly influenced by winds from the Gulf of Mexico. Variations in day to day maximum temperatures during the summer range from about 72°F to 90°F and during the winter from about 55° to 75°F with average daily temperature of 72°F.
Precipitation is highly variable in frequency distribution, distribution, amount, and intensity, due to frontal storms, local thunderstorms and tropical hurricanes. The normal annual precipitation is approximately 55 inches and is unevenly distributed with more than half falling from June to September.
The Tampa Bay Region is currently experiencing the worst drought in the history of the Tampa weather station. The drought which began in 1961 is still continuing. In Table I the annual rainfall departure from normal and accumu la ti ve deficiency for the pas'::;' fourteen year period is shown.
This extended drought is particularly significant to this study because of the high evapotranspiration in th~ area. On the average for this region ~pproximately 70% (37-40 inches) of the annual rainfall becomes evapotranspiration, while approximately 27% (15 inches) drains off by way of surface drainage, and the remainder goes into groundwater flow. During extended dry periods, the percentage of surface runoff decreases because of markedly increased surface storage and the evapotranspiration rate remains fairly constant. This causes difficulty in obtaining representative runoff hydrographs and documenting normal lag times.

-4-
, ,. -, i r" ;~ . ~ ...
i
FIGURE 1
WATERSHED LOCATION

J.~.' c.
';"
-5-
TABLE I
Departure from Normal Rainfall for Tampa,Florida -(Based on U.S. Weather Bureau Records)
Year
1961 1962 1963 1964 1965 .1966 1967 1968 1969 1970 1971 1972 1973 1974
Departure (inches)
-16.53 9.95
- 8.15 + 6.35 - 8.79 -15.52 -12.21 -12.22 + 2.65 -13.30 - 5.24 - 9.39 .;,. 1.86 -15.48
Cumulative (inches)
-16.53 -26.48 -34.63 -28.28 -37.07
. -52.59 -64.80 -77.02 ~74.37 -87.67 -92.91
-102.30 -104.16 -119.64
The study area is underlain by the Floridan aquifer which is made up of limestone and dolomite rocks. The potentiometric pressure of approximately 30 feet above msl is contained by the impervious s~diment of the Hawthorne Formation. At an elevation of 20 to 25 feet throughout the area there is a thick clay lense upon which a surface water table is-perched.
A map of the watershed is presented in Figure 2. Originally only the 126 acre portion north of Fowler Avenue was to be examined since it was a well defined completely natural state watershed. However, subsequent to the funding of the study and prior to installation of all measuring devices, a 54 inch concrete pipe" which drains 240 acres, was installed under Fowler Avenue. This southern region does contain some developed portions, as indicated in Figure 2. The apartment complex immediately south of the drainage pipe was under construction when the pipe was installed.

:t.
-0-
56'IH ST.
SCALE 1" = 900 f
Area Nor+..h of Fowler Ave. 126.2 acres
Area South of Fowler l..ve. 239.3
Total Area 365.5 acres
~ Developuent canpleted
~~ Multifamily Residential
.. ~~. Singlefamily Residential
FIGURE 2
STUDY l'7ATERSHED
(,
I
-7-
The topography of the northern portion is quite gentle with ground elevations varying from 25 to 35 feet. On the southern portion, the topographic gradient is much steeper with ground elevations decreasing from 85 feet to 33 feet within 2300 feet.
There was'a small natural lake within the 126 acre portion which drained through a natural ditch into the Hillsborough River at times of heavy runoff. The surface area of the lake originally varied from 0.25 acres to 4 acres. The depth of this lake was increased from an average depth of 3 feet to 14 feet deep, while the surface area was increased to approximately 6 acres.
The original condition of the study area is shown in Figures 3, 4, 5 and 6. The study area represented a good cross-section of common undeveloped land in this portion of Florida; grading from hardwoods to pines and palmettos, to marshlands.
The type of construction that was built on the study area watershed can be seen in Figure 7, which shows a condominium under construction in the area north of Fowler Avenue. Figure 8 shows one of the abandoned foundations. The type apartments in the area south of Fowler Avenue and the drainage channel that drains the single family homes, are shown in Figures 9 and 10, respectively.

Figure 3. Ha..rd.wocxl Uplands at Start of Project
Figure 5. Underbrush at Start of Project
-8-
Figure 4. Pine~s at Start of Project
Figure 6. Marsh at Start of Project
J
-

Figure 7. Construction of Condaniniurn
.... 9-
Figure 9. Apartment carp1ex, South of Fowler looking north
Figure B. Abandoned Foundation
"':"':.t' .' .•
Figure 10. Drainage canal from south edge of watershed
-10-
3. INSTRUMENTATION
In order to evaluate the variou~ phases of the hydrologic cycle for the study area, the following equip
.ment was installed on or near the test watershed.
1. a recording rain gage,
2. five nonrecord~ng rain gages,
3. an evaporation pan,
4. a recording evaporation gage,
5. a Parshall flume,
.. 6. a plywood V notch weir,
7. two recording water level gages,
B. two lake stage gages, and
9. seven shallow wells.
The locations of all the rainfall gages and equipment are shown on Figure 11. The recording rain gage, and recording evaporation gage were located on private property adjacent to but outside of the boundary of the watershed for security reasons. They were housed in a wooden box for additional protection. (See Figure 12) A Parshall ~flume was installed in the drainage ditch into which the 54 inch pipe discharges (See Figures 13, 14, 15). Unfortunately, this. process had to be repeated on four additional occasions due to failures of the soft, alluvial sand banks of the ditch. The ditch was not kept clear and by the end of the project had a large crop of aquatic. weeds. In June 1972, the Stevens eight day water level recorder was stolen off of the flume and four months of data was therefore not obtained.
A plywood darn with a metal edged V notched weir was built across the stream which drains the lake into the Hillsborough River~ This weir was calibrated in place with the use of a large volume portable pump and a portable weir box. A Stevens eight day water level recorder, placed upstream of the weir, recorded the water depth. (See Figures 16 and 17) Three months later, October 1971, the weir was destroyed by vandals. Consequently, it was necessary to build, install and calibrate again.
i' i "
,
r

"
0#7
LAKE
-11-
Hilley's A
'"
SCALE: 1'1 = 900'
KEY: o OBSERVATION WELL .A NON-RECORDING RAIN GAGE )(EVAPORATION PAN A RECORDING RAIN GAGE AND
RECORDING EVAPORATION GAGE
II WEIR I FLUME
* USGS Staff Gage
FIGURE 11
56th Street A
St.
INSTRUMENT LOCATIONS IN WATERSHED
Illth Ave. A
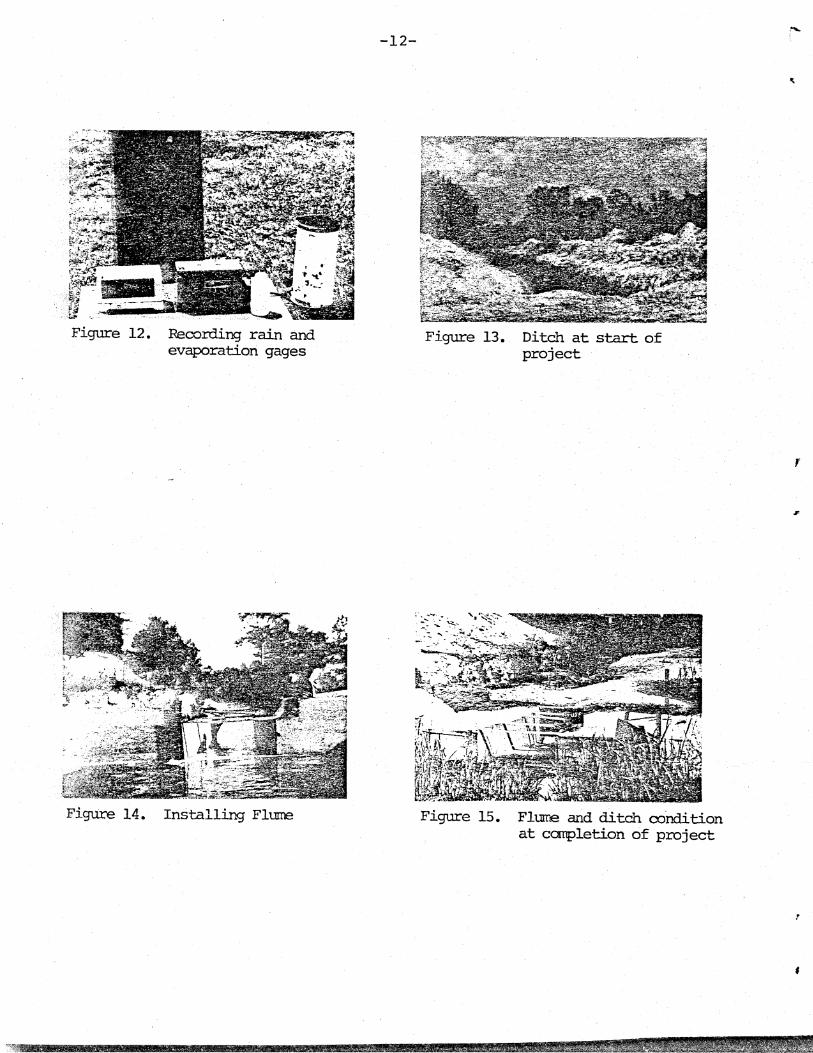
Figure 12. Recording rain and evaporation gages
Figure 14. Installing F1Ullle
-12-
Figure 13. Ditch at start of project
Figure 15. Flmne and ditch conm.tion at canpletion of project
r
,
,
~----------------------------.. -........

...
-13-
Figure 16. View downstream of Vnotch weir
Figure 18. Reading lake staff gage
Figure 17. V-notch weir
Figure 19. USGS staff gage in Hillsborough River
-14-
A standard Class A land pan was built and installed in order to obtain evaporation data. Later,' a Weather Measure recording evaporimeter was also installed near the ~tudy area; however, it proved quite unsatisfactory. It frequently·would not respond when-water evaporated from the reservoir, due to the static friction of the linkage connecting the recording pen to the reservoir float. In addition, when a significant rainfall occurred the pen went off the chart and failed to return. It was returned to the manufacturer for servicing but no noticeable improvement occurred.
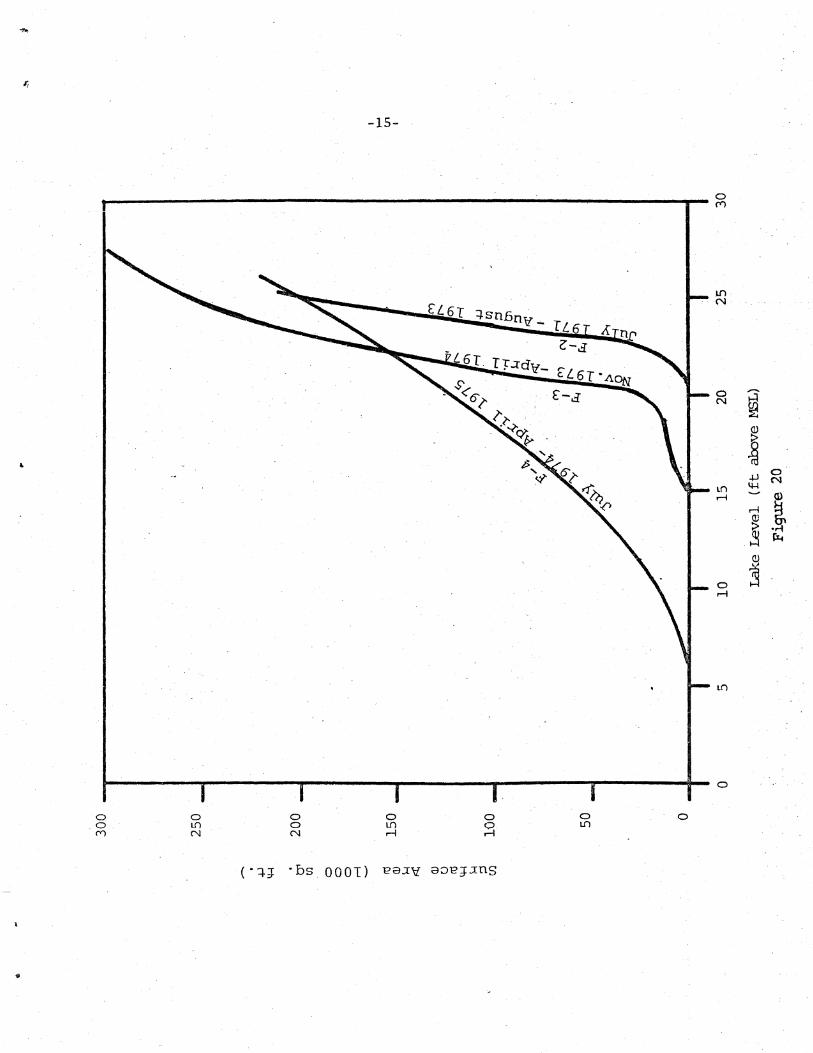
Originally two staff gages were installed in the lake in order to obtain lake surface elevations. One gage was used when the lake was exceptionally low and the other for normal and high stages. When the lake was deepened to a uniform depth by the developer only one gage was required. (See Figure 18) It was necessary to survey the lake, prepare a contour map, and prepare an elevation-surface area curve three different times (See Figure 20). This was because the area and volume of the original shallow lake were changed two different times •.
Seven shallow wells were put down for the purpose of monitoring the perched water table. The holes were' drilled with a hydraulic drill rig borrowed from the USF Geology Department. A five inch rotary bit was used to cut through the sand overburden which was washed to the surface by water injected through the A-rod. When the thick impermeable clay layer which underlies the area was reached, the drilling process was stopped and the drill was allowed to rotate and wash out a sump at the bottom of the hole. Following the washing process, the A-rod and bit were removed from the hole and a gravel pack or sand pack was put in the bottom of the sump. .. Then a three inch, 260 psi, PVC casing with well screen attached, was put into the hole and more gravel added around the screen and casing. Well logs for these are shown in Table II.
The well screen· consisted of a twelve inch section of PVC pipe, plugged at one end, with random 1/8 inch wide slots cut into it. The upper end of the pipe was covered with fine 80 x 80 mesh screen.
The elevation of each well was established from a known bench mark.
\'<;;,
r
,
"bs 0001) ( "1-J
-15-
G-d
L6r YJ.;rdit_ cL6Y- 4 9N
l(') r-i
~ """' & ~
0 .IJ N 4-1
(l)
~ "~ ~ ~ (!)
~

.• :".: i ,,:; •••. ~ I·';;
TA&u.:. II
WELL DATA:
Well # IDeation Well IDg Depth of Hol~ Pack To Botton To Screen
1 . west of ditch dark brown {organics} for 3 1/2' I light 14' 13' gravel brown for next 6 1/2' ,at 10' very dark sand then at 13' light again, at 14' white with a small clay fraction.
2 ' east of ditch organics for 2' . then lighter brown 10' ,8 1/2' gravel for next 6', light fine sand till 12' where clay was hit.
J
4 lake organics for 4' theI+ lighter color with 9 1/2' 81/2' sand I-'
clay particles for next 4', at 8' clay. !f'
3 center of area brown sand to 8' very fine, next· foot 8 1/2'· 7 1/2' gravel very dark with a small clay fraction.
6 creek 3 'of dark brown sand then 2 ' of lighter 7'· 6' gravel sarrl, at 5' slightly clayey sand to 9' where clay is praninent. .
7 road organics for first 4 'then brown sand for 7'1/2' .. 6 1/2' gravel
1', light sand to 9' where clay was hit.
5 river organics for first 4' then light brown 8 1/2' 7 1/2' gravel sand next foot, at 5' organics and roots, sand and organics to 10', no clay; fran all indications this was all old river channel •
• .... .. .. t
1'.
- 17-
The level of the river was measured by observation of a USGS staff, gage. Fortunately, such a gage was located in the Hillsborough'River very near the point where water f·rom the study area entered the river. (See Figure 19)
-18-
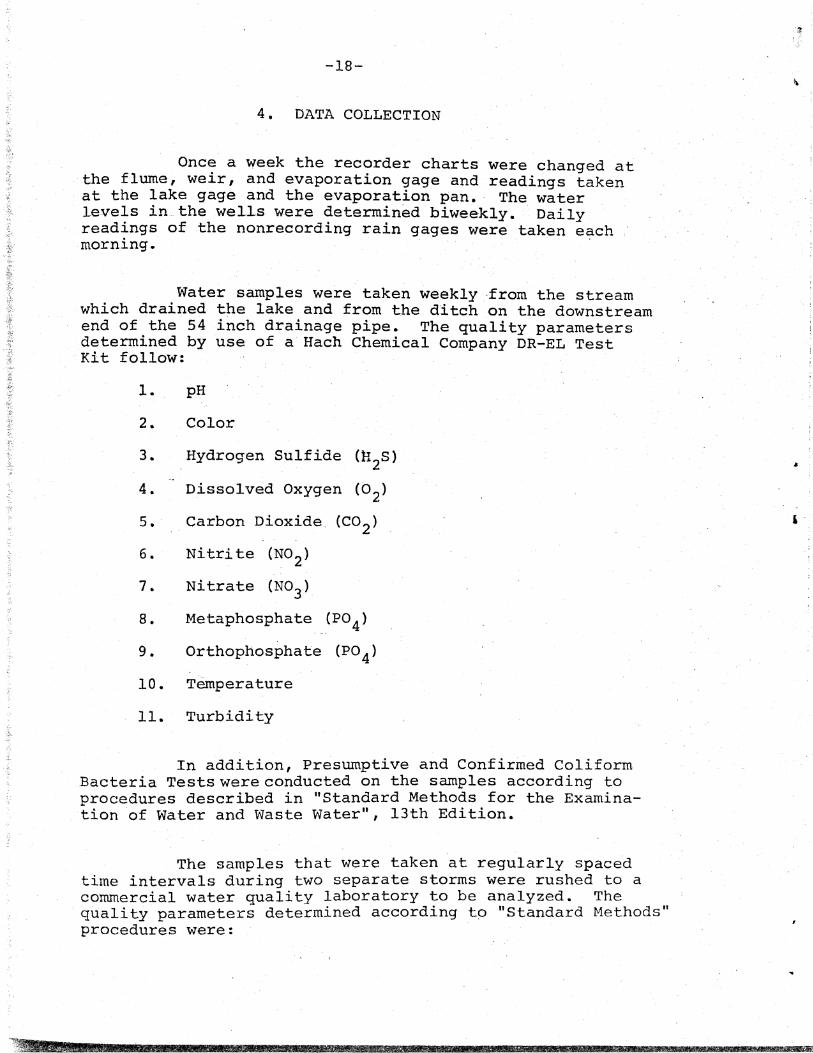
4. DATA COLLECTION
Once a week the recorder charts were changed at the flume, weir, and evaporation gage and readings taken at the lake gage and the evaporation pan.· The water Lavels in the wells were determined biweekly •. Daily readings of the nonrecording rain gages were taken each morning.
Water samples were taken weekly·from the stream which drained the lake and from the ditch on the downstream end of the 54 inch drainage pipe. The quality parameters determined by use of a Hach Chemical Company DR-EL Test Kit follow:
1. pH
2. Color
3. Hydrogen Sulfide (H2S)
4. Dissolved Oxygen (°2)
5. Carbon Dioxide. (CO2)
6. Nitri te (N02 )
7. Nitrate (N03)
8. Metaphosphate (P04)
9. Orthophosphate (P04)
10. Temperature
11. Turbidity
In addition, Presumptive and Confirmed Coliform Bacteria Tests were conducted on the samples according to procedures described in "Standard Methods for the Examinationof Water and Waste Water", 13th Edition.
The samples that were taken at regularly spaced time intervals during two separate storms were rushed to a commercial water quality laboratory to be analyzed. The quality parameters determined according tp "Standard Methods" procedures were:
.~ , ,.
,
...
•

-19-
1. Biochemical Oxygen Demand, B.O.D.
2. Chemical Oxygen Demand, C.O.D.
3. Total Oxygen Carbon, T.O.C. f ,
4. Total Kjeldahl Nitrogen
5. Nitrite, N02
6. Nitrate, N03
7. Carbon Dioxide, CO 2
8. Metaphosphate, Meta-P0 4
9. Orthophosphate, Ortho-P04
10. pH
11. Turbidi ty
12. Suspended Solids
13. Color
14. Aluminum
15. Mercury
16. Iron
17. Lead
·18. Zinc
19. Copper
20. Oil and Grease
21. Hydrogen Sulfide, H2S
22. Coliform Aerogenes Group
23. E-Coli
-20-
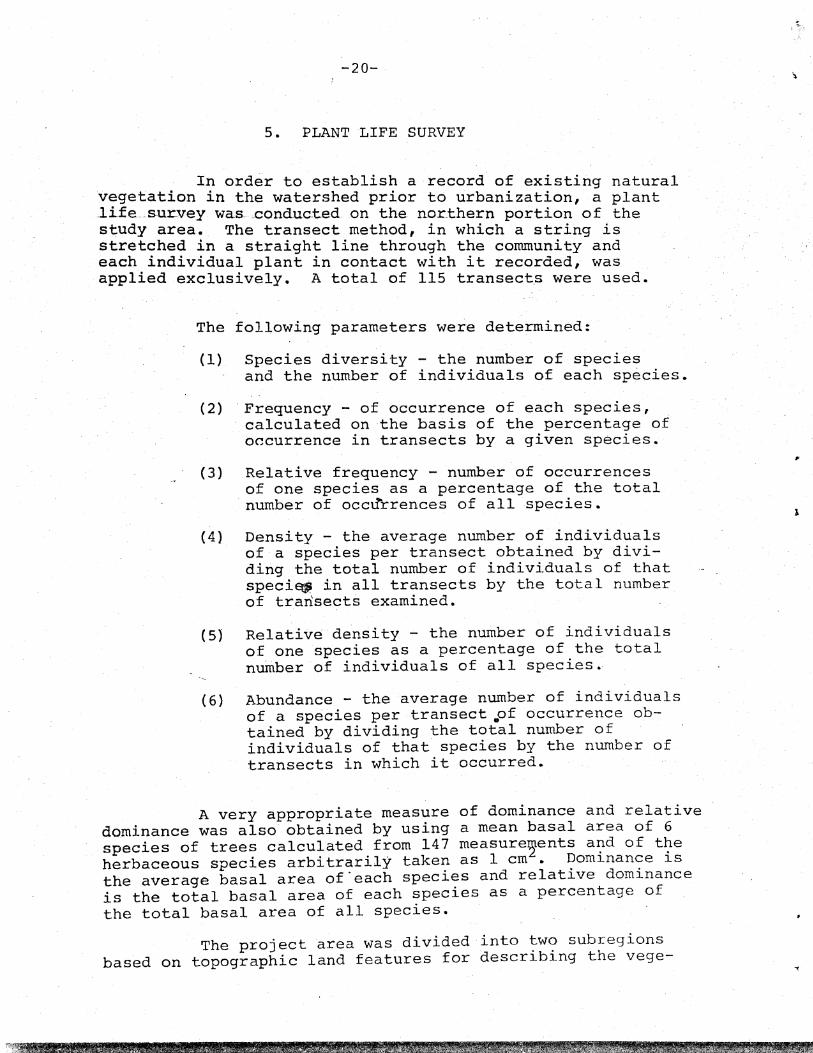
5. PLANT LIFE SURVEY
In order to establish a record of existing natural vegetation in the watershed prior to urbanization, a plant .life __ s-\lr-vey was- cconduc..tedon the nor_thern portion of the study area. The transect method, in which a string is stretched in a straight line through the community and each individual plant in contact with it recorded, was applied exclusively.. A total of 115 transect.s were used ..
The following parameters were determined:
(1) Species diversity - the number of species and the number of individuals of each species.
(2) Frequency - of occurrence of each species, calculated on the basis of the percentage of occurrence in transects by a given species.
(3) Relative frequency - number of occurrences of one species as a percentage of the total number of occurrences of all species.
(4) Density - the average number of individuals of a species per transect obtained by dividing the total number of individuals of that speci~ in all transects by the total number of transects examined.
(5) Relative density - the number of individuals of one species as a percentage of the total number of individuals of all species.
(6) Abundance - the average number of individuals of a sp~cies per transect~f occurrence obtained by dividing the total number of individuals of that species by the number of transects in which it occurred.
A very appropriate measure of dominance and relative dominance was also obtained by using a mean basal area of 6 species of trees calculated from 147 measure~ents a~d of t~e herbaceous species arbitrarily taken as 1 cm.. Dom~nance ~s the average basal area of "each species and relative dominance is the total basal area of each species as a percentage of the total basal area of all species.
The project area was divided into two subregions based on topographic land features for describing the vege-

1
-21-
t.ation.
(1) The first of these encompasses the highland portion. The soil encountered here is what Strahler (1969) refers to as red-yellow podzolic, well drained and leached in the soil zone. Vegetation reflects this condition since many plants observed require such edaphic factors. Stratification, considered very important by Richards (1952) was highly variable within this highland area. The upper stratum composed of trees vIaS mainly discontinuous which may have been as a result of "recent" disturbances. Small
. sectors, however, did contain isolated congruent canopies of either Queneu~ vinginiana or Pinu~ elliottii depending on the area being examined.
The middle stratum was better defined since Senenoa nepen~ formed a more or less thick and continuous layer. Some of the other representatives of this stratum belonged to Aqui60liaeeae and Enieaeeae as well as seedlings from Ebenaeeae, Fagaeeae and Pinaeeae.
Herbaceous plants contained within the lowest of the three strata exhibited the most well defined and continuous layer. This was to be expected, since a large portion of the area had been disturbed in the recent past. Some of the families represented in this stratum were CompoJltae, Faeaeeae and Gnamineae.
(2) The second portion of the project land examined was the lowland-pond area. The soil here was as described by St~ahler (1969), Wisenboden (ground water podzol with l-half bog soils). This soil supports vegetation that requires moist soil or a body of water for existence. The plants of this area .did not exhibit well-pronounced stratification except for the floating aquatics which, however, could not be adequately studied for lack of facilities.
The tallest trees encountered belonged to Fagaceae, My~ieaceae, Pinaeeae and Salieaceae. The canopy was discontinuous allowing ample sunlight for herbaceous plants to flourish. Two small sections, however, did exhibit congruency in its canopy at the pond's east end. One contained PinLt~ members towering to 14 m while the other site supported Queneu~ and Salix on the small canal's slopes.

-22-
The plant community of this area in its entirety can be best described as a "mi¥ed oak, pine lowland flatwoods". This is probably close to the flatwoods described by Monk and McGinnis (1966), as evidence of recent fire can.be detected. The following tree species,though.numerically small, registered high on the.Importance Value: Qu.eJtc.u..6 v.LJtg.Ln.La.na. (27.60), P.Lnu..6 eLtiot:.t:.Lf.. (13.75), and SeJtenoa. Jtepen.6 (13.926). Since members of the GJt.a.minea.e were abundant throughout, they registered highest in importance value of all the species in this area (93.89). This is to be expected since the exposed sandy soils of the disturbed areas are first colonized by the sand binding members of GJta.minea.e.
The complete record of plant life data has been tabulated and is available from the primary investigators, upon request.
Figure 21. String Transect Methcx1
\
I
E2iA

-23-
6. SOIL CHARACTERISTICS
Infiltration and disturbed sample permeability tests were performed on the various soil types in tbe study area. A map showing-the various soil types according to the U.S. Department of Agriculture, Soil Conservation Service, is shown in Figure 22 and Table III. The texture of nearly all of the soil in the area is fine sand. In some areas there is a relatively high amount of undecomposed organics which has not been incorporated into the soil zones. Therefore organics playa very small role in the rate of infiltration for this region.
A concentric ring flooding-type infiltrometer was used in the tests. The inner and outer rings were 9 inches and 14 inches in diameter respectively. Measure
. ments were made in accordance with standard procedures.
After the surface infiltration test was completed, a subsurface infiltration test was conducted a few feet from the same site. This consisted of digging a hole below the organic or root zone and performing a test in the same manner as was conducted on the surface.
The infiltration rates thus determined, though higher than normal for soils in this region of Florida, due to the previously mentioned drought, were as expected; 25-50 inches/hour for most sands; 7-20 inches/hour for cl(3.Ys and mucks.
Distributed sample constant head permeability tests were conducted in the laboratory in order to establish the relative differences between the various soil types.
The infiltration data are on file and available upon request, from the primary investigators.
D i\f\

• r
TABLE III
SOILS LEGEND AND CLASSIFICATIONS
SAMPLE SYMBOL SOIL CONSERVATION UNIFIED AASHO LAYER DEPTH SERVICE DESIGNATION CLASSIFICATION CLASSIFICATION (inches)
1 Ba Blanton fine sand, level SP,SP-SM A-3 0-42+ phase
I
2 Bb Blanton fine sand, gently SP,SP-SM A-3 0-42+ N V1
undulating phase I
3 Fe3 Fresh water swamp-cypress Variable Variable
4 Ld Lakeland fine. sand, gently. undulating phase SP A-3 0-60
5 Lh Leon fine sand SP A-3 0-20
6 Me Mines, pits and dumps Variable Variable 0-60
7 Pd Plummer fine sand SP,SP-SM A-3 0-48+
8 Rc Rutledge fine sand SP~SM,SM A-3 0-20 .
9 Re Rutledge mucky fine sands SP,SP-SM A-3 20-42+
10 Sc Shallow ponds with grass . i
Variable Variable 0-60

-26-
7. WATER QUANTITIES
One of the major purposes of this study was to quantitize the hydrologic changes that occur when a subtropical natural watershed is urbanized. Unfortunately, the planned exte:t;si,,;e development, which was initially scheduled to beg~n~n.January 1972, did not occur. The changes that did occur were minor and gradual, consequently significant changes in storm runoff quantities were not
.' detected. .
The 126 acre watershed selected for this study was a separate drainage area within the original 300 acres designated for townhouse/condominium type of development. The original developers experienced financial difficulties and the property exchanged hands two separate times. As of the present, July 1975, only 15% (18.6 acres) of the 126 acre study area has· been cleared and had housing foundations poured. Of this portion, only nine acres contain completed condominiums. Thus, only approximately 7% of the 126 acre study' area has undergone complet?· development from a natural state to a curbed and guttered, landscaped condominium complex. (See Figure 2) However, much useful water quantity data was obtained during the study period.
The study site has proven to'be a valuable training facility because of its proximity to the University of South Florida. It has been r~gularly used by wat.er resource engineering students and geolo3Y students as a field laboratory to learn how to properly conduct a hydrologic survey. .
The drainage pattern of the study area can best be explained by referring to the map in Figure 2. During the early stages of the study a' 54 inch concrete pipe which drains a region south of Fowler Avenue was installed under Fowler Avenue. This pipe discharges into the drainage ditch which is contained in the southwest corner of the watershed. Thus, the storm runoff from a 240 acre watershed was unexpectedly introduced into the 126 acre study area.
The elevation of this southern region varies from ~pproximately 85 feet at its southern boundary to 30 feet where it discharges into the 54 inch pipe. This 55 foot change occurs over a distance of less than 3000 feet. Consequently the runoff response time of this region
1

•
/'"
-27-
is quite low and very high velocities are obtained in the alluvial drainage ditch. A typical storm hydrograph for the discharge from the culvert is presented in Figure 23. A Parshall flume and a Stevens water level recorder were used to measure this flow in the ditch.
The water discharges from the northern end of this ditch and flows approximately 1200 feet in sheet flow overland through an intermittently wet region. which contains grasses, palmetto bushes and trees. This flow along with the natural runoff from the 126 acre
. study area drain into what was a small (0.25 acre), shallow «6 feet) lake. When the lake is full it discharges into a natural drainage ditch which discharges into the Hillsborough River. The lake has been enlarged to the extent that it has not discharged since October 1974.
In order to document the hydrologic changes caused by urbanization, data were collected to perform a water balance for the portion of the study area north of Fowler Avenue. Initial efforts were to independently establish the values of all components of the cycle such as rainfall, groundwater storage changes, groundwater flow, evapotranspiration, etc. However, after the types and quantity of vegetation were established, it was not within the scope of the project to quantitize the transpiration ~ates of the various plants. Therefore, the decision was made to consider evapotranspiration the unknown in the following hydrologic continuity equation:
Rainfall onto + 126 acre watershed
-(2:. Groundwater ) -Storage Change
Evaporation from Lake
Rainfall runoff from + southern area onto
watershed
Sprinkler runoff from southern are, onto watershed
( + Lake storage) Change
Volume discharged out of watershed
+ Groundwater Flow
= Evapotranspiration
The obvious unfortunate difficulty of using this equation is that all errors are accumulated into the term that is the unknown and that the least is known about.
A great deal of difficulty was encountered in attempting to quantitize these various components of the hydrologic cycle for an extended period of time, such as a year. At various times equipment has been stolen or

.5 . -::t, .
....l r-...
....l . « I-l u..c: z ......... ". H . ~ ~ p:; .,-t ......,
0
17.5
15.0
12.5
r, Vl
!.H .. U ......,
I.1l t.:) c=: 10.0 • « :r:: u tI) H CI
7.5
5.0
2.5
O..lr--'--- ----II --- ~·- ..... -·---.. -"C'i------·--·-12 Noon 12 ilidnight 6 "hI 12 Noon
FIGURE 23 ]!YDROGRAPH

·--29-
. destroyed, rain gages filled by pranksters, the Parshall flume bypassed when the ditch banks caved in, or equip-ment malfunctions have occurred. Unfortunately, these difficulties occurred at different times and involved various lengths of time to correct. It has been impossible to collect a complete record for a year. Consequently, some missing data techniques had to be used. For example, hydrographs were generated by use of the SCS triangular unit hydrograph technique ·for the period of time that the recording gage was missing from the Parshall flume. The coefficients used were obtained by generating values from known hydrographs for the area which were obtained when the recording gage was in place. Hydrographs were plotted for each storm but are not included in this report. The typical hydrograph as shown in Figure 23 is an example. Missing rainfall data at a station were determined by the normal-ratio method for the period of record.
A sprinkler system was installed in the apartment complex just upstream of the 54 inch pipe. This resulted in sporadic flows into the Parshall flume which were easily recognized and accounted for.
The groundwater storage changes were established by use of water elevation readings taken in the wells located in the 126 acre area. Figure 11 illustrates the location of the wells with respect to the river. In order to obtain a volume of storage change, the average water level change of wells 1, 2, 3, 4 and 7 was assumed to occur over the 126 acr~ area minus the area of the lake. A plot of the changes in well water elevations is shown in Figure 24. (The complete record of water elevation changes is available from the primary investigators upon request.) Then taking into account the soil porosity of 30%, and an assumed 70% saturation, the change in groundwater storage was calculated.
Groundwater inflow· into the watershed was obtained by determining the hydraulic gradient for the water table
. by use of the well data and the average permeability for the soils. An average permeability of 152 gpd/ft2, which was obtained from the soil permeability tests, was used.

•
30
Well #l-g
20 j
30 ] Well #2
20
30
wel.l #3=1/ ~ ~L-.'~ .~~ r: 20-=1 -'~ 30
~ Nell #4] > " I I o 20 LI ~ ~ . 0 ~ I
30
~ Well #5:1
5 20-=t ""'"
~ 30] ~ Well #6 .
20
34
WeI] #7~ 24 -=1 ,.,~
.. :J
River 20
r.TTj.'-NI A I tvl LJ 1.1 I A fSfOlXnn JTFnnA,M,JTrn IS 10 I ~ In , .11 F IH t A 1M IJ I J IA Is , 0 IN ID IJ IF P1 IA , 72 73 74 7S
FlGURI: 2,1
" ,

I I
-31-
Rainfall for the watershed was obtained by reading the nonrecording rain gages between 8:00 a.m. and 12:00 noon the day after a rainstorm. At the end of each week, readings from the recording rain gage were added to the data already collected and the average weekly rainfall for the watershed was calculated by the Theissen method. The monthly average rainfall for the study period is shown in Table IV. The complete rainfall record is available from the primary investigators upon request.
A water balance composed of two week periods is shown in Table V. The reader is cautioned that evapotranspiration losses contained in the last column should not be regarded as the correct value for the indicated time period. This is because of the time lag between the occurrence of a significant rainfall and the measurabl.e increase in-groundwater storage. For example, a large volume of rainfall occurred during the time period from 6/_4/72 to 6/18/72. However I the proportional increase in groundwater storage did not occur until the following period of 6/18/72 to 7/2/72. This large rainfall caused the first term of the hydrologic balance equation to be quite large and r~sulted in an unrealistic evapotranspiration term of 7.7 inches for the two week period. The lar~e groundwater storage increase in the next period caused a completely impossible evapotranspiration term of -1.2 inches. However, the algebraic sum of these two terms (+7.7 + [-1.2]) is a realistic 6.5 inches for a four week period in June.
Although this tabulating quirk occurred several times, the total evapotranspiration losses for most any 52 week span during the period of record is approximately 50 inches. The increased magnitude of this value~over the regionally used value of 40 inches can be attributed to the marsh area which was approximately 20 acres in size during periods of high rainfall and to the phreatophytes surrounding the lake.

-33-
Continued.
~-'----- ----.- ..... .l-l .j.J
~ tl" ~ r-1 § \., C \.. G c..
.j.J ,.4 .j.J ..c: C> U) >-- '0 ~ U) . (/) ti' ..... ~
r ..c: (lJ ~ CJ l-l ~
i~ 0 -:w ~.
~J J.J ri 0 .j.J .c Co; ~ r- C ri ..... 1I C .~ .j.J CJ fa dP .Q l"J ri • .4 & C) 1..0 ~ > E-<~ 0 "'-, 'In ri
..,.. U If' 3:< 0.. r---~
---------- .~-..-
Apr. 2.16 2.25 2.26 2.22 1.91 2.06 2.14 2.10 6.60 4.62
May .33 .56 .34 .40 .34 .37 .41 3.41 7.34 5.14
June 2.18 2.22 2.07 1.83 2.06 2.12 6.49 5.43 3.80
July 8.63 7.38 7.07 6.82 6.94 7.38 8.43 8 .. 32 5.82
Oct. 5.01 4.46 4.82 4.91 5.14 5.09 4.86 2.54 1.41 '.99
, Nov. .29 .15 .21 .22 .23 .28 .22 1.79 2.98 2.09
Dec. 7.10 '7.21 7.98 7.82 7.75 7.18 7.44 2.19 2.35 1.65
1974
Jan. 1.53 1.60 1.91 1. 74 1.57 1.40 1.60 2.27 3.43 2.40
Feb. 1.11 1.0 1.09 1.11 1.15 1.13 1.09 2.84 2.14 1.49
Mar. 1.06 1..25 1.33 1.32 1.43 1.08 1.25 3.89 2.13 1.49
Apr. .29 .31 .32 .32 .33 .38 .33 2.10 2.3 1.61
May 2.70 3.09 2.93 3.06 2.64 2.59 2.84 2.41 5.43 3.80
June 16.24 16.71 15.35 15.41 15.58 16.77 16.19 6.49 8.27 5.79
july 8.61 7.02 7.35 7.13 7.00 7.63 7.37 8.43 8.93 6.25
Aug. 7.80 8.89 8.11 8.36 6.97 7.91 8.07 8.00 10.16 7.11
Sept. 9.25 ' 9.46 9.02 6.48 8.62 8.74 8.84 6.35 7.79 5.45
Oct. 0.0 .15 .07 0.0 .10 0.0 .07 2.54 6.97 4.87
Nov. 1.15 1.11 1.25 1.21 1.10 .98 1.11 1. 79 6.5 4.55
Dec. 2.10 2.10 2.10 2.08 2.00 2.00 2.06 2.10 1.25 .87 .'
~.,.q .................................. 1I1I1I1I1I1I1I1I

-34-
Continued. o.
--. - -~---------- _ .. - - ~- - ---.------.-.. --.----.. -.. -- -._------_._----,----------------------.... +J
~ (j) 2 '"", CJ '2 ',"" " .. "
~. ... H C-. ...., ..... +.J .r;: (!) u: ,..' "d H U) u: 0' .-i ..... ,.... -:::: (, ~ 0 \..J ro
i~ ,....
~ 'TI ..-< C +J ,.c; c; H -~,
~ ,;: ~ u c: +.J +J C,.! § c-~
N ~ _,-J &. ('.J \D r:s ~ 8:2 a If'. ~ U In' :::< p.. r--
·1975
Jan. 1.00 .67 .73 .78 .94 1.00 .84 2.21 2.58 L80
Feb. 1.50 1.61 1.44 1.52 1.51 1.61 1.55 2.86
··Mar. 1.31 1.50 .98 1.11 1.47 .95 1.26 3.89 7.48' '5~23
Apr. 1.05 1.29 .98 1.03 1.10 1.02 1.12 2.10 --
,
'75 +

,.., .1 .'"
TABLE V
WN7'.'.i'\ PAIJ>lZCZ FeR A,'O;EA
Ferica :'la1nfcll,N X L~lo~/,' InflCf...f fr~~ Ch2!'~'3:e in cr..!l~~e :L'1 lake Heil'" Qutflc';·: Ke'~ Grou.'1d E:'
J:)ates (~u . .ftl2 wk) Rmoff ,Flume Lc..wn- Groc:..'id. Lake EYaDCration {cu.f't/Z '11k) ~\;2.i;er fIe:! losses
(cu. ft/2 "v'lk) sprin.'<lir.g , ;'ie.ter Storage (cu·.ft/2 "':-:) (cu.ft/2 \~k) (ir.c;1es)
(cu.ft!2 \,1:<) ::'.tcrage (cu.ft/2 wk) (c:u.ft/2 wk)
.5--7-72 705,434 317,241 0 - 57],266 6,136 16,451 0 2,089 3.5
5--21-72 187,807 13,093 900 - 573,266 -23,101 12,1.98 0 2,328 1.7
6-4-72 3',082,712 624,163 0 77,622 16,074 21,877 25.740 668 7.7
6-18-72 164,506 93,085 0 5l13,355 32,787 19,269 210,600 183 -1.2
7-?.-72 675,191 62,101 0 - 458,976 -20,886 10,886 0 890 2.7
I 7-3.6-72
511,057. 52,742 0 1:4 .. 148 -16,565 12,505 ° 1,900 1.4 w
7-30-72 U1
1,024,647 476,516 0 597,438 47,045 17,893 140 3,740 1.9 I
8-13-72 3,452,204 469,028 0 1,534,725 92,489 29,816 560,520 6,637 3.8
8-27-72 240,823 33,4114 0 - 922,153 -95,394 16,883 232,380 5,360 2.3
9-10-72 187 ,087 14,083 ° ')0,443 -25,21.!9 16,228 0 3,362 0.3
9-211-72 1,180,278 190,616 1,944 347,735 39,097 10,102 0 4,93J 2.2
10-8-72 68,441 0 3,744 - 611,434 -28,897 11,8/12 97,955 3,897 1.3
10-22-72 822,203 313,807 0 46 1555 25,727 12,318 0 2,515 2.3
11-5-72 911,OB9 163,088 3,168 570,262 15,569 8,935 61,704 4,084 0.9
11-19-72 1,061,516 66,955 0 610,547 6,402 8,472 203,255 5,933 0.6
12-3-72 9,208 0 6,568 1.0 335,052 30 ;1164 0 99,132 - 4 fJ95
* N indicates flow north of Fowler Avenue
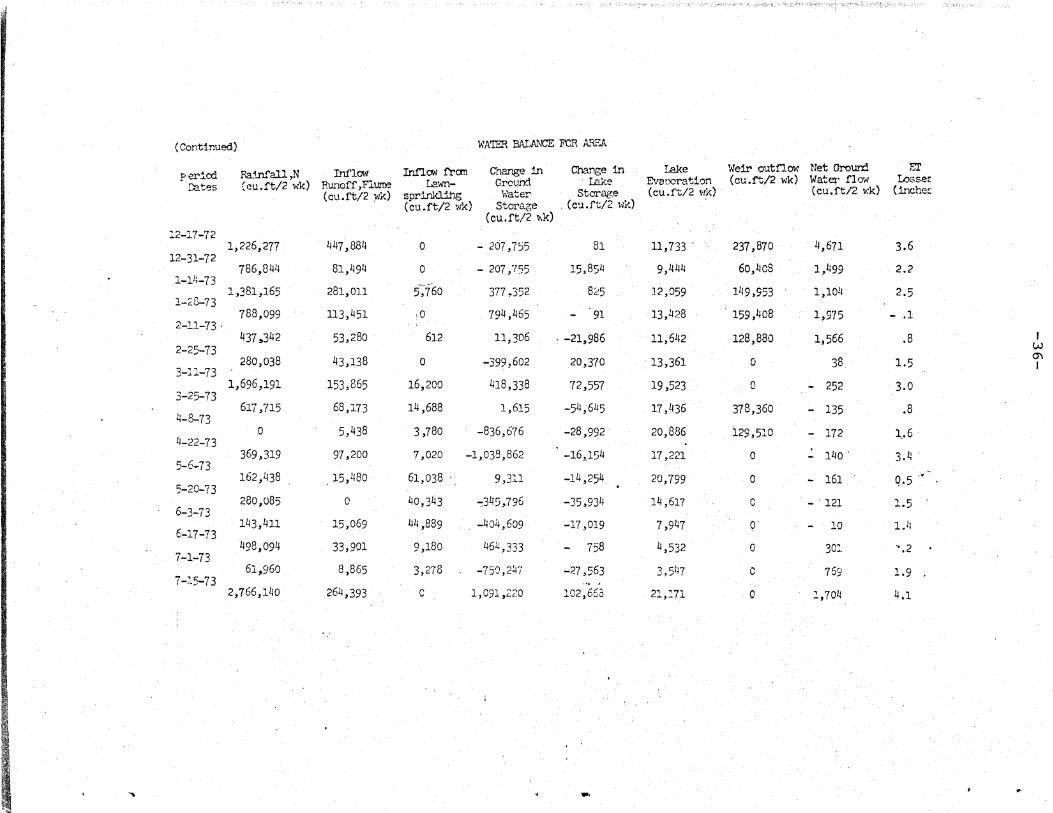
(Continued) WATER BA!.J\..\'CE FeR Al'F..A
P.ainf'all ,N Inflow Inncm fran Change in Ch:.'U1.ge in !.ake Weir outflow Net Grouro El' perlcd
(cu.ft/2 wk) Runoff ,Flume Lawn- Grovnd Lake Bfaooration (cu.ft/2 wk) Water flow Losse~ rates (cu.ft/2 ~rk) (cu.ft/2 v:k) (inchec (c1.1.ft/2 :-Ik) spr1nkl:ii)g 1~a0er Storage
(cu.ft/2 wk) Storage , (c'.l.ft/2 ~.;k) ( eu, ft/2 .... k)
:'2-17-72 1,226,277 447,884 0 - 207,7')5 81 11,733 ' 237,870 4,671 3.6
12-31-72 786,844 81,494 0 - 207,755 15,854 9,444 60,408 1,499 2.2
1-14-73 5-,'{60 1,361,165 281,01;1. 377 .352 825 12,059 11:9,953 1,104 2.5
1-2<1-73 788,099 113,451 ,0 791<,465 91 13,428 159,408 1,975 - .1
2-11-73 -437,,342 53,280 612 11,306 ' -21,986 11,6112 128,880 1,566 .8 I
2-25-73 w 280,038 43,138 0 -399,602 20,3'70 13,361 0 38 1.5
0')
3-11-73 I
1,696,191 153,865 16,200 418,338 72 ,557 19,523 0 - 252 3.0 3-25-73
q-8-73 617,715 68,173 14,688 1,615 -54,6 ll 5 17,436 378,360 - 135 .8
0 5,438 3,780 -836,676 -28,992 20,886 129,510 - 172 1,.6 1<-22-73
5-6-73 369,319 97,200 7,020 -1,038,862 -16,154 17,221 0 - 1110 ' 3,4 '
162,438 15,480 61,038 9,311 -14,254 '5-20-73
20,799 0 - 161 Q.5
280,085 0 40,343 -::34S,796 6-3-73
-35,934 14,617 0 - . 121 1.5
6-17-73 143,411 15,069 44,889 _40i~ ,609 -17,019 7,947 ° 10 1.1:
498,094 33,901 7-1-73
9,180 464,333 758 1<,532 0 301 -',2
61,960 8,865 7-:1.5-73
3,278 -750,247 -27,563 3,547 C 759 1.9
2,766,140 264,393 c 1,091,Z20 102,66-3 21,:.71 0 2,704 4.1
f!l
" ...

.. f· , ..
(Continued) \';,'i'ffi\ r·A!N\CE FaR ,W.A
F!I'icd Ra:ir'.fal1 ,N Inc"1ow Inc"1ow fran Char,.;'.': in Change in lal<e We1r outflow Net Groun! El'
futes (cu.ft/2 wk) Runoff ,FJ. ume Lawn- Grou."1C L3ke Evaporation (cu.ft!2 wk) Water flerd Losse ..
(cu.ft/2 wk) spr:1rJrJ.~ v;ater storage (cu.ft/2 wk) (cu.ft/2 wk) (.lr.che:::
(cu,ft/2 wk) Storage (cu.ft/2 wk) (cu,rt/2 wk)
'. 7-29-73 2,128,237 252,633 0 725,025 o 0')1 39,654 180,360 2,890 3.2
8-12-73 "", ...........
1,566;719 125,719 0 1,625,180 ~7,283 28,017 378,14~ 3,7~3 -0.8
8-26-73 NO DATA L'N1'IL
10--7-73 2,230,829 695,~00 ° -72~,628 1,960,387 8,156 0 5,782 3.7
10-21-73
11-4-73 67,930 0 1,068 90,~51 ,- 20,601 16,~25 1,852 1,345 - ,1
~ I
100,57i 6,120 5,760 ~29 ,644 - 9,528 20,186 0 0 - .7 w -..J I
11-18-73
° ° 6,203 218,078 -38,,112 18,876 ° ° - .4
12-2-73 1,496~953 519,180 0 790,320 393,575 9,415 1,962 50 1.9
12-16-73 2;964,743 469,592 ° 823,680 -125,610 30,284 176,284 1,392 3.7
12-30-73 32l,879 121,698 0 - 64,134 7,518 10,676 4,042 3,723 ' 1.1
1-13-711
1-27-74 209,260 24,9711 0 -418,';>21 - 26,852 26,282 0 3,589 1.5
377,062 20,160 0 _2114,021 - 48,334 21,044 0 2,923 1.5
2-10-7~ 255,438 48,597 0 342,568 67,668 20,098 325,473 4,/J0e. -1.0
2-24-74 79,776 a ° -229,943 - 67,668 5,606 0 8,234 .8
3-10-74
3-24-74 220,263 137,816 2,153 0 0 20,088 0 8,523 .3
297,171 2,156 0 -204,062 -47,643 12,777 46,411 9,087 1.1
4-7-74 142,271 19,193 5,723 -459,015 Q 6,594 8,465 1.4
4-21-74
° a 13,780 -358,917 -821,345 Drained 821,345 6,654 0.9 ,

~.' ,~,> I--I,:~,-" 'I' ;".~; \.._, ~"l' ,.;;..;~ .~.; "'~'l-~ .,',,":
(Continued) \OiATER ~ tANCE FOR MFA
R!ricd Ra:1nf'all ;N Innow Innow fran "Change in Cllnl1g'e in IAke Weir outf'low Net· Clrpund El'
rates (cu.ft/2 wk) Runoff,F1ume Lawn- Ground rake Evaporation (cu.rt/2 wk) Water flow' Lossef (cu .ft/2 wk) sprinkl1ng \vater storage (cu.ft/2 wk) (cu.ft/2 w~) (inchef
(cu. ft/2 wk) Storage (cu.ft/2 wk) (cu.rt/2 wk)
" 5-5-74
5-19-74 840,633 542,844 0 871,200 551,250 302 0 6,424 -0.1
6-2-74 497,444 48,785 2,310 -155.584 53,759 2,055 0 3,257 1.4
1,327,895 483,493 0 49,821 483,500 43,719 0 " 3,477 2.8 6-16-74 i.
3.969,561 2,166,344 '0 3,406,617 325,250 77,162 325,000. -1,876 4.5 6-30-74
1,061,796 411,500 0 -554,400 125,000 57:096~ 125,000 207 3.9 I 7-14-74 . w
1,081.218 214,707 0 -396,000 233,466 52,614 180,423 2,527 2.8 ex> 7-28-74 I
1,840,765 933,410 0 1,425,599 21,633 52,614 . 58,200 3,880 2.7 8-11-74
1,205,6lJ8 671,582 0 105,600 43,263 58,2~4 21,556 2,527 3.7 8-25-74
1,699,654 833,768 0 -242,325 86,534 61,371 197,800 2,219 5.5 9-8-74
9-22-74 884,675 369,991 0 - 66,000 -194,701 37,929 175,250 4,861 2.9
504,367 202.773 0 -734,800 - 42,389 40,392 0 8,908 3.3 10-6-74
0 0 . -1,106,239 -160,280- 15,46'2 0 3,590 2.8 10-20-74
0 0 5,834 - 662,400 -158,440 9,563 0 380 .1.8 11-3-74
0 0 4,780 - 753,984 -103,668 22,226 ° 403 1.9 11-17-74
525,485 176,832 0 - 635,184 - 85.?93 19,431 0 1,000 3.2 12-1-74
349,061 316,116 ° 72,072 -13,437 2,670 ° 3,515 1.7
'" - " ':' j
J "'"" .... _--- ------.~----

- .~
(Continued) Wfm:;~ BAL.'\N~ FOR IJ'}J\
PeI'icxi Ralnfall,N Inflow InnC1!l fran ChaI".ge in CtJat'Ji,"e in I..c'lke We:1r outnow Net Grourx1 Er
Dates (cu.ft/2 wl{) R-.mo!'f' .Flume Lawn- Ground Lake Evaporation (cu.ft/2 wk) Water f10N I.os~:as
(cu.ft/2 wk) spr:!.l".klinb Water Storage (cu.rt/2 wk) (cu.ft/2 wk) (inches)
(cu.rt/2 wk) storage (cu.ft/2 wk) (cu.ft/2 wk)
12-15-74 583,518 0 986 - 33i66O 0 10,383 0 6,501 1.4
12-29-74 6,124 1.8 396,221 ·291,411 0 - 89,100 - 20,569 17,798 0
1-12-75 0 0 0 0 - 11,518 17,798 0 5,242 0.0
1-26-75 104,172 7,500 2,385 158,400 - 1,646 13,251 0 4,795 -0.1
2-9-75 480,949 63,037 0 - 79,200 0 12,038 0 5,615 1.4 I
2-23-75 w
102,964 '17,120 22,108 + 79,200 - 25,917 13,570 0 7,950 .2 1.0
3-9-75
I
79,593 23,178 12,173 -237,615 - 17,278 17,279 0 9,087 .8
3-23-75 144,735 176,833 0 +298,542 -60,473 18.990 0 12,777 .2
4-6-75 214,478 200,09lj 0 +255,921 -103,668 20,343 0 23,905 .6
4-20-75
. "

-40-
8 • ~'ll\'I'E..1:{ QUALITY
During the course of this study, three different ClSpects of water quality were studied. These were: 1) the change in runoff pollutant concentrations during a storm; 2) the change in groundwater quality in .the shallow aquifer; and 3) the change in quality of surface runoff as a result of its passageover.the study area.
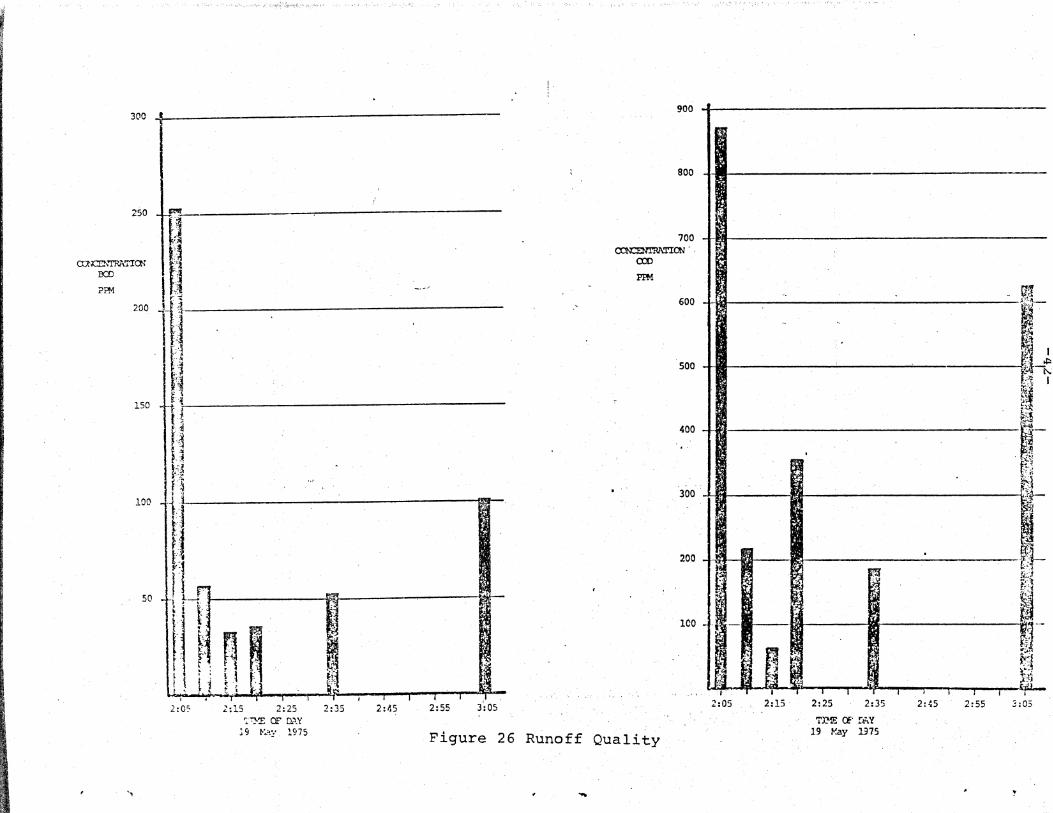
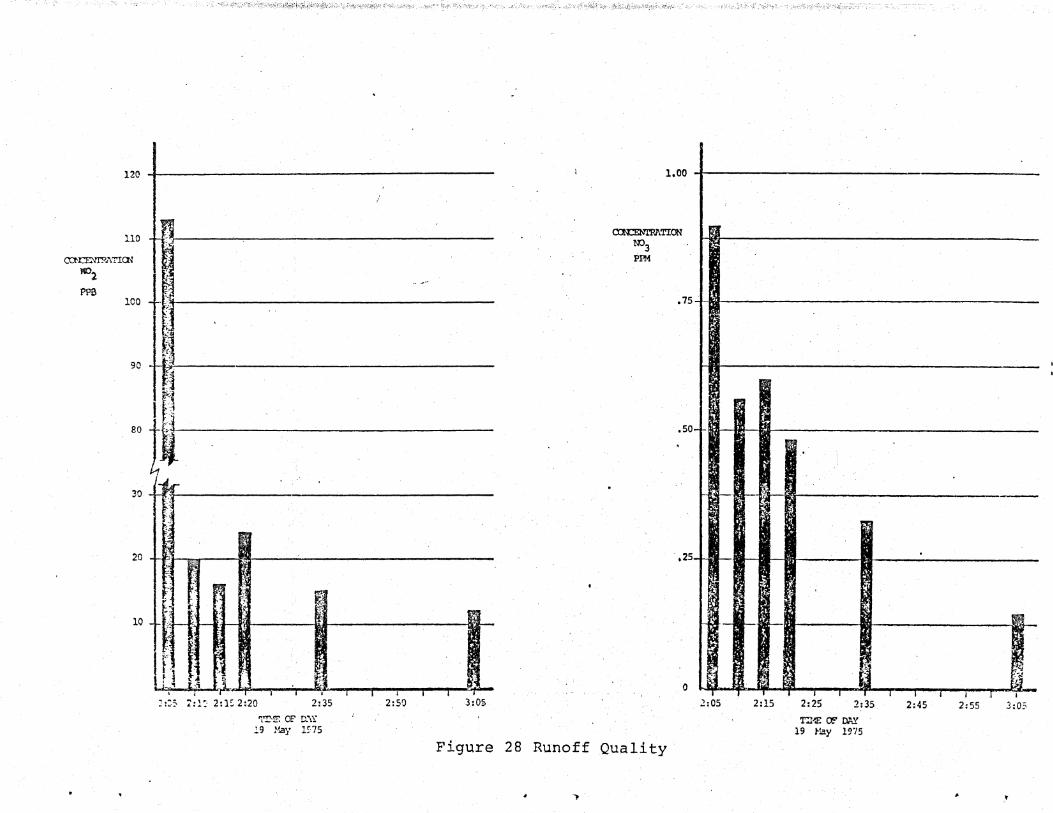
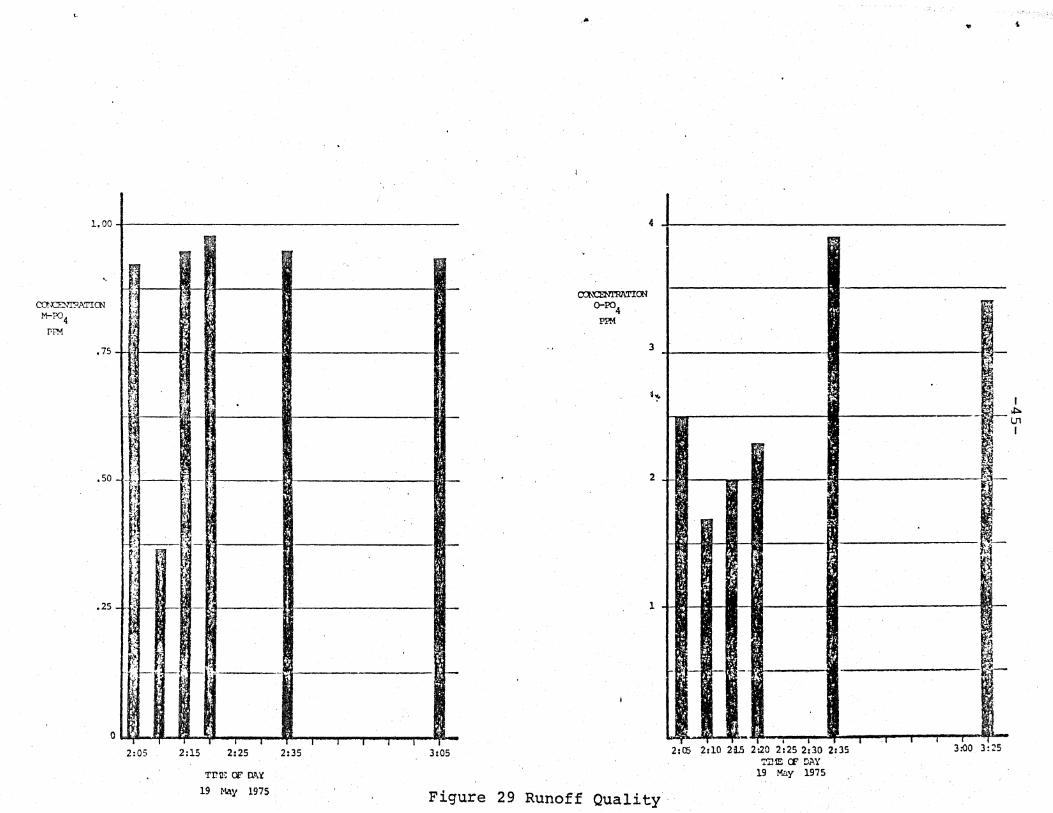
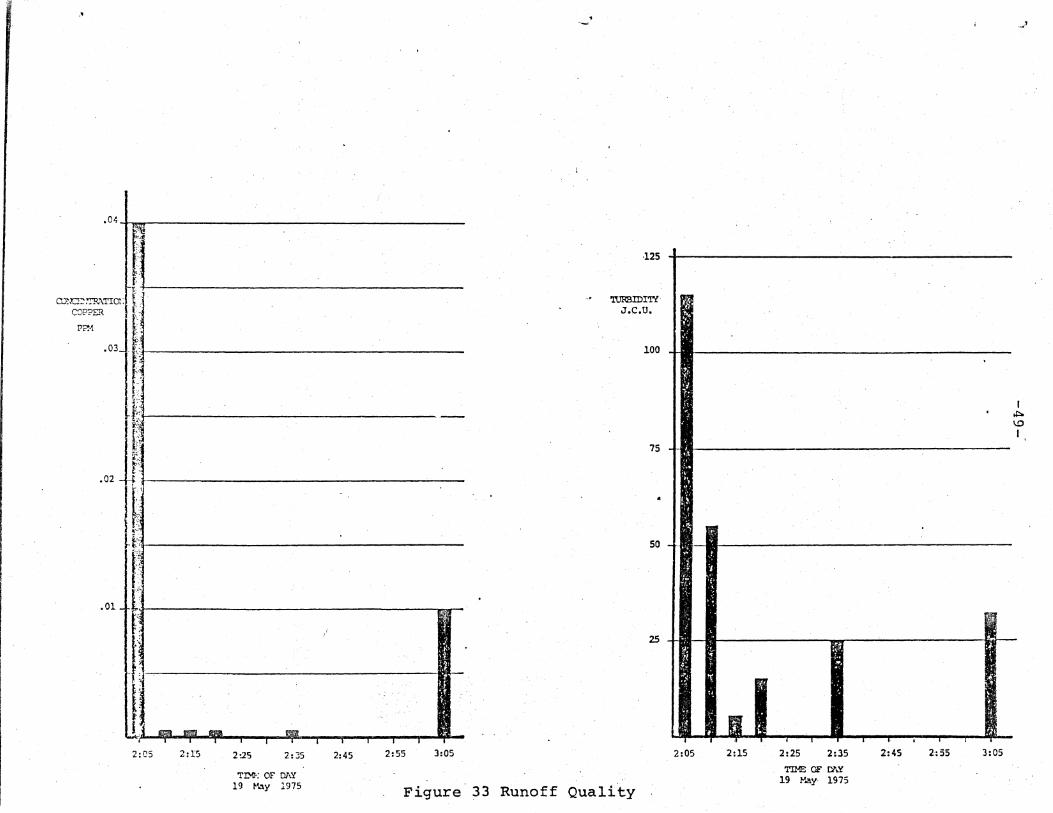
Quality samples were taken at regular intervals at the entrance t.O the concrete pipe that passes under Failler Avenue, during two different storms. The drainage pattern of the watershed is such that all runoff fran the area south of Fo.vler Avenue drains through this pipe. The resulting pollutographs from both storms were quite similar, consequently only one set of data is presented in this report. 'l'he hydrograph for the storm of May 19, 1975 is presented in Figure 25 and the pollutographs for the various subst.ances measured are presented in Figures 26 through 36.
The concentrations roeasured were converted to total PJUnds of pollutant per time inte:rval and are listed in Table VI. In addi tio!)., this table contains the total pounds of each PJllutant which was washed off the watershed during the storm and the pounds of substance generated per acre.
The concentrations of eighteen of the twenty-three measured parameters generally decreased with time as anticipated. Carbon dioxide (002) concentrations remained approximately constant while oil and grease concentrations and orthophosphate (Ortha-PO 4) concentrations increased with time. It is felt that the orthophosphate, and the grease and oil concentrations would have reached a peak value and leveled off if the storm had been of a longer duraLion than fifteen minutes.
Both of the storms, for which data were gathered, were ni ld and of short duration. More intense storms of longer duration could and probably would produce different pollutographs.
Chemical quality tests were run on groun&vater samples which were rerroved from the surface aquifer wells during July I. August and September of 1972 and again in May 1974. (See Table VII). The data shaw that peak values occurred in dissolved substances when the wells were first dug. Since then; there has been no significant change in groundwater quality. This confinued expectations.

01,
If)
r-CTI r-l
CTI .-I
, ~ ~ 0 ~
::r: ~
~ (!) 0 ~ 0 ~ ::r:
-41-
0 If) .-I
o M
trl roN r:.q
f:;~ :;<:p HI:!)
. ~H ~
30e
250
ro.~'TRru"'ICN B::O
<'FM
200
150
100
50
"
2:0:-
" 'i""l! ,J:,' ,tf?'<'<-I(" ,.', ~-', ,;.~.,\.,
2:15 2:25 2:35 ~'l}:E or ~"Y
19 K~y 1975
2:~5
! .
.'
2:55 3:05
~ ( - , "
.
900 ~I~----------__ ----------------------------
800
700 -I II cna:N'l'RATICN " .
aJD
PPM
600
500
400
(t;! L~~~--r, . ffJ ~
1""-l'>.: t~ I
m B!!
300 -!B L~-.--:. _____ L 51
200 -hD-D III '~!r k;J ~rl
I 11"-~III I .J
'-:..". . t.4 ~2~ ~ '.t:t) ..•. iii J ~
1CO ~f·m-
2:05 2:15 2:25 2:35 2:~5' 2:55 3:05
Figure 26 Runoff Quality T~$ CF ffiY
19 fo".ay 1315
... ~

us ~~~----------------------------------------
fl ro.-~n'?ATIOO
'TO: 100 ~ PFH
75
t~-'" ~:~j ~: I:~ ~l ·,'iL---------
'~ I ~ 50 ~i]
.\ , :,1 ~:~
I~ 25 _
IE;
~
t'~ , ,of,
'1'" 2:05
~ f.i f....
'J ~ f , I 'n .~ ,
,.
2:102:15 2:25
TII·IE Of' ~y 19 May 1975
~--l- ,
2:45 2:55 3::>5 2:35
" .
a::u::Em'AATICN KJ-N PPM
Figure 27 Runoff Quality
•
4
3 -
I ~ ~
~
2
• III
:1. -l-t.:\I-8- I-
2:C!3 2:15 2:25 2 ·~~ .~~
TIME CF ~ 19 May 1975
:0 2;45
I
I-
2:55 3:05
120 -lll----------------------
110
c:arEm'?1I:TICN
MOl
m 1CO
90
",',1",
!J ~ .~
p "11---30-ft~r-~-----
a .~
:\
~ 1, -1 Fl f"
:I t
u~ I il tl -~
1] ~ <! n
..,.. ~
1·. ,.~ -. '- ~"". 2: l~ 2 :20 : 1:':- .t. .. J. ... 2:~5
'IT'lF. OF D.W ':'9 gay 1~75
i ~
2:50 3:05
1.00
o:N:E:m'RI\TION N:l3 Pn.!
.75
.50
.25
o
Figure 28 Runoff Quality
~
-
I
!- !-
~1 -1
2:05 2:15
tl 2:25 2:35
T:r-:t: O'! DAY 19 Hay 19"/5
I
i-
-J
~-I I I I I
2:45 2<55 .3:05
~
,.
1.00
I ~ J
. ''';, ro~ATICN
M-?J4 PFM If~,
.75
II ~i } • -~
I I .50 -l~_ ~~---~; '~j 1 :1',;,
I
,~ n
Utl---f~~-~ A m-~" (i ",1
lP
.25 -H;4-D-m-u t! &I
t.! §' f.~Lt'i f-d-tl--r
o Vii" ,,--.q !\jJ. If'-2:05 2:15 2:25 2:35 3:05
. ...
CQICSNI'AATION 0-1'04 PI«
.. i
4
~~
l-------------t-----------~ 3 I M I 1-
1- , ~. .f::>,
--- U1 ; , •
2 -Hi'Iit r- ~ i~·-
I-
1 +lIB--B- !-
~y I-Rt-M-ft;!--H! ftI _________ fJ!_
I
21m 2:10 2i!.,5 2:20 2:252:30 2:35 TIllE CE C;W
19 !o'.ay 1975
.. 3:00 3:25
Tn\!: or Illl.'i
19 Nay 1975 Figure 29 Runoff Quality

450
425 S1.JSPl::~m
SQL!DS
P~l
-, i~,: ... ;f:~..,· ~:Y;·~t,,~ 'P~)}'M1 ,~:,c.:'i!.'<~}~;-;. "4'0-:- : ~'1:'- 3
"
I;; ·r~~~~ __ _
';00 4-<~-
~ 375 +}I=----.-
~
dr 100
75
~
50 'J-f.~
t'~' __ ~ __
"~ n • 2:0:-' ::15
T
2:25 2:35 T
2:45 2:55
f-
3:05
,.j
7.011---------------
~CN
M1MINtM
PPM" 6.0
J.1
2.0-
..
1.0 f- r-----~------------~r~
:iJ
lIllI, ,I 2;05 2:15. 2:25 2:35 2:45 255
I"~ T
3:05
I .t>. 0'1 I
'l'!!!:: Cf' D.'\Y 19 }:ay 19"'5 Figure 30 Runoff Qu~lity
me OF o..,y 19 ~:ar 1975
.., _ .. ~ • !

3.011-------------~---'-
Q)\CE~,'TR;TIa;
}1E..~, •. ::-\y
FPB r i;'
""f 'H" n ~ ------t 1 "
f' 'n','! f;, f !;
w'~t.~I-1 ~--f1 1
~~u~ - ~ ,~
'~'~'.;.' -~
f '-t
2:05 2:15 2:25 2:35
TIME OF n.;y 19 llay 1975
2:45 2:55 3;05
_...".1
4.0
<XN:lNI'RATION lim
PPH 3.0
2.0
1:0
Figure 31 Runoff Quality
-
2:05 2;15 2:25 2:35
TlY.E OF DAY 19 May 1975
• • 2:45 255 3:05
.)
I
*" '-l I

1.0
If] .. , ".;'I:
'. :;.' ;9
a:ll::E:m"?".'!'Ic:l LF.J0 .. f
~. P?-!
.::.
.4
1 I~ t~: f~
f t~-, ---:-----
~M1·~r ---.,llul \J~~"'"r----J·i ." r.] : r"! I~
.2 i J .. j . ': !F1r -----.--~ ,1 +tt-f'l
U ,1 ,I
;:;C~ 2:15 U~5 2:35 2~5 2:55 3:05
.• 5 -tl-------...;.---------
• cm:::ENriwrIc:N Zm:::
PIM
.4+gr---------------------~
~ J-V1
.2
J-
.1 +t~
'-'m ' ,-, I ..... ,,--IIII .. ~'~~-'I •. i i
2:0:' 2:15 2:25 .2;35 2:45 :::55 :::~3
I .r:oo I
~ OF DAY 10 ~~j' 1975 Figure 32 Runoff Quality
'!'!.~ Cf' 'm':' l~ ~~y 1~;5
~ -, .. ........ , ..
,.
.04 I ''!III!
Jl • .f---__
m~~'"Io'J;'. f.' CClPPER r rn< .03 tl-I ________ _
,Of
t~!'~t-------i, f 0021:\i-----------
U:~'\-1 --------r~ f)
.01~J~i_. -------~ r rr-
jll M-
Il I,J 11m .. mfI_
2:05 2:pj 2~S
t!IlilI
2:35 2:45 2:55
r.-3:05
• '-
-125
'roRBIDIT'i J.C.U.
100
75
50
25
TN; OF DAY 19 Hay 1975 Figure' 33 Runoff Quality
- I-
I 2:05 2:15 2:25 2:35
TIME: OF Dl.Y: 19 P.ay 1975
I
2:45 2:55 3:05
,,,'
I ~ \0 I

..
COWR
ALPHA COLOR tJ!','TIS
70
60 I .,.
50 rl ------------------------------ I-
40 ll----~----------~--------~- I--
30
20
10
m 1)rli::'r--~-I-~--II .~
I-
r.fIf' +'ll~---J
",J 11" H 'l _-U,L., ¥ lti :!:~!, '),'1 : I iF i g ~. ~ i ~ --2:25 2:33 2:45 2:55 3:05
':D'E CF !\W 19 :-:aj' 1975
t,':lr
18,000 -411-----------------------
16,000 -ilf----i
- 14,000
CXH:Er1'l'.lWl"IW COLIFOIM
PER 100 ex::
i2,000
I 10,000 ~----------------------------~--~
8,000 ... 1_----
6,000
4,000
2,000
1-
!Q
.-
-. - - . 2:05 2:10 2:1:' 2:202:25 2;30 2:35
m:: OF DA'( 19 1'~Y 197.5
o I
~
21~s 2;50 J-;-ho 3/:';
Figure 34 Runoff Quality .., .. -. '1it

.' y -"
8 I' ~ .tJ.~ ~CN t)
'1 I I '. r ~
'" · ll!-l-tt] iI t 15 l~' D ~. ,'j . . , ,..
~: J 5 +fl. II· II U" II I ~1 ,; ;~
... '
~j" I I' . oU:'~e n* 4 -IJBi __ II. _I . 1 . 'I'.: .~ ·r
~. :.
. ;. r'~' :; 'I ~n g II. 1&1" \' i
3 -HH-m--{l-tJ ~ II- Ii E: .~;' j
. , ~ '. , J 1 2 -I~-R-m m, ____ '4- 5 ~.I- ,i- : ~ r r ,lUll I I. • 'oj' I.
I...J. I • I J I • t .2:05 2:10 2:15 2:20 2:25 2:30 2:35 2:45 2:50
. TlME a DAY 19 May 1975
3:00 3:05
Figure 35 Water Quality
." l~
2:05 2:10 2:15 2;20 2:25 2:30.2:35
TlME a DAY 19 Hay 1975
f,
2:45 2:50 3:00 3:05

...,
c:na:NrRATICN on. & GREASE
PPM
2¢ I IIlW
15 I fU.- N-
10 -11--- ~- f-
5 JJ tj ,
:"'1 A,.;l
If, ~ ;;j ~l ~ "
ml~a '~" ~. {,I .
I~~ . ~t t '. ~ I r--T- I
2105 2:102115.2120 2;25 2:30 2;35 2,45 2:50'3:00 3:05.
TD£ CF tl1\Y 19. . Hay 1975
Figure 36 Water Quality . '""
;'.'''~ :~.. .'·· .. 1~·· .. :·>· " - ;,;.. "F'""··:
c·
....
1 lTI N I

----'--------.---~,-.-.---------~ $?i,!;jl¥'''-''-!''tfH -f'jt-: ~ .".... ,,,,_, ,l
-;../ ..!
TABLE VI
TOTAL POLLllTNHS ENTER I NG FRO~I SOUTH OF FOWLER AVENUE 19 May 1975
Rainfall - .28 inch Duration - 15 minutes ,
Va1ues(*)- All values in pounds
(5min) (5min) (5min) (5inin) -CfSminf - (30min) TOTAL #Per Acre
2:05 2:10 2:15 2:20 2:35 3:05 (239.3)
BOD 10.42 5.55 3.37 4.55 11.68 10.06 45 .6:~ .191
COD 35.90 21.11 6.53 42.88 19.99 62.63 189.04 .790
TOC 4.65 3.11 2.24 2.52 7.86 2.59 22.97 .096
TKN .17 .16 .214 .192 .34 .22 1.30 .0054
N02 .0047 .002 .0016 .0028 .0034 .0012 .0057 : 6.56x 10 -5
N03 .037 .052 .056 .065 .276 -5 I .059 .007 1. 15x 10 U1
w CO2 .12 .1.46 1. 53 2.4 2.47 1.19 9.17 .038
I
Meta-P04 .038 .003 . 097 .117 .213 .092 . .56 .002
Ortho-P04 .10 ,017 .204 .275 .88 .339 1. 82 .008
SS2 17.71 6.52 1. 53 2.52 10.33 3.19 41.80 .175
Al .28 .136 .054 .024 .184 .139 .817 .003
Hg .0001 .. 00017 .00017 .000012 .00011 .000083 .00065 2.72x 10 -6
Fe .16 .11 ~043 .057 .135 .064 .569 .0023
Pb .041 .043 .015 .0048 .027 .006 .137 .0006
Zn .019 .0146 .0082 .0036 .016 .005 .066 .0003
Cu .0016 .0002 .0002 .00024 .00045 .001 .00369 .• 00002
Oil-Grease .25 .. 39 1.63 1.32 2.92 1.99 8.S .036
TOTAL RUNOFF 10,971 ft 3

".- .. , '. ";'-' iFo';':'."':"· ·",-.")~'.",,:,.p,,f; '-'~f":;'i'~~ '''/ _',_'. . ';~'* ,'"
TABLE VI (Conti.nu~d)
TOTAL POLLUTANTS ENTERING PROM SOUTII OF FOHLER AVENUE 19 ~1ay 1975
Rainfall - .2~ inch Duration - 15 minutes Values(*)-All.values in pounds
(5min)
2:05
pH 7.6
Turb(JTV) 115
Color (APHA) 35
H2S None Found
Coli-Aero-genes Confi rmed per 100 cc
E. Coli. per 100 cc
-,
(Smin) (Smin)
2:10 2:15
6.S 7.0
S5 5.0
30 20
200 16300
6750
(Smin) (lSmin)
2:20 2:35
6.4 6.S
15 25
20 30
4300· S100
913 4]5
• ;.
-"'. '.~' [. ';.," ~ ;.ii\;~_'';.-~-''';''~',~,-'' "'0.",''-'.-::': ~'l"'I"O~'
(30mjn) TOTAL #Per Acre
3:05 (239.31)
7.1
30 I
60 U1 ~ I
30
.,.

~,,~;+~ii*'J~ir;f%:;1~'~ '[') ?!;:'" .. -
-II .....I ,..'
TABLE VIr
C:--Efwi!C;:L TESTS ON \!AT2~~ ~N hELLS
O.diE-t'!ElL O~PO-i· M-'?O~ NC3 N02 CO2 FI-I .. CCLO~
{PP ton (PPM) ( PPM) (F FH) (PPM)
1/12/72~t lC~'5CC 5 .. 000 21 .. 100 C.C50. 52 .. 000 5~200 0.0
7/24/72-1 1 .. 500 4 0000. 17.600 0.030 8€.OOC 50250 420oCO
C / 4/12-1 logeO OGO 5.200 C.C55 1.7.000 5.220 S~OGOO
8/16112-1 1.,200 9 0 500 18.500 C.048 C .0 4.90·0 500. CO
t /23112-1 0 .. 220 1.130 2.6 l tC c.o 56.000 6.000 . 485.00
C;/ 3/72-1 119000' 4.000 4.:.400 000 84.000 5.500 360.00
c; 111112-1 0.400 0.200 10'-00 e.o 766/000 5.100 380000 I
71 6112-2 4 .. 500 48800 2.200 0.066 44.000 4.800 0.0 U'1 U'1 I
1/22/72-2 3.300 8 .. 3CO 240200 CoC~l 48 .. 000 5.350 0.0
3/16112-2 3.200 5.600 24,,400 0.250 c.o 0.0 52 o. 00
S I "3 i7 2- 2 000 080 8.300 c.e 99.000 0.0 000
t;; J 18112-2 50500 0.0 0.0 0.0 120000 5.500 0.0
1.1 -; 17 2- 3 6~7SC 0 .. 0 24.200 C.058 6C.OOO, 50500 .- 0.0
l' /14/12-3 2 .. 800 8.200 19.800 0.020 52 .. 000 s.coo 5l0.CO
t / 10 112- 3 o~ 820 1.420 16.700 Cc.C12 44.000 5.850 340.CO
8/16/72-3 00500 2 .. 190 0.0 0.030 0.0 50100 422. 00
e /24/72- 3 C.220 0.650 2~640 CoC2Z 44.000 5.700 280.CO
C: / '3112~3 20 900 1(:;.100 2,;.~40 000 Bcoooe 6c.COO 285.00
c; 118 172- 3 C.300 0.5eo 0.0 c.o 64.000 6.000 260.CO
1/18112-4 l.500 1.000 19.800 0.033 17.200 5.050 0.0

"i:';:.'
(Continue:;d)
C~EMICAl TESTS ON WATER IN ~ELlS
(continued)
DATE- ;tELL O-P04 M-P04 N03 Nu2 CO2 PH COLOR
( PPM) ( PP~1) (FP~) (fFfoI) (-F PM J '
8J23/72-4 0.170 O~180 2.700 0 .. 0 " 0.,0 6.500 510 eCO
91 4/72-4 3.300 '0.0 CeBOO C.C 8C.000 6.100 ' 0.0
<; 11117 2-4 0<1>300 0.0 2.640 O~O 8 /i .000 6.000 600.CO
1/2.5/72-5 OG 750 4.000 11.6QO CoC33 6C .oeo ' 5.200 155.00
Sf 2/72-5 1 .. 300 2.000 17.600 0.012· ao.ooo 5.350 165.CC
8/17112-5 'S.OOO 24,,500 3.300 0.C16 4E.OOO 5.250 175.00
e 124/72-5 OQ190 0.110 1.760 0.018 64.000 Se600 105.CO I
q/18/72-5 50500 0.300 0.0 C.O 42.00~ 6.400 80.00 U1 0'\
1/11/72-6 . 4 .. 500 5.000 ' 25.500 0.026 44.000 40800 3S0.CO I
7/28/72-6 2.400 3.400 15.400 C.C24 32'0000 6.050 280.00
e 123112-6 C.380 0.0 3.520 0.026 56.000 5.350 490.CO
91 4/72-6 9 .. 000 OwO 0.900 C.O t~f 0000 50050 400.00
C;/1"1/72-6 go 500 0.0 5.120 0,,0 28.000 0.0
il 9/72-7 5~400 11.500 26,,400 CoCoS 52 .. 00.0" 5'0200 0.0 "
7/15112-1 2. sea 5.5CO 25.500 0.016 68,,000 5.0'00 210.CC 7/27/72-7 1.300 2.2CO 1~4800 C.C14 2C.OCC 5,,85:0 2ltO.CO 81 g/72-7 0 .. 650 10620 11.600 0.072 4C.OOO 5 .. 350 13:> ooC
8/17112-7 3 .. 000 0 .. 0 30500 C oC66 ,44eOOO 5.050 212" CO
E/24/72-7 040100 Cv390 ' 2.,,600 0 .. 033 80,,000 5'J 250 295 .. 00
9/ 4/72-7 11.,COD .!r; .000 0 .. 56D C .. c 84·000e 5.1..>,)0 2l_0.CO
"'" '"'\ ...

:':'1"~~~ "i ,:."~ :,1 " '
,l
(Co:ntinuec?) c.hE~rCAL 1'ESTS ON \;:Hcf; IN ~ELLS (continued)
DATE-WE Ll C- 9n t. M-?04 "-I'" -:: . ~ . '" \.J -'
( ppr-n (PPHl (PPM)
C;/17/72-7 O~LBO 0,,0 2,,810
SI 3/74-3 2.500 094CO 3a52C
51 311 ft-4 0 .. 300 0 .. 300 lt~840
51 9/74-5 o • .t~50 011'350 2.a 640
;;.~
~~O2 .. C~J2
(PH') ( P p~~ )
0 .. 0 6G .. OGC
C.C82 It-ilOOO'
O.OQ9 2£.000
C.C20 40800
, '-'
Q-02
(PPM)
0.0
40000
7.0Ca
10~OOO
H25 PH
(PPH)
C.O 5.500
0.020 6.650
c .. 020 1 .. COO
0.020 7.250
COLOR,
390. CC
250.00
240. CC
90.00
'.
.,;t
I U1 --..J I

-58-
'!be ditch, marsh, and lake system in the portion of the watershed north of Fowler Avenue acted Imlch like a water treai:Irent plant in providing settling operations, biological action, and filtration to the runoff. fran the area south of Fowler Avenue. Therefore I even though the extensive urbanization of the area north of Fowler did not occur, valuable data were gathered which pertain to the natural purification of urban stann runoff.
Major drainage changes were made in this area north of Fowler Avenue during the study period which caused changes in the quality of the effluent leaving the area. When the project started the lake and marsh functioned as a collection basin for. the area north of Fowler Avenue and there was no clear separation between the lake and the marsh. The land south of Fowler Avenue was connectedto the marsh when· the 'pipe was placed under Fowler Avenue and the drainage ditch was dug. Being a new ditch the walls and bottan were free from vegetation and it drained rapidly into the maish, so that· little or no water remained in the ditch after a rainstonn, except directly downstream of the 54 inch pipe .. mich . washed, out a large depression. The ditch received no maintenance with -the passage of time. It filled with debris and plant life (See Figures 13, 14 and 15). '!he three tines that the flume
washed out caused' sand that was under the flume or between the wing walls to be transported and deposited further downstream, creating pockets where water would stand for long periods of tiroe. Aquatic weeds grew in these standing waters. .
Iil the surrrrer of 1973 and spring of 1974 the lake was enlarged and the soil which was rerroved was used to partially fill the marsh making it broader and nore shallow. After these enlargements the lake was clearly separate fran the marsh, and water baCked up in the ditch where it stood 2 or 3 feet deep at all times. At the start of the project biological action on the water borne pollutants took place mainly in the marsh, whereas by the end of the project it took place t.hroughoutthe entire system. Since water remainE..>Ci in the system longer, nutrients were nore fully consillnei C!-nd suspended solids had more opportunity to precipitate.
There were at least two mechanisms that countered the water quality improvement, rapid development in the area around the s'tudy watershed and exposure of fresh soil during the enlargement of the lake. In the period from 1971 to 1975 two ap~rtment complexes and two blocks of retail stores were completed on or adjacent to the study watershed. In the same period the Florida Department of Transportation reported that the average number of vehicles per day on the highways around the projects doubled (for Fowler Avenue east of 56th Street it we.nt from 4075 vehicles per day in 1971 to 10430 vehicles per day in 1974).
, ..
(
(

-59-
The digging and disturbance of the lake and marsh exposed large areas of fresh soil to the leaching of nutrients and increased the silt and suspended solids leaving the lake.
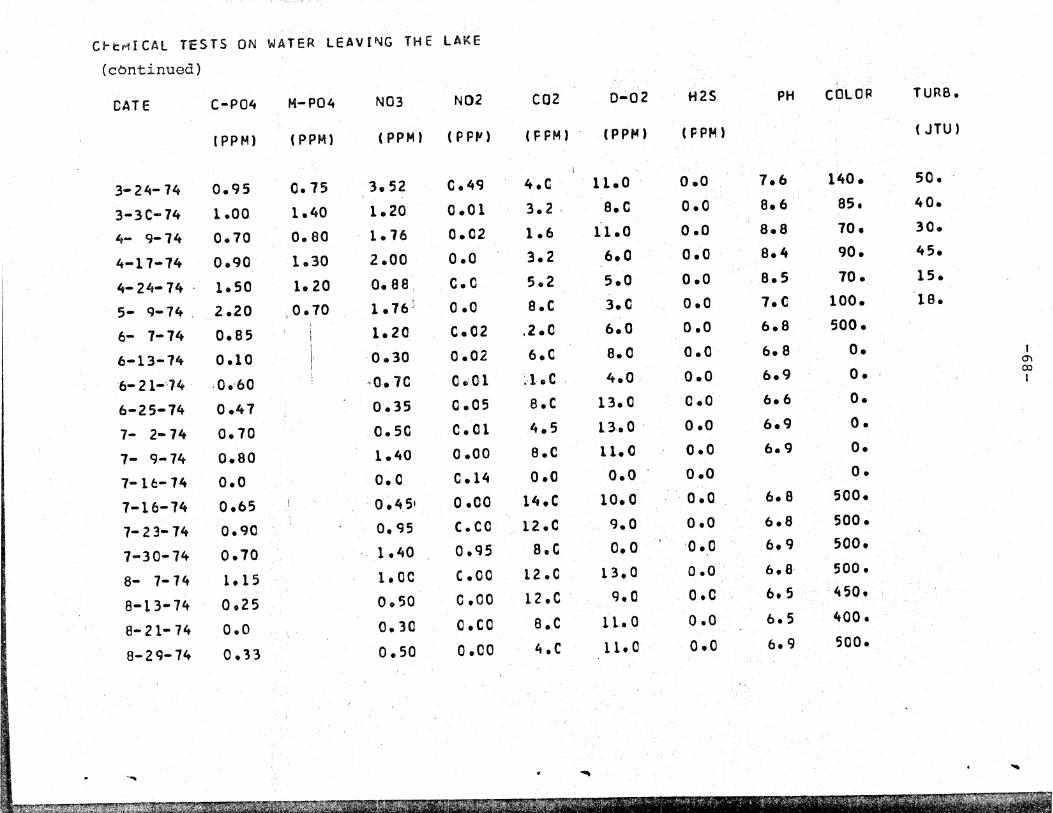
Over the entire test period, there was an expected improvement in the quality of water leaving the watershed when· compared with the water entering from south of Fowler Avenue. (See Table VIII) There was a decrease in orthophosphate, meta-phosphate, nitrate, dissolved oxygen and pH. These nutrients were consumed during passage over the vegetated area and the decrease in dissolved oxygen indicated that the metabolic regime when averaged over the· entire study period was predominantly respiratory. Of even more interest are the yearly water quality averages. (See Table IX) In this table, the changes in the behavior of the ditch, marsh and lake system are apparent. The 1974 figures are of particular interest, since this was the year when major changes were made in the lake and marsh. These changes explain the otherwise unexpected results that occurred in 1974 and 1975. A negative % change in tables VIII and IX indicates a removal or decrease in the water quality parameter as the water flowed through the system.
Or tho-phosphate was removed every year, but there was an increase in the concentration of this nutrient coming in from south of Fowler from 1971 to 1975. This increase can best be seen b7 comparing the data for 1972 and 1974, both of which cover full years •. While the percent change was negative in 1974, there was nearly twice as much ortho-phosphate leaving the lake as in the next highest year. (See Table IX)
Table X shows that there was a large increase in concentrations for most of the samples taken during early 1974, the period when the lake was being enlarged. In June of.1974, the readings returned to normal.
Meta-phosphate decreased while passing through the watershed in every year except 1974 when the lake was drastically disturbed. The concentration entering the system increased with time, so over the period of the study, metaphosphate discharging from the lake increased. The disturbance of the lake resulted in a sharp increase in metaphosphate concentration leaving the lake in early 1974. (See Table X) The increase is large 'enough that the per-cent change goes positive. Note, that in 1975, the behavior of the system returned to normal. (See Table IX)

6 Ii rt ::T 0 I
tU 0 ~ -'"0 '"0 S -
Ditch Site
Results .62
Number of Samples 99
Stream Site
Results .43
Nurnber of . Samples 119
% 'Change
Stream-Di tch x 100% -31% Ditch
"'II
\,:~,' - {~J'" "~I < ~
TABLE VIII
WATER QUALITY AVERAGES (Oct. 1971 -May 1975) .
. :s: z z () (l) 0 0 0 rt w to.> to.> PI '"
I tU
_. - -0 '"0 . '"0 to ~ ] '"0 ] a - - - -to
1i -.51 1.87. .03 5.·7
92 103 104 103
.43 1. 65 .09 9.3
91 109 123 125
-16% -12% +200% +63%
"""
t1 . 0 •
-to .~ -
8.7
100
7.3
123
-16%
.... ,
() to 1-3 :S:()"tl :s:nn o. :.:x: .~ tUOIi tUoo I-' Ii ZI-'(l) Z I-' !:I 0 tr I-'·m 1-'. Hl Ii 1-'. - Hl s:: _ t-ta 1-'.
0- ......... os ......... 0 Ii c:: ..... I-'~'U I-'~S ::s.
~ o rt o CD 1-'. 0 1-'. 0 0. rt <: m - El (l) S
c~ I-' I-' r
1-3 - -c:: -94 7.5 41 8,979 3,835
101 100 77 95 95
"
164 7.0 41 2,394 320
113 106 104 110 III
+75% -7% 0% -73% -92%
i , I
• ,..

" .. / .,.}
TABLE IX YEARLY WATER QUALITY AVERAGE
1971 1972 1973 1974 1975 October - December January - December February - ~Iay January - December January - April
Fowler Lake ~6Change FO\v1er Lake %Change Fowler Lake %Change Fowler Lake %Change Fowler Lake %Change
0-P04 ppm .23 .02 -91% .42 .29 -30% .19 .05 -74% .97 .78 -20% .73 .42 -42~o
m-P04 ppm .17 .06 -64 9" .59 .13 -78% .14 .64 1.11 +73% 1.14 .55 -52%
NO~ ppm 0.0 2.11 .)
2.29 +SQ6 2.37 2.44 +3% 2.03 .94 -54% .93 .71 -24%
N02 ppm 0.0 .03 .17 +466% .09 .08 -11% .01 .05 +400% 0.0 0.0
CO2 ppm 12.0 22.00 +83 4.88 12.5 +156% 6.10 9.08 +49% 6.1 5.3 -13% 4.5 5.0 +11%
0-02 ppm 10.0 3,6 -65% 8.0 4.5 -44% 8.3 7.7 -7% 9,6 10.9 +14% 9.4 10.9 +16%
Color . 131 75 -43% 78 102 +31% 67 94 +40% 119 227 +91% 80 200 +150%
pH 7.8 6.0 -23% 8.0 6,3 -21% . 7.4 7.0 . -5% 7.1 7.5 +6% 7.7 8.0 +4%
Tum.JTV 103.5 19.2 -81% 32.0 41 +28% SO 60.0 36.0 -40% 13.0 68 +423%
Pres.Co1LS 240 ~IPN ' 3,900 -25% 10, 160 2,330 -77% 3,460 1,066 -69% 5,240 4,210 -20% 17,240 81 -100?6
Conf .Coli. 0 0 0% 2,180 110 -95% 900 170 -81% 2,600 1,160 -55% 14,693 30 -100% MPN
-62-
Nitrate concentrations increased in 1972 and 1973 and decreased in 1974 and 1975, while passing through the study area. Again the change took place w;i.th the enlargement of the lake. It appears that disturbing the lake bottom caused the lake to behave as a nitrate sink. {See Tables IX and X}
The changes in nitrite and carbon. dioxide concentrations indicated that microbial decay of organic matter occurred in the marsh. The negative change in nitrite concentration during 1973 can be explained by the lack of data from June through December. For full years, 1972 and 1974, the. change in nitrite was strongly positive. (See Table IX)
. Dissolved oxygen and carbon-dioxide values showed the effect of the changing metabolic regime of the system. From 1971 to 1973, carbon-dioxide Was released and oxygen consumed, indicating that respiration was overpowering photosynthesis and reaeration. Oxygen became less negative with passing time showing that the green plants were catching up •. By 1974,'the signs reversed indicating that photosynthesis and. reaeration were dominant over respiration. BY.1975, both carbon-dioxide and oxygen were positive. (See Table IX)
Color increased while passing through the system due to the leaching of tannic acid and other colored organic materials. (See Table IX)
pH showed a decrease in 1971 to 1973 when respiration was the dominant metabolic regime, indicating the production of acid waste products. In 1974 and 1975 the pH increased, showing that those waste products were being consumed. Notice that oxygen changes -cnanged sign in . accord:"withPH 'sign changes. (See Table IX)
Turbidity showed no definite pattern but the water was more turbid at the end of the study than at the start. Since there were ample areas for solids to settle out, the tu~bidity is attributed to colloidal particles and floating organic materials. (See Table IX)
The coliform count show the expected results; as the detention time in the system was increased, due to increased size of the lake, the coliform bacteria died.
,
f
f

-63-
By 1975, nearly 100% removal occurred even though the coliform population that entered the system had increased to a high value. This high value at the ditch is attributed to the increase in pet population in the apa~tment area south of Fowler during the study. (See Table IX)
The complete data for all the water quality tests are presented in Tables X, XI, XII, and XIII.

F' f' ,', .' .~: ~ .-t!. ;-". "'<;:':.,~".; "<':-~'.(",,:.' -'i.,.: •.• }!,.;:,;..:(~t,~., ',.:j··-4f·~)·. ;~~"K;5
'1 .LE X
C~EMICAl TESTS eN ~ATER LEAVING T~E l~KE
DATE C-P04 H-P04 N03 Ne2 CQ2 0-02 H2S PH COlOP TURS.
(PPM) (PPM) (PPM) (PPp.1) (PPM) (PPM) (FPM) (JTU)
;'
11- 5-11 0.0 1.5 0.0 5.2 320. 15.
11-20-71 0.0 0.0 28.0 4.0 0.0 6.0 105. 22.
11-29-71 0.02 0.26 22.( 5.C 0.0 6.4 125. 32.
12- 8-11 0.0 0.0 26.0 2.0 0.0 6.0' 105. 19.
12-20-71 0.11 0.02 18.0 4.0 0.0 6.4, 115. 15.
12-2e-11 0.0 0.0 16.0 5.0' 0.0 ,6.4 105. 12.
1-12-72 0.08 0.02 12.0 6.0, 0.0 6.5 178. 40. I en
1-16-12 0.14 0.0'1 10.0 5.0 0.0 6.4· 190. 51. 0I:>-I
1-2C-12 0.05 0.03 16.0 ' 3.01 0.0 6.3 110. 24.
1-25-72 0.08 0.0 20.0 '2.0 o.{) 5.8 203. 34.
z- 3-72 24.0 4.01 0.0 6.5 89. 35.
2- 9-72 0.15 0.02 24.0 4.0 0.0 6.3 55. 8.
2 ... 11-72 O.lC 0.10 0.61 0.04 10.0 4.0 0.0 6.4 88. 10.
2-23-72 0.30 0.10 0.88 c.oo 12.0 2.0 0.0 6.5 90. 30.
3- 3-72 C.5C 0.0 2.80 0.03 zo.o 'z.o 0.0 6.5 75. 17.
3-10-72 0.05 0.50 3.90 C.03 20.0 2.0 0.0 6.5 75. 17.
3-11-12 0.70 0.09 3.40 0.0 18.0 5.2 0.0 5.8 75. ZO.
3-22,-72 0.60 0.06 4.00 0.0 16.0 6. a 0.0 6.2 80. 20.
3-2e-72 O.be 0.0 3.50 0.01 14.0 7.0 ' 0.0 ' 6.1 75. 30.
""" ~ "lit

J ~
C~EMICAL TESTS ON WATER LEAVING THE LAKE
(continued)
CATE C-P04 CO2 0-02 H2S PH 1
M-P04 N03 NO.2 COLO~ TURS.
(PP M) (PPM) ( PPM) .(FPfI' (PPM) ·C PPM) (PPM) (JTU)
4- 6-12 2.90 C.OO 16.0 6.0 ·0.1 6.5 60. 12. ..
4-12-12 0.5 0.2 3.90 0.00 16.0 4.0 0.0 6.1 60. 10.
4-18-72 0.99 0.00 18.0 3.0 0.0 5.9 70. 20.
4-24-12 1.80 0.01 ;10.0 2.0 . 0.0 6.6 90. 14.
5- 2-72 2.59 C.Ol 12.0 4.0 0.0 6.3 100. 10.
5-10-12 2.19 0.01 13.0 3.0 0.0 6.0 110. 10.
5-16-72 0.0 0.14 2.90 0.02 11.0 3.0 0.0 6.l 70. 20.
5.-23-12 0.10' 0.08 1.99 0.01 14.C 2.0 0.1 6.4 lOO. 10.' I 0'\
5-3C-72 0.18 0.03 1.9a 0.02. 10.01 2.0' 0.0 6.4 100. 12. U1 I
6-·6-72 0.02 0.20 1.96 0.04 12.0 5.0 0.0 6.5 100. 20.
.,
1.<39 6-.16-72 0.25 0.25 0.01 10.0 2.0 0.0 6.2 60. 25.
6-20-12 0.20 ·0.10 2.44 0.00 30.0' 4.0 0.0 85. 20.
6-25-72 0.30 0.09 3.00 0.01 10.QI 8.0 0.1 6.1, 90. 1!;i.
1- 4-72 0.45 0.0 3.70 0.01 6.0 4.0 0.0 6.7 ao. 125.
7-12 ... 12 0.40 0.10 3.a8 0.C2 B .0' 4.0 0.0 6.5 110. 60.
7-11-1i 0.60 0.0 3.50 0.0 8.0 5.0 0.1 6.6 70. 55.
7- 25-72 0.35 0.15, 4.2C 0.01 10.0 5.0 0.0 6.9 100. 40.
8- 1-72 0.32 0.60· 1.19 o.oc 14.0 0.0 0.0 6.2 10. 60.
8- e-12 0.21 0.11 0.48 ·0.00 18.0 1.0 0.0 6.1 15. 80.
8-16 ... 12 0.53 0.16 0.05 0.00 8.Q 5.0 0.0 5.6 140. 70.
-"!

C~EMICAL TESTS ON wATER LEAVING THE LAKE (continued)
DATE O-P04 M-P04 N03 N02 CO2 0-02 H2S PH . COL OR TURB.
(PPt-l, (PPM) (PPM) (F Pp.I. ) (PPM) (PPM' (PPM' ( JTU)
8-23-72 0.58 0.08 0.99 0.00 12.0 3.0 0.0 6.9 100. 100. B- 30-12 0.60 0.0 3.00 0.00 8.0 5.0 0.0 6.6 120. 60. 9- 5-12 0.40 0.15 2.49 0.00 14.0 3.0 0.0 6.0 120. 30. 9-12-72 0.22 0.20 1.00 C.OI 10.0 4.0 0.0 5.9 1,20. 30. 9-21-12 0.01 0.0' 1.50 0.0 16.0 4.0 0.0 6.0 ioo. 20. 9- 28-12 0.20 0.05 2.50 0.0 4.0 4.0 0.0 10. __ ' 60.
10- 5-12 0.10 0.10 0.0 1.00 4.0 2.5 0.0 55. 10-12-12 0.10 0.12 1.CO C.O 4.0 7.0 0.0 70. I
0'1 10-16-12 0.10 0.10 0.0 1.CO 5.0 4.0 0.0 55. 0'1
I
10- 23-72 0.16 0.01 8.0 5.0 0.0 260. 41. 10-30-12 0.18 0.08 1.0 4.0 0.0 40. 11- 1-12 0.16 0.04 2.00 1.00 1.0 5.0 0.0 80. 11-14-12 0.16' 0.06 1.00 1.00 12.0 1.0 0.0 80 •. ~
11-21-12 0.14 0.09 1.00 1.00 14.0 10.0 0.0 75. 11-28-72 0.19' 0.16 2.50 0.0 10.0 4.0 0.0 20. 12- 5-12 0.70 0.60 4.40 1.00 8.C 10.0 0.0 200. 80. 12-15-12 G.70' 0.50 5.00 0.05 11.0 8.0 0.0 70. lZ-2C-12 0.60 0.20 4.00 1.00 14.0 8.0 0.0 70. 12-29-72 0.04 0.03' 2.20' 0.0 6.0 8.0 ·0.0 40.
l-1e-13 C.14 C.l1 2.50 0.50 10.0 16.0' 0.0 100. 80.
.. ~ ....
~....,,-.,.~....,

~ .;
C~EMrCAL TESTS eN WATER LEAVING T~E L~KE
(continued)
DATE C-P04 M-P04 N03 N02 CO2 0-02 H2S PH COLOR TURB.
CFPM) (P PM) (PPM' (FP,",' ( PPM) (PPM) (FP~) ( JTU)
1-17-73 0.14 0.14 2.00 !j.D 10.e 18.0 0.0 80. 80. 1-23-13 0.12 0.18 2.00 0.0 16.0 14.0 0.0 80. 2-23-73 0.00 . 2.40 O.C 0.0 6.0 0.0 7.5' 82.
3-12-73 0.00 2.90 0.0 . 0.0 7.0 0.1 1.C 80. It- 1-73 0.04 1.60 C.05 15.C 3.0 0.0 7.0 155.
4- 7-73 0.20 2.90 0.49 12.0 4.0 0.0 6.5 150. 4-14-73 0.02 2.60 C.OC 0.0 3.0 0.0 1.01 80.
4-28-13 0.00 3.12 0.05 0.0 9.0 0.0 1.5 16. I 0'1
5- 6-13 0.00 2.40 C.O 6.0 6.0 0.0 1.0' 82. -.J I
5-15-73 0.01 2.40 0.0 5.0 3.0 0.0 1.2 80.
5-25-73 0.00· ,2.40 C.C 18.e 6.0 0.0 6.8 83.
5- 31-73 0.01 2.50 0.00 26.0 5.0 0.0 7.C 84.
J.-12-74 1.62 2.98 3.52 C.O 4.e 22.0 0.0 7.9 155. 53.
I-lB-74 1.30 2.10 1.10 0.0 5.6' 16.0 0.0 7.1 50.
1-23-74 1.50 2.20 0.44 C.CC 6.e 12.0 0.0 7.8 60. 14.
1-31-74 2.00 0.60 1.14 0.09 4.01 17.0 0.0 8.2 90. 17.
l- 6-74 1.50 1.10 . 1.32 0.0c; 3.6 0.0 8.6 45. 6.
2-16-74 1.65 0.56 0.20 0.00 4.81 30.0 0.0 8.4 50. 6.
2-28-14 0.90 1.20 1.10 C.e5 4.8 6.0 0.0 8.3 30. 5.
3- C;-74 1.45 1. 05_. 0.44 0.16 4.0 6.0 0.0 8.4 70. 8.
, '!i .', ,.,,~. • "
C~t~ICAL TESTS ON WATER LEAVI~G THE LAKE
(cbntinued)
CATE C-P04 H-P04 N03 N02 CO2 0-02 H2S PH caLOP TURS.
l PPM) (PPM) (PPM' (PPfI, (FFM) ( pp,,q (F PM) (JTU'
3- 24-14 0.95 0.15 3.52 O.4~ 4.0 ' 11.0 0.0 7.6 140. 50.
3-3C-74 1.00 1.40 1.20 0.01 3.2 ' 8.0 0.0' 8.6: 85. 40.
4- 9-14 0.70 0.80 1.16 0.02 1.6 11.0 0.0 8.8 70. 30.
4-11-74 0.90 1.30 2.QO 0.6 3.2 6.0 0.0 8.4 90. 45.
4-24-74 1.50 1.20 0.88, 0.0 5 .• 2 5.0 0.0 . 8.5 70 • 15.
5- 9-14 . 2.20 ,0.70 1.76 ;, 0.0 8.C 3.e 0.0 7.e 100. 18. . .
6- 7-74 0.85 1.20 0.02 .2.0 6.0 0.0 6.8 500.
6-13~14 0.10 0.30 0.02 6.0 8.0 0.0 6.8 o. , C'I
6-21-"14 ' ,0.'60 ,,:0.70 0.,0,1 ~'l.C ' 4.0· .0.0 6.9 O. co I
6-25-74 0.47 0.35 0.05 8.C 13.0 0.0 6.6 o.
7- 2-74 0.70 0.50 C.Ol 4.5 13.0 . 0.0 6.9 O.
7- 9-74 0.80 1.40 0.00 8.C 11. a 0.0 6.9 o.
1-16-14 0.0 0.0 C.14 0.0 0.0 o~o o.
7-16-74 0.65 ' 0~451 0.00 14.C 10~0 . ,
. 0.0 6.8 500 •
7- 23-14 0.90 0.95 c.cc 12.C 9.0 0.0 6.8 500.
7-30-74 0.70 1.40 0.95 8.C 0.0 "
'0.0 6.9 500.
8- 7-14 1.15 1.0C C.CO 12.0 13.0 0.0 " 6.8 500.
0.50 ,
12.C q.o o.e 6.5 450. 8-13-14 0.25 0.00 ,
8-21-14 0.0 0.30 o.CO 8~C 1.1. a 0.0 6.5 400.
8-29-14 0.33 0.50 0.00 4.e 11.0 0.0 6.9 500.
.... ..... 4 '""

. :""":~)6ti!!';ii';:~'~"':;" .,.,. • -,'
.-I
C~EMICAl TESTS ON kATER lEA~lNG THE LAKE
(continued)
CAT E O-P04 M-P04 NO] ~C2 CO2 0-02 H2S PH COLOR TURS.
( PPM) (PPM) (PPM) (FF'" i
(F PM' (PPM) (PPM) ( JTU)
9- 9-74 0.50 0.50- 0.00 6.0 9.0 0.0 6.9 415.
9-16-74 0.20 0.40 C.CC 2.0 9.0 0.0 6.5 400.
9-23-74 0.13 0.60 0.0 2.0 12.0 O~O . 6.8 420.
10-15-74 1.50' 0.07 0.60 O.C 2.0 15.0 0.0 8.1 310. 95.
10-22-74 0.17 '1.52 0.80 0.0 4.0 12.0 0.0 7.7 320. 10.
10-2a-74 0.20' .0.95' . 0.10 o.oc 2.e 14.0 0.0 7.9 300. 1 110.
11- 5-74 0.20 1.60 0.80 0.0 4.0 i4.0 0.0 8.0 300. 60.
11-11-74 0.15 1.30 0.30 o.c 4.e 13.0 0.0 1.0 280.' 10. I 0'1
11-19-74 0.30 0.55 0.40 0.0 5.0 13.0 0.0 7.8 360. o. 1,.0
I
11-25-74 0.35 0.70 0.45 c.e 6.e 12.0 0.0 1.5 340. o. 12- 4-74 0.25 0.65 0.60 0.0 4.0 15.0 0.0 7.7 340. o. 12-10-74 0.40 0.25 0.40 o.c 4.C 13.0 0.0 7.4 300. 80.
1-13-15 0.45 0.15 0.10 0.0 2.01 11.0 0.0 7.8 290. 15.
2-21-15 0.40 0.20 0.60 c.c 8.C 12.0 0.0 1.6 215. 80.
2-26-75 0.30 0.50 0.90 0.05 4 ~Ol 11.0 0.0 1.8 300. 70.
3- 5-15 0.551 0.45 1.10 c.o 8. C· 10.0 0.0 8.1 215. 80.
3-12-15 0.30 0.80 . 0.40 0.0 4.01 13.0 0.0 1.9 260. 75.
3-.19-15 0.20' 0.45 0.60 c.co 6.C 12.0 0.0 1.8 300. 95.
3-26-15 0.40 0.55 0.80 0.0 6.0 11.0 0.0 1.9 120. 70.
4- 2-15 0 •. 33 0.0 0.9C C~C 4.e 9.0 0.0 8.2 80. 50.

CHEMICAL TESTS ON WATER LEAVING THE LAKE
(continued)
DATE O-P04 M-P04 N03 N02 (PPM) (PPM) (PPM) (PPM)
4- 9-75 0.60 0.45 0.85 0.0
4-29-75 0.70 0.80 0.70 0.0
5- 6-75 0.56 0.84 0.80 0.005
5-13-75 0.40 0.50 0.60 0.0
5-21-75 0.30 0.85 0.45 0.0
5-30-75 0.40 0.55 O.~ 60 0.0
.. .....
(02 0-02 H2S PH (PPM} (PPM) (PPM)
~.O 11. 0.0 7.9
6.0 13. 0.08.2
4.0 12. 0.0 8.0
2.0 10. . 0.0 8.9·
4.0 10. 0.0 7.8'
4.0 8. 0.0 8e1
-""
COLOR
150.
170.
180.
140.
120 •.
150.
TURB. (JTU)
90.
65.
50.
45.
50.
65. I
~
I -...J o I

--- "'"
TABLE XI
BACTERIOLCGICAL TESTS ON WATFR LE4VING THE LAKE
I
DATE TEMPERATURE PRESUMPTIVE MPN CONFIRMED MPN
( C J (ORG./lOO Hl) (ORG./lOO ML)
10-23-71 3500.0 0.0
11-13-71 5400.0 0.0
11-20-71 22.0 0.0 0.0
11-24-71 2400 .. 0 0.0
11-29-71 19.5 0.0 0.0
12- 8-71 21.5 0.0 0.0
12- 9-71 0.0 9200.0 0.0 I --.J
12-20-71 21.0 9200.0 0.0 i-' I
12-28-11 20.0 5400.0 70.0
1-12-12 22.0 5400.0 20.0
1-16-12 18.0 2800.0 230.0
1-20-12 20.5 0.0 0.0
1-25-72 19.0 5400.0 80.0
2- 3-72 19.0 0.0 0.0
2- 9-72 15.4 0.0 0.0
2-23-12 100.0 0.0
3- 3-12 110.0 20.0
3-10-12 80.0 U.O
3-17-72 170.0 40.:>
3-22-12 190.0 110.0

BACTERIOLOGICAL TESTS ON WATEP LEAVING THE LAKE
(continued)
DATE TEMPERATURE PRESUMPTIVE MPN \
CONFIRMED MPN
( C ) (ORG./100 MU (ORG./I00 Ml)
3-28-72 110 .0 20.0
4- 6-12 1500~ 0 ' 490.0
4-12-72 110.0 40.0
4-18-12 260.0 20.0
4-24-12 .0.0 0.0
5- 2-12 4600.0 80.0
5-.10-12 0.0 0.0 I .....r N
5-16-12 3300.0 140.0 I
5-23-72 3300.0 170.0
5-30-12 ·390.0 170.0
6- 6-72 1100.0 140.0
6-16-72 4900.0 210.0
6-20-72 35000.0 0.0
6-25-72 7900.0 11 ,)0. I)
7- 4-72 9200.0 17J.O
7-12-72 '700.0 170.0
7-17-72' 790.0 140.0
8- 1-72 700.0 70.0
8- 8-72 790.0 4Yi).O
8-16-72 220.0 4).0
... --- • ....

-~
BACTERIOLOGICAL TESTS ON ~ATER LEAVING THE LAKE (continued)
DATE TEMPERATURE PRE SUMPT I VE :MPN CONFIRMED MPN
( C ) (ORG./lOO MU (ORG./lOO MU
8-23-72 220.0 80.0
9- 5-72 190.0 490.0
9-12-72 490.0 110.0
9-21-12 16000.0 110.0
9-28-72 920.0 110.0
10- 5-72 350.0 30.0
10-12-72 540.0 80.0
10-16-72 540.0 10.0
10-23-12 110.0 0.0
10-30-72 130.0 30.0
11- 1-72 170.0 30.0
11-1<4-72 350.0 60.0
11-21-72 ·280.0 30.0
11-28-72 240.0 20.0
12- 5-72 240.0 20.0
12-15-72 920.0 10.0
12-20-12 540.0 10.0
12-29-72 920.0 50.0
1-10-73 2400.0 140.0
1-17-73 1600.0 bO.O
.. ""
I ...,]
w I

"i
BACTERIOLOGICAL TESTS ON WATER LEAVING THE LAKE (continued)
DATE TEMPERATURE PRESUMPTIVE HPN CONFIRMED HPN
( C (ORG./lOO ML) (ORG./IOO Hl'
1-23-13 0.0 540.0 30.0
2-16-13 11.0 60.0 40.0
2-23-13 20.0 490.0 110.0
3- 2-13 25.0 20.0 20.0
3-12-13 20.0 170.0 130.0
4- 1-13 21.0 3500.0 490.0
4- 1-13 22.0 190.0 190.0 I -.....J oJ:>,
4-14-13 25.0 490.0 110.0 J
4-28-73 24.0 1100.0 140.0
5- 6-13 25.0 80.0 20.0
5-15-13 26.0 190.0 140.0
5-25-13 ·24.0 560.0 120.0
5-31-73 . 26.0 2800.0 220.0
1-14-74 24000.0 24000.0
1-20-14 920.0 20.0
1-25-1 l t 210.0 20.0
2- 2-74 23.5 1100.0 148.0
2- 8-14 23.0 9200.0 14)0.J
2-18-74 21.0 260.0 2J.O
3- 2-74 16.5 140.0 it ~. J
... • ~ • "" ....

BACTFRIOLOGICAL TESTS ON WATER LEAVING THE LAKE (continued)
DATE TE MPERATURE PRESUMPTIVE MPN CONFIRMED MPN
( C (ORG./100 Ml) (ORG./100 ML)
3-11-74 22.5 140.0 10.0
3-26-74 . 22.0 1400.0 110.0
3-30-74 20.0 9200.0 0.0'
4- 9-74 23.0 700.0 0.0
4-19-74 25.0 24000.0 330.0
4-26-74 9200.0 70.0
5-10-74 16000.0 330.0
10-15-74 29.5 O~O 0.0
10-22-74 28.s' 20.0 0.0
10-28-74 23.0 50.0 0.0
11- 5-14 50.0 50.0
11-11-14 22.0 0.0 0.0
11-19-74 15.0 80.0 50.0
11-25-14 14.0 100.0 70.0
12- 4-14 15.0 40.0 0.0
12-10-74 I
18.0 50.0 50.0
, -,-
I -...J U1 I

"
BACTERIOLCGICAl TESTS ON WATER LEAVING TH~ LAKE
(continued)
DATE TEMPERATURE PRE SUMPT I VE HPN CONFIRMED MPN
, CO.",-, "-",'
( C ) (ORG./100 MU (ORG./IOO MLJ
1-13-75 16.0 70.0 50.0
2-14-75 0.0 20.0
2-21-75 500.0 50.0
2-26-75 0.0 40.0
3- 5-75 80.0 :'0.0
3-12-75 60.0 40.0
3-19-75 100.0 80.0
3-26-15 120.0 90.0
4- 2-75 40.0 0.0
4- 9-75 90.0 20.0
4-29-75 0.0 0.0
5- 6-75 40.0 0.0
5-13-75 ·0.0 0.0
5-21-75 60.0 40.0
5-30-15 60.0 40.J
-.
,,:.' : 1 '.1 i.~"
......
, --.J 0'1 ,
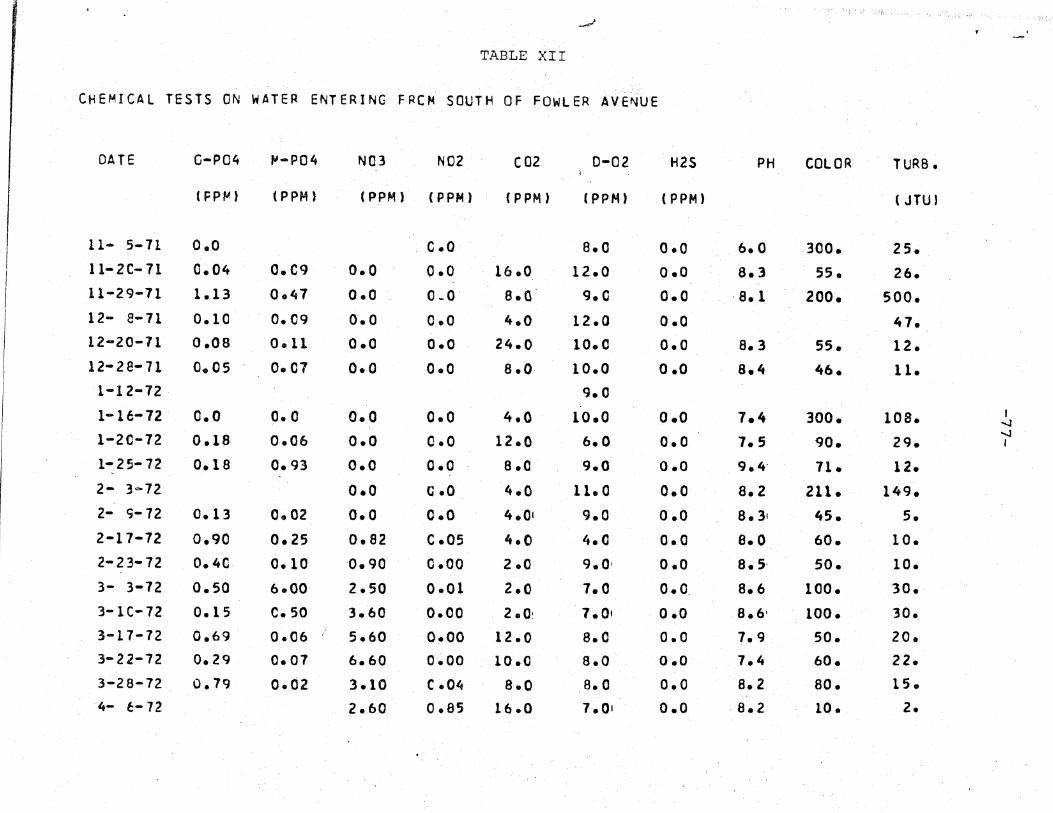
~j:
....".'
TABLE XII
CHEMICAL TESTS ON ~ATER ENTERING FRCM SOUTH OF FOWLER AVE~UE
DATE G-P04 tJ-P04 N03 N02 CO2 0-02 H2S PH COLOR TURS.
(FPfJ.) (PPM) (PPM) (PPM) (P PM) (PPM) (PPM) ( JTU)
11- 5-11 0.0 C.O 8.0 0.0 6.0 300. 25. 11-2C-71 0.04 0.C9 0.0 0.0 16.0 12.0 0.0 8.3 55. 26. 11-29-71 1.13 0047 0.0 0.0 8.0 9.e 0.0 ,8.1 200. SOD. ll- 8-71 0.10 0.09 0.0 0.0 4.0 12.0 0.0 47. 12-20-71 0.08 0.11 0.0 0.0 24.0 10.0 0.0 8.3 55. 12. 12-28-11 0.05 0.07 0.0 0.0 8.0 10.0 0.0 8.4 46. 11.
1-12-72 9.0
1-16-12 0.0 0.0 0.0 0.0 4.0 10.0 0.0 1.4 300. 108. I --.l -.J 1-20-72 0.18 0.06 0.0 C.O 12.0 6.0 0.0 1.5 qO. 29. I
1-25-72 0.18 0.93 0.0 0.0 8.0 9.0 0.0 9.4' 71. 12. 2- 3~12 0.0 C.O 4.0 11.0 0.0 8.2 211. 149. 2- 9-12 0.13 0.02 0.0 0.0 4.01 9.0 0.0 8.31 45. 5.
2-17-72 0.90 0.25 0.82 C.05 4.0 4.0 0.0 e.o 60. 10.
2-23-72 O.4C 0.10 0.90 C.OO 2.0 9.0' 0.0 8.5, 50. 10.
3- 3-72 0.50 6.00 2.50 0.01 2.0 1.0 0.0, 8.6 100. 30.
3-lC-72 0.15 C.50 3.60 0.00 2.0, 7.01 0.0 8.6' 100. 30.
3-11-12 0.69 0.06 , 5.60 0.00 12.0 8.0 0.0 1.9 50. 20. 3- 2 2-72 0.29 0.07 6.60 0.00 10.0 8.0 0.0 1.4 60. 22.
3-28-72 0.19 0.02 3.10 C .04 8.0 8.0 0.0 8.2 80. 15.
4- t;-72 2.60 0.85 16.0 7.01 0.0 ,8.2 10. Z.

,'Cv_ ", . ,h'~;';V >. -.:_., .]1' • ,T •• ~ .-.. ; * .. >.; J.: >
CHEMICAL TESTS ON W~TER ENTERING FROM SOUTH OF FO~lER AVEN~E (continued)
CATE C-P04 M-P04 N03 NOZ CO2 0-02 H2S PH COLOR TURB.
(PPM' (PPM) (PPM' (FPP') (FPM) (PPM) (PPM) (JTU)
4-12-72 0.30 0.20 1.90 O.OC 6.0' 5.00 0.0 8.3 20. 5. 4-18-12 0.89 0.00 4.0 8.00 0.1 8.0 10. 5. 4-24-72 1.91 0.01 2.0 8.00 . 0.0 8.0 60 • 15. 5- 2-12 2.30 0.01 '1.0 9.00 0'.0 8.1 . 80. 15. 5-10-72 2.09 C .-02 0.0 8.00 0.0 ~ .. 8.5 75. 18. 5-16-72 0.28 0.18 2.68 0.01 0.0 9.00 0.0 8.5' 20. 10. 5-23-72 0.50 0.07 1.99 e.oc· 0.0 8.0 0.1 8.9 80. 15. 5-3C-72 ·.0..5.0 0, .•. 02 2 .• 0,0 .0 •. 00 2.0 7..0 0.1 8.2 80. 12. I
" 6- 6-72 0.18 5.0 7.4· 50. 10. CX)
0.03 2.66 0.00 1.0 0.0 I
6-16-12 0.32 .. 0.23 4.09 0.00 2.0 7.0 0.1 8.1 15. 36. 6-2C-72 0.90 0.05 1. qa 0.02 20.0 6.0 0.1 110. 50. 6-25-72 0.24 0.01 3.17 0.03 2.0 10.0 0.1 . 7 •. 8' 55. 40. 7 ... 4- 72 0.35 0.25 3.90 ·0.0 0.0 6.0 0.0 7.7, 60. 40. 7-12-72 0.50 0.25 4.32 0.02 2.-0 a.o 0.1 8.0 60. 35. 7- 17- r2 0.57· 0.23 4.50 0.02 0.0 7.0 0.0 7.6 75. 50. 7-25-72 1.10 7.60 3.99 0.01 0.0 10.0 0.1 1.7 60. 20.
8- 1-72 0.40 0.20 1.<;9 C.OC 12.0 0.0 th3 45. 75. 8- 8-72 0.28 0.16 1.62' 0.00 12.0 16.0 0.0 7. 1 65. 100.
8- 16- 72 0,95 0.65 0.09 O.CO 6.0 12.0 0.·2 8.2 140, 80. 8-23 .. 72 1.00 0.13 0.0 0.0 4.0 8.0 0.0 1.2 100. 95 •
....... ~ .......,
'''''''l

, --
CHEMICAL TESTS ON WATER ENTERING FROM S(UTH OF FO~lER AVENUE
(continued)
CATE O-P04 M-P04 N03 N02 CO2 0-02
( PPM) (PPM) (PPM) (F Ptl ) (FPM) (PPM)
8- 3C-12 0.25 0.60 4.00 0.00 2.0 7.0
9- 5-72 0.20 0.50 " 2.98 , C.OC 6.0 6.0
9-12-12 0.24 0.26 1.09 0.01 8.0 10.0'
9-21-72 1.10 0.10 2~49 C.Ol 4.0 7.0
9-28-12 0.0 0.15 0.0 0.0 4.0 7.01
10-12-12 0.0 0.10 0.0 C.Q 2.0 5.CI
11- 1-12 0.08 0.05 0.50 0.0 5.0, 7.01
2-23-13 0.04' 2.10 C~o 1.t 9.0'
'. 3-12-73 0.04 2.80 0.65 9.0 9.0'
4- 1-13 1.40' ' I 1.50 0.13 I.e 5.0
. 4- 1-13 0.35 3.10 0.03 1.0 1.0
4-14-73 0.00 2.50 , C.OO 1.t 9.0
4-:- 2 e-73 0.00 2.50 0.00 5.0 10.0
5- 6-73 0.00 1.80 0.0 6.0 7.0
5-15-73 0.0 2.50 0.00 1.0' 7.0
5-25-13 0.04 2.80 C.oa 9.t 10.0
5-31-13 0.00 2.11 0.00 q .0' 10.0
1-12-74 0.60 0.40 6.16 C.CC 4.4
1-1 e-14 0.20 0.36 4.84 0.00 4.8, 10.0
1-23-74 0.30 0.40 1.52 C.C 5.2 9.0
i
H2S PH CClOft TURS. i
(FPM' ( JTU)
0.0 7.4 110. 40.
0.0 7.9 100. 30.
0.0 7.7 120. 20.
0.0 7.5 80. 10.
0.0 30.
0.0 49.
0.0 50.
0.0 1.5 25. I -...J \0
0.1 1.5 30. I
0.0 8.5 255.
0.0 7.5 80.
0.0 1.5 26.
0.0 7.5 100.
0.0 6.5 10.
0.0 1.5 30.
0.0 1.1' 26.
0.0 1.e 25.
0.0 7.1 295. 83.
0.0 7.0 260. 13.
0.0 7.0 260. 70.

{;~
CHEMICAL TESTS eN k~TER ENTERING FRCM SCuT~ OF FOWLER AVENUE (continued)
DATE a-P04 M-P04 N03 N02 CO2 0-02 H2S PH COLOR TURS.
(PPM) (PPM) (PPM' IFPPI' (PP,.,' (PPM) (PPM' ( JTU)
1-31-14 0.25 0.64 4.84 0.0 5.2 0.0 7.1 277. 78. 2- 6-74 0.30 0.02 4.82 O.CC 4.4, 0.0 7.2 285. 77. 2-16-74 0.23 0.14- 3.52 c.oo 4.C . . 0.0 6.9 245. 65 •
2-2S-14 0.20 0.39 4.CO C.Ol 3.6 13.0 0.0 7.4 270. '10.
3- 9-14 0.40 0.10 4.40 0.0 3.2 12.0 0.0 7.4 215. ~55.
3- 24-74 0.25 0.75 5.5C c.o 3.6 12.0 0.0 6.8 295. 93.
3-31-74 0.30 0.05 4.80 0.0 3.2 9.0 0.0 7.4 260. 135.
4- C;-14 0.30 o. 15 5.80 0.0 4.0 , 12.0 0.0 7.5 290. 125. I
00
6-13-74 0.80 0.40 0.04 l2.C 8.'C 0.0 6.6 60. 0 I
6-1<;-74 0.85 2.20 C.CC 8.C 11.0 0.0 7.0, 50.
6-26-14 1.20 2.50 0.00 2.0 11. a 0.0 7.1 80.
1- Z-14 0.45 0.60 0.02 4.0' 9.0 0.0 ' 6.4 80.
1-9-14 0.60 1.10 0.04 5.2 7.0 0.0 6.9 25.
7- H:-74 0.75 0.80 c.oo LZ .c 11.0 0.0 6.8 18. 7-23-74 1.20 0.10 0.02 8.C 11. a 0.0 6.8 14.
7- 30-74 0.70 1.4e C.Cl L2.C 9.0- 0.0 6.6 18.
B- 6-74 1.20 1.40 0.18 5.2 14.0 0.0 6.9 10.
8-13-74 0.55 0.65 c.oo l2.0 9.0, 0.0 6.5 75.
8-21-74 0.30 0.40 0.00 6.C 6.0 o.c 6.9 50. 8-2C1-74 0.55 0.45 C.Cl 8.C B.O 0.0 6.5 80.
'-,
'''""' ........

,-' ~
CHEMICAL TESTS ON WATER ENTERING FROM SOUTH OF fOkLER AVENUE (continued)
CATE C-P04 M-P04 N03 N02 CO2 0-02 H2S PH COLOR TURS. I
(PPM) , (PPM) (PPM) (PPM) (PPM) (PPM' (FPM) (JTU)
9- 9-14 3.2C 1.2,0 C.OO 4.C 5.0 0.0 6.9 SO. 9-16-14 0.35 0.35 '0.00, 6.0 6.0 0.0 6.5 50. 9-23-74 0.28 0.30 C .CO: 8.0 6.0 0.0 6.9- ,110.
10-15-14 3.10' 0.10- 0.15 0.0 6.0 11.0 0.0 6.9 zb. 5. 10-22-74 2.90 0.40 0.60 C.O 6.0 10.0 0.0 8.0 60. 10. 10-28-14 1.501 2.60 0.90 0.0 6.0 12.0 0.0 7.8 20. 5. 11- 5-14 0.28 2.20 1.20 O .. OJ 4.( 10.0 0.0 1.6 60. 10. 11-11-14 7.20 1 0.24 0.80 0.01 8.01 10.0 0.0 1.2 30. 10. r 11-19-14 0.4C 0.60 0.40 O.OC 6.0' 10.0 0.0 ' 1.1 60.
co I-' I
11-25-74 0.40" 0.50 '0.55 0.0 6.01 11.0 0.0 7.6 80. 12- 4-14 0.55 0.95 0.40 0'.0 6.( 7.0 0.0 1.8 80.
,12-10-74 0.60- 1.20 o.ao 0.00 6.01 10.0, 0.0 7.8 45. 15. 1-13-15 0.70 2.50 0.90 C.CO 4.C 16.0 0.0 1.3 30. 10.
2-14-15 1.50' '0.40 0.90 0.00 2.0' 8.0 0.0 7.3 60. 10. 2-21-15 0.80 0.40 0.15 e.oc 6.e e.o 0.0 7.4- 60. 6.
2-26-75 0.80 0.95 0.90 0.00 2.0· 10.0 0.0 7.8 80. 8. 3- 5-15 0.4C 1.10 1.00 C.C 6.e 8.0 0.0 7.6 120. 5.
3-12-75 0.30 0.90 0.80 0.0 4.0 10.0 0.0 7.4 85. 8.
3-19-75 0.40 1.15 0.80 e.ec 4.C 11.0,· 0.0 7.8 80. 12.
3-26-15 0.90 1.15 1.00 0.0 6.0 1.0 0.0 7.6 10. 80.

;'-;"'''',''''' ,-'\",-),.'-.-"-'
CHEMICAL TESTS ON kATER ENTERI~G FRCM soufH OF F~~lE~ AVEN~E ( continued)
DATE O-P04 M-P04 N03 N02 CO2 0-02 H2S PH COLOR TURB.
(PPM) (PPM) (PP"" (F P~) (FPM) (PPM' (FPM) {JTU)
4- 9-15 1.20 1.50 1.00' 0.0 4.0 8.0 0.0 7.9 10. 8.
4-29-15 0.80! 1.25 0.9C· 0.0 0.4 10.0 0.0 . 1.8 80. 12 •
5- 6-15 0.10 1.20 0.15 0.0 6.0 11.0- 0.0 1.8 85. 10.
5-13-15 0.85' 1.1t0 0.Ci5 c.e 6.0 12.0 . 0.0 7.9 120.
.""'~f'·"""" ·"(i.4d! ,.. .. -·11 .... · ..
5-21-75 1.30 1.25 0.0 4.0 9.0 0.0 · 8.1 15.
1.
5.
5-30-75 0.45 0.80 1.10' 0.0 8.C 4.0 0.0 1.6 100. 5.
I co
'" I
-.., """"I .. ...."

"
-/ .:1/11'
TABLE XIII
BACTERIOLOGICAL TESTS ON WATER ENTERING FROM SOUTH OF FOWLER AVENUE
, OATE TEMPERATURE P RESUMPT I VE MPN CONFIRMED MPN
,( C ) (ORG./100 ML) (ORG./l00 Ml)
10-23-71 24000.0 . 0.0
11-13-71 9200.0 0.0
11-20-71 22'.0 0.0 0.0
11-24-11 4300.0 0.0
11-29-71 23.0 0.0 0.0
12- 8-71 25,.0 0.0 0.0
12- 9-71 9200.0 0.0
12-20-71 22.0 3500.0 0.0
1Z-2 8;'; 71 21.0 490.0 20.0
1- 4-72 ' 24000. a 5400.0
, 1-12-72 23.5 16000.0 170.0
1-16-72 18.0 24000.0 24000.0
1-20-72 21.5 0.0 0.0
1-Z5-72 21.0 24000.0 , 24000.0
2- 3-72 1').5 0.0 0.0
Z- 9-72' 2Z~0 0.0' 0.0
2-23-72 220.0 90.0
3- 3-72 35000.0 220.0
3-10-72 790.0 20.0
3-17-72 28 000. a 2200.0
. --'
I co w I

--..,
BACTERIOLOGICAL TESTS ON WATER ENTERlNG FROM SOUTH OF FOWLER AVENUE (continued)
DATE TEMPERATURE PRESUMPTIVe MPN CONFIRMED MPN
( C )- (ORG./lOO ML) (ORG./IOO MLJ
3-22-12 1900.0 460.0
3-28-72 100~0 40.0
4- 6-72 3500.0 1100.0
4-12-12 1,800.0 110.0
4-18-72 1400.0 110.0
4-24-12 2200.0 0.0
5- 2-12 11000.0 3500.0
5-16-72' 1900.0.' 260~O
5-23-72 35000.0 1100.0
5-30-72 4300.0 1400.0
6- 6-12 1100.0 7uO.O
6-16-12 13000.0 1100.0
6-20-12 35000.0 0.0
7- 4-12 14000.0 330.0
7-12-12 11000.0 950.0
7-17-72 35000.0 14:)0.0
8- 1-72 1300.0 110.0
8- 8-72 330.0 20.0
8-16-72 790.0 270.0
8-23-72, 2200.0 110.0
.....
I OJ If:> J
-.....

, -' I
BACTERIOLOGICAL TESTS ON WATER ENTERING FROM SOUTH OF FOWLER AVE~~E (continued)
DATE
8-30-12
9- 5r-12
9-12-12
9-21-12
9-28-12
10-12-12
11- 7-12
2-16-13
2-23-73
3- 2-73
3-12-73
4- 1-73
4- 1-13
4-14-73
4-28-73
5- 6-73
5-15-73
5-25-73
5-31-13
1-14-74
TE~PERATURE PRESUMPTIVE MPN CONFIRMED HPN
( C •
8.0
20.0.
22.0
21.0
24.0
23.0
23.0
23.0
22.0
21.5
26.0
(ORG./IOO MU
11000.0
330.0
1900.0
24000.0
920.0
540.0
140.0
1100.0
230.0 0.0 .
210.0
24000.0
9200.0
330.0
1400 .0
1400.0
1100.0
1100.0
190.0 • 20.0
(ORG./IOO MU,
1700.0
20.0
110.0
9200.0
110.0
110.0
30.0
220.0
40.0
0.0
110.0
9200.0
330.0
140.0
110.0
110.0
170.0
. 90.0
2.30.0
'10.0
'--
I co U1 J

-....
'. ~~~. !\,-i} ~~ • ..,?~~. '"i.1~ ".:~:l:r~, '" ,,_, '~.::f :ii4,;;' ." t ;);.~;,:~-, c, '.~'" '\'~
SAC TER I OlOGIC Al rES TS ON WATER ENTER If'JG FROM SOUTH OF FOWLER AVENuE
(continued)
DATE TEMPERATURE PRESUMPTIVE MPN CONfIRMED MPN
(' c ) (ORG.l100·MLI (ORG./100 Ml)
1-20-74 30.0 20.0
1-25-14 20.0 0.0
2- 2-14 23.5 -490.0 330.0
2- 6-14 23.0 -10.0 - .0.0 -
2-18-74 21.0 ·20.0- 20.0
3-2-74 16.5 ·50.0 20.0
3- 9-74 22.5 10.0 0.0
2-'36-74 :22.0 ::2;20 .• '0 ,20.0
3-31-74 20.0 260.0 0.0
4-11-74 23.0 20.0 0.0
4-19-14 2~.0 . 5400._0 110.0
. 10-15-74 26.0 24000.0 . 3500.0
10~22-14 26~5 3500.0 3500.0
10-28-74 23.0 0.0 110.0
il- '5;"14 3000.0 190.0
11-11-14 20.5 24000.0 24000.0
1'1-19-74 16.0 5400.0 5400.0
11-25-14 14.0 24000.0 9200.0
12- 4-14 14.0 3500.0 1400.0·
12-10-14 Ib.5 . .16000.,0 3500.0
~ -,. .-- "
I co 0'1 I

I
BACTERIOLOGICAL TESTS ON ~ATER ENTERING FROM SOUTH OF FOWLER AVENUE (continued)
DATE
1-13-75
2-14-15
2-21-75
2-26-15
3- 5-75
3-12-15
3-1'1-75
3-26-75
4- 2-75
4- «1-75
4-lC1-75
5- 6-75
5-13-75
5-21-75
5-30-75.
TEMPERATURE
( C )
15.0
PRESUHPTIVE MPN
(ORG./lOO I4L)
24000.0
0.0
24000.0
9200.0
5400.0
9200.0
24000.0
16000.0
24000.0
24000.0
24000.0
2800.0
24000.0
24000.0
24000.0
CONFIRMED MPN
(ORG./lOO ML)
24000.0
10000.0
.24000.0
9200.0
1700.0
1100.0
24000.0
9200.0
16 000. 0
24000.0
24000.0
2800.0
2400.0
24000.0
240i,lO.0
~-
I co -...J I

-88-
9. SUMMARY
The original purpose of this project was to determine the changes in the quantity and quality of stormwater runoff from a small urbanizing watershed. Unfortunately, the planned development has not yet taken place, thus the anticipated hydrologic changes did not occur.. However, valuable- data was obtained pertaining to~ 1) the changes in runoff quality during a storm, 2) the yearly variation ofr~noff quality from a partially developed watershed, 3) the lack of change in quality of ground water in the surface aquifer, and 4) the purification of urban runoff by routing it over a natural vegetative system. .
In addition, the study confirmed that disturbing marshes or lakes causes a significant increase in suspended .solids and nutrient content in runoff, especially phosphates •.
The data pertaining to the variation of ·pollutant concentrations during a storm, indicated a high initial peak during the first minutes of a storm, as expected. Some pollutants did not wash off immediately and caused second peaks or in some cases plateaus.
r , ..
r
f
•

-89-
REFERENCES
1. Buell, M. and J. Cantlon - A Study of Two Communities of the New Jers~y Pine Barrens and a Comparison of Methods. Ecolo'gy_ 31: 567-586, 1950.
2. Canfield, R. H. Application of the Line Intersection Method of Sampling Range Vegetation. Jour. For. 39: 388-394, 1941.
3. Lakla, 0.. and R. W. Long - Plants of The Tampa Bay Area, University of South Florida, USF Bookstore, 1970.
4. Lindsey, A. A. Testing the Line-strip Method Against Full Tallies In Diverse Forest Types. Ecology 36: 485-494, 1955.
5. Long, R. W. and O. Lakela :- A Flora of Tropical Florida, University of Miami Press, Coral Gables, Florida, 1971.
6. Monk, C. D. and J. T. McGinnis - True Species Diversity -In Six Forest Types in North Central Florida - Jour. Ecol. 54: 341-344, 1966.
7. Richards, P. W. - The Tropical Rain Forest, Cambridge Univ. Press., New York, 1952.
8. Strahler, A. N. - Physical Geography 3rd Ed. John Wiley, New York, 1969.
9. Wilde, S. A.- Floristic Analysis of GroundCcver Vegetation' By a Rapid Chain Method. Jour.' For. 52: 499-502, 1954.
lOa Standard Methods for the Examination of Water and WasteWater, 13th Edition, American Public Health Association, 1971.