a history of the u.s. navy physical readiness program from ...s3.amazonaws.com/zanran_storage/ · a...
TRANSCRIPT

A HISTORY OF THE U.S. NAVY PHYSICAL READINESS PROGRAMFROM 1976 TO 1999
James A. Hodgdon, Ph.D.
Human Performance DepartmentNaval Health Research Center
P.O. Box 85122San Diego, CA 92186-5122
Technical Document Number 99-6F, supported by the Office of Naval Research, Arlington, VA,and the Navy Personnel Command, Millington, TN, under research work unit 63706NM0096.002-6716. The opinions expressed in this paper are those of the author, and do notreflect official policy or position of the Department of the Navy, the Department of Defense, orthe U.S. Government.
ii
TABLE OF CONTENTS
Table of Contents............................................................................................................................ iiList of Tables ................................................................................................................................. iiiList of Figures................................................................................................................................ iiiList of Acronyms ........................................................................................................................... ivSummary..........................................................................................................................................1Preface .............................................................................................................................................3Chronology ......................................................................................................................................3
OPNAVINST 6110.1 (16 June 1976)..........................................................................................3Study of Military Services Physical Fitness ................................................................................4OPNAVINST 6110.1A (17 July 1980) .......................................................................................5DoD Directive 1308.1 (29 June 1981).........................................................................................6OPNAVINST 6110.1B (19 October 1982) .................................................................................6
Program....................................................................................................................................7Physical Readiness Test (PRT)................................................................................................7Standards..................................................................................................................................8
OPNAVNOTE 6110 (13 August 1984).......................................................................................9OPNAVINST 6110.1C (7 August 1986)...................................................................................10
PRT Screening .......................................................................................................................11PRT Changes .........................................................................................................................11Body Composition Standards and Measurement...................................................................12PRT Standards and Point System ..........................................................................................14Basic Exercise Program.........................................................................................................16Consequences of Failure........................................................................................................16Reporting Results...................................................................................................................16Inspection Item ......................................................................................................................17
Research and Development .......................................................................................................17Alternative Tests....................................................................................................................18Recruit Training and PRT Performance ................................................................................21Job-Related Physical Readiness Standards............................................................................21
OPNAVINST 6110.1D (18 January 1990)................................................................................22CFC Qualifications ................................................................................................................22Revised PRT Screening .........................................................................................................22PRT Standards .......................................................................................................................22
Changes to PRP .........................................................................................................................23DoD Directive 1308.1 (20 July 1995) .......................................................................................26DoD Instruction 1308.3 (30 August 1995) ................................................................................26Navy Program Changes .............................................................................................................28Research and Development .......................................................................................................28OPNAVINST 6110.1E (23 March 1998) ..................................................................................30Institute of Medicine Report ......................................................................................................32GAO Report (November 1998) .................................................................................................33Continuing Efforts .....................................................................................................................34
Research and Development ...................................................................................................34Draft DoD Instruction 1308.3................................................................................................36
Navy Activities ..........................................................................................................................37
iii
Closing Remarks............................................................................................................................38References......................................................................................................................................40
LIST OF TABLES
Table 1. Physical Fitness Standards From OPNAVINST 6110.1A...............................................5Table 2. Physical Readiness Classification Table and Test Requirements From OPNAVINST
6110.1B....................................................................................................................................9Table 3. 500-yard Swim Classification Table..............................................................................10Table 4. Estimation of Body Fat Limits.......................................................................................13Table 5. Physical Readiness Classification Table and Test Requirements From OPNAVINST
6110.1C..................................................................................................................................16Table 6. Administrative and Statutory Action for Members Failing the PRT or Exceeding Body
Fat Standards .........................................................................................................................17Table 7. Relationships Between 1.5-Mile Run and 500-Yard Swim Times.................................18Table 8. Swim Study Participant Characteristics1 .......................................................................19Table 9. Selected Correlations .....................................................................................................19Table 10. 500-Yard Swim Times Predicted From 1.5-Mile Run Time Standards ......................20Table 11. 5-km Stationary Cycle Times Predicted From 1.5-Mile Run Time Standards............21Table 12. Weights for Height From NAVADMIN 148/94..........................................................25Table 13. Weights for Height From DoD Instruction 1308.3.......................................................27Table 14. Difference in Run Times Between Men and Women in OPNAVINST 6110.1D .......31Table 15. 1.5-Mile Run Times Equivalent to 82% of Male VO2max (min) ..................................31Table 16. Differences Between 82% VO2max Run Times and 6110.1D Standards (min)............32
LIST OF FIGURES
Figure 1. Changes in administrative separations associated with PRT policy changes. Figurecourtesy of NPC-601............................................................................................................ 23
Figure 2. Comparison of 1.5-mile run times for Navy and Institute of Aerobics Researchpopulation samples............................................................................................................... 38
iv
LIST OF ACRONYMS
American Alliance for Health, Physical Education, Recreation and Dance AAHPERDAmerican College of Sports Medicine ACSMBody Composition, Nutrition, and Health BCNHBody Mass Index BMIBureau of Medicine BUMEDBureau of Personnel BUPERSChief of Naval Operations CNOCommand Fitness Coordinators CFCsCommanding Officer COCommittee for Physical Fitness CPFCommittee on Military Nutrition Research CMNRDepartment of Defense DoDEnlisted Evaluations EVALsForce Management Policy FMPGovernment Accounting Office GAOHealth and Physical Readiness HPRInstitute of Aerobics Research IARJoint Service Working Group JSWGManpower, Reserve Affairs and Logistics MRA&LNational Health & Nutrition Examination
Survey NHANESNational Institute of Health NIHNaval Administrative NAVADMINNaval Health Research Center NHRCNaval Medical Research and Development
Command NMRDCNaval Operations NAVOPSNavy Personnel NAVPERSNavy Military Personnel Command NMPCNavy Personnel Command NPCOffice of Physical Fitness OPFOffice of the Chief of Naval Operations OCNOOfficers Fitness Reports FITREPsPhysical Fitness Tests PFTsPhysical Readiness Program PRPPhysical Readiness Test PRTSecretary of Defense SECDEFSecretary of the Navy Instruction SECNAVINSTStandard Error of Estimate SEEStandard Error of Measurement SEM
1
SUMMARY
This report reviews the development, evolution, and implementation of the Navy’s PhysicalReadiness Program (PRP) through the series of Instructions, numbered 6110.1, on the subjectissued by the Office of the Chief of Naval Operations. The first of these Instructions,OPNAVINST 6110.1 (1976) emphasized a program of cardiovascular-respiratory fitnessdevelopment based on the popular aerobics program of Dr. Ken Cooper.
OPNAVINST 6110.1A (1980) was issued following a presidential request for an assessmentof the service’s physical fitness. The only change from the previous Instruction was theinclusion of a physical fitness test to allow the assessment of the fitness of Navy personnel.
A comprehensive revision of the program was issued as OPNAVINST 6110.1B (1982). ThisInstruction was issued to implement new policies promulgated by the Department of Defense(DoD) in its Directive 1308.1 (June 1981). The Instruction contained a new three-level programto develop and maintain health and physical fitness of Navy personnel. The program was named“physical readiness” to distinguish it from previous programs and included consideration ofphysical fitness, weight control, and health promotion issues. A physical readiness test (PRT)was included, consisting of the time required to run 1.5 miles, or the number of steps-in-placethat could be done in 3 min; the number of curl-ups that could be done in 2 min; andmeasurement of the sit-reach distance. A key aspect of the program was the appointment ofCommand Fitness Coordinators (CFCs) to be the manager for the Commanding Officers for theimplementation of the program.
OPNAVINST 6110.1C (1986) established the basis for policy and practice that has continuedto this day. The Instruction was limited to physical readiness (i.e., physical fitness and body fatstandards). The health promotion aspects of the previous program were now covered under aseparate Instruction. A health risk screen was added to determine suitability for physicalreadiness testing and/or admission to physical conditioning programs. Body fat contentmeasurement was incorporated into the screening. A new technique for estimation of body fatcontent and new body fat standards were adopted. The consequences for failing the PRT werespelled out in detail. Guidance was provided for a basic exercise program. Two new items wereadded to the PRT: number of push-ups performed in 2 min, and the time required to swim 500yards. The latter was added as an alternative to the 1.5-mile run. Measurement of ability to runin place was dropped as a test item, and the sit-reach distance was made a pass/fail item based onthe ability to reach one’s toes while seated on the deck.
OPNAVINST 6110.1D (1990) provided a definition of qualifications for the CFC. It offeredan improved risk factor screening questionnaire and an improved format for individual records.In the 8 years following the release of this Instruction, several changes to the program weremandated through Naval Administrative messages, and Naval Operations messages.Participation in the PRT by service member’s 50 years of age and older was made optional. Thebody fat standards were changed from a two-tiered set of standards that allowed Navy personnelto attain body fat levels of 26% of body weight for males and 36% for females to a singlestandard of 22% fat for males and 30% fat for females. The criterion for administrative actionfor PRT failure was changed such that a service member who had 3 failures in a 4-year periodwas processed for administrative discharge. These last two changes had a profound effect on thenumber of Navy personnel administratively discharged for PRT and body fat failures. Inaddition to these changes, other policy changes included a weight-for-height table as an initial

2
screening device for body fat content evaluation, and the provision of specific waivers from theapplication of the body fat standards.
OPNAVINST 6110.1E was released in March 1998, to take effect in September of that year.The purpose of the Instruction was to fine-tune some aspects of the program. CFCs wererequired to get Instruction to train them for their duties. The weight-for-height screening tableswere revised, as was the women’s body fat standard, which was increased to 33% fat to provideparity with the men’s standard. In addition, minor changes were made to the women’s 1.5-milerun standards, new Instructions were issued for the push-ups and curl-ups, changes were made tothe sit-reach event, and an exercise requirement for pregnant sailors was issued.
Since the issuance of OPNAVINST 6110.1E, reports have been issued by the GovernmentAccounting Office, and Institute of Medicine that provide recommendations for modification ofthe service’s policies for physical fitness and body fat. A new DoD Instruction is in draft, as is anew OPNAVINST.
An evaluation of the current state of fitness of the Navy suggests that the Navy’s PRP isassociated with a level of aerobic (health-related) fitness among Navy personnel that is greaterthan that of their civilian counterparts. This situation is expected to continue.
3
PREFACE
This report reviews the history of the Office of the Chief of Naval Operations (OCNO)Instructions OPNAVINST series 6110.1, which deals with physical fitness and body fatstandards. This review covers weight control/body fat policy, the Physical Readiness Program(PRP), the Physical Readiness Test (PRT), physical conditioning support, and the research thatsupported the physical readiness policy. When possible, this report discusses the rationalebehind, issues surrounding, and implementation of those policies. The report is organizedchronologically and traces the progression of physical fitness and body fat policy through theOPNAVINST series 6110.1.
This report was developed, in large part, from my recollection of events. References tosupporting documentation are provided whenever possible. I take full responsibility for anymisrepresentations, and I apologize for omissions on my part of any important events related toformulation and implementation of physical fitness and body fat policy.
CHRONOLOGY
OPNAVINST 6110.1 (16 June 1976)
It is unclear what events prompted the Chief of Naval Operations (CNO) to take on theresponsibility to issue Instructions covering physical fitness.8 OPNAVINST 6110.1 was theimplementing Instruction for a Secretary of the Navy Instruction (SECNAVINST 6100.2)promulgated in 1962. The OPNAVINST background statement indicates the Navy hadpublished a number of directives addressing the subject of physical fitness over several yearspreceding this Instruction, but, for a variety of reasons, the implementation of those directivesand the maintenance of physical fitness throughout the Navy had not become a reality.
The stated purpose of the Instruction was “To implement a physical fitness program for Navypersonnel, regular and reserve, that will meet the need for physical stamina and strengthnecessary for combat effectiveness and mobilization as directed by [the SECNAVINST].” Thesubject and sole focus of the Instruction was “physical fitness.” Weight control was covered bya joint Bureau of Personnel and Bureau of Medicine and Surgery Instruction (BUPERSINST6110.2A/BUMEDINST 6110.1A) that included weight-for-height standards that had to be met.Nonetheless, a definition of obesity was included in the Instruction. Obesity was defined as“excessive accumulation of fat in the body manifested by poor muscle tone, flabbiness and folds,bulk out of proportion to body build, dyspnea (difficult or labored breathing), and fatigue uponmild exertion, all of which detracts from military appearance.” Thus, the Instruction indicated aperceived relationship between body fat content, job performance, and appearance.
In this Instruction, physical fitness was defined as “ability of each individual to carry outhis/her daily tasks with vigor and alertness, without undue fatigue, and with ample energy tomeet unforeseen emergencies.” Physical fitness in that sense was “necessarily tied tocardiovascular fitness”; however, of equal importance was “the maintenance of sufficientstrength to perform an individual’s duties/tasks and sufficient flexibility to avoid injury.” Thus,while emphasizing cardiovascular-respiratory fitness, the Instruction also established strengthand flexibility as elements of physical fitness.
The program that was provided was essentially the aerobics program popularized by Dr. KenCooper in his book The New Aerobics.24 A set of warm-up stretching exercises were provided aswell as calisthenics to “improve coordination and posture as well as to increase strength and
4
endurance.” The rest of the program consisted of Cooper’s aerobic point system with theinstruction for each individual “to engage in some aerobic type physical activity that will allowachieving a minimum of 30 points weekly, or 120 points monthly.”
The Instruction did not include a physical fitness test.
Study of Military Services Physical Fitness
On 2 February 1980, the President of the United States requested an assessment of theservices’ physical fitness from the Secretary of Defense (SECDEF). This request led to theconvening of a symposium on military physical fitness at Arly House in Virginia, 17-19 June1980. Representatives attended the symposium from each of the services including military andcivilian experts from the disciplines of medicine, physical fitness, and physiology. The purposeof the symposium was to review the existing physical fitness policies and practices of theservices, and to make recommendations for improving those policies and practices.41
A Joint Services Study Group was created to review the findings of the Arly House meetingand convey them to the SECDEF for Manpower, Reserve Affairs and Logistics (MRA&L). Thefindings of the Joint Services Study Group were the following:
• Military services cannot provide an accurate assessment of the physical fitness of theirpersonnel.
• Services do not provide total physical fitness programs to their members of all ages and in allmilitary occupations.
• Skilled professional leadership in physical fitness is lacking in the services.
• Continuing applied research in physical fitness, related to practical problems, is largelynonexistent.
• No dedicated funding or established direction of effort for physical fitness programs orresearch at the Department of Defense (DoD) or service levels exists.
• A significant gap between the “state-of-the-art” and service physical fitness programsappears to exist.
• Nearly all European countries plus others, including Israel, have well-organized militaryphysical fitness programs. The USSR physical fitness program is highly organized andapplies to all military and civilian personnel.
• There is some reason to believe that elite U.S. military units are in acceptable physical fitnessstatus.
The Study Group made the following recommendations:
• That the services establish a system that can determine the current status of physical fitness,recommend objectives, develop programs, and monitor their effectiveness.
• That the SECDEF establish an Office for Physical Fitness (OPF) to provide oversight andguidance of DoD physical fitness policy and programs.
• That the SECDEF support service initiatives in the Planning, Programming, and BudgetingSystem cycle to improve and expand their physical fitness organizations and programs.
5
• That the services provide physical training time, as appropriate, to allow the integration ofphysical fitness activities within the duty day.
• That the SECDEF and the services explore and implement methods for educating servicepersonnel on the value and techniques of applying physical fitness programs.
• That the services assign personnel with educational degrees in physical fitness to positionsrequiring such expertise. This should include service headquarters and training commandheadquarters officers responsible for physical fitness policy and programs.
• That SECDEF establishes a DoD Committee for Physical Fitness (CPF) with representativesof the services to include line, training, medical, and physical fitness officers. The committeeshall perform a coordinated, continuing review and evaluation of the services’ physicalfitness programs, research, and tests.
• That a DoD advisory CPF be established with representatives from the civilian medical andphysical fitness communities.
• That the OPF and DoD CPF develop and prioritize research requirements in physical fitnessand coordinate research projects and studies between the services, as needed.
• That a decision on a DoD Physical Fitness Academy be postponed until a suitable basis ismade available to definitely decide against such an organization.
• That the services be encouraged to phase their physical fitness efforts over the near term yearto reduce high-surge expenditures and permit time for changes in lifestyles to graduallyoccur.
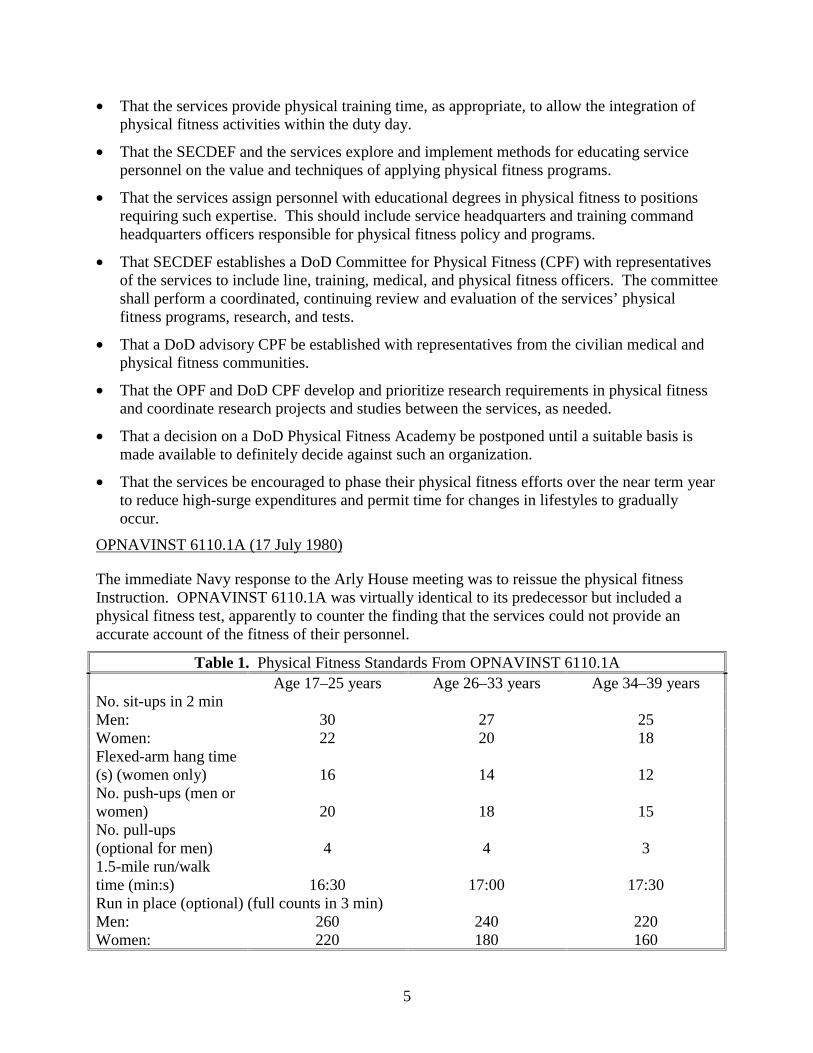
OPNAVINST 6110.1A (17 July 1980)
The immediate Navy response to the Arly House meeting was to reissue the physical fitnessInstruction. OPNAVINST 6110.1A was virtually identical to its predecessor but included aphysical fitness test, apparently to counter the finding that the services could not provide anaccurate account of the fitness of their personnel.
Table 1. Physical Fitness Standards From OPNAVINST 6110.1AAge 17–25 years Age 26–33 years Age 34–39 years
No. sit-ups in 2 minMen: 30 27 25Women: 22 20 18Flexed-arm hang time(s) (women only) 16 14 12No. push-ups (men orwomen) 20 18 15No. pull-ups(optional for men) 4 4 31.5-mile run/walktime (min:s) 16:30 17:00 17:30Run in place (optional) (full counts in 3 min)Men: 260 240 220Women: 220 180 160

6
All Navy personnel under 40 years of age were tested annually. The test consisted of thenumber of sit-ups that could be performed in 2 min, measurement of flexed-arm hang time forwomen, and maximum number of push-ups or pull-ups for men, and time to complete a 1.5-milewalk/run or number of run-in-place steps in 3 min. The standards for the test are provided inTable 1.
There was no gender difference in the standards for the 1.5-mile run. Comparison of thesestandards with those to come in later physical fitness Instructions finds them to be rather lenient.The derivation of these standards is unclear.
DoD Directive 1308.1 (29 June 1981)
Following the issuance of the report on military physical fitness, a new DoD Directive wasissued titled “Physical Fitness and Weight Control Programs.”4 The basic thrusts of thisDirective were as follows:
• Primary emphasis shall be placed on quality programs and secondary emphasis on testingpersonnel. Military services will conduct remedial training for those who fall belowprescribed standards. Continued failure will result in consideration for administrativeseparation of officers and enlisted members.
• Physical fitness programs and age-adjusted standards shall apply to all personnel.
• Stamina and cardiorespiratory endurance shall receive major emphasis in physical fitnessprograms.
• Programs shall emphasize 3-4 periods per week of physical training, except in operationalenvironments by waiver of service chiefs.
• Active and reserve physical fitness standards are to be identical.
• The measurement of percent body fat shall be the determining measurement used in weightcontrol policy decisions.
• Medical screening, for selected high-risk personnel, shall be required before placement in amandatory physical fitness program.
• The Assistant SECDEF (MRA&L) shall coordinate and monitor the DoD physical fitnessprogram within the DoD.
• The services shall develop specific objectives and feedback mechanisms that provide forperiodic assessment of their physical fitness and weight control programs.
• Physical fitness shall be included on efficiency or fitness reports. Physical fitness scores willbe retained in unit files and most recent test scores will be forwarded to the gaining commandupon personnel transfer.
This Directive combined physical fitness and weight control programs (which previously hadbeen covered by separate Directives) and became the driving force for the development of newPRPs in all of the services.
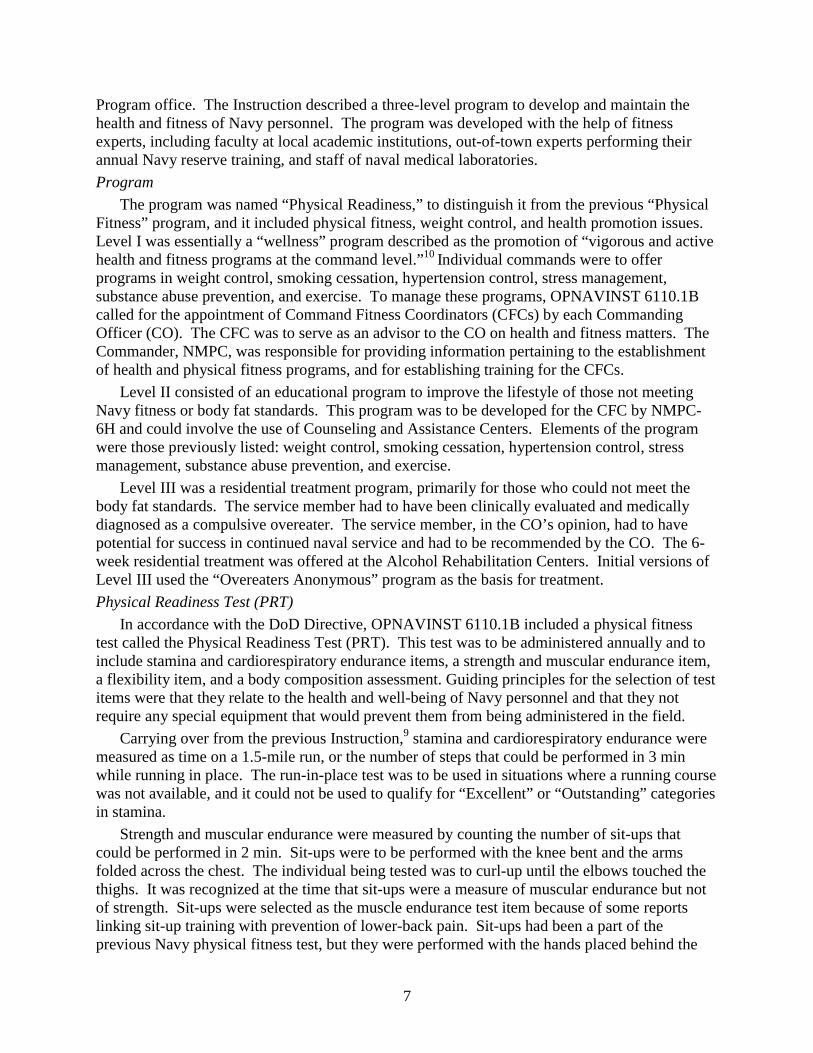
OPNAVINST 6110.1B (19 October 1982)
The Navy’s response to this DoD Directive was the development of OPNAVINST 6110.1B.This Instruction was developed by Navy Military Personnel Command (NMPC) under a newlyformed Health and Physical Readiness Program (NMPC-6H) within the Alcohol Rehabilitation
7
Program office. The Instruction described a three-level program to develop and maintain thehealth and fitness of Navy personnel. The program was developed with the help of fitnessexperts, including faculty at local academic institutions, out-of-town experts performing theirannual Navy reserve training, and staff of naval medical laboratories.
Program
The program was named “Physical Readiness,” to distinguish it from the previous “PhysicalFitness” program, and it included physical fitness, weight control, and health promotion issues.Level I was essentially a “wellness” program described as the promotion of “vigorous and activehealth and fitness programs at the command level.”10 Individual commands were to offerprograms in weight control, smoking cessation, hypertension control, stress management,substance abuse prevention, and exercise. To manage these programs, OPNAVINST 6110.1Bcalled for the appointment of Command Fitness Coordinators (CFCs) by each CommandingOfficer (CO). The CFC was to serve as an advisor to the CO on health and fitness matters. TheCommander, NMPC, was responsible for providing information pertaining to the establishmentof health and physical fitness programs, and for establishing training for the CFCs.
Level II consisted of an educational program to improve the lifestyle of those not meetingNavy fitness or body fat standards. This program was to be developed for the CFC by NMPC-6H and could involve the use of Counseling and Assistance Centers. Elements of the programwere those previously listed: weight control, smoking cessation, hypertension control, stressmanagement, substance abuse prevention, and exercise.
Level III was a residential treatment program, primarily for those who could not meet thebody fat standards. The service member had to have been clinically evaluated and medicallydiagnosed as a compulsive overeater. The service member, in the CO’s opinion, had to havepotential for success in continued naval service and had to be recommended by the CO. The 6-week residential treatment was offered at the Alcohol Rehabilitation Centers. Initial versions ofLevel III used the “Overeaters Anonymous” program as the basis for treatment.
Physical Readiness Test (PRT)
In accordance with the DoD Directive, OPNAVINST 6110.1B included a physical fitnesstest called the Physical Readiness Test (PRT). This test was to be administered annually and toinclude stamina and cardiorespiratory endurance items, a strength and muscular endurance item,a flexibility item, and a body composition assessment. Guiding principles for the selection of testitems were that they relate to the health and well-being of Navy personnel and that they notrequire any special equipment that would prevent them from being administered in the field.
Carrying over from the previous Instruction,9 stamina and cardiorespiratory endurance weremeasured as time on a 1.5-mile run, or the number of steps that could be performed in 3 minwhile running in place. The run-in-place test was to be used in situations where a running coursewas not available, and it could not be used to qualify for “Excellent” or “Outstanding” categoriesin stamina.
Strength and muscular endurance were measured by counting the number of sit-ups thatcould be performed in 2 min. Sit-ups were to be performed with the knee bent and the armsfolded across the chest. The individual being tested was to curl-up until the elbows touched thethighs. It was recognized at the time that sit-ups were a measure of muscular endurance but notof strength. Sit-ups were selected as the muscle endurance test item because of some reportslinking sit-up training with prevention of lower-back pain. Sit-ups had been a part of theprevious Navy physical fitness test, but they were performed with the hands placed behind the
8
head, and required curling up until the elbows touched the ground. This style, shown to causeinjury to the neck and low back, was changed. The flexed-arm hang, push-ups and pull-ups weredropped as test items.
Flexibility was measured for the lower back and hamstrings using the sit-reach test. Theindividual being tested sat on the deck with his/her legs extended forward with the feet spread 6inches apart. The individual then reached forward as far as possible touching the floor betweenhis/her legs. The distance reached was measured from a line connecting the heels. Distancesless than that to the heels were scored as negative distances. Those greater than that to the heelswere scored as positive distances. The test was modified from that used by the AmericanAlliance for Health, Physical Education, Recreation, and Dance (AAHPERD).1 The AAHPERDtest required using a box to provide a surface at about seated waist height, across which theperson being tested reached. Because the PRT could not require the use of special equipment,the test was modified so that a box would not be needed.
Body composition was also an element of the PRT. Body composition was measured underthe following conditions: The member’s weight exceeded that on a weight-for-height tableprovided in the Instruction; the member’s CO determined that his/her appearance suggested anexcess of body fat; or the member participated in the PRT. The weight-for-height table wastaken from OPNAVINST 6110.3, the Navy’s previous weight control policy. That Instructionwas cancelled by OPNAVINST 6110.1B.
Body fat content, as a percentage of weight, was estimated using the equations of Wright,Dotson, and Davis.48,49 These equations had been developed for and were in use by the U.S.Marine Corps as part of its weight control policy.16 Body fat content was estimated from neckand abdomen circumferences for men, and neck, abdominal, biceps, forearm, and thighcircumferences for women.
Standards
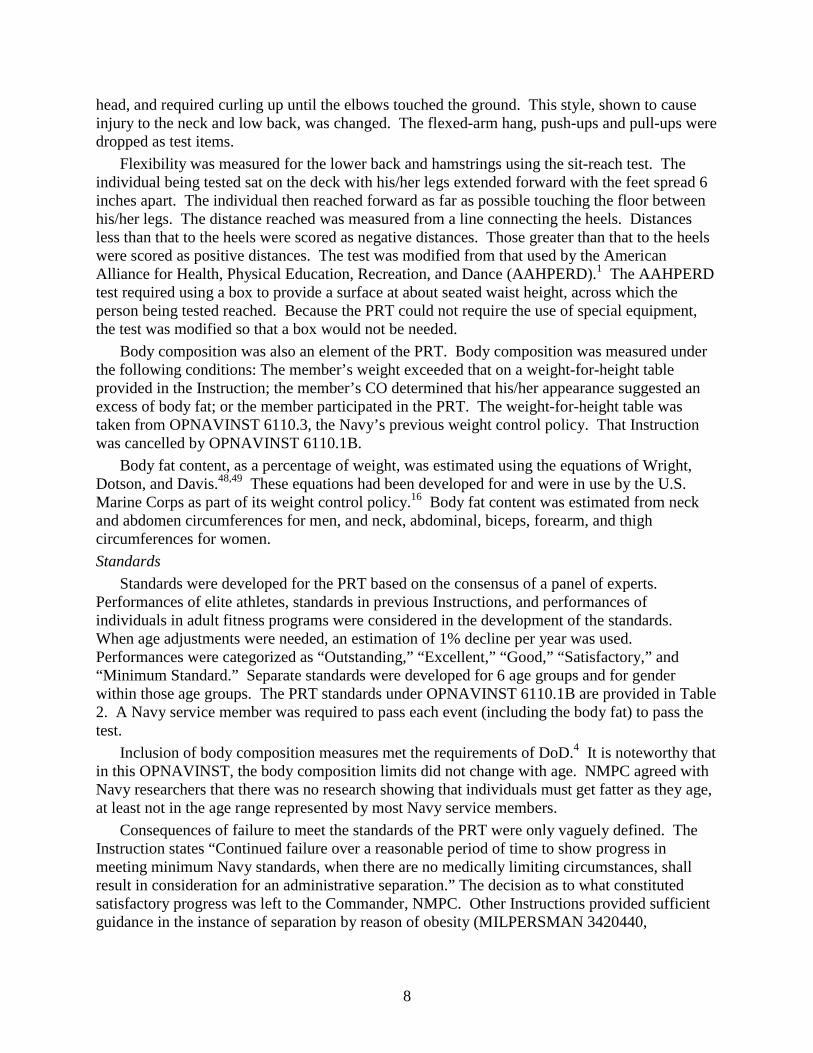
Standards were developed for the PRT based on the consensus of a panel of experts.Performances of elite athletes, standards in previous Instructions, and performances ofindividuals in adult fitness programs were considered in the development of the standards.When age adjustments were needed, an estimation of 1% decline per year was used.Performances were categorized as “Outstanding,” “Excellent,” “Good,” “Satisfactory,” and“Minimum Standard.” Separate standards were developed for 6 age groups and for genderwithin those age groups. The PRT standards under OPNAVINST 6110.1B are provided in Table2. A Navy service member was required to pass each event (including the body fat) to pass thetest.
Inclusion of body composition measures met the requirements of DoD.4 It is noteworthy thatin this OPNAVINST, the body composition limits did not change with age. NMPC agreed withNavy researchers that there was no research showing that individuals must get fatter as they age,at least not in the age range represented by most Navy service members.
Consequences of failure to meet the standards of the PRT were only vaguely defined. TheInstruction states “Continued failure over a reasonable period of time to show progress inmeeting minimum Navy standards, when there are no medically limiting circumstances, shallresult in consideration for an administrative separation.” The decision as to what constitutedsatisfactory progress was left to the Commander, NMPC. Other Instructions provided sufficientguidance in the instance of separation by reason of obesity (MILPERSMAN 3420440,
9
SECNAVINST 1920.6), and for requirements to meet weight standards prior to advancement inrate (BUPERSINST 1430.16A).
Table 2. Physical Readiness Classification Table and Test Requirements FromOPNAVINST 6110.1B
AGE Under 30 years 30 – 34 years 35 – 39 years 40 – 44 years 45 – 49 years 50 years & Older
Men Women Men Women Men Women Men Women Men Women Men Women
OUTSTANDING
1.5-MILE RUN 9:45 11:30 10:00 12:00 10:30 12:30 11:00 13:00 11:30 13:30 12:00 14:00
SIT-UPS 100 84 90 75 85 71 80 67 80 67 80 67
SIT-REACH +2.0 +4.0 +2.0 +3.5 +1.5 +3.0 +1.5 +3.0 +1.0 +2.0 +1.0 +2.0
PERCENT FAT 14 18 14 18 14 18 14 18 14 18 14 18
EXCELLENT
1.5-MILE RUN 10:45 13:00 11:00 13;30 11:30 14:00 12:00 14:30 12:30 15:00 13:00 15:30
SIT-UPS 75 63 68 56 64 53 60 50 60 50 60 50
SIT-REACH +1.0 +3.0 0 +2.0 0 +1.5 0 +1.0 -0.5 +1.0 -0.5 +1.0
PERCENT FAT 16 22 16 22 16 22 16 22 16 22 16 22
GOOD
1.5-MILE RUN 13:00 15:00 14:00 15:30 14:30 16:00 15:00 16:30 15:30 17:00 16:00 17:00
RUN IN PLACE 310 260 280 220 260 200 260 200 240 180 240 180
SIT-UPS 36 30 34 28 32 26 30 25 30 25 30 25
SIT-REACH 0 +2.0 -1.0 0 -1.0 0 -1.0 0 -1.0 0 -1.0 0
PERCENT FAT 18 24 18 24 18 24 18 24 18 24 18 24
SATISFACTORY
1.5-MILE RUN 14:30 16:30 15:30 17:30 16:00 18:00 16:30 18:30 17:00 19:00 17:30 20;00
RUN IN PLACE 310 260 280 220 260 200 260 200 240 180 240 180
SIT-UPS 36 30 34 28 32 26 30 25 30 25 30 25
SIT-REACH -1.0 0 -1.5 -0.5 -1.5 -1.0 -1.5 -1.0 -2.0 -1.5 -2.0 -1.5
PERCENT FAT 20 29 20 29 22 29 22 29 22 29 22 29
MINIMUM
1.5-MILE RUN 15:00 17:00 16:00 18:00 16:30 18:30 17:00 19:00 17:30 19:30 18:00 20:30
RUN IN PLACE 280 235 250 200 230 180 230 180 210 160 210 160
SIT-UPS 33 27 31 25 29 23 27 22 27 22 27 22
SIT-REACH -1.5 -0.5 -2.0 -1.0 -2.0 -1.5 -2.0 -1.5 -2.5 -2.0 -2.5 -2.0
PERCENT FAT 22 30 22 30 22 30 22 30 22 30 22 30
To meet the DoD requirement to provide for a periodic assessment of the physical fitness andweight control programs, OPNAVINST 6110.1B required NMPC-6H to provide an ongoingevaluation of the Health and Physical Readiness (HPR) program. The Instruction also requiredthe Chief, BUMED, to conduct research in lifestyle areas, including physical fitness and obesity.
OPNAVNOTE 6110 (13 August 1984)
In August of 1984, the CNO issued OPNAVNOTE 6110, Ser 153/366201,11 which updatedthe testing and administrative procedures for conducting the PRT. With issuance of this note, thesit-reach test was now scored as pass/fail. This change reflected reports from the Fleet andreview of the scientific literature that suggested that extreme flexion and extension of the lowerback posed an injury risk. Since what was desired was a moderate level of flexibility, the sit-reach test was modified. The service member had to sit on the deck and reach forward to touchhis/her toes, and hold that position for 1 s. In addition, the run-in-place test was deleted, a 500-
10
yard swim was added as an alternative to the 1.5-mile run, the maximum body fat allowance wasmodified for selected age groups, and a test scoring procedure was implemented.
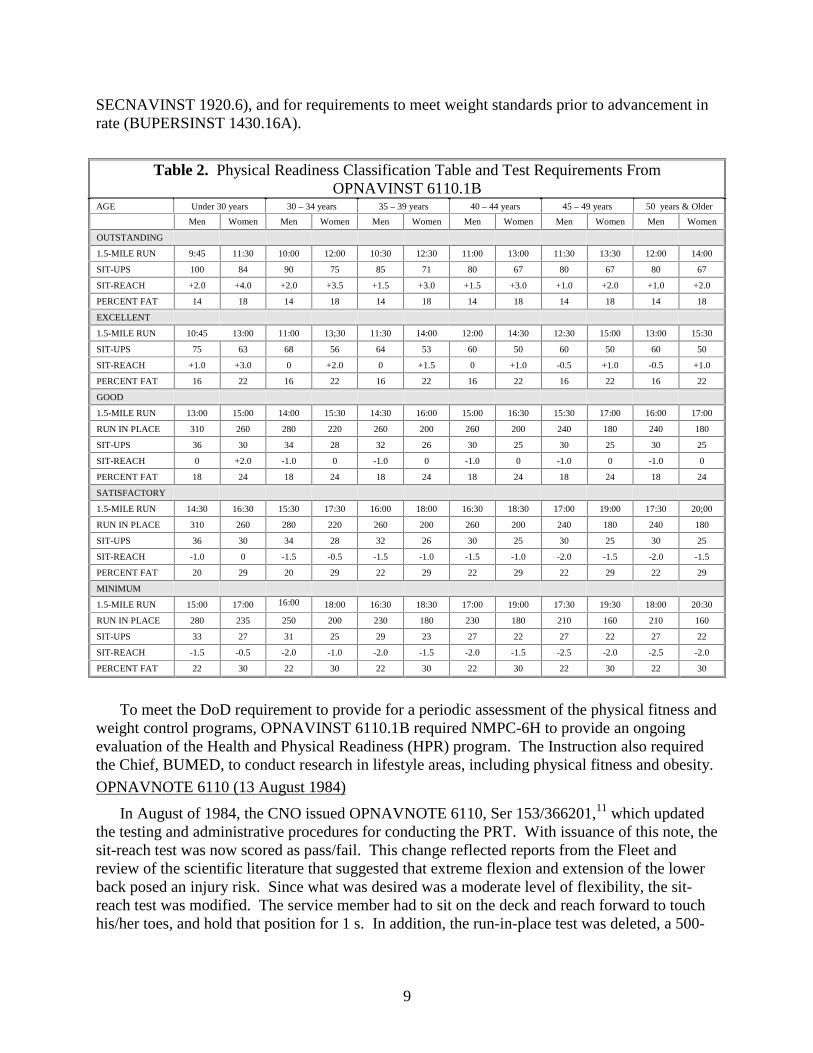
The 500-yard swim was added to provide variety in testing modalities, and to provide anaerobic test for those personnel who had been medically waived from having to perform the run.The swim could be performed using any stroke. No diving starts or kick/flip turns were allowed,and the test could be conducted in open water around floats, if desired. Standards forperformance on the swim are shown in Table 3. The derivation of these times is unclear.
Table 3. 500-yard Swim Classification Table.
Age (years): Under 30 30 – 34 35 – 39 40 – 44 45 – 49 50 & olderMenOutstanding 8:00 8:30 9:00 9:30 10:00 10:30Excellent 9:45 10:15 10:45 11:15 11:45 12:15Good 11:30 12:00 12:30 13:00 13:30 14:00Satisfactory 13:15 13:45 14:15 15:45 16:15 16:45Minimum 15:00 15:30 16:00 16:30 17:00 17:30WomenOutstanding 9:15 10:00 10:40 11:15 12:00 12:45Excellent 11:40 12:25 13:05 13:50 14:35 15:25Good 14:15 15:00 15:45 16:30 17:25 18:15Satisfactory 17:00 17:50 18:40 21:20 22:20 23:15Minimum 20:00 20:25 21:50 22:45 23:45 24:40
The body fat values shown in Table 2 were changed for some of classifications in the 45-49and 50 years and older groups. The body fat values to attain a classification of “good” in the 50years and older group were raised to 19% fat for men and 26% fat for women. The valuesrequired to attain a “satisfactory” classification in the 45-49 year group were decreased to 21%fat for men and 27% fat for women. For the 50 years and older group, the value for women wasdecreased to 28% fat. The “minimum” standards were raised to 23% fat for men and 31% fat forwomen in the 45-49 year age group and to 24% fat for men and 32% fat for women in the 50years and older age group.
A test scoring system was implemented in which 5 points were given for each outstandingclassification, 4 points for each excellent, 3 points for each good, 2 points for each satisfactory,and 1 point for each minimum classification. Points were assigned for performances on the runor swim, sit-ups, and percent body fat. The points were averaged for the three events androunded to the nearest integer value.
In addition to the testing and scoring changes, Navy personnel who did not meet theminimum standards on the PRT were required to participate in remedial exercise periods of 30-min duration, three times per week.
OPNAVINST 6110.1C (7 August 1986)
The second revision of the Navy physical readiness policy since the issuance ofOPNAVINST 6110.1B was promulgated in 1986 as OPNAVINST 6110.1C.12 Several majorchanges were incorporated into this Instruction. The health promotion aspects of the previousHPR program were now covered under a separate health promotion Instruction. OPNAVINST6110.1C was titled “Physical Readiness.” Naval personnel were required to take the PRT twice
11
each fiscal year, with no less than 4 months or no more than 8 months between tests. A healthrisk screen was added to determine suitability for physical readiness testing. Assessment ofcompliance with body fat standards was removed as an item in the PRT to an independentevaluation, and it served as part of the screening for the PRT. A new technique for estimatingbody fat and new standards for body composition were adopted. The consequences of failing thePRT were spelled out in detail. Guidance was provided for a basic exercise program. One newitems (push-ups in 2 min) was added to the PRT, and new standards were established based inpart on distributional statistics derived from samples of Navy personnel. These changes formedthe basis for policy and practice that has continued to this day.
PRT Screening
As the first step in PRT screening, the CFC checked to determine whether the member’sphysical examination was current. If it was not, the member had to get a physical examinationbefore he/she could take the PRT.
The second step was the completion of a risk factor questionnaire. The questionnairecontained questions about cardiovascular disease symptoms, family history of cardiovasculardisease, joint problems, age, disease status, smoking, and obesity. The questions are similar tothose still in use today.14 A “yes” answer to any of the screening questions, that is, havingdisease risk or symptomatology, was cause to refer the service member to the medicaldepartment. In that instance, the reviewing medical officer had to approve the member’sparticipation in the PRT as well as in physical conditioning programs.
The third step was the determination of body composition. Body fat content was estimatedusing equations developed by researchers at the Naval Health Research Center (NHRC).28,29 Aswas the case with the previously utilized Marine Corps equations, these estimations were basedon body circumference measurements. For men, height was measured in addition to neck andabdominal circumferences. For women, height was also measured as well as neck, natural waist,and hip circumferences. Circumference and height values were measured and body fat contentwas determined by looking up height against sums or differences of the circumference values ina table to arrive at a body fat value.
A two-tiered structure for body composition standards was established. Navy servicemembers who exceeded 22% fat for men and 30% for women were judged to be overfat. Thosewho exceeded 26% fat for men or 36% fat for women were judged to be obese. Members whowere found to be obese were referred to the medical department for evaluation. They were notallowed to take the PRT until medically cleared. Service members who were found to be obeseupon medical examination were not allowed to take the PRT. If a diagnosis of obesity wassustained for 16 months, the service member was considered for administrative separation.
PRT Changes
OPNAVINST 6110.1C incorporated changes in all areas of physical readiness testing. Thesit-reach test was retained as a measure of flexibility.
A new strength and endurance test was added: the number of push-ups that could beperformed in 2 min. This test was apparently added because of a NMPC perception that curl-upswere not viewed in the Fleet as a “real” test of strength. Additionally, there was a desire in theFleet to have a strength test. It was known from the work of Robertson and Trent 42 that 80% ofthe physically demanding jobs in the Navy involved pushing, pulling, lifting, or carrying. Push-ups were perceived as a dynamic strength test, and seemed to satisfy the Fleet’s desire for such atest. The selection of push-ups as a “strength” test added weight to the misperception that they,
12
in fact, measure strength. Because push-ups are a repeated submaximal exercise, they, like curl-ups, are a measure of muscle endurance.
The number of curl-ups that could be performed in 2 min was retained as a measure ofmuscle endurance. Performance of curl-ups continued to be viewed as valuable in decreasing therisk of low-back injury.
Requirements for the 500-yard swim were modified. The test had to be carried out in a 25-or 50-yard pool. Only the crawl stroke could be used. Goggles or a mask could be worn, but notfins, snorkels, or other flotation or propulsion devices. A diving start still could not be used, norcould “flip” or somersault turns.
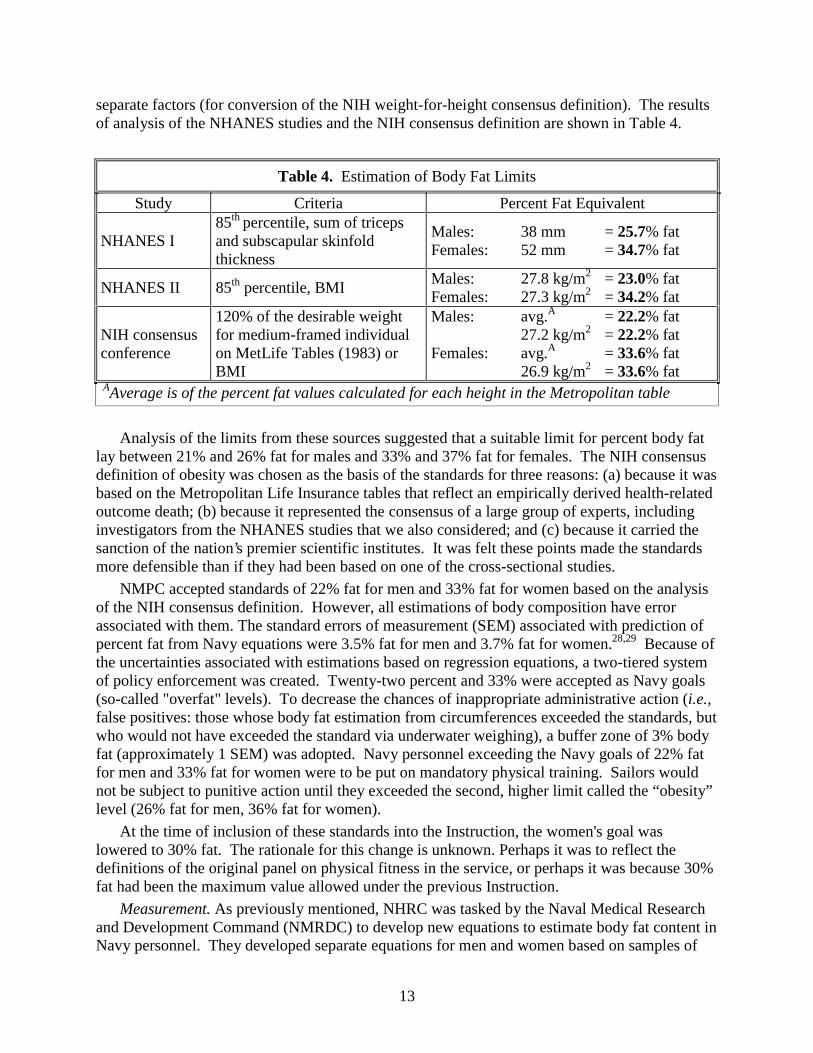
Body Composition Standards and Measurement
Standards. The body composition standards were based on health considerations. Foursources were considered in determining these health-related standards: (a) results from theNational Health and Nutrition Examination Survey (NHANES) I, (b) results from NHANES II,(c) recommendations from a current monograph of the time,6 and (d) results from the ConsensusConference of the National Institutes of Health (NIH).37
The NHANESs provide some of the most comprehensive data on prevalence ofcardiovascular disease risk factors and obesity in the United States.35 NHANES I data werecollected from 1971 to 1974. NHANES II was conducted from 1976 to 1980. In both thesesurveys, the basis for allocation into higher- and lower-risk groups was based on whether theindividual lay above or below the 85th percentile for the sum of triceps and subscapular skinfold(NHANES I) or for body mass index (BMI) (equal to weight [kg] divided by height [m] squared)(NHANES II).
Behnke and Wilmore developed the so-called reference man and reference woman whereinstandard body proportions were developed based on median values for a variety ofanthropometric measurements.6 By analyzing changes in body proportions with increasinglevels of fatness, they determined that the point at which adipocytes were "full" and any furtherincrease in fatness was due to laying down more adipose tissue was at percent fat values of 21.5for males and 36.4 for females (when including the "essential" fat in the percentage).
In February 1985, NIH held a consensus development conference dealing with the healthimplications of obesity.39 From that conference, a consensus statement was developed thatdefined obesity as "an excess of body fat frequently resulting in a significant impairment ofhealth." The panel agreed that an increase in body weight of 20% or more above desirable bodyweight constituted an established health hazard. Therefore, weight reduction was recommendedfor persons "with excess weight of 20% or more above desirable weights in the MetropolitanLife Insurance Company tables," or the BMI equivalent of 27.2 for men and 26.9 for women(based on the more-liberal 1983 tables).38 In setting these standards, the consensus panelrecognized that measures of height and weight "only approximate the precise magnitude offatness," but were the only measures that a great deal of epidemiological data were available.
Because the DoD policy was that percent fat values be used as the basis for weight reduction,it was necessary to determine relationships between the potential standards provided from eachof the preceding sources and percent body fat. To do this, the NHRC body composition data setwas used. At that time, the data set contained the measurements of 997 male and 337 femaleNavy personnel. Regression equations to predict percent body fat for males and for femalesfrom (a) the sum of triceps and subscapular skinfold thicknesses (for conversion of NHANES Ifindings), (b) BMI (for conversion of NHANES II findings), and (c) weight and height as
13
separate factors (for conversion of the NIH weight-for-height consensus definition). The resultsof analysis of the NHANES studies and the NIH consensus definition are shown in Table 4.
Table 4. Estimation of Body Fat Limits
Study Criteria Percent Fat Equivalent
NHANES I85th percentile, sum of tricepsand subscapular skinfoldthickness
Males: 38 mm = 25.7% fatFemales: 52 mm = 34.7% fat
NHANES II 85th percentile, BMIMales: 27.8 kg/m2 = 23.0% fatFemales: 27.3 kg/m2 = 34.2% fat
NIH consensusconference
120% of the desirable weightfor medium-framed individualon MetLife Tables (1983) orBMI
Males: avg.A = 22.2% fat27.2 kg/m2 = 22.2% fat
Females: avg.A = 33.6% fat26.9 kg/m2 = 33.6% fat
AAverage is of the percent fat values calculated for each height in the Metropolitan table
Analysis of the limits from these sources suggested that a suitable limit for percent body fatlay between 21% and 26% fat for males and 33% and 37% fat for females. The NIH consensusdefinition of obesity was chosen as the basis of the standards for three reasons: (a) because it wasbased on the Metropolitan Life Insurance tables that reflect an empirically derived health-relatedoutcome death; (b) because it represented the consensus of a large group of experts, includinginvestigators from the NHANES studies that we also considered; and (c) because it carried thesanction of the nation’s premier scientific institutes. It was felt these points made the standardsmore defensible than if they had been based on one of the cross-sectional studies.
NMPC accepted standards of 22% fat for men and 33% fat for women based on the analysisof the NIH consensus definition. However, all estimations of body composition have errorassociated with them. The standard errors of measurement (SEM) associated with prediction ofpercent fat from Navy equations were 3.5% fat for men and 3.7% fat for women.28,29 Because ofthe uncertainties associated with estimations based on regression equations, a two-tiered systemof policy enforcement was created. Twenty-two percent and 33% were accepted as Navy goals(so-called "overfat" levels). To decrease the chances of inappropriate administrative action (i.e.,false positives: those whose body fat estimation from circumferences exceeded the standards, butwho would not have exceeded the standard via underwater weighing), a buffer zone of 3% bodyfat (approximately 1 SEM) was adopted. Navy personnel exceeding the Navy goals of 22% fatfor men and 33% fat for women were to be put on mandatory physical training. Sailors wouldnot be subject to punitive action until they exceeded the second, higher limit called the “obesity”level (26% fat for men, 36% fat for women).
At the time of inclusion of these standards into the Instruction, the women's goal waslowered to 30% fat. The rationale for this change is unknown. Perhaps it was to reflect thedefinitions of the original panel on physical fitness in the service, or perhaps it was because 30%fat had been the maximum value allowed under the previous Instruction.
Measurement. As previously mentioned, NHRC was tasked by the Naval Medical Researchand Development Command (NMRDC) to develop new equations to estimate body fat content inNavy personnel. They developed separate equations for men and women based on samples of

14
602 men and 214 women. It was decided to predict body density (from which body fat contentcould be calculated) rather than body fat content in order that any refinements in the estimationof body fat content from body density could be incorporated directly, without any furtherresearch.
The equations developed to predict body density were:
( ) 1.032height)Log1550circ. neck - circ. abdomenLog-0.191Density Body 1010 +×+×= (.
for men, where all measurements were in centimeters and
1.296(height)Log2210circ.) neck-circ. hipcirc.(waist Log-0.350Density Body 1010 +×++×= .
for women, again, with all measurements in centimeters
Percent body fat was computed using the equation of Siri.44
+×= 54Density Body4.95100Fat BodyPercent .
The correlation coefficients between percent fat predicted by these equations and thatdetermined from two-compartment analysis of underwater weighing data were 0.90 (standarderror of estimate [SEE] = 3.5% fat) for men, and 0.85 (SEE = 3.7% fat) for women. Thesecorrelations and SEE were as good or better than those associated with other commonly usedskinfold and/or circumference-based equations.28,29
Additional research was carried out investigating the use of whole body bioelectricimpedance to predict body fat content in Navy personnel. These studies showed that thecircumference-based equations were superior to those involving height, weight, and whole bodyresistance at 50 kHz.31,32,37,43
Based on this research, NMPC adopted the equations developed at NHRC as the basis fordetermining body fat content for Navy personnel.
PRT Standards and Point System
New PRT standards were promulgated with OPNAVINST 6110.1C, and the categories forPRT classification were changed. The “Minimum” category was dropped. The age groups werereorganized so that they now represented decades. All Navy personnel 50 years of age and olderwere included in the same age group. These standards were developed based on research NHRCconducted for NMPC-6H.
To meet the research requirements called for in OPNAVINST 6110.1B, NMPC taskedNHRC in 1983 to develop and execute a program of research to evaluate the HPR program.15,18
The research included two parts: the collection of cross-sectional baseline samples of shore-based and shipboard personnel, and the establishment of a cohort of Navy personnel that couldbe studied longitudinally. The baseline samples consisted of 6,182 shore-based personnel (4,923men, 1259 women),40 and 3,979 shipboard personnel.22 Male standards for the run and sit-upswere developed based on distributional statistics of these two Navy personnel samples.
The population distributions were analyzed by age group. NHRC suggested category cut-offof the 95th percentile for “Outstanding” (revised upward from the 90th percentile, followingNMPC review), the 80th percentile for “Excellent,” the 50th percentile for “Good,” the 20th
percentile for “Satisfactory,” and the 5th percentile for “Minimum,”20 with a 2-year phaseout ofthe “Minimum” category. Standards were provided for the sit-reach (pass/fail), sit-ups in 2 min,
15
push-ups in 2 min, maximum number of pull-ups (for men only) and the 1.5-mile run for agegroups 17–19 years, 20–29 years, 30–39 years, and 40 years and older.
Standards for women were developed using the U.S. Army physical fitness standards thatwere in effect in 1985. The Army Physical Fitness Test (PFT) included the number of push-upsand the number of sit-ups that could be performed in 2 min as test items for both men andwomen. Relationship between male and female standards on the sit-up test were determined andapplied to the Navy male standards developed from the Navy samples. The Navy data did notinclude measurement of the number of push-ups that could be performed in 2 min. To establishstandards for Navy personnel, a regression to predict push-up performance from sit-upperformance was developed using the Army standards. This model was then applied to Navy sit-up standards to determine the push-up standards.
In addition, NHRC provided a set of point scales to provide an overall measure of PRTperformance, much like that in use by the U.S. Marine Corps. Separate point scales weredeveloped for each age and gender group. The maximum number of points that could beachieved was 100 for each event, except for the sit-reach, which was a pass/fail event. Themaximum for the PRT was 300 points.
After review of the NHRC suggested standards, NMPC-6H decided not to use pull-ups as aPRT item. NMPC also decided to add an age group. The 40 years and older group were dividedinto two groups, 40–49 years and 50 years and older. In addition, NMPC provided a table of500-yard swim times for inclusion in the Instructions.
NHRC was asked to develop standards for the 50 years and older group for all PRT items,and to drop the “Minimum” level of classification. The 40 years and older standards wereretained as the 40–49 years age group standards. There were sufficient numbers of 50 years andolder men in the baseline samples to develop sit-up and 1.5-mile run time standards for that agegroup. Women’s standards and push-up standards were developed in the same fashion that theyhad been for the first iteration of suggested standards.
In addition, NHRC developed a single table of point values for overall PRT classificationsfor each age and gender group. The points were derived from the percentile values forperformances using the complete baseline sample for each of the items. While the exact detailshave not been discovered, the process was one wherein PRT item performance values at twopercentiles (e.g., the 90th and 10th, were assigned point values of 90 and 10, respectively, andused to determine the linear relationship between points and performance for that PRT item).This linear relationship was then used to generate performance values for each point on the scale.Possible points for each PRT event ranged from zero to 100, with 100 representing the bestperformance in relation to lesser point values. Point values for each classification level were setas the sum of the points associated with that classification level on each individual PRT. That is,the total points for “Outstanding” for a given gender and age group was the sum of the pointsassociated with “Outstanding” performance on each of the PRT items (sit-ups, push-ups, and 1.5-mile run or 500-yard swim) for that group. Point values for the PRT, then, ranged from zero to300. The use of a single point scale for each event with different classification values for eachage and gender group was adopted by NMPC because it seemed simpler to present and use thandifferent point scales for each gender/age group. Failure of any event in the PRT constitutedfailure of the PRT. In such a case, points were not assigned.
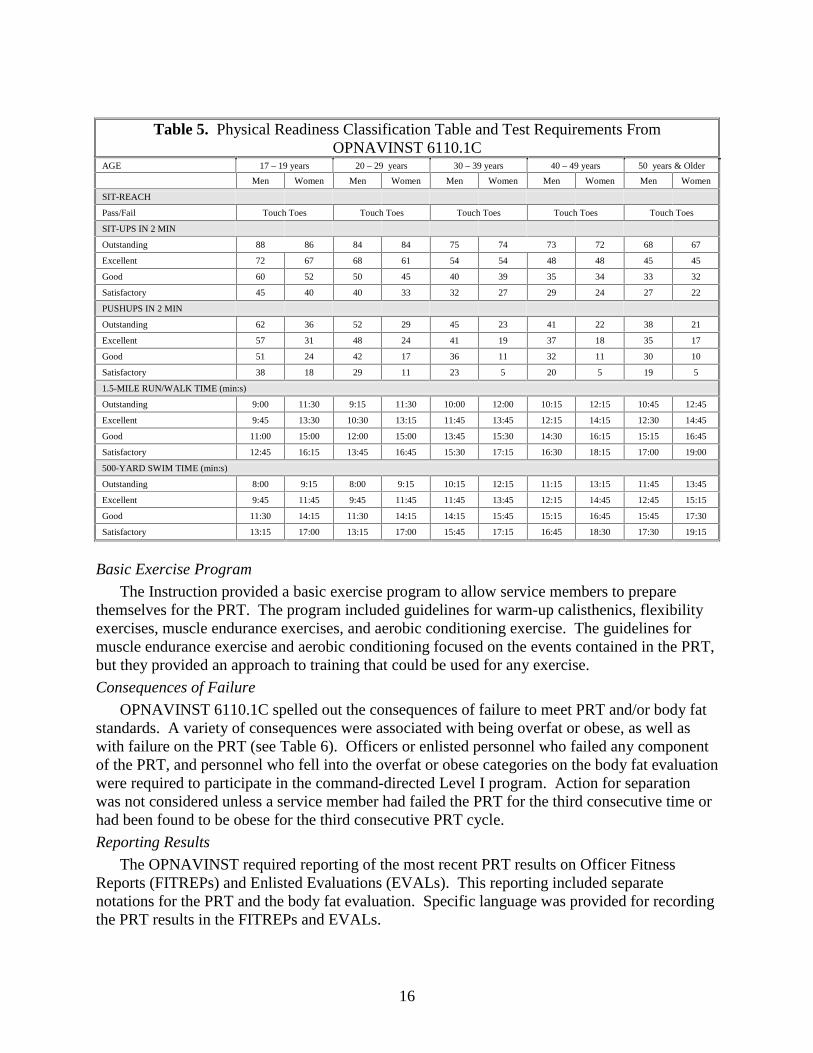
The revised standards for the PRT items and the point system were given to NMPC-6H,accepted, and included in OPNAVINST 6110.1C.23 The PRT standards are provided in Table 5.
16
Table 5. Physical Readiness Classification Table and Test Requirements FromOPNAVINST 6110.1C
AGE 17 – 19 years 20 – 29 years 30 – 39 years 40 – 49 years 50 years & Older
Men Women Men Women Men Women Men Women Men Women
SIT-REACH
Pass/Fail Touch Toes Touch Toes Touch Toes Touch Toes Touch Toes
SIT-UPS IN 2 MIN
Outstanding 88 86 84 84 75 74 73 72 68 67
Excellent 72 67 68 61 54 54 48 48 45 45
Good 60 52 50 45 40 39 35 34 33 32
Satisfactory 45 40 40 33 32 27 29 24 27 22
PUSHUPS IN 2 MIN
Outstanding 62 36 52 29 45 23 41 22 38 21
Excellent 57 31 48 24 41 19 37 18 35 17
Good 51 24 42 17 36 11 32 11 30 10
Satisfactory 38 18 29 11 23 5 20 5 19 5
1.5-MILE RUN/WALK TIME (min:s)
Outstanding 9:00 11:30 9:15 11:30 10:00 12:00 10:15 12:15 10:45 12:45
Excellent 9:45 13:30 10:30 13:15 11:45 13:45 12:15 14:15 12:30 14:45
Good 11:00 15:00 12:00 15:00 13:45 15:30 14:30 16:15 15:15 16:45
Satisfactory 12:45 16:15 13:45 16:45 15:30 17:15 16:30 18:15 17:00 19:00
500-YARD SWIM TIME (min:s)
Outstanding 8:00 9:15 8:00 9:15 10:15 12:15 11:15 13:15 11:45 13:45
Excellent 9:45 11:45 9:45 11:45 11:45 13:45 12:15 14:45 12:45 15:15
Good 11:30 14:15 11:30 14:15 14:15 15:45 15:15 16:45 15:45 17:30
Satisfactory 13:15 17:00 13:15 17:00 15:45 17:15 16:45 18:30 17:30 19:15
Basic Exercise Program
The Instruction provided a basic exercise program to allow service members to preparethemselves for the PRT. The program included guidelines for warm-up calisthenics, flexibilityexercises, muscle endurance exercises, and aerobic conditioning exercise. The guidelines formuscle endurance exercise and aerobic conditioning focused on the events contained in the PRT,but they provided an approach to training that could be used for any exercise.
Consequences of Failure
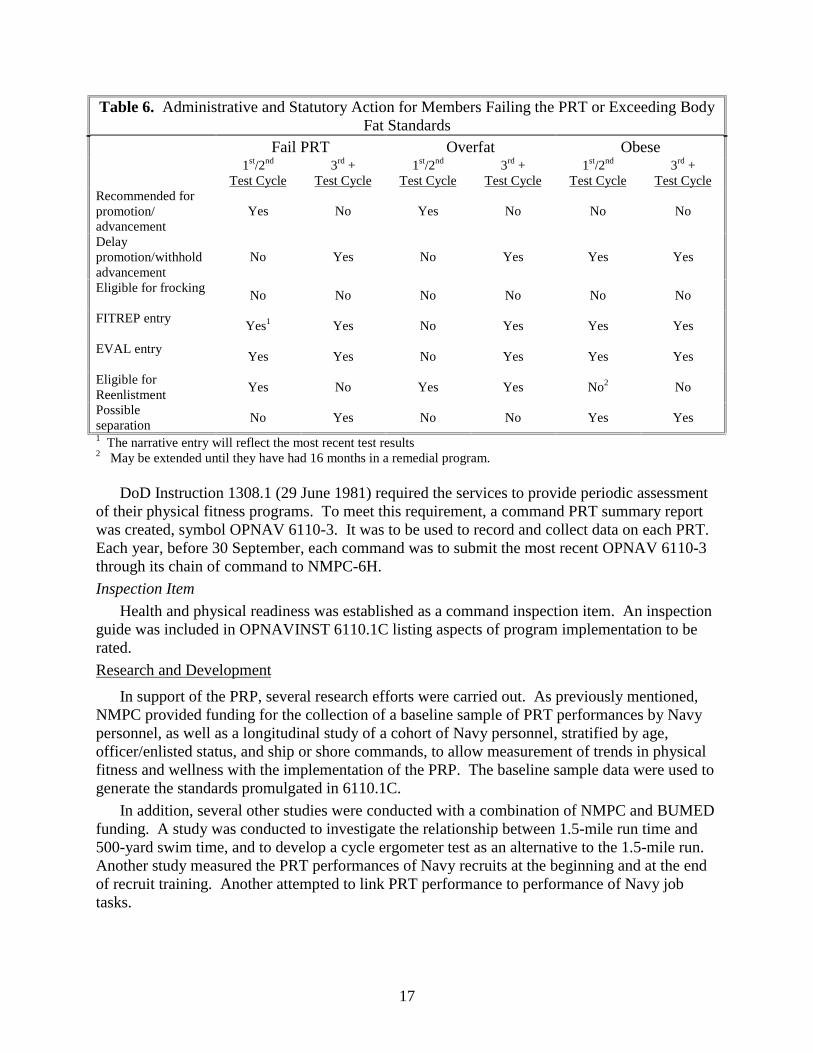
OPNAVINST 6110.1C spelled out the consequences of failure to meet PRT and/or body fatstandards. A variety of consequences were associated with being overfat or obese, as well aswith failure on the PRT (see Table 6). Officers or enlisted personnel who failed any componentof the PRT, and personnel who fell into the overfat or obese categories on the body fat evaluationwere required to participate in the command-directed Level I program. Action for separationwas not considered unless a service member had failed the PRT for the third consecutive time orhad been found to be obese for the third consecutive PRT cycle.
Reporting Results
The OPNAVINST required reporting of the most recent PRT results on Officer FitnessReports (FITREPs) and Enlisted Evaluations (EVALs). This reporting included separatenotations for the PRT and the body fat evaluation. Specific language was provided for recordingthe PRT results in the FITREPs and EVALs.
17
Table 6. Administrative and Statutory Action for Members Failing the PRT or Exceeding BodyFat Standards
Fail PRT Overfat Obese1st/2nd
Test Cycle3rd +
Test Cycle1st/2nd
Test Cycle3rd +
Test Cycle1st/2nd
Test Cycle3rd +
Test CycleRecommended forpromotion/advancement
Yes No Yes No No No
Delaypromotion/withholdadvancement
No Yes No Yes Yes Yes
Eligible for frockingNo No No No No No
FITREP entryYes1 Yes No Yes Yes Yes
EVAL entryYes Yes No Yes Yes Yes
Eligible forReenlistment
Yes No Yes Yes No2 No
Possibleseparation
No Yes No No Yes Yes
1 The narrative entry will reflect the most recent test results2 May be extended until they have had 16 months in a remedial program.
DoD Instruction 1308.1 (29 June 1981) required the services to provide periodic assessmentof their physical fitness programs. To meet this requirement, a command PRT summary reportwas created, symbol OPNAV 6110-3. It was to be used to record and collect data on each PRT.Each year, before 30 September, each command was to submit the most recent OPNAV 6110-3through its chain of command to NMPC-6H.
Inspection Item
Health and physical readiness was established as a command inspection item. An inspectionguide was included in OPNAVINST 6110.1C listing aspects of program implementation to berated.
Research and Development
In support of the PRP, several research efforts were carried out. As previously mentioned,NMPC provided funding for the collection of a baseline sample of PRT performances by Navypersonnel, as well as a longitudinal study of a cohort of Navy personnel, stratified by age,officer/enlisted status, and ship or shore commands, to allow measurement of trends in physicalfitness and wellness with the implementation of the PRP. The baseline sample data were used togenerate the standards promulgated in 6110.1C.
In addition, several other studies were conducted with a combination of NMPC and BUMEDfunding. A study was conducted to investigate the relationship between 1.5-mile run time and500-yard swim time, and to develop a cycle ergometer test as an alternative to the 1.5-mile run.Another study measured the PRT performances of Navy recruits at the beginning and at the endof recruit training. Another attempted to link PRT performance to performance of Navy jobtasks.

18
Alternative Tests
500-yard swim test. As previously noted, OPNAVNOTE 6110 of August 1984 andOPNAVINST 6110.1C provided for a 500-yard swim test that could be taken instead of the 1.5-mile run. The NMPC provided the table of values. I have not been able to determine theprocedures, sources, or rationale used to determine these 500-yard swim time standards. It is myrecollection that NHRC was told that these times were derived from data from the Cooper Clinic,but I have been unable to reproduce the tables in OPNAVINST 6110.1C from the publishedCooper Clinic data.25
The swim times were strongly related to run time. Regressions for each gender and agegroup are provided in Table 7. An analysis of variance of the relationship between run time andswim time revealed a significant three-way interaction (run time by age group by gender; F3,19 =3.81, p = 0.027). Post hoc regression analysis indicated gender differences in the relationshipsbetween run time and swim time only for the two youngest age groups: 17–19 years (t = 5.16, p= 0.004) and 20–29 years (t = 3.67, p = 0.014). The regressions for the three oldest age groups,30–39 years, 40–49 years, and 50 years and older, did differ significantly (p > 0.05 for genderand age group effects, and all interactions). The common regression for the age and gendergroups including service members 30 years of age and older was:
0.960Time Run0.962Time Swim +×=
where Swim Time is the time to complete a 500-yard swim and Run Time is the time tocomplete a 1.5-mile run.
The correlation coefficient for this relationship was 0.99 and the SEE was 0.34 min. Thestandard error value was reasonable considering all times were rounded to the nearest 0.25 min.Given the strength of the relationship between run time and swim time, it was suggested that theswim times were based on some translation of the run time standards.
Table 7. Relationships Between 1.5-Mile Run and 500-Yard Swim TimesAge Group/Gender Slope Intercept Correlation
CoefficientSEM (min)
17-19 years/male 1.357 -3.789 0.984 0.397
20–29 years/male 1.160 -2.573 0.997 0.168
30–39 years/male 1.029 -0.122 0.997 0.192
40–49 years/male 0.932 1.409 0.987 0.418
≥50 years/male 0.918 1.572 0.990 0.361
17-19 years/female 1.613 -9.616 0.992 0.424
20–29 years/female 1.471 -7.721 1.000 0.079
30–39 years/female 0.971 0.543 0.998 0.129
40–49 years/female 0.888 2.278 0.999 0.121
≥50 years/female 0.903 2.162 0.997 0.191
In 1986/87, a study was conducted at San Diego State University by the Department ofPhysical Education. The aims of the study were twofold: (a) to explore the relationships

19
between performance on the 1.5-mile run and the 500-yard swim to provide a basis fordevelopment of rational standards for the swim; and (b) to develop a bicycle ergometer-basedtest of aerobic capacity to use as a low-impact alternative to the 1.5-mile run. The results ofthese studies have been reported by Buono.7
In the swim portion of the study, 60 participants (32 women and 28 men, mean ageapproximately 25 years) had their maximal rate of oxygen consumption (VO2max) determinedfrom open-circuit spirometry during a graded exercise test on a motor-driven treadmill. Theyalso had their swimming skill determined, swam 500 yards for time, and ran 1.5 miles for time.Swimming skill was assessed by observation using a structured scoring system developed at SanDiego State University. Swimming skill was rated on a 1.0 to 3.0 scale in 0.25 point increments.Based on this point scale, swimmers were rated as beginner, intermediate, or advanced. Physicalcharacteristics of the subjects are provided in Table 8, and correlations among the measures areshown in Table 9.
Table 8. Swim Study Participant Characteristics1
MeasureMen
(N = 28)Women(N = 32)
Total sample(N = 60)
Age 25.9 ± 4.4 23.7 ± 4.6 24.8 ± 4.6Height (cm) 178.3 ± 7.7 168.7 ± 6.1 173.2 ± 8.42
Weight (kg) 74.5 ± 9.0 60.7 ± 6.6 67.4 ± 10.42
Percent fat 10.6 ± 4.9 19.6 ± 6.1 15.2 ± 7.12
VO2max (ml⋅kg-1⋅min-1) 58.8 ± 9.1 46.5 ± 8.0 52.4 ± 10.52
1.5-mile run time (min) 9.77 ± 1.70 12.06 ± 2.64 10.95 ± 2.502
500-yard swim time (min) 9.38 ± 2.93 9.69 ± 2.86 9.54 ± 2.88Swim skill 2.27 ± 0.67 2.12 ± 0.74 2.20 ± 0.701 Values shown are means ± SD2 Values differ between men and women
Table 9. Selected Correlations% fat VO2max 1.5-mile run 500-yard
swimVO2max -0.73**1.5-mile run 0.76** -0.84**500-yard swim 0.22 -0.33* 0.42*Swim skill -0.32* 0.31* -0.43* -0.85** *Correlation is significant at the p < 0.05 level (two-tailed)**Correlation is significant at the p < 0.001 level (two-tailed)
The values shown in Table 8 show the study participants to be young, healthy, active adults.It can be seen in Table 9 that the highest correlations are between 1.5-mile run time and VO2max
and between 500-yard swim time and swimming skill. Percent fat is also strongly related toVO2max and 1.5-mile run time. The 500-yard swim time, while significantly correlated, is notstrongly related to VO2max (10.6% of the variance explained) or to 1.5-mile run time (17.7% ofthe variance explained). In multiple regression analysis, to predict swim time from swim skill,
20
1.5-mile run time, and percent fat, swim skill was entered first and was the only significantpredictor. Once swimming skill was known, there was no variance to be predicted by 1.5-milerun or VO2max. These findings suggested that the swim test is an inadequate substitute for the1.5-mile run, at least as a predictor of aerobic fitness.
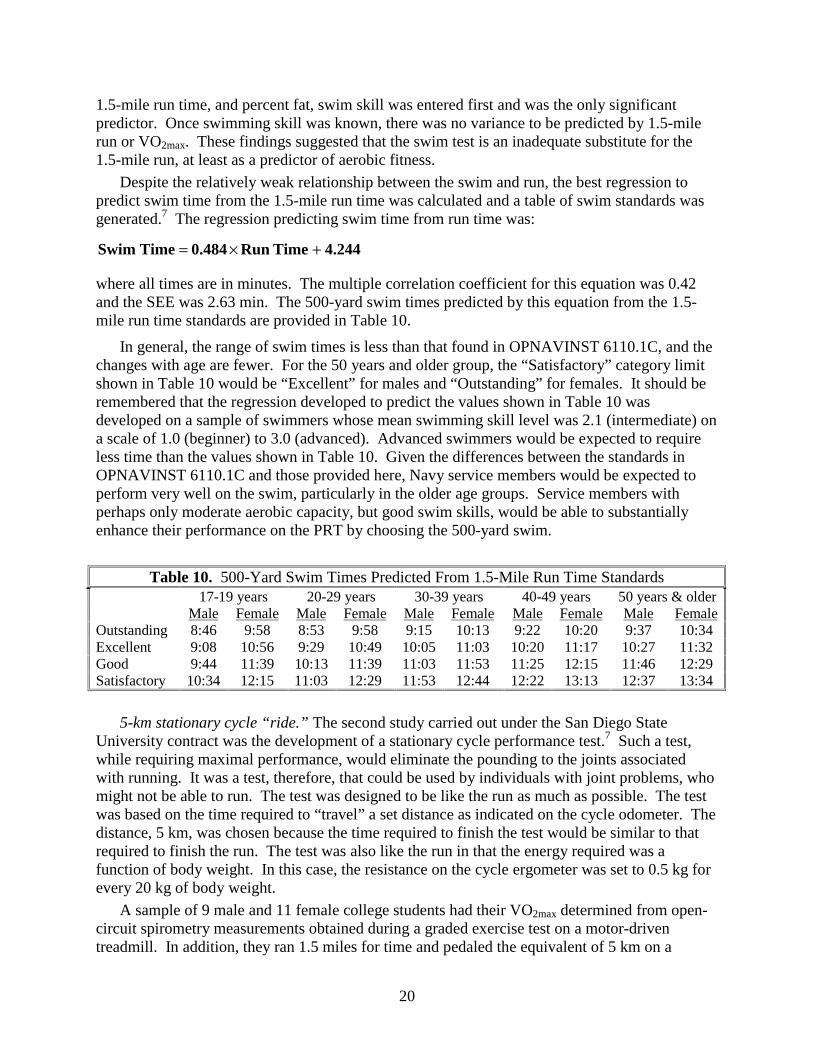
Despite the relatively weak relationship between the swim and run, the best regression topredict swim time from the 1.5-mile run time was calculated and a table of swim standards wasgenerated.7 The regression predicting swim time from run time was:
4.244Time Run 0.484Time Swim +×=
where all times are in minutes. The multiple correlation coefficient for this equation was 0.42and the SEE was 2.63 min. The 500-yard swim times predicted by this equation from the 1.5-mile run time standards are provided in Table 10.
In general, the range of swim times is less than that found in OPNAVINST 6110.1C, and thechanges with age are fewer. For the 50 years and older group, the “Satisfactory” category limitshown in Table 10 would be “Excellent” for males and “Outstanding” for females. It should beremembered that the regression developed to predict the values shown in Table 10 wasdeveloped on a sample of swimmers whose mean swimming skill level was 2.1 (intermediate) ona scale of 1.0 (beginner) to 3.0 (advanced). Advanced swimmers would be expected to requireless time than the values shown in Table 10. Given the differences between the standards inOPNAVINST 6110.1C and those provided here, Navy service members would be expected toperform very well on the swim, particularly in the older age groups. Service members withperhaps only moderate aerobic capacity, but good swim skills, would be able to substantiallyenhance their performance on the PRT by choosing the 500-yard swim.
Table 10. 500-Yard Swim Times Predicted From 1.5-Mile Run Time Standards17-19 years 20-29 years 30-39 years 40-49 years 50 years & older
Male Female Male Female Male Female Male Female Male FemaleOutstanding 8:46 9:58 8:53 9:58 9:15 10:13 9:22 10:20 9:37 10:34Excellent 9:08 10:56 9:29 10:49 10:05 11:03 10:20 11:17 10:27 11:32Good 9:44 11:39 10:13 11:39 11:03 11:53 11:25 12:15 11:46 12:29Satisfactory 10:34 12:15 11:03 12:29 11:53 12:44 12:22 13:13 12:37 13:34
5-km stationary cycle “ride.” The second study carried out under the San Diego StateUniversity contract was the development of a stationary cycle performance test.7 Such a test,while requiring maximal performance, would eliminate the pounding to the joints associatedwith running. It was a test, therefore, that could be used by individuals with joint problems, whomight not be able to run. The test was designed to be like the run as much as possible. The testwas based on the time required to “travel” a set distance as indicated on the cycle odometer. Thedistance, 5 km, was chosen because the time required to finish the test would be similar to thatrequired to finish the run. The test was also like the run in that the energy required was afunction of body weight. In this case, the resistance on the cycle ergometer was set to 0.5 kg forevery 20 kg of body weight.
A sample of 9 male and 11 female college students had their VO2max determined from open-circuit spirometry measurements obtained during a graded exercise test on a motor-driventreadmill. In addition, they ran 1.5 miles for time and pedaled the equivalent of 5 km on a

21
stationary cycle ergometer with a resistance of 0.5 kg for each 20 kg of body weight.Performance on the cycle test was strongly related to VO2max (R = -0.78), and to 1.5-mile runtime (R = 0.94). The investigator concluded that the cycle ergometer test was suitable for use bythe Navy, but that it needed to be validated on a sample of Navy personnel. A regressionequation was developed to predict 5-km cycle times from 1.5-mile run times. The best linearequation was:
37.6time Run0.76Time Cycle +×=
where all times are in seconds. The correlation coefficient for this relationship was 0.94 with aSEE of 54.8 s. Suggested performance standards for the 5-km cycle test are presented in Table11.
Table 11. 5-km Stationary Cycle Times Predicted From 1.5-Mile Run Time Standards17-19 years 20-29 years 30-39 years 40-49 years 50 years &
olderMale Female Male Female Male Female Male Female Male Female
Outstanding 7:28 9:22 7:40 9:22 8:14 9:45 8:25 9:56 8:48 10:19Excellent 8:02 10:53 8:37 10:42 9:34 11:05 9:56 11:28 10:08 11:50Good 8:59 12:01 9:45 12:01 11:05 12:25 11:39 12:59 12:13 13:22Satisfactory 10:19 12:59 11:05 13:22 12:25 13:44 13:10 14:30 13:33 15:04
Recruit Training and PRT Performance
In 1984, a study was carried out to examine the fitness of individuals entering and leavingNavy recruit training.30 Physical fitness measures were taken on 302 male and 393 femalerecruits upon entry into and at the completion of recruit training. In addition to the PRTmeasurements, triceps skinfold thickness was measured as well as maximum number of pull-upsfor the male recruits and flexed-arm hang time for the female recruits. In general, the studyconcluded that it was difficult to find normative civilian data against which to compare theincoming recruits. However, recruits entering training were less fit than Fleet sailors of the time,but at the end of recruit training, they had surpassed their fleet counterparts in PRT performance.This information was used by the CNO as part of the justification of work with the President’sCouncil on Physical Fitness and Sports on youth fitness.19
Job-Related Physical Readiness Standards
An investigation was undertaken in late 1986 to determine whether emergency shipboardtasks could be used as the basis for setting physical readiness standards for sea duty. NHRCinvestigators took part in basic firefighting and damage control training, and they interviewedsubject matter experts about the perceived demands of firefighting and damage controloperations. The conclusions from these investigations were that the demands associated withshipboard firefighting performed by most sailors were minimal due to the team nature of the task(shared workload) and the rotation among positions on the team while fighting fires. Thedemands placed on trained firefighting crews are greater and include heat tolerance. Withrespect to damage control, it again was concluded that the physical demands expected of mostsailors were minimal and that all trainees, regardless of age or sex, accomplished damage controltraining exercises. Because of these findings, the exploration of firefighting or damage controltasks as a basis for general shipboard fitness requirements was abandoned.
22
OPNAVINST 6110.1D (18 January 1990)
A new CNO Instruction was issued in January 1990.13 The Instruction was issued in responseto needs to define CFC qualifications, improve the risk factor screening, and improve individualrecordkeeping.
CFC Qualifications
To ensure the CFCs were appropriate role-models in their jobs as fitness and health advisors,the Instruction required that CFCs:
• are E-5 or above
• are CPR certified
• meet satisfactory PRT standards
• are not overfat or obese
• are not tobacco users
• are encouraged to obtain American College of Sports and Medicine (ACSM) certification
This last requirement was presented as a method of providing training for CFCs. Previously,NMPC had offered training courses for CFCs, directly or through contract efforts. Negotiationswith the ACSM to provide a certification for military exercise leaders were opened, but they fellthrough. Following the collapse of this effort, CFCs were encouraged to pursue the standardACSM Exercise Leader Certification, and a Command Fitness Coordinator Reference andTraining Manual (S/N 0500-LP-175-4200) was provided that contained the appropriate didacticmaterial to support the Exercise Leader Certification test.
Revised PRT Screening
The PRT screening was modified. A new form (OPNAV 6110.2) was created in the form ofa manila folder. The new form provided the opportunity to record results from 6 consecutivePRT screenings and/or administrations. The questions in the Risk Factor Questionnaire portionof the form were modified to ask whether there had been “significant change in” the risk factorsince the last periodic physical or PRT. In the previous Risk Factor Questionnaire, servicemembers were asked about the presence or absence of risk factors. Each “yes” answer required areferral to the medical department, despite the same risk factor having been evaluated andresolved during the previous PRT review. The assessment of change in status was enacted in anattempt to minimize unnecessary referrals to the medical department. In addition, the medicalreferral section of the form was expanded to include more than an obesity determination, and itoffered the option to waive specific items on the PRT as a result of existing medical conditions.Included in the Instruction was increased guidance concerning the criteria for a diagnosis ofobesity and assessment of cardiovascular risk.
PRT Standards
The PRT items, standards, and point values were unchanged from OPNAVINST 6110.1C.The basic conditioning program was also unchanged. The conditions necessary for andprocedures to be followed for PRT administration were spelled out in greater detail than in theprevious Instruction. Instructions for the 500-yard swim incorporated the change, previouslyenacted in a NAVADMIN, in which any stroke and style of turn was to be allowed during theswim.
23
Changes to PRP
In the 8 years following the release of OPNAVINST 6110.1D, several changes were made tothe PRP. These changes were promulgated through the use of NAVADMINs and NAVOPs.
On January 24, 1990, just 6 days after the release of OPNAVINST 6110.1D, NAVOP 009/90was released. The purpose of NAVOP 009/90 was to standardize the reporting of physicalreadiness information on FITREPs and EVALs, by including percent body fat and status onfitness testing into block 73.
In June 1990, 6 months after the promulgation of OPNAVINST 6110.1D, participation in thePRT by Navy service personnel 50 years of age and older was made optional by NAVOP064/90. These older service members were required to meet the body fat standards, andencouraged to “demonstrate leadership by example and live healthy and active lifestyles.”
This change was enacted out of concern following the occurrence of several sudden deathincidents associated with the PRT.
Two changes in the PRP that would have a profound effect on the number of Navypersonnel, who would be at risk for administrative action under the program, were enacted inApril 1993 through NAVADMIN 071/93. Under this NAVADMIN, the two-tiered structure forthe body composition standards was removed. In place of the two-tiered structure based on theoverfat and obesity ratings, a single standard of 22% fat for men and 30% fat for women wasimplemented. Those Navy personnel in the overfat category were now out of compliance with
Navy Enlisted Body Fat/Fitness Separations
0
500
1000
1500
2000
2500
Nu
mb
er o
fS
epar
atio
ns
90 91 92 93 94 95 96 97 98
Fiscal Year
Total Body FatSeparationsTotal FitnessSeparations
Policy changes:• Single body fat standard• 3 failures in 4 years
Figure 1. Changes in administrative separations associated with PRT policy changes. Figureadapted from Naval Personnel Command (NPC-601).
24
standards. In addition, this NAVADMIN redefined the criterion for administrative action withrespect to PRT failures. A service member who failed the PRT 3 times in a 4-year period wasprocessed for administrative separation. Specific administrative actions related to PRT failureswere also redefined. Figure 1 shows the changes in PRT failure rates associated with the releaseof this NAVADMIN. It is evident that the number of administrative separations due toexceeding the body fat standards more than doubled from 1993 to 1995. The number ofseparations due to exceeding body fat standards increased from an average of 982 personnel peryear during the period 1990 to 1993 to an average of 2,240 personnel per year for the period1995 to 1998. The number of separations due to PRT failures increased from 2.5 personnel peryear for 1990 to 1993 to 249 per year for 1995 to 1998. The minimum time required to fail thePRT 3 times is 1.5 years. Therefore, the impact of the policy change would be expected toappear no earlier than 1995, and the pattern seen in Figure 1 is consistent with the expectedtiming of changes resulting from the NAVADMIN.
Other NAVADMINs released in 1993 provided increased definition of the safetyrequirements for PRT administration. NAVADMIN 189/93 required that the physical exam becurrent, the risk factor screening completed 10 to 12 weeks prior to PRT administration,emergency medical care be available at the test site, 2 persons trained in CPR be on-site, and itprovided guidance for reporting injury or death associated with the PRT. NAVADMIN 190/93provided refinement of the administrative consequences of PRT failures. It is not thought thatthese changes had much impact on the pattern of PRT failure rates.
In 1994, other major program changes were enacted. NAVADMIN 148/94 called for COs tomake physical training a part of the weekly routine for all members. Participation in an aerobicexercise program was required at least 3 times each week, with exercise sessions to last at least30-40 min. Service members were excused from physical training for validated medical reasons,or if their military duties made exercise impossible. Individuals on limited duty were required toparticipate in physical exercise to the extent allowed by their physician. Commands wereencouraged to use Moral Welfare and Recreation facilities to implement their physical exerciseprograms.
This change in PRT policy was the result, in part, of a joint meeting of the BUMED,BUPERS, and Navy Safety Center personnel held in 1993. There was concern over the numberof reported injuries and deaths associated with the PRT. Reviews of the literature reported at thismeeting indicated that the risk of negative cardiovascular events was decreased overall for thosewho exercised regularly. It was the consensus of those attending this meeting that the best wayto minimize injuries and deaths during the PRT was to ensure that service members werephysically active. BUPERS adopted this viewpoint, which resulted in inclusion of duty time forexercise in the NAVADMIN.
NAVADMIN 148/94 also contained changes to the body fat measurement aspects of thePRP. Prior to this NAVADMIN, all Navy personnel had their body fat assessed bycircumference measurement. This was in keeping with the DoD Directive, which stated “Thedetermining factor in deciding whether a service member is overweight is the member’s percentof body fat.”4 Height to weight tables may be used by all military services as the first linescreening technique until validated body composition measurement techniques are in placeservicewide.” It is unclear whether BUPERS believed validated techniques were in placeservicewide, but there was some feeling within BUPERS that a great deal of time was beingspent on body fat assessment, and that time should be reduced. Additionally, all the otherservices were using weight-for-height screening tables as part of their body fat programs at this
25
time. The NAVADMIN called for the use of a weight-for-height table as an initial screen forbody fat assessment. The weight-for-height table is provided in Table 12. The weights are themaximum weights for height contained in the table in DoD Directive 1308.1.4 For each of theweights for height in Table 12, the equivalent percent body fat has been estimated from heightand weight using the equations developed by Hodgdon.27
Remembering that the Navy body fat standards were 22% fat for men and 30% fat forwomen, the weight-for-height values shown in Table 12 are fairly efficient as a screening tool.The weight values, on average, approximate the body fat standards. However, the percent fatvalues were not uniform across heights, and the derivation of the values for the table in the DoDDirective was not known.
NAVADMIN 148/94 also provided a waiver from the body fat standards. If a servicemember received his/her third failure in 4 years and that failure was due to exceeding the
Table 12. Weights for Height From NAVADMIN 148/94
Height(inches)
Males Maximum
Weight (pounds)
MalesEstimated
% Body Fat
FemalesMaximum
Weight (pounds)
FemalesEstimated
% Body Fat58 126 30.659 128 30.160 153 24.4 130 29.761 155 23.7 132 29.262 158 23.3 134 28.863 160 22.7 136 28.364 164 22.5 139 28.165 169 22.5 144 28.566 174 22.5 148 28.767 179 22.5 152 28.868 184 22.5 156 28.969 189 22.5 161 29.370 194 22.6 165 29.471 199 22.6 169 29.672 205 22.8 174 30.073 211 23.0 179 30.474 218 23.4 185 31.175 224 23.7 190 31.576 230 23.9 196 32.277 236 24.1 201 32.678 242 24.3 206 33.079 248 24.5 211 33.480 254 24.7 216 33.8
Mean 23.3 30.3
body fat standards, the service member could request a waiver from administrative separation ordenial of reenlistment if:
• the request was submitted within 30 days of the last failure,

26
• the member had passed the most recent PRT (unless medically waived),
• the service member was no more than 3% fat above standards, if male, or 4% fat abovestandards, if female, and
• the service member submitted a package including the last 3 EVALs (if E-5 or below)and a copy of OPNAV 6110.2.
In December 1994, NAVADMIN 229/94 allowed Navy personnel who exceeded the body fatstandards to apply for a “unique body structure” waiver. The intent was to provide relief fromthe body fat standards to those individuals whose body dimensions are such that they would bepredicted as being above standards when they, in fact, were not. To qualify for the waiver, aservice member must (a) show superior fitness by achieving an “Excellent” or “Outstanding” onthe PRT, (b) have strong medical documentation of excellent health and physical fitness and atruly unique body structure (as determined by the authorized medical department representative)that is not due to excess body fat, and (c) have no prior attendance in a military overeaterstreatment program.
DoD Directive 1308.1 (20 July 1995)
In July 1995, the Assistant SECDEF for Force Management Policy (FMP) reissued a DoDDirective with the subject DoD Physical Fitness and Body Fat program. Accompanying thisrelease was the release of DoD Instruction 1308.3, titled “Physical Fitness and Body FatPrograms,” which contained implementing Instructions for the policies provided in the Directive.Changes in policy contained in the Directive included an increase in the maximum percent bodyfat allowed by service standards to new values of 26% fat for men and 36% fat for women.Service members were to have their body fat content determined if they exceeded the maximumweight on a weight-for-height table provided in the accompanying DoD Instruction. Serviceswere still required to implement body composition programs that enhanced general health,physical fitness, and military appearance, and they were to focus on reduction in body fat ratherthan simple weight loss in the evaluation of the efficacy of their programs. All service memberswere required to have their physical fitness evaluated for the record at least annually. Servicemembers identified with medical limitations were to be placed in physical conditioning programsconsistent with their limitations, and they were still required to meet the body fat standards oftheir military department.
DoD Instruction 1308.3 (30 August 1995)
In late August 1995, the Instruction implementing the DoD Directive was issued. TheInstruction contained a weight-for-height table based on the Metropolitan Life Insurance Tablesof 1983. The table was labeled “Critical Weight Values From 1983 Metropolitan Life Insurance,120% of Midpoint of Medium Frame Value.” The table also contained adjustments to height andweight to account for shoes and clothing, respectively. The proposal to use the Metropolitan LifeInsurance tables as the basis for body fat screening grew out of a joint Army, Navy, and MarineCorps meeting of research and body fat policy representatives held at NMRDC in the summer of1994. Because the Metropolitan tables had been the basis for the Navy body fat standards, it wasfelt that until a more appropriate table could be developed, a table reflecting 120% of theMetropolitan tables values would be the best available. As it turned out, the table provided toDoD did not actually contain the midpoint values for the medium frame individual as intended,but rather was calculated from a table published by Andres.3 The weights in the DoD tablerepresent 120% of the midpoint weight (across all frame sizes) for each height in the 1983
27
Metropolitan tables, adjusted for added height from shoes and weight from clothing. Theseweights for height and their equivalent estimated body fat content values are provided in Table13.
Service members exceeding those weight-for-height values were required to have their bodyfat content determined using circumference-based predictive equations. In addition to newmaximum allowable values for body fat content, the Instruction also provided minimumallowable standards for percent body fat. Services were not allowed to set percent fat standardsthat were less than these allowable standards. The minimum allowable standards were 18% formen, and 26% for women. This allowed a range of standards that encompassed the existingstandards of each of the Services at the time of the implementation of the Instruction.
Table 13. Weights for Height From DoD Instruction 1308.3
Height(inches)
Males Maximum
Weight (pounds)
MalesEstimated
% Body Fat
FemalesMaximum
Weight (pounds)
FemalesEstimated
% Body Fat58 139 34.459 141 33.960 144 33.761 161 25.0 147 33.662 164 24.6 151 33.763 167 24.2 155 33.864 170 23.8 160 34.265 174 23.6 164 34.366 178 23.4 168 34.567 181 22.9 172 34.668 185 22.7 176 34.769 188 22.3 179 34.570 192 22.1 183 34.671 196 21.9 187 34.872 200 21.773 205 21.774 210 21.775 215 21.8
Mean value: 22.9 34.2
The Instruction contained some confusing elements, which generated later GeneralAccounting Office (GAO) criticism of DoD policy implementation. The stated policy was that“Service members possess the cardiorespiratory endurance, muscular strength and endurance,and whole body flexibility to successfully perform in accordance with a military service-specificmission and military specialty” (para D), and that “Cardiorespiratory endurance, muscularstrength, balance and agility, and explosive power, together with desirable body composition,form the basis of the DoD Physical Fitness and Body Fat Program” (para D). Yet the serviceswere to emphasize “...programs that develop and maintain general health and physical fitness,”and were only required to “develop and utilize physical fitness tests (PFTs) that evaluatecardiovascular and muscular endurance” (para F.1.c.1).

28
Also, the instruction states that, “Whatever new requirements that the military Servicesestablish, there must be a 8 to 10 percent difference between male and female standards.” Thenin the sentence immediately following, it states, “Military Services shall not derive, extrapolateor adjust female standards using data from male subject or vice versa.” And, it is later stated,“The standards for one gender shall not be extrapolated from the other gender’s standard or bederived from the data base of the other gender.” Contradictory statements such as these wereconfusing to the Services as well as to GAO.
Navy Program Changes
Following the release of the DoD Directive and Instruction, another NAVADMIN was issued(NAVADMIN 315/95, December 1995). This NAVADMIN replaced the weight-for-heighttable from 1994 with that contained in the DoD Instruction (Table 13). As mentioned, thisparticular formulation of the Metropolitan Life tables did not exactly match that used byHodgdon in the body fat standards development.27 As a result, the average percent fatequivalents represented by the weights were not exactly equal to the values of 22% for men and33% for women suggested by Hodgdon to be the body fat standards (Table 13).
At the time of the introduction of this screening table, a concerted effort was made toconvince the OCNO that the body fat standards should represent a parallel development for bothsexes. Under that argument, either the women’s body fat limit should have been raised to 33%fat, or the male standard should have been lowered to about 20% to provide the same percentageadjustment of the Metropolitan tables, or, alternatively, the same percentile of the weightdistributions for the American population.36 These arguments were not accepted, and this table,which was a much more lenient screening tool for women than for men, was promulgated.
Other administrative actions taken following the release of the DoD Instruction included theannouncement of the release of a new Nutrition and Weight Control Self-Study Guide, NavyPersonnel (NAVPERS) 15602A (NAVADMIN 282/86), the elimination of the waiver fromadministrative separation due to excess body fat (NAVADMIN 282/97), and the announcementof the imminent release of a new OPNAVINST 6110 (NAVADMIN 039/98, March 1998).
Research and Development
In the period following the release of OPNAVINST 6110.1D, a study was conducted toexplore the use of a new criterion measure for body composition evaluation. The body fatestimation equations in use by all of the services used a determination of body fat content fromtwo-compartment analysis of body density determined from underwater weighing. In the two-compartment analysis, the body is treated as being composed of two parts, the fat mass and thefat-free mass. The densities of each of the masses are assumed to be constant for all individuals.The body density may be apportioned between the body compartments according to thefollowing formula:
22
11
body densityf
densityf
density1 +=
where densitybody is the total body density, f1 and f2 are the fractions represented bycompartments 1 and 2, respectively, and density1 and density2 are the densities for compartments1 and 2, respectively. Since there are only two compartments, f2 = 1-f1, and this relationship canbe substituted in the above equation to yield an equation that can be solved for the f1. If f1 is thefraction of fat in the body and the density of the fat compartment (density1) is taken to be 0.9,
29
and the density of the fat-free compartment (density2) is taken to be 1.1, the solution is the Siriequation provided earlier in this report. A difficulty with this approach is that the assumptionsare not met. While it appears that the density of the fat compartment is relatively constant acrossindividuals, the density of the fat-free compartment is not. The major sources of variation in thefat-free compartment density are variations in bone mineral density and variations in total bodywater content. The current best estimates of body fat content are those based on an analysis ofbody composition that involves measurement of the bone density and total body water. Such ananalysis is referred to as a “four-compartment” analysis because the body density is allocated tofour compartments: the fat compartment, the bone compartment, the water compartment, and theresidual compartment.
Potential political difficulties are associated with the use of a two-compartment analysis asthe criterion for body fat content measurement. There is a systematic difference in bone densitybetween blacks and whites (other ethnic groups appear to fall in between average values forblacks and whites). On average, blacks have greater bone densities than whites. The result isthat for a body fat equation developed on a sample of whites, the body fat content of blacks willbe overestimated by about 1.5% body fat (because for the same anthropometry, blacks will beactually be less fat, on average, as a result of their greater bone density). If an equation is usedthat was developed on an ethnically balanced population sample, blacks will be overestimated byabout 0.75% fat and whites underestimated by the same amount.
Because of these potential difficulties, NHRC, at the request of BUPERS, undertook a studyto predict body composition from circumferences using a four-compartment analysis as thecriterion measure. The sample for this study was balanced by gender and ethnicity: 166 male (84white, 82 black) and 161 female (82 white, 79 black) Navy and Marine Corps active-dutypersonnel in the San Diego area. Results of the analysis of the data collected in this study were:
(a) the systematic ethnic bias in percent fat estimation was found to be entirely due to theuse of the two-compartment analysis as the criterion. The prediction of body fat fromanthropometry does not contain ethnic differences in prediction. Ethnic differencesemerge only when the results of prediction are compared with the two-compartmentbody fat measurement.
(b) the measures currently in use by the Navy work as well as most other combinations ofcircumferences to predict body fat content from a four-compartment analysis.
The following equations were developed for the prediction of four-compartment fat from themeasures currently in use by the Navy:
12.76 (height)Log 62.56 - circ.) neck circ. (adomen Log 85.79 fat % 1010 +×−×=
for men, where all measurements are in centimeters. The multiple correlation coefficient for thisequation was 0.91 and the SEM was 2.75% fat. The equation developed for women was:
46.65-(height)Log 97.93- circ.) neck- circ. hip circ.(waist Log 135.10 fat % 1010 ×+×=
where, again, the measurements are all in centimeters. The multiple correlation coefficient forthis equation was 0.87, and the SEM was 3.00% fat.
Tables similar to those included in the OPNAVINSTs were developed, and the results of thisstudy were briefed to the Physical Readiness Division in the BUPERS (PERS-601). There
30
followed extensive conversations with the Master Chief Petty Officer of the Navy and the Chiefof Naval Personnel, each of whom believed that the current body fat standards were already tooliberal. As a result, PERS-601 expressed reservations with the new equations because there wereindividuals whose estimated body fat content would increase by 3% fat or more. The decisionwas made to continue with the current Navy equations. However, there was interest in theapproach of using equations validated against a four-compartment analysis by the Marine Corpsand the Air Force. The Marine Corps adopted the equations for use in its Marine Corps Order6100.10B (1 October 1997),17 which funded a study to validate the equation on Marine Corpspersonnel. The Air Force also provided funding for a validation of the equation on an extendedsample balanced by gender and black/white ethnicity. Those studies have concluded, and thefinal report is being written.
OPNAVINST 6110.1E (23 March 1998)
OPNAVINST 6110.1E was signed out on 23 March 1998, to become effective on 1September 1998. The Instruction was issued to implement some changes in the program.Training for CFCs was made mandatory. The weight-for-height screening table and upper limitfor women’s body fat were revised. Minor changes were made to the 1.5-mile run standards forwomen. New Instructions were issued for the push-up and curl-up events. Changes were madeto the sit-reach event, and an exercise requirement for pregnant sailors was issued.
Qualifications of CFCs were unchanged from the previous Instruction. However, instead ofbeing encouraged to seek ACSM certification, all CFCs were now required to attend BUPERS-approved training and receive a CFC certification from that training. Additionally, commandswere encouraged to appoint departmental and divisional CFC assistants, as needed. Theassistants were encouraged to receive the BUPERS-approved training whenever possible.
A new weight-for-height table was provided in OPNAVINST 6110.1E to serve as the initialbody fat screen. This table was developed using Hodgdon’s equation for estimation of body fatcontent from weight and height.27 Weights were calculated for each height that were equivalentto 22% fat for men and 33% fat for women. The previous standard of 22% fat for men wasretained, but the standard for women was changed to 33% so that it was equivalent to thestandard for men in terms of its derivation.
At the request of the Chief, NAVPERS, the standards for the 1.5-mile run were investigated.The CNO had expressed concern at the difference between the run times required of youngwomen and those of young men. He was of the opinion that gender difference should not be asgreat as it was for the “Excellent,” “Good,” and “Satisfactory” categories for the two youngestage groups. Although the CNO’s concerns were specific to graduation requirements for RecruitTraining (at Recruit Training, Great Lakes, the “Good” category of the Navy’s PRT standardsare used as their graduation requirement), PERS-601 was directed to make changes to the PRTinstruction to address the CNOs concern. Table 14 shows the difference in run times betweenmen and women in the standards provided in OPNAVINST 6110.1D. The differences shown arethe times for women minus the times for men and are expressed in minutes. NHRC undertookan analysis of the run times to determine whether there might be a basis for decreasing thedifference between male and female run times.
The approach taken was to express the run times as VO2max equivalents, using a formuladeveloped by Beckett and Hodgdon.5 The women’s VO2max equivalents for each PRTclassification and age group were expressed as a fraction of the male value for the equivalentclassification and age group. Values were found to vary between 73% and 87% of the male
31
values. The mean percentage for all age and classification groups was 82% (standard deviation =4.7% of male VO2max). A decision was made to standardize the women’s times at 82% ofequivalent male VO2max. The equivalent times are shown in Table 15. All times are roundeddown to the nearest 0.25 min (15 s), as was done in the development of the OPNAVINSTstandards. Differences between these times and those that were contained in OPNAVINST6110.1D are shown in Table 16.
Table 14. Difference in Run Times Between Men and Women in OPNAVINST 6110.1DAge Group: 17–19 years 20–29 years 30–39 years 40–49 years 50 years &
olderClassification
Outstanding 2.50 2.25 2.00 2.00 2.00Excellent 3.50 3.00 2.00 2.00 2.25
Good 4.00 3.00 1.75 1.75 1.50Satisfactory 3.50 3.00 1.75 1.75 2.00
Table 15. 1.5-Mile Run Times Equivalent to 82% of Male VO2max (min)
Age Group: 17–19 years 20–29 years 30–39 years40–49years
50 years &older
ClassificationOutstanding 12.00 12.25 12.75 13.00 13.25
Excellent 12.50 13.25 14.25 14.50 14.75Good 13.50 14.50 15.75 16.50 17.00
Satisfactory 15.00 15.75 17.25 18.00 18.50
The values in Table 16 show that this procedure reduced the differences in the 6 times thatwere of particular concern to the CNO. However, applying the 82% formula to all the women’srun times meant that approximately one half of the times needed to be increased. Because thiswas a period during which CNO (and MCPON) desired to tighten rather than relax physicalreadiness standards, the Physical Readiness Program office (PERS-601) was reluctant to allowslower performances on the run. PERS-601 recommended to CNO that the times for the lastthree categories of the youngest two age groups be adjusted downward by the amounts shown inTable 16 in bold. Other times were not changed from the values they had in OPNAVINST6110.1D. NHRC and PERS-601 recognized that the method of deriving these changes was atvariance with the DoD Instruction 1308.1. Institution of these changes and the method of theirderivation were cause for comment by GAO in their review of the Service’s physical fitnessstandards.26
Minor changes to the Instructions for the curl-up and push-up were promulgated with thisInstruction. During curl-ups, the buttocks are to remain in contact with the deck during the entiretest and elbows are to touch the “upper thigh” (meaning while in the curl-up position, the part ofthe thigh between the knee and halfway between the knee and hip crease). During push-ups,members are to touch the “lower edge of the shoulder blade” to the deck. The Instructions forthe sit-reach were modified to clarify the fact that three tries to reach the toes are allowed, andthat the service member need only reach his/her toes on one of those tries. A failure of the sit-reach would no longer constitute a failure of the entire PRT cycle. Service members who cannot
32
reach their toes are enrolled in the command-directed Physical Conditioning program. This wasdone, again at the suggestion of the Fleet. Although it was reported that large numbers of Sailorsweren’t flexible enough to touch their toes, very few commands perceived it as “serious enough”to constitute a failure of the entire PRT, so that section of the test was essentially being reportedas “passed,” irrespective of actual performance. If failing the sit-reach was not a PRT failure,but only required remedial attention, then it would be more likely that the problem would beaddressed and remedied--the intended goal of the PRT. Finally, language was added to theInstruction clarifying situations in which the service member might not take the PRT (e.g.,member on travel or newly on board a command, member attending a service school of less than10 weeks’ duration) without prejudice toward the service member.
Table 16. Differences Between 82% VO2max Run Times and 6110.1D Standards (min)
Age Group: 17–19 years 20–29 years 30–39 years40–49years
50 years &older
ClassificationOutstanding 0.50 0.75 0.75 0.75 0.50
Excellent -0.75 -0.25 0.50 0.25 0.00Good -1.50 -0.50 0.25 0.25 0.25
Satisfactory -1.25 -1.00 0.00 -0.25 -0.50
At the time of the release of OPNAVINST 6110.1E, two other efforts were coming to a closethat have important implications for the next physical readiness Instruction. The Institute ofMedicine concluded its studies of the relationships of body composition, nutrition and health tothe readiness of military women, and the GAO concluded its study of gender issues with respectto the validity and equity of fitness standards among the armed services.
Institute of Medicine Report
In 1994, as part of the Defense Women’s Health Research Program, the Committee onMilitary Nutrition Research (CMNR) of the Food and Nutrition Board of the Institute ofMedicine within the National Academy of Sciences was asked to review existing militarypolicies governing body composition and fitness, postpartum return-to-duty standards, MilitaryRecommended Dietary Allowances, and physical activity and nutritional practices of militarywomen to determine their impact on the health, fitness, and readiness of women. Particularinterest was focused on whether the body composition and appearance standards for womenwere in conflict with body composition requirements for military task performance, or if theymight interfere with readiness by encouraging chronic dieting and/or inadequate nutrition intake.A subcommittee of CMNR was formed to look into these issues. The subcommittee wasdesignated the Committee on Body Composition, Nutrition, and Health of Military Women(BCNH) and held several focus meetings and workshops. In 1998, the BCNH released its finalreport.34
BCNH noted that the services differ in their weight-for-height screening tables for bodycomposition assessment, as well as in the methodologies used for body fat content assessmentand the body fat standards for female personnel. They also noted that none of the service’s bodyfat equations had been validated on postpartum women. They found evidence that chronicdieting or crash dieting to meet weight or body fat standards may compromise women’s
33
nutritional status or fitness levels. Based on a review of available literature, they concluded thatthe healthy range of weights for women and men were those representing BMI (weight-for-height expressed in kg⋅m-2) values between 19 and 25.45
To meet the goals of preserving adequate military readiness, and maintaining a healthy bodyfat content level, BCNH recommended a two-tiered approach to setting body fat standards. Thefirst tier would be the measurement of BMI and performance of the services’ PFT. If the BMIfell between 19 and 25 (irrespective of age) and the service member passed the fitness test, themember would be considered ready for duty. Service members with BMI values less than 19 arereferred for nutritional counseling and physical conditioning. Service members whose BMIvalues exceeded 25 would be referred for a body fat content assessment. Those so referred whowere found to have body fat content values of 36% of weight or less and who passed the PFTwould be considered ready for duty. Those with greater body fat percentages would be referredfor weight management and/or physical conditioning programs. The BCNH also recommendedthe development of a single servicewide equation for the assessment of body fat content. Theyrecommended that this equation be circumference based and validated against a four-compartment analysis of body composition.
In the area of physical fitness, BCNH recommended increasing emphasis on general fitnessfor health and readiness by enforcing regular participation in a fitness program based on ACSMrecommendations (3 days⋅week-1, of endurance exercise at 60% to 80% of maximum capacityfor 20 to 60 min and 2 days⋅week-1 of resistance training using all of the major muscle groups at85% of one repetition maximum).2 The committee further recommended that task-specific,gender-neutral strength and endurance tests and standards be developed for use in selection andretention in jobs that require moderate to heavy lifting. Specialized training programs shouldalso be developed to maintain proficiency for such high-demand jobs. BCNH also determinedthat the current appearance standard did not appear to be linked to performance fitness, nutrition,or health. They recommended development of an objective method of assessing militaryappearance, if the services deemed such an appraisal necessary.
GAO Report (November 1998)
In November 1998, just 2 months after OPNAVINST 6110.1E became effective, the GAOcompleted a study of gender issues related to the validity and equity of fitness standards andpublished its final report.26 This report was critical of DoD procedures in administration of itsPhysical Fitness and Body Fat Program, and of the services in their implementation of DoDpolicy. The authors of the report found the DoD policy confusing because there were severaldifferent goals for the program (general health and fitness, job readiness, and militaryappearance), accompanied by no guidance as to relative importance of or approaches to meetthese goals. They also noted that conflicting statements in the DoD guidance contributed toconfusion about DoD objectives. GAO also found DoD oversight of the physical fitnessprogram to be inadequate.
The GAO authors found a lack of uniformity in the tests used by the services to measurephysical fitness, in the level of difficulty represented by standards among the services, and in thedegree of adjustment made in fitness standards for gender and age. In addition, the lack of aconsistent methodology for screening by weight-for-height and the measurement of body fat andthe lack of agreement on standards for body fat content were highlighted. The latter point was anissue since all of the services maintained that their body fat standards were based on health.

34
GAO also noted that the services’ body composition equations were based on an outmodedcriterion measure.
The Navy was criticized because it did not test service members 50 years of age and older,despite a clear requirement from DoD to do so. It was also criticized for the way that it madeadjustments to the run-time standards for women. A single, rational method was not employed.
The GAO recommendations were that the SECDEF revise the DoD physical fitnessregulations to:
• clearly state that the objective of the military physical fitness program is to enhancegeneral fitness and health, and not to address the capability to perform specific jobs ormissions;
• establish a clear DoD-wide policy for age- and gender-based adjustments to fitness andbody fat standards, requiring all services to derive them scientifically, clearly documentthe basis used, and submit exceptions for approval;
• establish a DoD-wide approach, based on current scientific research, for estimating bodyfat percentages;
• establish a mechanism for providing policy and research coordination of the militaryservices’ physical fitness and body fat programs; and
• define the statistical information needed to monitor fitness trends and ensure programeffectiveness, and require that this information be maintained by all services andprovided in the currently required annual reports.
GAO also recommended that the SECDEF take steps to ensure that the services implementthe existing requirements that:
• personnel be tested in all three areas cited in the regulation – cardiovascular endurance,muscular strength and endurance, and body composition; and
• all service members, regardless of age, be tested for physical fitness.
The GAO report was circulated in draft form to each of the services as well as to theSECDEF. The services and DoD (through the SECDEF) concurred with the findings of thereport and indicated that the recommendations would be adopted.
Continuing Efforts
Research and Development
Because of the desire on the part of the CNO to increase standards of performance on thePRT, PERS-601 tasked NHRC to collect a large sample of PRT performance data from Navycommands and to evaluate the need for new standards based on the distributions of scores on thePRT and its test items. In April 1998, a message was sent out to all Navy commands directingthem to forward their PRT and body fat data from their most recent PRT to NHRC(NAVADMIN 078/98). (In July 1998, BUPERS moved operations from Washington, DC toMillington TN. Soon after that, the name was changed to Navy Personnel Command [NPC], and“PERS-codes” became “NPC-codes”).
The NHRC received PRT results from approximately 1,775 Navy commands, containingPRT item scores for tests conducted in late 1997 and early 1998 on approximately 220,000 Navymilitary personnel. Even now, not all of these records have been entered into the NHRC PRT

35
database. Analysis was carried out on a subset of 98,954 records, representing 709 commandsthat were entered into the data set as of January 1999. Records that were complete and validPRT data and included only those personnel 49 years of age or less were selected for analysis.Those 50 years of age and older were excluded from the analysis because such personnelvoluntarily elect to take the PRT and may not be representative of the total Navy population inthis age group. The final data set totaled 73,595 personnel, 65,307 men and 8,288 women.These records were used to generate performance percentiles for each readiness test item foreach age by gender group. Provisional standards were suggested based on use of the 90th
percentile as the lower limit of “Outstanding” (except for the run and swim, where the 95th
percentile was used), the 75th percentile range as the lower limit for “Excellent,” the 25th
percentile as the lower limit of “Good,” and the 10th percentile as the lower limit of“Satisfactory.” The percentile values selected for the provisional standards did not match thoseselected for the generation of standards for OPNAVINST 6110.1C because the documentation ofthe procedures for generation of the previous standards had not been located when theprovisional standards were developed.
Because there were extant PRT standards, personnel would perform to match “meaningful”limits (e.g., the achievement of a particular classification cut-off, or achievement of an even 5 or10 push-ups or curl-ups). The result was that distributions of PRT-item performances wereabnormal, often skewed, and/or truncated. In situations where the distributions were extremelyabnormal, “adjusted” distributions based on the assumption of symmetry about the median werecreated using the percentile values less than the median to estimate their counterparts above themedian. Standards for personnel 50 years of age and older were estimated from trend linesconstructed through equivalent percentiles from the distributions observed in the younger agegroups. Point scales for each event were developed in the following fashion: A performancevalue 10% greater than the greatest value encountered for the lower limit of “Outstanding”among all age/gender groups was assigned a value of 100 points. The least value encounteredfor “Satisfactory” among all age/gender groups was assigned a value of 20 points. Linear pointscales using these two anchor points were then developed. The findings from the analysis ofthese data were provided to Commander, NPC-60 by letter report.21
In 1997, it was recognized in PERS-601 that the data that the physical readiness Instructionrequired to be provided to BUPERS was inadequate to evaluate the PRP. There was poorcompliance with the requirement to provide data, and the data that were requested were notdetailed or comprehensive enough to allow the state of readiness in the Navy to be determined,let alone assess trends in readiness. Discussions began with NHRC to develop a centralizeddatabase of Navy PRT data. As a first step in this process, NHRC was tasked late in FY98 todevelop PRT information management software that could be used at the command level torecord and maintain PRP information.
Software was developed jointly by NHRC and the Space and Naval Warfare Systems Center.The software was developed using Microsoft ACCESS. The software allows entry of all PRTscreening information (including both medical and nonmedical waivers), height, weight, andcircumference information (if needed), as well as PRT scores. The program calculates body fat(if appropriate), scores and classifications for the PRT items and for the test overall. Theinformation is stored as an ACCESS database, and it can be used to generate a variety of reports.The software has provisions to export and import records for personnel to allow transfer betweencommands as personnel move. The software was delivered to NMPC-60 in April 1999.
36
However, by this time, NMPC-60 was already planning the release of a new physical readinessInstruction, and the software was not distributed.
A project is underway currently at NHRC to build a prototype PRT database using the dataprovided as part of the PRT survey research, and to begin to build the design specifications forthe database to support the information queries needed by NPC and fleet users.
Other efforts completed during this period included a BUMED-funded study of relationshipsbetween physical job demands and on-the-job injuries. Vickers and Hervig showed that theprevalence of lower back and musculoskeletal injuries increase with the value of rating ofphysical job demands.46,47 One implication of this work is that reduction of injuries in highphysical job demands may require increased strength levels for those working in such jobs.
Draft DoD Instruction 1308.3
The Assistant SECDEF for FMP is currently drafting a new DoD Instruction 1308.3 coveringDoD Physical Fitness and Body Fat Program procedures. This effort had begun prior to therelease of either the Institute of Medicine or GAO reports, but it was drafted with full knowledgeof the ongoing studies that led to those reports. In its current form, it addresses most of the GAOrecommendations.
Physical fitness. As policy, the draft Instruction states “Aerobic capacity, muscular strengthand muscular power, together with desirable body fat percentage, form the basis of the DoDPhysical Fitness and Body Fat Program.” This wording represents a change from previouswording that tended to combine muscular strength and muscular power as a single ability, andthat also included flexibility, balance, agility, and explosive power as abilities to be developedunder the physical fitness program. The draft directs the military services to “design physicalfitness training and related physical activities that enhance both general health and physicalfitness which, in turn, promotes combat readiness…” The services are also directed to “extendtheir physical fitness programs to incorporate occupational-specific physical fitness requirementsfor those career fields where it is deemed necessary to ensure adequate performance and safety.”Services are also required to incorporate a health promotion program and cardiac risk-factorscreening within their fitness programs. All service members, regardless of age, are to be testedfor physical fitness, and service members may be authorized to use duty time for physical fitnesstraining.
In response to the GAO recommendation, the military services will be required to establishan automated data repository. This repository is to provide initial or baseline statistics and atracking mechanism that monitors physical fitness and body weight/body fat results by age,gender, rank, and military occupational specialty, including remedial actions taken andinformation on discharges resulting from physical fitness and/or body fat failures.
Body fat. The draft Instruction calls for use of body fat content as a percent of body weight asthe determining factor in deciding whether a service member is overfat. Body fat content is to bedetermined by a circumference-based measurement method. The services are to screen membersinitially using a weight-for-height screening table. That table is not to be more stringent than thenational recommendations for healthy weights (i.e., BMI values ≥ 19 and ≤ 25). Gender-appropriate body fat limits are to be used. These limits will not be more stringent than 20% formen and 30% for women.
These upper limits represent a departure from the procedures discussed in the meetings thatwere held to draft body fat policy. In those meetings, a set of standards based on the approachpresented in the Institute of Medicine report were proposed by the ad hoc research working
37
group.33 Men with body fat content values less than 20% body weight and women with valuesless than 30% body weight would be considered within standards. Men with values greater than20% fat, but less than or equal to 26% fat would be in a “cautionary zone,” and acceptability oftheir body fat content would depend on performance on the service’s PFT. For women, thecautionary zone would be 30% to 36% fat.
The DoD has adopted a slight reformulation of the current Navy/Air Force equation as themethod to be used in body fat estimation. The equations developed for the Navy wereformulated to predict body density. The Siri equation was used to convert estimated bodydensity to percent body fat. These equations have been reformulated to predict percent fatdirectly. The equations are:
Males:% body fat = 86.010 X Log10(abdomen circ. – neck circ.) - 70.041 X Log10(height) + 36.76(N = 594, R = 0.903, SEE = 3.52 % fat)
Females:% body fat = 163.205 X Log10(waist circ. + hip circ. – neck circ.) - 97.684 X Log10(height) -
78.387(N = 202, R = 0.856, SEE = 3.61 % fat)
where all of the measurements are in inches. The Instruction provides lookup tables for percentfat as a function of height and the sum of circumferences. These tables are virtually identical tothose in use by the Navy and Air Force today. The process leading to the adoption of thisequation is reported in Hodgdon and Friedl.33
Joint Service Working Group. The draft Instruction calls for the creation of a Joint ServiceWorking Group (JSWG) to “provide policy and research coordination among DoD components,military services, and health agencies and organizations.” The specific duties of the JSWGinclude coordination of biomedical research findings into policy recommendations for themilitary services’ physical fitness and body fat programs. Membership on the JSWG willinclude key DoD and military services researchers. The membership will be expanded to includerepresentatives of outside fitness schools/centers and other institutions and academia, as neededfor specific tasks. This working group is similar in composition and tasking to the DoD CPF thatwas created in 1981, after the issuance of DoD Directive 1308.1 of that year. That committeewas not mandated by Instruction, and it stopped meeting after 3 years or so.
Navy Activities
At this time, the Navy is reviewing its policy with respect to physical readiness. A newOPNAVINST 6110 is being drafted. As part of drafting this new Instruction, it appears a greatdeal of thought is being directed toward the basis for and implementation of physical readinessstandards. The Navy does not yet know the final form of the DoD guidance and the implicationsthey may have for Navy policy (although, based on the current DoD draft, the only major changein current policy that would be required is the testing of all personnel, irrespective of age). Untilthe issues surrounding physical readiness policy are resolved, a moratorium on separations fromthe Navy due to consecutive PRT or body fat failures has been enacted (NAVADMIN 012/99).
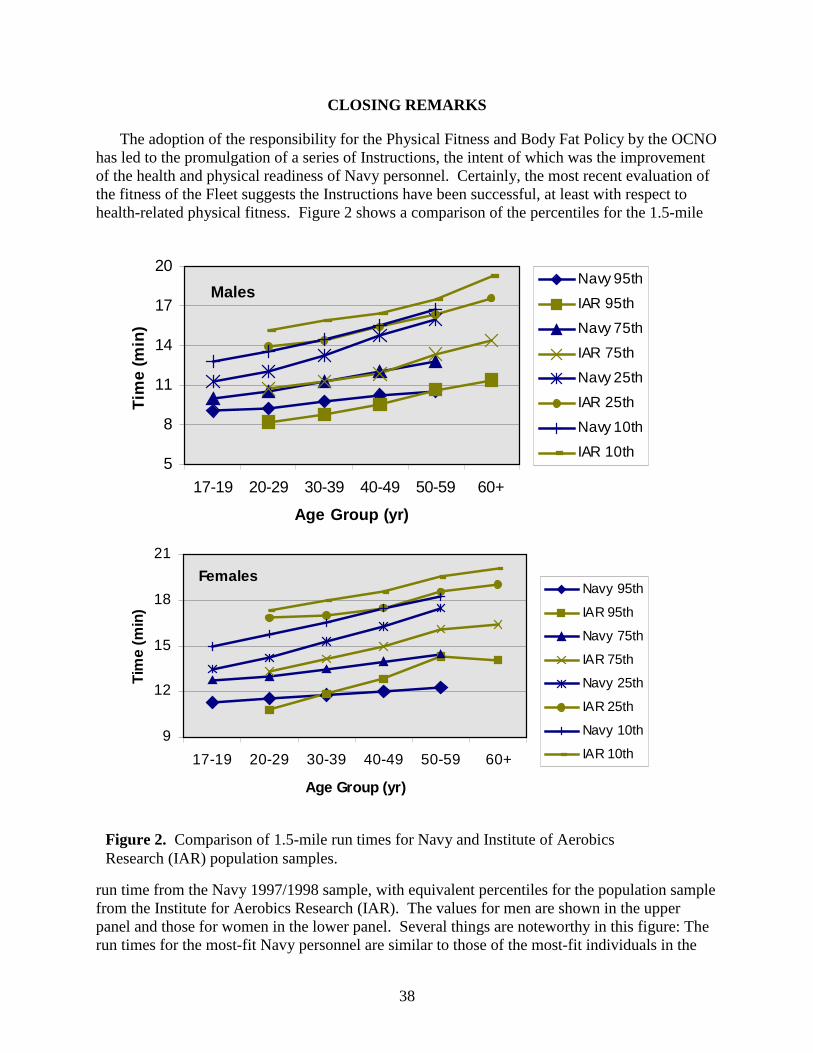
38
CLOSING REMARKS
The adoption of the responsibility for the Physical Fitness and Body Fat Policy by the OCNOhas led to the promulgation of a series of Instructions, the intent of which was the improvementof the health and physical readiness of Navy personnel. Certainly, the most recent evaluation ofthe fitness of the Fleet suggests the Instructions have been successful, at least with respect tohealth-related physical fitness. Figure 2 shows a comparison of the percentiles for the 1.5-mile
run time from the Navy 1997/1998 sample, with equivalent percentiles for the population samplefrom the Institute for Aerobics Research (IAR). The values for men are shown in the upperpanel and those for women in the lower panel. Several things are noteworthy in this figure: Therun times for the most-fit Navy personnel are similar to those of the most-fit individuals in the
9
12
15
18
21
17-19 20-29 30-39 40-49 50-59 60+
Age Group (yr)
Tim
e (m
in)
Navy 95th
IAR 95th
Navy 75th
IAR 75th
Navy 25th
IAR 25th
Navy 10th
IAR 10th
Females
5
8
11
14
17
20
17-19 20-29 30-39 40-49 50-59 60+
Age Group (yr)
Tim
e (m
in)
Navy 95th
IAR 95th
Navy 75th
IAR 75th
Navy 25th
IAR 25th
Navy 10th
IAR 10th
Figure 2. Comparison of 1.5-mile run times for Navy and Institute of AerobicsResearch (IAR) population samples.
Males
39
IAR sample. The run times for the less-fit individuals in the Navy sample are less than theircounterparts in the IAR sample. There is a suggestion that the rate of increase in run time withage is less for the most-fit Navy personnel (the 95th and 75th percentiles) than it is for the most-fitindividuals in the IAR sample. Similar analyses are not possible for the other PRT items.
It is recognized that the IAR sample is not representative of the U.S. population. This sampledoes represent an extensively studied segment of that population, a segment that has been used togenerate fitness recommendations for the nation,2 and a segment that is more likely to be madeup of affluent, more healthy, individuals than of poorer, less healthy ones. The 1.5-mile run timeis an indicator of aerobic fitness. Aerobic fitness has been shown to be related to long-termhealth. The results shown in Figure 2 suggest that the existence of a physical conditioning andtesting program by the Navy is helping to maintain greater levels of health-related fitness thanwould be expected in the U.S. population. This positive aspect of the program is expected tocontinue or be enhanced with subsequent Instructions in this series.
40
REFERENCES
1. American Alliance for Health, Physical Education, and Recreation and Dance (1976).AAHPERD Youth Fitness Test. Washington, DC: AAHPER.
2. American College of Sports Medicine (1990). ACSM position stand. The recommendedquantity and quality of exercise for developing and maintaining cardiorespiratory andmuscular fitness in healthy adults. Medicine and Science in Sports and Exercise, 22, 265-274.
3. Andres, R. (1985). Mortality and obesity: the rationale for age-specific height-weight tables.In R. Andres, E.L. Bierman, & W.R. Hazzard (Eds.), Principles of Geriatric Medicine (pp.311-318) New York, NY: McGraw-Hill.
4. Assistance Secretary of Defense (Manpower, Reserve Affairs & Logistics) (1981). PhysicalFitness and Weight Control Programs. Department of Defense Directive 1308.1.Washington, DC: Department of Defense. 29 June.
5. Beckett, M.B., & Hodgdon, J.A. (1987). Effect of gender and % body fat on prediction ofVO2max from running performance. Medicine and Science in Sports and Exercise, 19(2),S28.
6. Behnke, A.R., & Wilmore, J.H. (1974). Evaluation and Regulation of Body Build andComposition. Englewood Cliffs, NJ. Prentice-Hall, Inc.
7. Buono, M.J. (1987). Validity of the 500 yard swim and 5 kilometer stationary cycle ride asindicators of aerobic fitness. (Naval Health Research Center Rep. No. 87-27). San Diego:CA.
8. Chief of Naval Operations (1976). Physical Fitness. Office of the Chief of Naval OperationsInstruction 6110.1. Washington, DC: Office of the Chief of Naval Operations. 16 June.
9. Chief of Naval Operations (OP-09) (1980). Physical Fitness. Office of the Chief of NavalOperations Instruction 6110.1A. Washington, DC: Office of the Chief of Naval Operations.17 July.
10. Chief of Naval Operations (NMPC-6H) (1982). Health and Physical Readiness Program.Office of the Chief of Naval Operations Instruction 6110.1B. Washington, DC: NavyMilitary Personnel Command. 19 October.
11. Chief of Naval Operations (1984). Health and Physical Readiness. Office of the Chief ofNaval Operations Notice 6110, serial153/366201. Washington, DC 13 August.
12. Chief of Naval Operations (NMPC-6H) (1986). Physical Readiness Program. Office of theChief of Naval Operations Instruction 6110.1C. Washington, DC: Navy Military PersonnelCommand. 7 August.
13. Chief of Naval Operations (NMPC-68) (1990). Physical Readiness Program. Office of theChief of Naval Operations Instruction 6110.1D. Washington, DC: Navy Military PersonnelCommand. 18 January.
14. Chief of Naval Operations (PERS-601) (1998). Physical Readiness Program. Office of theChief of Naval Operations Instruction 6110.1E. Washington, DC: Navy Military PersonnelCommand. 23 March.
41
15. Chief of Naval Personnel (1983). Memorandum 1365 of 11 March.
16. Commandant of the Marine Corps (1980). Weight Control and Military Appearance. MarineCorps Order 6100.10. Washington, DC: Headquarters, United States Marine Corps. 23 Oct.
17. Commandant of the Marine Corps (1997). Weight control and body fat. Marine CorpsOrder 6100.10B, Washington, DC: Headquarters, Marine Corps. 01 October.
18. Commander, Naval Medical Command (1983). Letter 6110, Ser 30315002 of 21 April.
19. Commander, Navy Military Personnel Command (1985). Letter 6110, Ser N-6H/209 of 15Feb.
20. Commanding Officer, Naval Health Research Center (1985). Letter 6100, Ser 317/62:00S of12 August.
21. Commanding Officer, Naval Health Research Center (1999). Letter 6110, Ser 21/055 of 10February (with enclosures), Subject: Development of suggested physical readiness teststandards.
22. Conway, T., & Dutton, L. (1985). Baseline Estimates of Naval Physical Readiness in MaleShipboard and Shore-based Personnel (Naval Health Research Center Report No. 85-15)San Diego: CA.
23. Conway, T., & Hodgdon, J. (1986). Letter 6100 of 4 April.
24. Cooper, K.H. (1970). The New Aerobics. New York, NY, M. Evans and Company andBantam Books.
25. Cooper, K.H. (1982). The Aerobics Program for Total Well-Being. New York, NY. M.Evans and Company, Inc. (for Bantam Books).
26. Director, Military Operations and Capabilities Issues, United States General AccountingOffice (1998). Gender issues: Improved guidance and oversight are needed to ensurevalidity and equity of fitness standards (United States General Accounting Office Report No.GAO/NSIAD-99-9). Washington, DC.
27. Hodgdon, J. A. (1992). Body composition in the military services: Standards and methods.In Marriott, B.M. & J. Grumstropp-Scott (Eds.) Body Composition and PhysicalPerformance, Applications for the Military Services. (pp 57-70) Washington, DC: NationalAcademy Press.
28. Hodgdon, J.A., & Beckett, M.B. (1984a). Prediction of Percent Body Fat for U.S. NavyMen From Body Circumferences and Height (Naval Health Research Center Report No. 84-11) San Diego, CA.
29. Hodgdon, J.A., & Beckett, M.B. (1984b). Prediction of Percent Body Fat for U.S. NavyWomen From Body Circumferences and Height (Naval Health Research Center Report No.84-29) San Diego, CA.
30. Hodgdon, J.A., Conway, T.L., & Dutton, L.J. (1984). Fitness of young people entering theNavy (Naval Health Research Center Report No. 84-32) San Diego, CA.
31. Hodgdon, J.A. & Fitzgerald, P. (1987). Validity of impedance predictions at various levelsof fatness. Human Biology, 59(2), 281-298.
42
32. Hodgdon, J.A., & Lawlor, M.R. (1985). Comparison of whole body impedance, bodycircumferences, and skinfold thicknesses in the prediction of lean body mass. Medicine andScience in Sports and Exercise, 17(2), 271.
33. Hodgdon, J.A., & Friedl, K. (1999). Development of the DoD body composition estimationequations. (Naval Health Research Center Technical Document 99-2B), San Diego, CA.
34. Institute of Medicine (1998). Assessing readiness in military women: The relationship ofbody composition, nutrition, and health. Washington, DC: National Academy Press.
35. Kuczmarski, R.J., K.M. Flegal, S.M. Campbell, & C.L. Johnson (1994). Increasingprevalence of overweight among US adults. Journal of the American Medical Association,272(3), 205.
36. Laurence, M.T. (1985). Proposals for the revision of AR 40-501: Medical services standardsof medical fitness, height weight standards for enlistment. Defense Manpower Data Center,Arlington, VA.
37. Lawlor, M.R., Crisman, R.P., & Hodgdon, J.A. (1985). Bioelectrical impedance analysis asa method to assess body composition. Medicine and Science in Sports and Exercise, 17(2),271.
38. Metropolitan Life Insurance Company (1983). Metropolitan height and weight tables.Statistical Bulletin of the Metropolitan Life Insurance Company. 64 (Jan-Jun): 2.
39. National Institutes of Health (1985). Health Implications of Obesity. ConsensusDevelopment Conference Statement, Vol 5, No 9. Bethesda, MD: U.S. Department ofHealth and Human Services.
40. Nice, D.S., Dutton, L., & Seymour, G.E. (1984). An Analysis of Baseline Navy Health andPhysical Readiness Data From Local Shore Facilities. (Naval Health Research Center ReportNo. 84-1) San Diego, CA.
41. Office of the Secretary of Defense (Manpower, Reserve Affairs, and Logistics) PhysicalFitness Joint Service Study Group (1981). Department of Defense study of the militaryservices physical fitness. Washington, DC. Department of Defense, April
42. Robertson, D.W., & Trent, T.T. (1985). Documentation of muscularly demanding job tasksand validation of an occupational strength test battery (STB). (Navy Personnel Research andDevelopment Center Report No. 86-1) San Diego, CA.
43. Segal, K.R., Van Loan, M., Fitzgerald, P.I., Hodgdon, J.A., & Van Itallie, T.B. (1988). Leanbody mass estimation by bioelectrical impedance analysis: A four-site cross-validationstudy. American Journal of Clinical Nutrition, 47(1), 7-14.
44. Siri, W.E. (1961) Body composition from fluid spaces and density: Analysis of methods InBrozek, J. and A. Henschel (Eds). Techniques for Measuring Body Composition. (pp 223-244) National Academy of Sciences – National Research Council, Washington, DC.
45. U.S. Department of Health and Human Services (1991). Healthy People 2000: NationalHealth Promotion and Disease Prevention Objectives. DHHS (PHS) Publ. No. 91-50212.Public Health Service, U.S. Department of Health and Human Services. Washington, DC:U.S. Government Printing Office.
43
46. Vickers Jr., R.R., & Hervig. L. (1998). Occupational Physical Demands and HospitalizationRates in U.S. Navy Personnel. (Naval Health Research Center Report No. 98-32) San Diego,CA.
47. Vickers, R.R., & Hervig. L.K. (1999). Job Demands, Duty Status, and Accident Rates forU.S. Navy Enlisted Personnel. (Naval Health Research Center Report No. 99-13) San Diego,CA
48. Wright, H. W., Dotson, C. O., & Davis, P. O.( 1980). An investigation of assessmenttechniques for body composition of women Marines. U.S. Navy Medicine, 71(5), 15-26.
49. Wright, H. W., Dotson, C. O., & Davis, P. O. (1981). A simple technique for measurement ofpercent body fat in man. U.S. Navy Medicine, 72(5), 23-27.
REPORT DOCUMENTATION PAGEForm Approved
OMB No. 0704-0188
Public reporting burden for this collection of information is estimated to average 1 hour per response, including the time for reviewing instructions, searching existing data sources, gathering andmaintaining the data needed, and completing and reviewing the collection of information. Send comments regarding this burden estimate or any other aspect of this collection of information,including suggestions for reducing this burden, to Washington Headquarters Services, Directorate for Information Operations and Reports, 1215 Jefferson Davis Highway, Suite 1204, Arlington, VA22202-4302, and to the Office of Management and Budget, Paperwork Reduction Project (0704-0188), Washington, DC 20503
1. AGENCY USE ONLY (Leave blank) 2. REPORT DATE
18 August 19993. REPORT TYPE & DATE OVERED
Final 981001 - 990930
4. TITLE AND SUBTITLE
A history of the U.S. Navy physical readiness program from 1976 to 1999
6. AUTHOR(S)
Hodgdon, James A
5. FUNDING NUMBERS
Program Element:63706N M0096.002
Work Unit Number:6716
7. PERFORMING ORGANIZATION NAME(S) AND ADDRESS(ES)
Naval Health Research Center P.O. Box 85122 San Diego, CA 92186-5122
8. PERFORMING ORGANIZATION
Technical Document 99-6F
9. SPONSORING/MONITORING AGENCY NAMES(S) AND ADDRESS(ES)
Office of Naval Research Chief, Bureau of Medicine and Surgery 800 North Quincy St. Code: BUMED-26 Arlington, VA 22217-5600 2300 E Street NW Washington, DC 20372-5300
10. SPONSORING/MONITORING AGENCY REPORT NUMBER
11. SUPPLEMENTARY NOTES
12a. DISTRIBUTION/AVAILABILITY STATEMENT
Approved for public release; distribution is unlimited.12b. DISTRIBUTION CODE
A
13. ABSTRACT (Maximum 200 words)
This report reviews the development, evolution, and implementation of the Navy’s physical readinessprogram through the 6110.1 series of instructions issued by the Office of the Chief of Naval Operations(OPNAVINST). The first of these instructions, OPNAVINST 6110.1 was issued in 1976 and emphasized aprogram of cardiovascular-respiratory fitness based on the popular “aerobics” program of Dr. Cooper.OPNAVINST 6110.1A was issued in 1980, following a presidential request for an assessment of theServices’ physical fitness. The only change from the previous instruction was the inclusion of a physicalfitness test. A comprehensive revision of the program was issued in 1982 as OPNAVINST 6110.1B. Theinstruction included a three-level program named “physical readiness”, and included consideration ofphysical fitness, weight control, and health promotion issues. A physical readiness test (PRT) was includedconsisting of measurement of the time required to run 1.5 miles, or the number of steps-in-place whichcould be done in 3 minutes; measurement of the number of curl-ups which could be done in two minutes,and measurement of the sit-reach distance. OPNAVINST 6110.1C of 1986 added items to the PRT, andestablished the basis for policy and practice that has continued to this day, with minor revisions.
15. NUMBER OF PAGES
4714. SUBJECT TERMS
Physical fitness, Military fitness, Physical readiness, Body fat, Physicalreadiness test 16. PRICE CODE
17. SECURITY CLASSIFI-CATION OF REPORT
Unclassified
18. SECURITY CLASSIFI-CATION OF THIS PAGE
Unclassified
19. SECURITY CLASSIFICATIONOF ABSTRACT
Unclassified
20. LIMITATION OF ABSTRACT
Unclassified