a high precision dem extraction method based on … · create the offset parameter file, and then...
TRANSCRIPT

A HIGH PRECISION DEM EXTRACTION METHOD BASED ON INSAR DATA
Wang Xinshuang1, Liu Lingling1, Shi Xiaoliang2,*, Huang Xitao1, Geng Wei1
1 Shannxi Geomatics Center of National Administration of Surveying, Mapping and Geoinformation, Xi’an, China - (shuang1007,
lingling600650, huangxitao_81, geng_wei0728)@163.com 2 College of Geomatics, Xi’an University of Science and Technology, Xi’an, China - [email protected]
Commission III, WG III/2
KEY WORDS: InSAR, DEM, Interferometric, Adaptive Filtering, Phase Unwrapping Method, Accuracy Verification
ABSTRACT:
In the 13th Five-Year Plan for Geoinformatics Business, it is proposed that the new InSAR technology should be applied to
surveying and mapping production, which will become the innovation driving force of geoinformatics industry. This paper will
study closely around the new outline of surveying and mapping and then achieve the TerraSAR/TanDEM data of Bin County in
Shaanxi Province in X band. The studying steps are as follows; Firstly, the baseline is estimated from the orbital data; Secondly, the
interferometric pairs of SAR image are accurately registered; Thirdly, the interferogram is generated; Fourth, the interferometric
correlation information is estimated and the flat-earth phase is removed. In order to solve the phase noise and the discontinuity phase
existing in the interferometric image of phase, a GAMMA adaptive filtering method is adopted. Aiming at the "hole" problem of
missing data in low coherent area, the interpolation method of low coherent area mask is used to assist the phase unwrapping. Then,
the accuracy of the interferometric baseline is estimated from the ground control points. Finally, 1: 50000 DEM is generated, and the
existing DEM data is used to verify the accuracy through statistical analysis. The research results show that the improved InSAR
data processing method in this paper can obtain the high-precision DEM of the study area, exactly the same with the topography of
reference DEM. The R2 can reach to 0.9648, showing a strong positive correlation.
* Corresponding author
1. INTRODUCTION
The Digital Elevation Model (DEM) describes the elevation
information of the ground and is widely used in various fields
such as engineering earthwork calculation, terrain three-
dimensional model, auxiliary remote sensing image
classification and geological reconnaissance reference.
Common DEM mapping methods include traditional field
surveys (Tong, 1990), optical remote sensing (Ma, 2009), Light
Detection and Ranging (LiDAR) (Liu et al, 2005) and Synthetic
Aperture Radar Interferometry (InSAR) (Perna, 2015). The
precision of DEM obtained from traditional fieldwork
measurement is higher, but the workload, spatial density and
time sampling rate of the observation point are difficult to
guarantee; Optical remote sensing technology can be carried out
on the ground observation of large area with high precision, but
the image spatial resolution is limited. And it is very affected
by climatic conditions, making it difficult to achieve effective
precision (Li and Feng, 2009); LiDAR system has the
advantage of obtaining high-precision DEM in difficult
surveying areas, but it has some disadvantages such as single
data source acquisition and limited single observation area (Liu,
2008). Compared with other topographic surveying methods,
the spaceborne InSAR technology has its own unique approach.
The imaging process is not affected by complicated weather
conditions such as cloud and rain, and has the characteristics of
continuously observing the ground information throughout the
day (Chen, 2016). With the continuous development of new
surveying and mapping, the resolution of spaceborne InSAR
system for acquiring image is continuously increasing, the
working modes are diversified and the revisiting cycle is
shortened. The use of InSAR technology to obtain large-area
and high-precision DEMs has shown great potential (Wan et al,
2015; Zhao, 2016; Zhang et al, 2017).
The emergence of InSAR technology can be traced back to the
1960s, the foreign scholars surveyed in greatly undulate terrain
by phase information. Li and Goldstein (1990) used the
SEASAT data to analyse the influence of baseline and noise on
the accuracy of DEM and proposed the concept of the best
baseline. Pascazio (2002) developed the DEM reconstructing
method of steep slopes and discontinuous terrain. Fornaro (2005)
made centimeter-level DEM generation using multi-baseline
joint InSAR data. In 2007, DLR successfully launched the first
X-band radar remote sensing satellite TerraSAR-X which is
providing a high-resolution, short-revisited data source for the
in-depth research and application of InSAR technology. In 2010,
the DLR launched a TanDEM-X satellite again in X-band and
formed the formation flight mode with the former TerraSAR-X
satellite. The data acquired by the two satellites are
synchronized in time and space, making up the defect of
conventional InSAR data with time-space baseline
decorrelation, and providing an effective guarantee for the fast
and large-scale extraction of global high-precision DEM data.
Since then, many scholars began the researching work of DEM
and the evaluation of accuracy based on the satellites flown by
ISPRS Annals of the Photogrammetry, Remote Sensing and Spatial Information Sciences, Volume IV-3, 2018 ISPRS TC III Mid-term Symposium “Developments, Technologies and Applications in Remote Sensing”, 7–10 May, Beijing, China
This contribution has been peer-reviewed. The double-blind peer-review was conducted on the basis of the full paper. https://doi.org/10.5194/isprs-annals-IV-3-211-2018 | © Authors 2018. CC BY 4.0 License.
211
TanDEM-X and TerraSAR-X and achieved good results (Chen
et al, 2015; Du, 2015; Sun, 2016).
In this study, the GAMMA software is used to estimate the
baseline from the acquired TerraSAR binary orbital data, and
then performing the fine (sub-pixel) registration, generating the
interferogram, estimating the coherent coefficients of the
interferogram, removing the flat-earth phase, doing the adaptive
filtering of the interferogram, phase unwrapping, finally
estimating the accuracy of the interferometric baseline from
ground control points. In order to deal with the problem of
phase noise and phase discontinuity existing in the phase image,
a GAMMA adaptive filtering method is adopted. In order to
solve the "hole" problem of missing data in low coherent area,
phase unwrapping is assisted in the interpolation method of low
coherent mask, high-precision DEM is final generated.
2. TEST SITE AND DATA
2.1 The general situation of test site
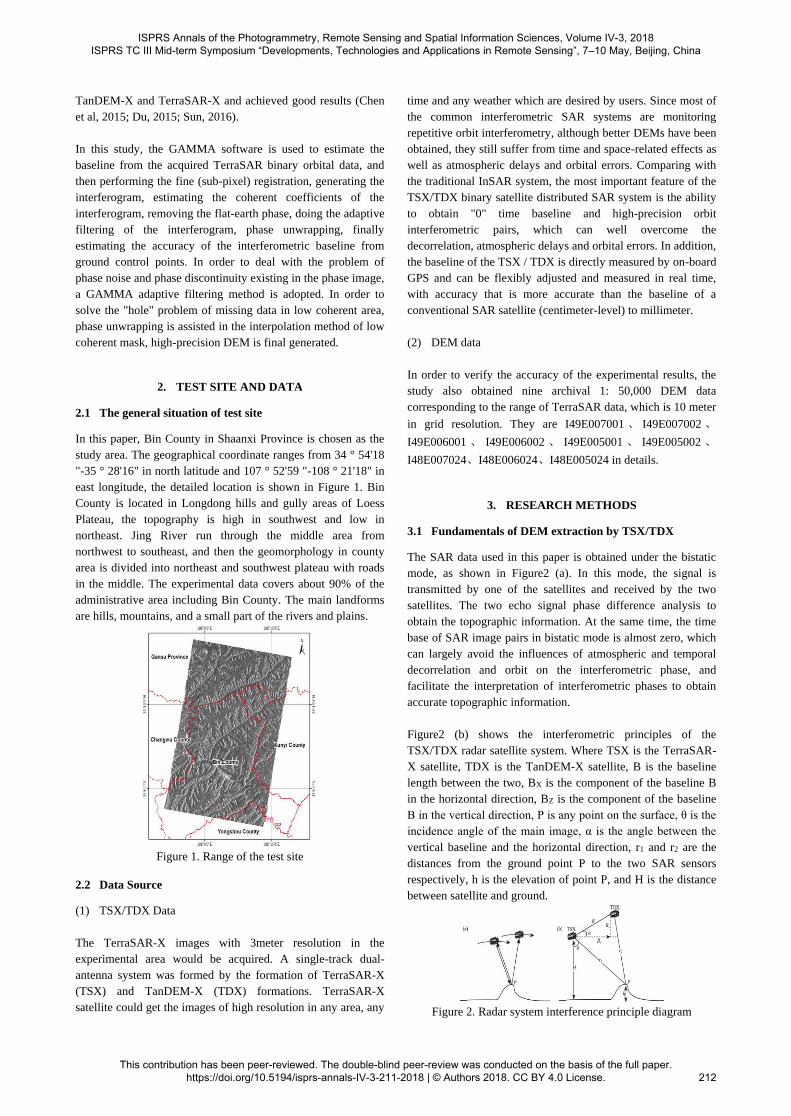
In this paper, Bin County in Shaanxi Province is chosen as the
study area. The geographical coordinate ranges from 34 ° 54'18
"-35 ° 28'16" in north latitude and 107 ° 52'59 "-108 ° 21'18" in
east longitude, the detailed location is shown in Figure 1. Bin
County is located in Longdong hills and gully areas of Loess
Plateau, the topography is high in southwest and low in
northeast. Jing River run through the middle area from
northwest to southeast, and then the geomorphology in county
area is divided into northeast and southwest plateau with roads
in the middle. The experimental data covers about 90% of the
administrative area including Bin County. The main landforms
are hills, mountains, and a small part of the rivers and plains.
Figure 1. Range of the test site
2.2 Data Source
(1) TSX/TDX Data
The TerraSAR-X images with 3meter resolution in the
experimental area would be acquired. A single-track dual-
antenna system was formed by the formation of TerraSAR-X
(TSX) and TanDEM-X (TDX) formations. TerraSAR-X
satellite could get the images of high resolution in any area, any
time and any weather which are desired by users. Since most of
the common interferometric SAR systems are monitoring
repetitive orbit interferometry, although better DEMs have been
obtained, they still suffer from time and space-related effects as
well as atmospheric delays and orbital errors. Comparing with
the traditional InSAR system, the most important feature of the
TSX/TDX binary satellite distributed SAR system is the ability
to obtain "0" time baseline and high-precision orbit
interferometric pairs, which can well overcome the
decorrelation, atmospheric delays and orbital errors. In addition,
the baseline of the TSX / TDX is directly measured by on-board
GPS and can be flexibly adjusted and measured in real time,
with accuracy that is more accurate than the baseline of a
conventional SAR satellite (centimeter-level) to millimeter.
(2) DEM data
In order to verify the accuracy of the experimental results, the
study also obtained nine archival 1: 50,000 DEM data
corresponding to the range of TerraSAR data, which is 10 meter
in grid resolution. They are I49E007001 、 I49E007002 、
I49E006001 、 I49E006002 、 I49E005001 、 I49E005002 、
I48E007024、I48E006024、I48E005024 in details.
3. RESEARCH METHODS
3.1 Fundamentals of DEM extraction by TSX/TDX
The SAR data used in this paper is obtained under the bistatic
mode, as shown in Figure2 (a). In this mode, the signal is
transmitted by one of the satellites and received by the two
satellites. The two echo signal phase difference analysis to
obtain the topographic information. At the same time, the time
base of SAR image pairs in bistatic mode is almost zero, which
can largely avoid the influences of atmospheric and temporal
decorrelation and orbit on the interferometric phase, and
facilitate the interpretation of interferometric phases to obtain
accurate topographic information.
Figure2 (b) shows the interferometric principles of the
TSX/TDX radar satellite system. Where TSX is the TerraSAR-
X satellite, TDX is the TanDEM-X satellite, B is the baseline
length between the two, BX is the component of the baseline B
in the horizontal direction, BZ is the component of the baseline
B in the vertical direction, P is any point on the surface, θ is the
incidence angle of the main image, α is the angle between the
vertical baseline and the horizontal direction, r1 and r2 are the
distances from the ground point P to the two SAR sensors
respectively, h is the elevation of point P, and H is the distance
between satellite and ground.
Figure 2. Radar system interference principle diagram
ISPRS Annals of the Photogrammetry, Remote Sensing and Spatial Information Sciences, Volume IV-3, 2018 ISPRS TC III Mid-term Symposium “Developments, Technologies and Applications in Remote Sensing”, 7–10 May, Beijing, China
This contribution has been peer-reviewed. The double-blind peer-review was conducted on the basis of the full paper. https://doi.org/10.5194/isprs-annals-IV-3-211-2018 | © Authors 2018. CC BY 4.0 License.
212
3.2 Multilook processing
Single-Look Complex (SLC) data is the original highest
resolution of SAR data. The coherent addition of single-cell
backscattering information will result in a lot of noise in the
intensity information. Multilook processing during image
focusing can be applied to improve radiometric accuracy at the
cost of image resolution. And then get the intensity data. In this
paper, the multilook program is used to process the SLC data
and transforms it into multi-look intensity data. The multi-look
number of azimuth and distance is determined according to the
original imaging ranks to be 3*3. The multilook SAR intensity
image is shown in Figure 3.
(a)tdx.mli (b)tsx.mli
Figure 3. TDX/TSX Multi-intensity Image
3.3 Fine registration
The sub-pixel registration of both focused SAR images is a
strict requirement for interferometric processing. Just and
Bamler have shown that coregistration to an accuracy of l/8th of
a pixel yields an almost negligible decrease in coherence, as
long as the data are acquired with relatively small squint angles
(Just and Bamler,1994). In this paper, create_offset is used to
create the offset parameter file, and then init_offset is used to
estimate the offset of two SAR images.
In order to get a more accurate estimate, the procedure of
init_offset is used in multi-looking image firstly and then in a
single image secondly. On the basis of the initial offset, the
accurate estimation of the offset polynomial can be further
performed, which can be based on the intensity image or the
SLC image. Finally, the offset in range direction and azimuth
direction are 0.032 and 0.005 pixels respectively, which meet
the requirement of interference processing.
3.4 Interferogram formation
A complex interferogram is constructed by a pointwise complex
multiplication of corresponding pixels in both datasets, the
complex interferogram is usually retained for future
computations. In this paper, the procedure of interf_SLC is used
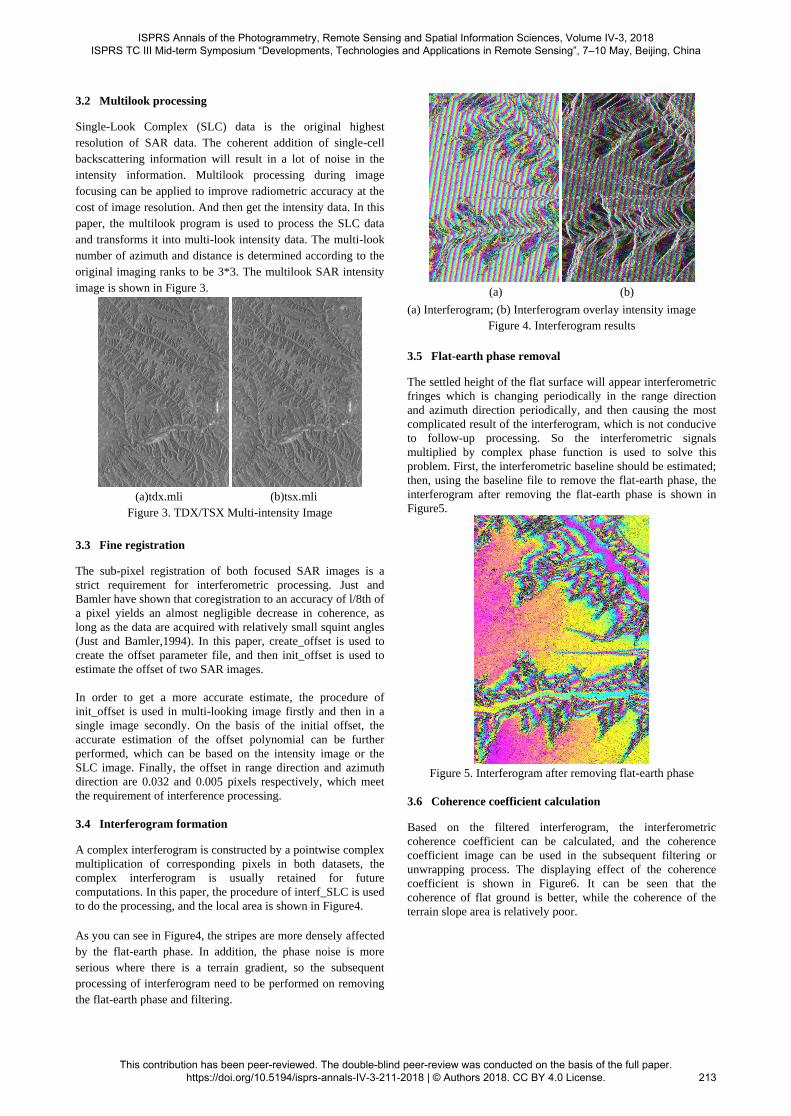
to do the processing, and the local area is shown in Figure4.
As you can see in Figure4, the stripes are more densely affected
by the flat-earth phase. In addition, the phase noise is more
serious where there is a terrain gradient, so the subsequent
processing of interferogram need to be performed on removing
the flat-earth phase and filtering.
(a) (b)
(a) Interferogram; (b) Interferogram overlay intensity image
Figure 4. Interferogram results
3.5 Flat-earth phase removal
The settled height of the flat surface will appear interferometric
fringes which is changing periodically in the range direction
and azimuth direction periodically, and then causing the most
complicated result of the interferogram, which is not conducive
to follow-up processing. So the interferometric signals
multiplied by complex phase function is used to solve this
problem. First, the interferometric baseline should be estimated;
then, using the baseline file to remove the flat-earth phase, the
interferogram after removing the flat-earth phase is shown in
Figure5.
Figure 5. Interferogram after removing flat-earth phase
3.6 Coherence coefficient calculation
Based on the filtered interferogram, the interferometric
coherence coefficient can be calculated, and the coherence
coefficient image can be used in the subsequent filtering or
unwrapping process. The displaying effect of the coherence
coefficient is shown in Figure6. It can be seen that the
coherence of flat ground is better, while the coherence of the
terrain slope area is relatively poor.
ISPRS Annals of the Photogrammetry, Remote Sensing and Spatial Information Sciences, Volume IV-3, 2018 ISPRS TC III Mid-term Symposium “Developments, Technologies and Applications in Remote Sensing”, 7–10 May, Beijing, China
This contribution has been peer-reviewed. The double-blind peer-review was conducted on the basis of the full paper. https://doi.org/10.5194/isprs-annals-IV-3-211-2018 | © Authors 2018. CC BY 4.0 License.
213
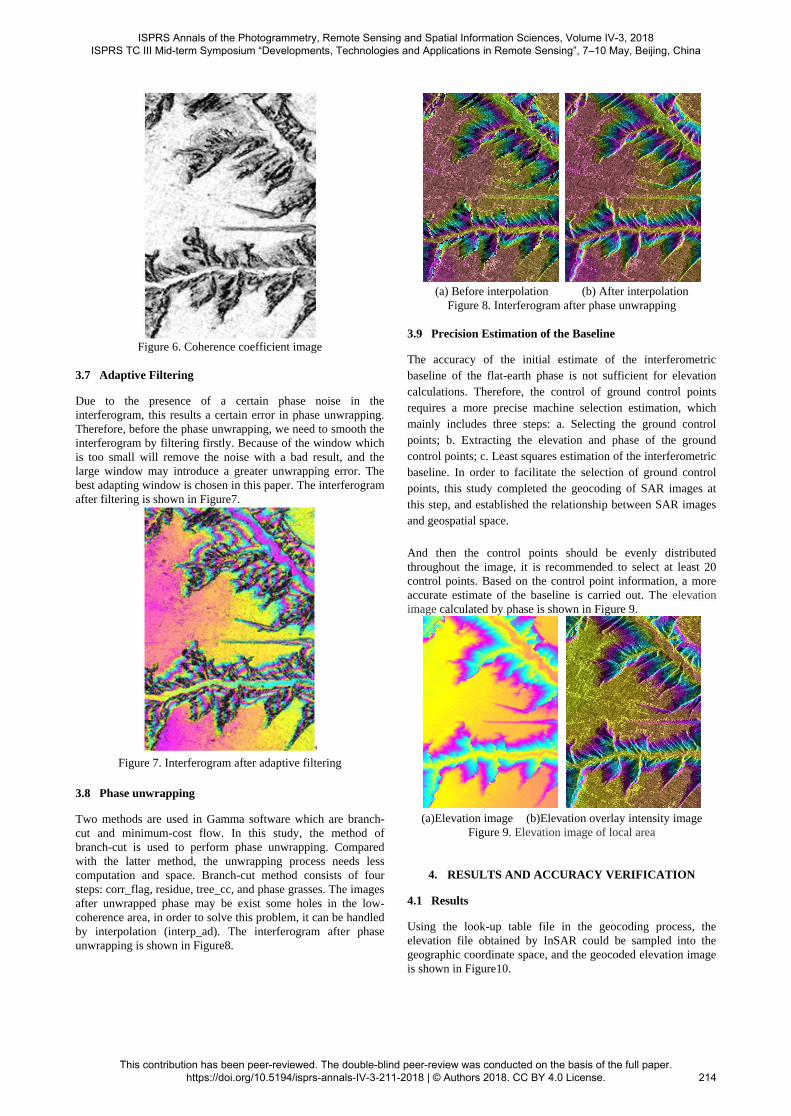
Figure 6. Coherence coefficient image
3.7 Adaptive Filtering
Due to the presence of a certain phase noise in the
interferogram, this results a certain error in phase unwrapping.
Therefore, before the phase unwrapping, we need to smooth the
interferogram by filtering firstly. Because of the window which
is too small will remove the noise with a bad result, and the
large window may introduce a greater unwrapping error. The
best adapting window is chosen in this paper. The interferogram
after filtering is shown in Figure7.
Figure 7. Interferogram after adaptive filtering
3.8 Phase unwrapping
Two methods are used in Gamma software which are branch-
cut and minimum-cost flow. In this study, the method of
branch-cut is used to perform phase unwrapping. Compared
with the latter method, the unwrapping process needs less
computation and space. Branch-cut method consists of four
steps: corr_flag, residue, tree_cc, and phase grasses. The images
after unwrapped phase may be exist some holes in the low-
coherence area, in order to solve this problem, it can be handled
by interpolation (interp_ad). The interferogram after phase
unwrapping is shown in Figure8.
(a) Before interpolation (b) After interpolation
Figure 8. Interferogram after phase unwrapping
3.9 Precision Estimation of the Baseline
The accuracy of the initial estimate of the interferometric
baseline of the flat-earth phase is not sufficient for elevation
calculations. Therefore, the control of ground control points
requires a more precise machine selection estimation, which
mainly includes three steps: a. Selecting the ground control
points; b. Extracting the elevation and phase of the ground
control points; c. Least squares estimation of the interferometric
baseline. In order to facilitate the selection of ground control
points, this study completed the geocoding of SAR images at
this step, and established the relationship between SAR images
and geospatial space.
And then the control points should be evenly distributed
throughout the image, it is recommended to select at least 20
control points. Based on the control point information, a more
accurate estimate of the baseline is carried out. The elevation
image calculated by phase is shown in Figure 9.
(a)Elevation image (b)Elevation overlay intensity image
Figure 9. Elevation image of local area
4. RESULTS AND ACCURACY VERIFICATION
4.1 Results
Using the look-up table file in the geocoding process, the
elevation file obtained by InSAR could be sampled into the
geographic coordinate space, and the geocoded elevation image
is shown in Figure10.
ISPRS Annals of the Photogrammetry, Remote Sensing and Spatial Information Sciences, Volume IV-3, 2018 ISPRS TC III Mid-term Symposium “Developments, Technologies and Applications in Remote Sensing”, 7–10 May, Beijing, China
This contribution has been peer-reviewed. The double-blind peer-review was conducted on the basis of the full paper. https://doi.org/10.5194/isprs-annals-IV-3-211-2018 | © Authors 2018. CC BY 4.0 License.
214
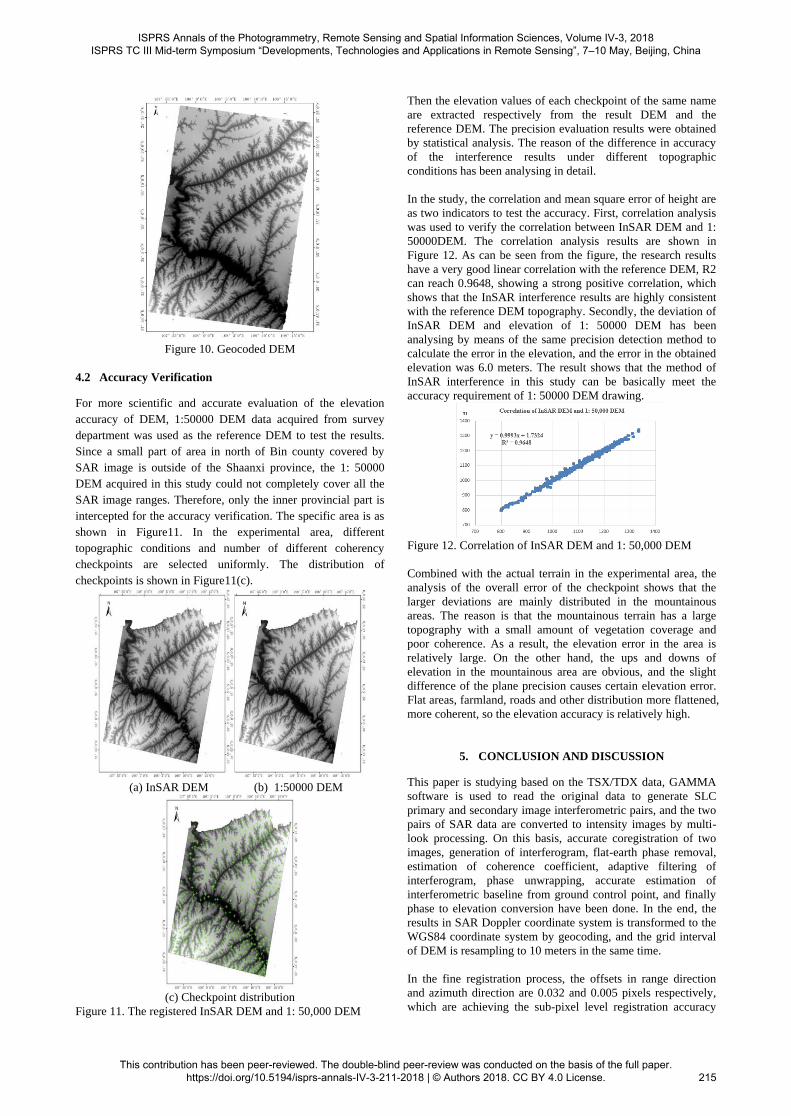
Figure 10. Geocoded DEM
4.2 Accuracy Verification
For more scientific and accurate evaluation of the elevation
accuracy of DEM, 1:50000 DEM data acquired from survey
department was used as the reference DEM to test the results.
Since a small part of area in north of Bin county covered by
SAR image is outside of the Shaanxi province, the 1: 50000
DEM acquired in this study could not completely cover all the
SAR image ranges. Therefore, only the inner provincial part is
intercepted for the accuracy verification. The specific area is as
shown in Figure11. In the experimental area, different
topographic conditions and number of different coherency
checkpoints are selected uniformly. The distribution of
checkpoints is shown in Figure11(c).
(a) InSAR DEM (b) 1:50000 DEM
(c) Checkpoint distribution
Figure 11. The registered InSAR DEM and 1: 50,000 DEM
Then the elevation values of each checkpoint of the same name
are extracted respectively from the result DEM and the
reference DEM. The precision evaluation results were obtained
by statistical analysis. The reason of the difference in accuracy
of the interference results under different topographic
conditions has been analysing in detail.
In the study, the correlation and mean square error of height are
as two indicators to test the accuracy. First, correlation analysis
was used to verify the correlation between InSAR DEM and 1:
50000DEM. The correlation analysis results are shown in
Figure 12. As can be seen from the figure, the research results
have a very good linear correlation with the reference DEM, R2
can reach 0.9648, showing a strong positive correlation, which
shows that the InSAR interference results are highly consistent
with the reference DEM topography. Secondly, the deviation of
InSAR DEM and elevation of 1: 50000 DEM has been
analysing by means of the same precision detection method to
calculate the error in the elevation, and the error in the obtained
elevation was 6.0 meters. The result shows that the method of
InSAR interference in this study can be basically meet the
accuracy requirement of 1: 50000 DEM drawing.
Figure 12. Correlation of InSAR DEM and 1: 50,000 DEM
Combined with the actual terrain in the experimental area, the
analysis of the overall error of the checkpoint shows that the
larger deviations are mainly distributed in the mountainous
areas. The reason is that the mountainous terrain has a large
topography with a small amount of vegetation coverage and
poor coherence. As a result, the elevation error in the area is
relatively large. On the other hand, the ups and downs of
elevation in the mountainous area are obvious, and the slight
difference of the plane precision causes certain elevation error.
Flat areas, farmland, roads and other distribution more flattened,
more coherent, so the elevation accuracy is relatively high.
5. CONCLUSION AND DISCUSSION
This paper is studying based on the TSX/TDX data, GAMMA
software is used to read the original data to generate SLC
primary and secondary image interferometric pairs, and the two
pairs of SAR data are converted to intensity images by multi-
look processing. On this basis, accurate coregistration of two
images, generation of interferogram, flat-earth phase removal,
estimation of coherence coefficient, adaptive filtering of
interferogram, phase unwrapping, accurate estimation of
interferometric baseline from ground control point, and finally
phase to elevation conversion have been done. In the end, the
results in SAR Doppler coordinate system is transformed to the
WGS84 coordinate system by geocoding, and the grid interval
of DEM is resampling to 10 meters in the same time.
In the fine registration process, the offsets in range direction
and azimuth direction are 0.032 and 0.005 pixels respectively,
which are achieving the sub-pixel level registration accuracy
ISPRS Annals of the Photogrammetry, Remote Sensing and Spatial Information Sciences, Volume IV-3, 2018 ISPRS TC III Mid-term Symposium “Developments, Technologies and Applications in Remote Sensing”, 7–10 May, Beijing, China
This contribution has been peer-reviewed. The double-blind peer-review was conducted on the basis of the full paper. https://doi.org/10.5194/isprs-annals-IV-3-211-2018 | © Authors 2018. CC BY 4.0 License.
215

required by the interferometric process. In the process of
filtering and phase unwrapping, this paper selects the best
filtering and unwrapping algorithm according to the actual
topography condition of Bin county experimental area,
effectively avoids the error in subsequent processing and
greatly improves the accuracy of elevation calculation and
efficiency. The research results have a very good linear
correlation with the reference DEM, R2 can reach to 0.9648,
and the mean square error of height is 6.0 meters, which can
meet the accuracy requirement of 1: 50000 DEM mapping.
ACKNOWLEDGEMENTS
This research work would not have been done well without the
help of Dr.Zhao in Chinese Academy of Forest, the author will
be grateful to the assistance of data processing and software
supporting.
REFERENCES
Chen, P.Q., Long, S.C., Jiang, Z.L., Yuan, Y., 2015. Study of
InSAR-derived DEMs generated with TanDEM-X and ERS
Tandem Data. Journal of Hunan University of Science &
Technology (Natural Science Edition), 30(4), pp. 21-26.
Chen, W.N., 2016. Study on DEM generating method by
Spaceborne SAR. Xi’an University of Science and Technology.
Du, Y.N., Feng, G.C., Li, Z.W., Zhu, J.J., Peng, X., 2015.
Generation of high precision DEM from TerraSAR-
X/TanDEM-X. Chinese Journal of Geophysics, 58(9), pp.
3089-3102.
Ma, S.Y, 2009. Research on the Extraction of DEM Based on
High Resolution Remotely-sensed Data. East China Normal
University.
Fornaro, G., Lombardini, F., Serafino, F, 2005. Three-
dimensional multi-pass SAR focusing: Experiments with long-
term spaceborne data. IEEE Transactions on Geoscience and
Remote Sensing, 43(4), pp. 702-714.
Just, D., Bamler, R., 1994. Phase statistics of interferograms
with applications to synthetic aperture radar. Applied Optics,
33(20), pp. 4361–4368.
Li, F.K., Goldstein, R.M., 1990. Studies of multi-baseline
spaceborne interferometric synthetic aperture radars.
Geoscience and Remote Sensing, IEEE Transactions on, 28(1),
pp. 88-97.
Liu, X., Peterson, J., Zhang, Z., 2005. High-resolution DEM
generated from LiDAR data for water resource management. In:
Proceedings of the International Congress on Modelling and
Simulation (MODSIM05). Modelling and Simulation Society of
Australia and New Zealand Inc, pp.1402-1408.
Liu, X., 2008. Airborne LiDAR for DEM generation: some
critical issues. Progress in Physical Geography,32(1), pp. 31-49.
Li, Z., Feng, Y., 2009. Geometric Model of Optical Spaceborne
Sensors and DEM Generation. Geomatics World, (02), pp. 53-
62.
Pascazio, V., Schirinzi, G., 2002. Multifrequency InSAR height
reconstruction through maximum likelihood estimation of local
planes parameters. IEEE Transactions on Image Processing,
11(12), pp. 1478-1489.
Perna, S., Esposito, C., Berardino, P., Pauciullo, A., Wimmer,
C., Lanari, R., 2015. Phase offset calculation for airborne
InSAR DEM generation without corner reflectors. IEEE
Transactions on Geoscience and Remote Sensing, 53(5),
pp.2713-2726.
Wan, L., Zhou, C.X., E, D.C., Deng, F.H., 2015. DEM
generation and precision analysis of Antarctic ice sheet based
on InSAR and ICESat data. Journal of Glaciology and
Geocryology, 37(5), pp. 1160-1167.
Sun, Y.F., Jiang, L.M., Liu, L., Sun, Y.L., Wang, H.S., 2016.
Generation and evaluation digital terrain model with TanDEM-
X bistatic SAR interferometry. Geomatics and Information
Science of Wuhan University, 41(1), pp. 100-105.
Tong, S.Q., 1900. Field sampling density and precision of
digital elevation mode. Journal of PLA surveying and mapping
institute, (01), pp.63-68.
Zhang, L.Q., Liu, H.Y., Guo, Y.K., Liao, B., 2017.The
methodology on building high- fidelity DEM in road domain
based on multi-source Data. Bulletin of Surveying and Mapping,
(7), pp. 113-116,142.
Zhao, Z., 2016. Methods on high-accuracy DEM extraction
from interferometric SAR in sophisticated terrain areas. Acta
Geodaetica et Cartographica Sinica, 45(11), pp. 1385.
ISPRS Annals of the Photogrammetry, Remote Sensing and Spatial Information Sciences, Volume IV-3, 2018 ISPRS TC III Mid-term Symposium “Developments, Technologies and Applications in Remote Sensing”, 7–10 May, Beijing, China
This contribution has been peer-reviewed. The double-blind peer-review was conducted on the basis of the full paper. https://doi.org/10.5194/isprs-annals-IV-3-211-2018 | © Authors 2018. CC BY 4.0 License.
216