a health information service based on sas … health information service... · a health information...
TRANSCRIPT

A HEALTH INFORMATION SERVICE BASED ON SAS SOFTWARE
Zachary Johnson - Eastern Health Board
Co-author: Patrick Dack
INTRODUCTION
"By the Year 2000 the actual difference in health status between countries and between groups ·within countries should be reduced by at least 25% by improving the level of health of disadvantaged nations and groups".
By making this the first of its 38 targets for Health for All by the Year 2000 for the European Region, the World Health Organisation (WHO) has made equity in health one of the major outcome factors by which the success of individual countries will be judged. Any country which subscribes to the Health for All goal must face the issue of equity.
Measuring health in a scientific way is not easy. Measuring equity in health, or lack of it, between groups within a country is more difficult. However unless we can measure the extent to which there is lack of equity in health in Ireland we have little chance of taking the specific actions needed to achieve WHO's first target.
If we accept that ill-health is not randomly distributed in the population, the concept of targetting services to people most in need becomes important. Attractive as this may seem it can in fact be difficult to demonstrate such variation in need. Although there is a considerable volume of information available in respect of the health of the whole population of Ireland and of the population of relatively large units such as counties, there is a dearth of information on health of small communities. Moreover, whatever information exists is rarely readily accessible to health service planning/management staff. There is a fairly large body of routinely collected data which is held in electronic format, but this is generally processed and analysed by agencies not directly involved in health care delivery.
The scenario outlined above lead us to develop the concept of Epidemological Information System (EIS).
THE EIS CONCEPT
The first part of the idea involves bringing together existing health data from diverse sources into a new computer system operated by health boards. These are the public service agencies mainly responsible for local health care planning and delivery in Ireland. The aim is to tap into existing files of routinely-collected health-related data held in electronic format by agencies other than the health boards. The EIS is designed to assemble, integrate, analyse and interpret this information in a way which maximises its usefullness for local health care planning. The system is being developed by the Eastern Health Board which includes the three counties of Dublin, Wicklow and Kildare and has a population of 1.2 million people.
The second concept inherent in the EIS is the development of a capability for small area analysis of health data. This has been reviewed by Dr Vera Carstairs of the Scottish Health Service (1,2). It is generally accepted that many health problems are more prevalent in areas of social deprivation. In Irel.and this is difficult. to demonstrate or to quantify because geographical coding (geocoding) of health data is generally to county level only. Counties have relatively large poplations (over 1 million pople in the case of County Dublin). Ireland had a total poplation of 3.5 million in 1986 and it is devided into 26 counties.
Analysis of health data from these relatively large areas would tend to mask local variation in health. If data from areas with more ill health (health "black spots") is combined with data from relatively healthy areas (health "white-spots") it produces a uniform shade of grey. The EIS is designed to geocode as much health data as possible to a much finer geographical level than county. The geocoding unit we have chosen is the district electoral division or DED. There are 3440 of these in Ireland and they are the smallest
380

administrative units for which population statistic's are published. The mean population of the DEDS in the 1986 Census of population was approximately 1000, although ,in Dublin the figure is slightly over 3000. Unfortunately Ireland does not yet have a zip coding system so that a considerable volume of coding work is required in order to geocode health data such as hospital discharge records or birth records to DED level.
Fig 1 illustrates in a schematic form the concept of the EIS.
FEASIBILITY STUDY
In 1985 we carried out a feasibility study to identify what health data was available on computers in Ireland and to determine the format in which it was held. We also wanted to outline methodoiogies for bringing it into theEIS.
As we are primarily interested in increasing the effectiveness of our health services in terms of health outcome, the EIS will concentrate on epidemiological data rather than activity-orientated or financial type information.
Following our initial studies we decided to proceed with the development of the EIS. The staff involved in development to date include one Medical Epidemiologist and one senior programmer.
SOFTWARE SELECTION
We were anxious to choose a software system which would enable us to do as much processing and analysis as possible within a single software environment. The requirements of the EIS include data entry, retrieval and management, reporting facilities, complex statistical analysis, graphics and electronic mapping of data. We also wish to develop a series of user-friendly menu-driven applications which will make available a wide range of analyses and graphical presentations to people,with limited computer experience. In addition the flexibility of a full programming language is necessary for complex data manipulations. Another very important requirement .is the ability of the system to handle records from diverse sources which may come in a wide variety of formats. For example sonie census ,of population records are almost 5000 bytes in length. '
Having examined a number of products we finally selected the SAS System. The products we have licensed to date include Base SAS Software, SAS/GRAPH, SAS/FSP, SAS/CBT and SAS/AF software*.
HARDWARE
As regards hardware, the Eastern Health Board operates Digital VAX machines for the majority of its information processing. At present there is a network of 9 VAXen, the largest of which is a VAX 8530. The system serves over 500 authorised accounts ~ithover ZOOVDUs and 40 printers via 40 leased lines. There are approx. 8. Gigabytes of on-line disc storage available. There are also approximately 40 microcomputers, some of which are linked to the VAX network. As heavy "number-crunching" is an important part of EIS processing, we decided to install SAS software on the VAX 8530. This machine has 48 MB of memory.
STREET INDEX
Having made basic decisions on technology, our first step in development of the EIS was to set up a computerised street index for the Eastern Health Board area. This is necessary for coding individual health related events such as births and immunisations to the DED in which the person resides. It consists of a list of approx. 14,000 street, road and townland names, each assosciated with a 3 digit DED code. There are 493 DEDs in the Eastern, Health Board area at present.
The street index is one of the oiost fundamental requirements for the EIS and we have used it to generate printed indexes sorted in alphabetical or,der for each of the 10 Community Care Areas which COnstitute the Eastern Health. Board area.
381

These indexes are being used to. geocode a wide range of health data. As the master index is held on cOJliputer it is easy to update, resort. and reprint a new version for the Eastern Health. Board or any Qf its subareas.
Secondly, we have developed a Cobol procedure which allows rapid online querying o£ the master index via computer terminals. This is a faster method of finding a DED code for a particular street than consulting a printed index.
Thirdly, we have developed another Cobol procedure which can read the address from an individual record already held on computer, refer to the master index, and assign the appropriate DED code to the record. This is an extremely useful procedure which can assign DED codes to 75% or more of computerised addreSses with a very high degree of accuracy. This will greatly increase the range of data sets available for small area analysis. At present this system applies only to addresses in Dublin.
ANALYSIS OF CENSUS DATA USING SAS
The next step in laying the foundations of the EIS was to transfer to our system the Small Area Population Statistics (SAPS) for the Eastern Health Board area from the 1986 Census. This data which was provided by the Central Statistics Office in Dublin is fundamental in providing a denominator for calculating incidence and prevalence rates. For each DED there is available a 4990 byte record containing the number Of persons in each age/sex/marital status group, plus data on family units, housing etc.
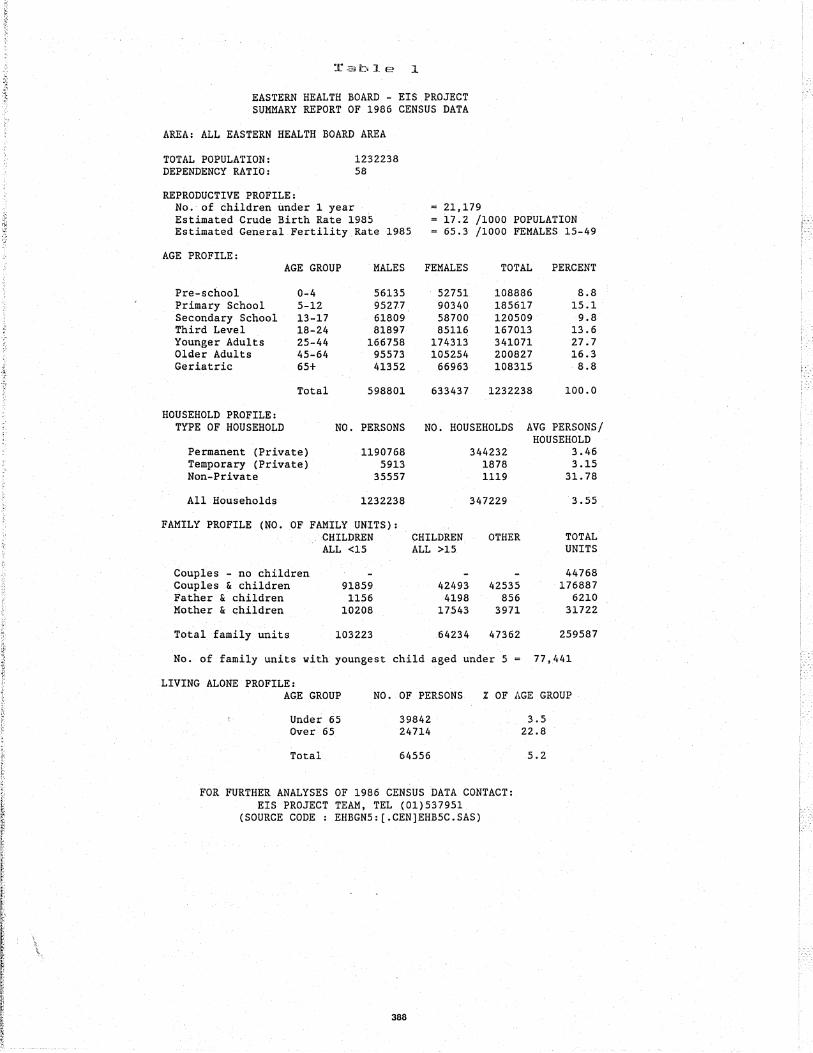
We have used the SAS System to generate a series of standard Census reports such as that in Table 1 which gives a population profile for the entire Eastern Health Board area. The aim of this report is to get as .wide a range as possible of the most frequently used census data on to a single A4 page. It includes a some information on the reproductive profile of the population, an age/sex breakdown into the main health service "target groups", a household profile and a family profile which includes the number of single parents with young families. .
This report is produced by employing the PUT statement which is ideal in this situation as it allows total control over the positioning of variables and labels on the report. It also permits us to pack the. maximum information on to one page.
This report, and other Similar ones can be produced for any or every DED. in an area and for each of the 10 Community Care Areas in the Eastern Health Board region. The latter is achieved by accumulating totals for the relevant variables for each Community Care Area, using the BY statement in the DATA step and resetting of the total to zero once the subtotal has been printed.
A similar report can be prepared for any designated group of DEDs such as a hospital catchment area or proposed clinic catchment area. There is a very large demand for these latter reports from health. care staff both clinical and administrative.
In accordance with our policy of.makinginformation as user-friendly as possible, especially for people who are not computer literate we print most of our reports on white A4 paper using a high quality laser printer.
MORTALITY ANALYSIS
We next decided to use the EIS to do a small area analysis of mortality in the Dublin area. This analysis was based DEDs.
The object of the project was to develop a system which would identify DEDs with mortality rates which were significantly above average for Dublin (mortality "black spots'). The .system should be sufficiently flexible to allow analysis of any single disease or group of diseases by DED, In addition it should lend itself to eventual electronic mapping of black spots so that the information could be presented in as visually compelling a format as possible.
382

STANDARDISED MORTALITY RATIO (SMR)
We decided to use the SMR as the mortality indicator for this study. The advantage of the SMR is that it provides Ii single number which reflects mortality in an area, and takes into account the unique age/sex structure of that area. In other words, it "allows for" the fact that one DED might contain a lot of elderly people and therefore might be expected to have a greater number of deaths than one with a mainly young population.
The SMR is in fact a percentage. It refers to the number of deaths in a given population expressed as a percentage of the number that would have occurred, if the population under study had experienced the same sex- and age- specific mortality rates as some larger "standard" population.
The first step in calculating the SMR involved working out the death rates in specific age groups for males and females for the standard population. We decided to use the population of Dublin in 1986 as our standard so that we could then see whether the SMR for a particular DED was above or below average for Dublin as a whole. Because it was used as the standard, the SMR for Dublin in 1986 was 100.
Two datasets were required for this analysis - the 1986 census data referred to above and a mortality dataset containing age, sex, cause of death and DED of residence for each death registered in the year 1986. This procedure was achieved using PROC SUMMARY to aggregate the deaths in each age/sex category for Dublin as a whole. The resulting data set was combined using the MERGE statement with a census dataset containing the number of males and females in each age/sex category in Dublin. The age specific rates were then calculated for each age/sex category by deviding the number of deaths in that category by the population in the same category. The resulting dataset contained the sexand age- specific death rates for Dublin as a whole in 1986. (the "standard population").
The next step involved applying the age/sex specific rates for males and females in the standard population to the population structure of each DED in order to work out how many deaths might be expected if the average rates for Dublin applied to that DED. This provided what is called the "expected" number of deaths.
This was achieved by MERGEing the standard population rate dataset with a census dataset containing the number of people in each age/sex category in each of the 322 Dublin DEDs. By multiplying the number of people in each age/sex category in each DED by the appropriate standard sex- and age-specific rates \ore could calculate how many deaths would have occurred in that subgroup if the people in the group died at the average rate for Dublin. This is known as the "expected" number of deaths. The expected deaths in each age/sex category were summed for each DED.
Next we calculated the numbe.r of deaths which actually occurred in each DED during the period in question - the "observed deaths". This was achieved using PROC SUMMARY on the mortality dataset.
Finally wedevided the observed number by the expected number and multiplied by 100. If there were more observed deaths than expected in a particular DED, the SMR was above 100 and therefore above the average for Dublin during the same period. If there were less observed deaths than expected the SMR was less than 100 and therefore the below average for Dublin.
Number of deaths observed SMR X 100
Number of deaths expected
Statistical Analysis
Because the number of deaths in anyone DED over a period of 2 years is relatively small, (particularly in the case of single diseases), it was necessary to provide some indication of how much significance could be
383

attributed to the finding of a high SMR in a particular DED.
Having discussed the problem with a medical statistician we decided to use exact confidence intervals (CI) as measures of significance.
In addition to producing an SMR for each DED we also calculated the 95% Confidence Interval (95% CI) for the SMR. The advantage of using a the CI in this situation is that it helps distinguish DEDs where a high SMR may be due to random variation as a result of small numbers from DEDs where the mortality pattern differs in some systematic way from the average for Dublin.
The algorithm for calculating the 95% CI is based on the Poisson distribution and uses some of the inbuilt mathematical functions of SAS and is as follows:
K=OBS;
ALPHA=O . 025;
IF K NE 0 THEN DO; KR = GAMINV (I-ALPHA, K+l);
KL = GAMINV (ALPHA, K); END;
IF K EQ 0 THEN DO; KR= -LOG (ALPHA) ;
KL=O; END;
K is the observed number of deaths in a DED, KL is the lower confidence limit and KR the upper confidence limit for that number. ALPHA relates to the area under the tails of the normal distribution and it equals 0.025 for the 95% CI. The 95% CI for the SMR for each DED were calculated by substituting the values of KL and KR in the SMR formula described above.
PATTERN OF SMRs IN DUBLIN
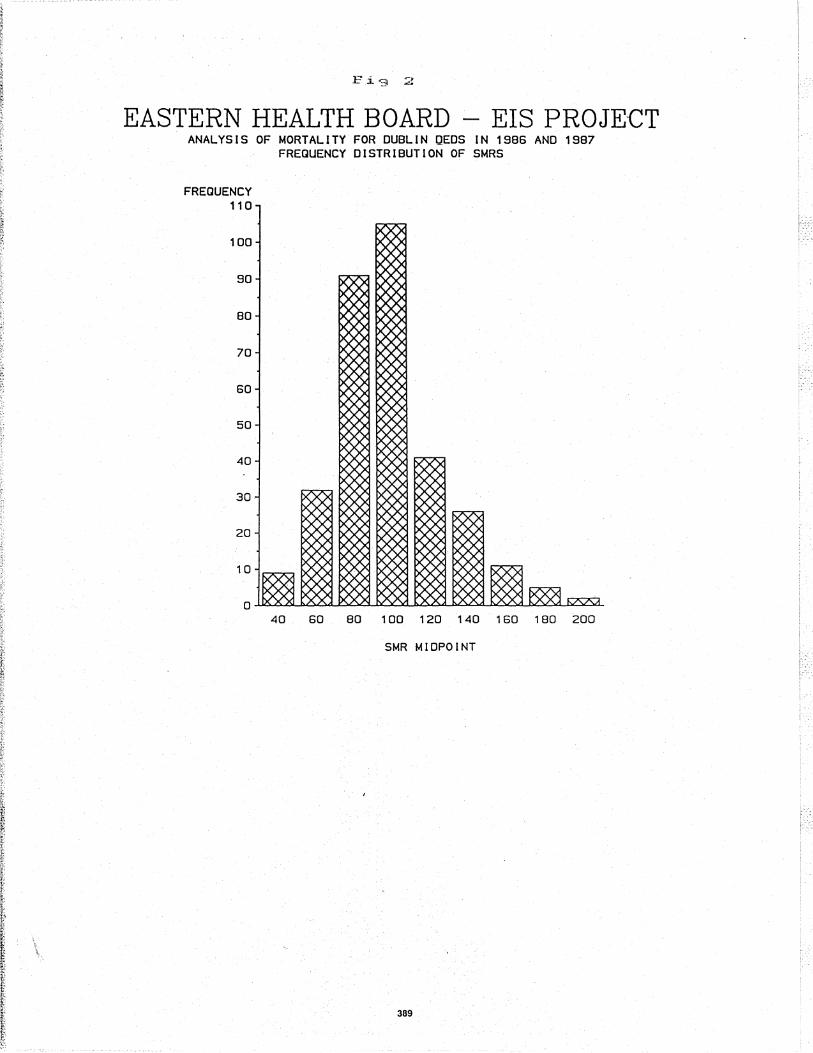
A total of 15,474 deaths relating to Dublin residents were registered in the years 1986 and 1987. Fig 2is a bar chart produced using SAS/GRAPH which shows the distribution of SMRs for deaths from all causes for the 322 DEDs in Dublin. The horizontal axis shows the SMR values obtained in the study, while the vertical axis shows the frequency of occurrence of the various SMR values.
As can be seen, the distribution is skewed to the right. In other words, there is a greater tendancy to deviate above the norm than below. The median SMR for the whole group of DEDs is 96. The lowest SMR recorded was 34 whereas the highest was 207.
Thus it appears that while the majority of DEDs have mortality rates in or around the average for Dublin, a small group have rates much higher than average. On the other hand, none have extremely low rates.
A possible interpretation of this pattern is as follows: most populations die at a fairly constant rate and while some areas have low rates, none are more than 70% below the average for Dublin. On the other hand in certain areas there is a marked elevation of the mortality rate (up to twice the average), suggesting some abnormal circumstance in these areas which is causing an increase the risk of premature death. In other words, while it may not be easy to increase longevity, life expectancy may be quite sensitive to adverse factors.
LUNG CANCER MORTALITY
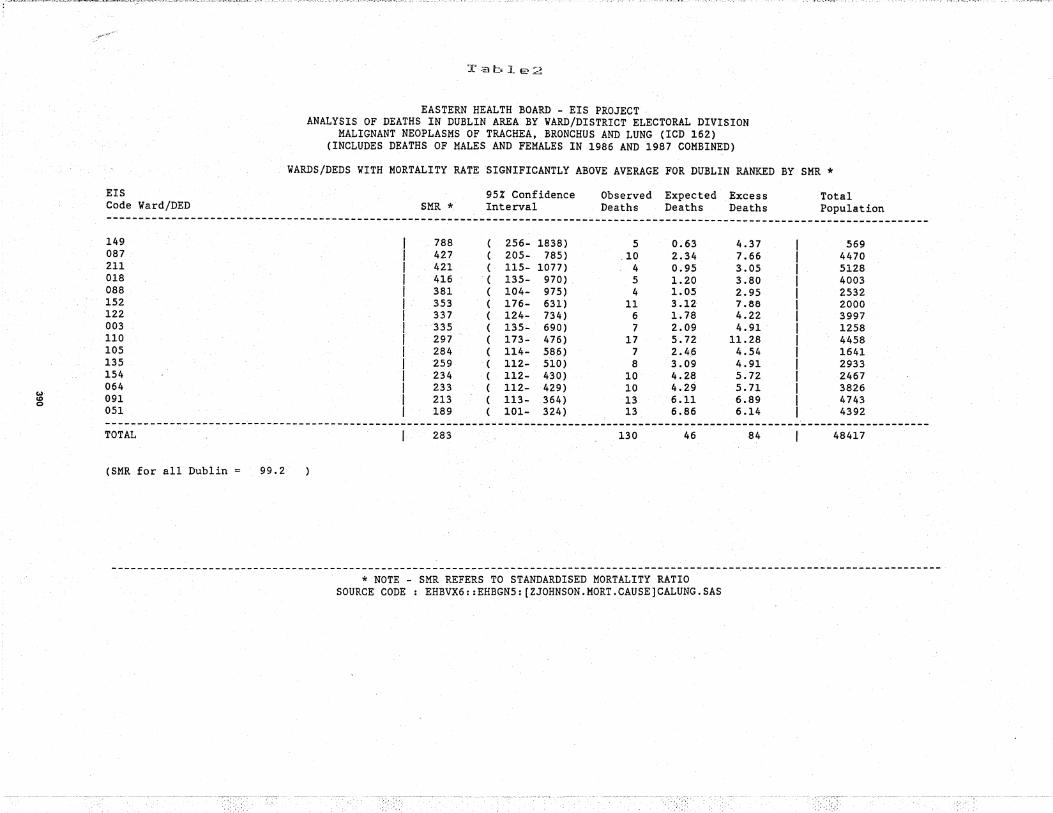
Table 2 shows is a standard report which provides the SMR for each DED where the mortality rate is significantly above average for Dublin as a whole. The names of individual DEDs have been suppressed in this example but the 3 digit EIS codes are printed at the left hand margin.
384

This report relates to lung cancer, but a simiiar one can be produced in about five minutes for any disease or group of diseases by selecting records from the mortality dataset based on the cause of death. This is coded in accordance with the International Classification of Diseases.
The following calculated variables are provided for each DEi> on the "above average list" ; the SMR, 95% CI, observed (actual) number of deaths, expected number of deaths, excess deaths (observed minus expected), and the total population of the DED. Totals are printed at the bottom of the table. The total exceSs deaths indicates how many lives .wouid be saved if the death rates in the above average DEDs could be lowered to the average for Dublirt as a whoie.
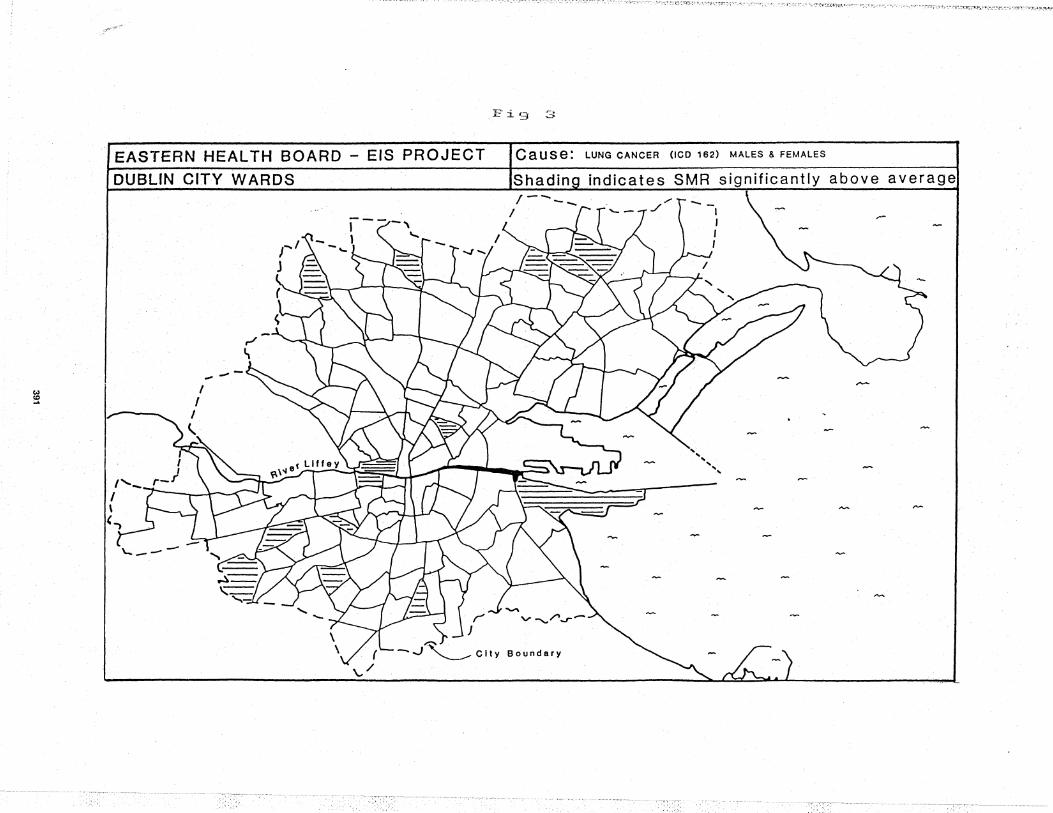
This table was also produced using the PUT statement which is particularly useful when detailed reports are required on marty different subsets of a dataset. Fig 3 is a map derived from Table 2 and shows the pattern of lung cancer mortality in Dublin city.
These findings and those relating to other diseases will now require investigation by local public health staff, after which it is hoped specific intervention programs can be developed to try to reduce excess mortality.
THE FUTURE
Development of the EIS to date has demonstrated that the bringing together of a variety of health-related datasets within a health board computer system combined with the techniques of small area analysis using SAS can produce much useful information. Although we have been hampered by limited human resources we plan to expand the EIS in a number of direCtions.
First, we are in the process of digitis.inga map of the Eastern Health Board DEDs with a view to automatic production of "black-spot" maps using PROC GMAP. Second we intend to make our most frequently requested anaiyses available health care staff at large using menu-based SAS/AF applications. Thirdly we intend to expand our activities to encompass further datasets such as birth related data. Finally we hope to extend our automatic address matching to other counties, and to improve the matching rate.
* SAS, SAS/GRAPH, SAS/FSP, SAS/AF are registered trademarks of SAS Institute !nc .• Cary, NC t USA.
---~---------------~-------~----~-~-------------~--------------------------~---
385

Acknowledgements
This study was made possible only with the help of a large number of people in several organisations. We wi.sh to acknowledge the particular .role played by the following:
Eastern Health Board
Fred Donoghue, Programme Manager; Noel McNee, Management Services Officer; Jim Donleavy, Programmer; Brian O'Herlihy, Director of Community Care; Howard Johnson, Senior Area Medical Officer;
Central Statistics Office
Donal Garvey, Senior Statistician; Kevin McCormick, Statistician; Evelyn Byrne, Higher Executive Officer; Emer McGeogh, Higher Executive Oficer; Neill 0' Rahilly, Staff Officer;
University College Dublin
Leslie Daly, Medical Statistician, Department of Community Medicine.
REFERENCES
1. Carstairs V. Small area analysis and health service research. Community Medicine, 1981; 3: 131-139.
2. Carstairs V. Small area analysis: Creating an area base for environmental monitoring and epidemiological analysis. ComDiunity Medicine, 1986; 8 (1):15-28;
------.---------------~---------------------------------------------------------. .
Z Johnson P Dack
Management Services Division Eastern Health Board 1 James's St Dublin 8 Ireland
Tel (01)537951 FAX (01)533879
386

I EPIDEMIOLOGICAL INFORMATION SYSTEM I
LOCAL POPULATION I'ROALES
lEIS
INTEGRATION ANALYSIS
SAS@SYSTEM(VMS)
CATCHMFNf AREA S11JDIES
TABLES GRAPHS
MAPS
BLACKSI'OT MAPS
387
SERVICE UPTAKE I'ATERNS
ENVIRONME/'.'fAL S11JDIES
@ EHB EIS 1989
.;'
~r'::';lbl.e :l
EASTERN HEALTH BOARD - EIS PROJECT SUMMARY REPORT OF 1986 CENSUS DATA
AREA: ALL EASTERN HEALTH BOARD AREA
TOTAL POPULATION: DEPENDENCY RATIO:
REPRODUCTIVE PROFILE:
1232238 58
No.·of children under 1 year Estimated Crude Birth Rate 1985 Estimated General Fertility Rate 1985
= 21,179 - i7.2 /1000 POPULATIOM
65.3 /1000 FEMALES 15-49
AGE PROFILE:
Pre-school Primary School Secondary School Third Level Younger Adults Older Adults Geriatric
HOUSEHOLD PROFILE:
AGE GROUP
0-4 5-12 13-17 18-24 25-44 45-64 65+
Total
MALES
56135 95277 61809 81897
166758 95573 41352
598801
FEMALES TOTAL PERCENT
52751 108886 8.8 90340 185617 15.1 58700 120509 9.8 85116 167013 13.6
174313 341071 27.7 105254 200827 16.3
66963 108315 ·8.8
633437 1232238 100.0
TYPE OF HOUSEHOLD NO. PERSONS NO. HOUSEHOLDS AVG PERSONS/ HOUSEHOLD
3.46 3.15
31.78
Permanent (Private) Temporary (Private) Non-Private
All Households
1190768 5913
35557
1232238
FAMILY PROFILE (NO. OF FAMILY UNITS): CHILDREN CHILDREN ALL <15 ALL >15.
Couples - no children Couples & children 91859 42493 Father & children 1156 4198 Mother & children 10208 17543
Total family units 103223 64234
344232 1878 1119
347229
OTHER
42535 856
3971
47362
No. of family units with youngest child aged under 5
LIVING ALONE PROFILE:
3.55
TOTAL UNITS
44768 176887
6210 31722
259587
77,441
AG.E .GROUP NO. OF PERSONS % OF AGE GROUP
Under 65 39842 Over 65 24714
Total 64556
FOR FURTHER ANALYSES OF 1986 CENSUS DATA CONTACT: EIS PROJECT TEAM, TEL (01)537951
(SOURCE CODE: EHBGN5:{.CEN]EHB5C.SAS)
388
3.5 22.8
5.2
:.'
r.i'3 2
EASTERN HEALTH BOARD - EIS PROJECT ANAL YS I S OF MORTAL lTV FOR DUBLI N gEDS IN 1986 AND 19B7
FREQUENCY DISTRIBUTION OF SMRS
FREQUENCY 110
100
90
80
70
60
50
40
30
20
10
40 60 80 100 120140 160 180 200
SMR MIDPOINT
389
.. ==.= .. ~.~_~_= ~~~<;;:~~:r'-::::"'i~"""~·~-"~_·~(~::'-:'~~·"'.-:'.~GTC7.:'".:."'~~.~·:~"';,r:$.,~.>""7;.~~';;-:::r;--7..-":::':t'f'...:':.'::"":-"'-:.~·i''':T'f'.'.''':''::"'-~·~'"!'''::-~~7'---'-'_~!.''-: " ...... ~. "',-;,:,,~ '. 7 :,t::.,~~~"'~~'~-.-.:,~~~.'-.-,~;,,~<.' :-J'"!,Hf.~ ~ ".: .,~":'. ~""~.": '; ':. ~~yt~" ;", _ ~r.~·'(:, :', ~~ ~- .. -'" :~.",~"".-,;'":->-,- ",-",., ,.'! .. ~:!"f\.!'~~~'.Jo:-."'~'- '~~_-,-.> ;"'~ ~..t~'*·~'"'r .
w· co 0
.EIS Code Ward/DED
T.3ble;;.::;
EASTERN HEALTH BOARD - EIS PROJECT ANALYSIS OF DEATHS IN DUBLIN AREA BY VARD/DISTRICT ELECTORAL DIVISION
MALIGNANT NEOPLASMS OF TRACHEA, BRONCHUS AND LUNG (ICD 162) (INCLUDES DEATHS OF MALES AND FEMALES IN 1986 AND 1987 COMBINED)
VARDS/DEDS VITH MORTALITY RATE SIGNIFICANTLY ABOVE AVERAGE FOR DUBLIN RANKED BY SMR *
SMR * 95% Confidence Interval
Observed Expected Excess Deaths Deaths Deaths
Total Population
----------------------------------_._----------------- ------~-------------------------------------------------~------------------
149 788 ( 256- 1838) 5 0.63 4.37 569 087 427 ( 205- 785) .10 2.34 7.66 4470 211 421 ( 115- 1077) 4 0.95 3.05 5128 018 416 ( 135- 970) 5 1.20 3.80 4003 088 381 ( 104- 975) 4 1. OS 2.95 2532 152 353 ( 176- 631) 11 3.12 7.88 2000 122 337 ( 124- 734) 6 1.78 4.22 3997 003 335 ( 135- 690) 7 2.09 4.91 1258 .. 110 297 ( 173- 476) 17 5.72 11.28 4458 105 284 ( 114- 586) 7 2.46 4.54 1641 135 259 ( 112- 510) 8 3.09 4.91 2933 154 234 ( 112- 430) 10 4.28 5.72 2467 064 233 ( 112- 429) 10 4.29 5.71 3826 091 213 ( 113- 364) 13 6.11 6.89 4743 051 189 ( 101- 324) 13 6.86 6.14 4392
. . ----~-----------~----------------------------- -----------------------------~------------------------ ---------------------------TOTAL 283 130 46 84 48417
(SMR for all Dublin = 99.2
---------------------------------------------------------------------------------------------------------------------------------* NOTE - SMR REFERS TO STANDARDISED MORTALITY RATIO
SOURCE CODE: EHBVX6::EHBGN5:[ZJOHNSON.MORT.CAUSE]CALUNG.SAS
E" :i ~3 ... ~-~ ..::>
EASTERN HEALTH BOARD - EIS PROJECT Cause: LUNG CANCER (lCD 162) MALES 8. FEMALES
DUBLIN CITY WARDS Shadina indicates SMR significantly above average
I
,.-.
~