a guide for preparing, mapping, and linking logistics data
TRANSCRIPT

A Guide for Preparing Mapping and Linking Logistics Data to a Geographic Information System
FEBRUARY 2012
This publication was produced for review by the US Agency for International Development It was prepared by the USAID | DELIVER PROJECT Task Order 4
A Guide for Preparing Mapping and Linking Logistics Data to a Geographic Information System
The authors views expressed in this publication do not necessarily reflect the views of the US Agency for International Development or the United States Government
USAID | DELIVER PROJECT Task Order 4 The USAID | DELIVER PROJECT Task Order 4 is funded by the US Agency for International Development (USAID) under contract number GPO-I-00-06-00007-00 order number AID-OAA-TO-10-00064 beginning September 30 2010 Task Order 4 is implemented by John Snow Inc in collaboration with Asociacioacuten Beneacutefica PRISMA Cargo Management Logistics Crown Agents USA Inc Eastern and Southern African Management Institute FHI 360 Futures Institute for Development LLC LLamasoft Inc The Manoff Group Inc OPS MEND LLC PATH PHD International (a division of the RTT Group) and VillageReach The project improves essential health commodity supply chains by strengthening logistics management information systems streamlining distribution systems identifying financial resources for procurement and supply chain operation and enhancing forecasting and procurement planning The project encourages policymakers and donors to support logistics as a critical factor in the overall success of their healthcare mandates
Recommended Citation Inglis Andrew 2012 A Guide for Preparing Mapping and Linking Logistics Data to a Geographic Information System Arlington Va USAID | DELIVER PROJECT Task Order 4
Abstract This guide is an introduction on how to integrate logistics management information systems (LMIS) with geographic information systems (GIS) It covers the value of integrating these two systems the steps in assessing if it is currently viable to link the systems how to set the linkage the processes for using LMIS within a GIS platform and finally how to sustain the linkage The aim of this guide is to assist logistics managers decisionmakers and technical experts in understanding the value of integrating GIS and of the process involved in integrating these two systems
USAID | DELIVER PROJECT John Snow Inc 1616 Fort Myer Drive 11th Floor Arlington VA 22209 USA Phone 703-528-7474 Fax 703-528-7480 Email askdeliverjsicom Internet deliverjsicom
Contents
Acronyms and Definitions vii
Acknowledgments ix
Introduction 1 Why Is a GIS Important for Logistics 1 What Are the Key Considerations 2 How Do You Link an LMIS and a GIS 2 How Can You Use a GIS to Analyze LMIS Data 3
Where Do You Begin 5 Establish a Timeline 5 Review and Plan 6 Determine Required Resources 6 Build Capacity 8
Review Existing Data and Plan for Linkage 9 Determine the Desired GIS Output 9 Review Existing Data 9 Prepare to Generate the Linkage 11
Create the Linkage 15 Unique Identifier 15 Generate a Crosswalk Table 16 Set up a crosswalk table to link GIS data to LMIS data 17
Link and Map LMIS Data in the GIS 19 Define the Message and the Audience 20 Link the Output File to the GIS Dataset 24 Generate GIS Outputs and Maps 27 Review and refine outputs 29
Sustain the GIS and Its Linkage 31 Design a Process for Integrating GIS 31 Maintain the Crosswalk Table 33 Build Human Resources Capacity for Linking and Mapping LMIS Data34
Conclusion 37
References 39
v
Appendix A 41
Method of Coding and Naming 41 Naming Conventions 41 Coding Structure 41
Appendix B 43
GIS References 43 Introductory GIS Training 43 Other Training Resources 44 GIS Data Resources 44
Figures 1 From an LMIS Database to a GIS Map Converting Tables of Data to a Visual Image1 2 Determining the Level of Matching Data 13 3 Example of a Crosswalk Table 16 4 Steps to Link the LMIS to the GIS 19 5 Prepare Indicator Data for Mapping 21 6 Format Numbers 22 7 Graduated Symbology or Class Symbology 22 8 Time Series for Logistics Management Information System Data 23 9 Formatting Data Tables (service delivery points) 24 10 OCBD Live Linkage 25 11 Evolution in Using a Global Information System 28 12 Map Production Timeline 32
Tables 1 Integrating a GIS with an LMISmdashIllustrative Timeline for Activities 49H5 2 Quality Ranking for Global Information System Data 50H12
vi
Acronyms and Definitions Esri Earth Sciences Resources Institute
GIS geographic information systems (generic)
GPS global positioning system (generic)
HMIS health management information system
JICA Japan International Cooperation Agency
LMIS logistics management information system
MampE monitoring and evaluation
MFL master facility list
MOH Ministry of Health
MIS management information systems
PDA personal digital assistant
QGIS Quantum Geographic Information Systems
RHIS Routine Health Information System
SAM Service Availability Mapping
SPA Service Provision Assessment
SDP service delivery point
USAID US Agency for International Development
WHO World Health Organization
Definitions crosswalk table Two-column table that establishes a one-to-one relationship between two databases
data extraction Selection and organization of data from the LMIS database that meets the defined section criteria
gazette location A list of known locations used when searching by name to find corresponding geographic coordinates
mapping Process of visually representing data on a map
master facility list List of health facilities managed by the Ministry of Health
service delivery point (SDP) list List of SDP locations that receive commodities
unique identifier Specific descriptive characteristic that is guaranteed to be one-of-a-kind among all other descriptions used for an object
vii
viii
Acknowledgments This publication was made possible the through the contributions of Ashley Smith Charles Nzamutuma Jeremy Sikazwe Norbert Pehe and Pat Shawkey Special thanks to both the Rwanda and Zambia field offices for their insights and support in testing and generating the link between their LMIS and GIS systems Also thank you to David Papworth and Lilia Gerberg for their valuable feedback and to Gus Osorio for his work on the design and layout
ix
x
Introduction Integrating a geographic information system (GIS) with a logistics management information system (LMIS) will make the data in the LMIS database readily available for decisionmaking In this guide you will learn the value of linking a GIS and a LMIS and you will learn the steps you need to take when you link the two systems By taking advantage of visualization (data placed on a map) and spatial analysis (logistics data based on geography) to link the two systems you will discover new and valuable ways to use data
Since 2009 many countries have adapted GIS to improve how they manage their public health systems Today many service delivery points (SDPs) include geographic coordinates as one of their reported characteristics which also include the facility name type and ownership (publicprivate) At the same time countries are expanding the use and functionality of electronic LMIS databases By taking advantage of better geographic data and improved electronic LMIS capabilities you can link and use a GIS with LMIS data
In addition new web mapping toolsmdashGoogle Earth and other GIS software optionsmdashoffer improved opportunities for mapping and sharing data With these new options it is possible to map data in an LMIS without expensive technology or technology experts making the linking of GIS and LMIS more affordable feasible and sustainable
Why Is a GIS Important for Logistics A GIS is a map directly connected to a database With respect to logistics a GIS can transform information from an LMIS database into a map Thus a GIS becomes a portal into the LMIS data giving you a new way to explore analyze share and synthesize data With LMIS data displayed in this innovative visually appealing way you can engage a broader audience and approach data from a new perspective Furthermore GIS can organize context for large amounts of data For example a GIS can visually display the stock level of commodities at 1000 service delivery points (SDPs) in a specific country then at a glance you can see stock status and most important be alerted to impending stockouts Figure 1 shows how you can visualize LMIS data on a map
Figure 1 From an LMIS Database to a GIS Map Converting Tables of Data to a Visual Image
1
A GIS enables you to better leverage the data and information stored in an LMIS database bymdash
increasing access use and value of the data within the LMIS database
providing a mechanism for communication and feedback
conducting spatial analysis of the supply chain (eg transportation modeling)
integrating with other data sources (eg routine health information)
creating one map that can be used for multiple purposes
What Are the Key Considerations While linking a GIS to an LMIS offers many advantages it does entail a significant investment of time and resources At the onset stakeholders must be clear about their expected outcomes
If you use inaccurate or inappropriate information when you link a GIS to an LMIS the GIS may not produce a map that accurately depicts your message and may in fact lead you to the wrong conclusions Therefore first and foremost you must ensure that the data is of the highest quality possible
Before you decide to invest in incorporating a GIS into an LMIS you will need to put a number of elements in place These elementsmdashnamely physical datasets (GIS and LMIS) procedures for integration and political and financial commitment to sustain the linkagesmdashare the keys to effectively using a GIS within a logistics context
In addition you need to ensure that decisionmakers will regularly ask for GIS output (eg interactive maps spatial models animations) A GIS is most beneficial when it is used continuously rather than occasionally or as a one-time tool periodic feedback and updates will improve the quality of the output
When you plan how to link the GIS remember the LMIS data must be easily accessible Therefore you must minimize the time between the request for the GIS maps and the time it takes to produce the maps so they are timely and are quickly available for decisionmakers
Finally a GIS requires human resources and training To train experienced LMIS database staff to use a GIS they must already have specific abilities including the ability to write queries and generate new tables within the LMIS database An ideal capacity-building approach includes a mixture of GIS workshop training and ongoing on-the-job training
How Do You Link an LMIS and a GIS To maintain the data quality you should build GIS linkages into the LMIS procedures already in place always considering the environmental context and the history and design decisions behind the LMIS implementation
Use three main steps to incorporate a GIS into the LMIS system
1 Review the existing data and plan for linking the LMIS to a GIS infrastructure (chapter 2)
2 Build the connection between the LMIS and GIS (chapters 3 and 4)
3 Document build capacity and create processes for sustaining the linkage between the LMIS and GIS (chapter 5)
2
How Can You Use a GIS to Analyze LMIS Data After the LMIS is linked to a GIS you will find many opportunities for using the LMIS data to manage and plan supply chain activities including quantification transportation modeling and costing By incorporating GIS into these activities you can use geography in beneficial ways that were not previously available
One of the most common powerful uses for a GIS is to assist in targeting resources For example a GIS can create a map showing the SDPs that regularly have problems with reporting This enables managers to target resources better and to justify where and why support is needed for supervision and training
Of course this information is in the LMIS but if you can show managers a map of the sites that need assistance they may be able to detect patterns strategically plan supervision visits or suggest that higher-performing sites mentor lower-performing sites
Managers can visit the SDPs and subsequently visually show the impact of the support or highlight a continuing issue A GIS can point the way to better targeted actions explain the actions to others plan how to use the available resources and visually show the impact When a GIS is linked to an LMIS you can view the LMIS data from an entirely different perspective
You should also consider other health sector databasesmdashfor example health management information systems (HMISs) finance and human resources You can use a GIS to link data between different databases and compare it to related information from different sources at the same geographic location For example if the human resources database contains the duty station of the pharmacy staff and their training and it is linked to a database that contains the quality of the supply chain data the linkage can show the impact of the pharmacy staff training on the quality of supply chain data at the facility level You can also integrate a GIS with other data if you link tomdash
other health-related datasets human resources and finance
non-healthndashrelated datasets roads demographics socioeconomic education and others
Often the motivation for integrating a GIS originates from a specific goal (ie my manager wants a map of X) However after the linkage is established this technology opens up new opportunities beyond what was initially envisioned
Other examples of how you can use a GIS with LMIS data include the following categories
Advocacy By using maps to look at LMIS data you and others can better understand what the data
meansmdashdata are transformed into a meaningful picture of the supply chain performance within the context of the countryrsquos health system and geography
Maps encourage discussions between staff from the district or regional level and the national or central level by providing a common context and a point of reference for the discussion For example stakeholders can see how a new initiative is progressing in one district compared to another district
3
Program planning Review existing and past activities to understand where activities have occurred directly target future plans identify and pinpoint problematic geographic areas for maintaining continuous supply obtaining timely accurate data and others
System design To help evaluate design options and decide where to pilot test interventions discuss and plan design or redesign strategies with stakeholders at the different levels For example if a country is considering redesigning its delivery system by bypassing the regional level mapping can help assess the impact of the redesign on stockouts or product availability
Advanced application including spatial analysis After the GIS is well established you can use it formdash
network modeling to optimize the transport and storage network for the supply chain
system modeling to predict the potential impact of policy changes on the supply chain
4
Where Do You Begin When considering GIS activities you must take four important steps
1 Establish a timeline
2 Review and plan
3 Determine required resources
4 Build capacity
Establish a Timeline A timeline is the length of time for each activity based on the recommended resources You should allow six to 12 months to set up the linkage and build the GIS capacity You should also integrate the GIS and LMIS in two distinct levels over time The first level will help management plan make decisions and strengthen the system Only after you establish this level of integration and its outputs should you move to the second level of integration This level includes more sophisticated applications such as transport logisticsmdashusing a map or model to optimize a countryrsquos transportation needs Table 1 presents a typical timeline for integrating a GIS with an LMIS
Table 1 Integrating a GIS with an LMISmdashIllustrative Timeline for Activities
ACTIVITY MONTHS
1 2 3 4 5 6 7 8 9 10 11 12
Review and plan
Determine required resources
Collate GIS data
Generate linkage (crosswalk table)
Build capacity for GIS
Maintain linkage (crosswalk table)
Develop ability to product GIS outputs
Maintain the linkage
5
Review and Plan To create and sustain the linkage between a GIS and the LMIS you must first assess the existing infrastructure (ie datasets software and human capacity) of both systems Based on this information you can generate a plan
Review the essential elements
demand for GIS maps to manage and strengthen the supply chain
electronic database of the LMIS with its data segregated by SDP
geo-codes (a location that can be mapped or placed on a map) for health facilities
human resources to build and maintain the linkage between the GIS and LMIS
During the review process determine if the necessary components are available and if the GIS will be able to produce what is expected
After you complete the review generate a plan for how to link the LMIS datasets to the GIS infrastructure and for how to maintain the linkage over time
The plan should include strategies formdash
1 identifying the desired GIS output (maps and others)
2 obtaining GIS software
3 identifying sources of GIS data
4 reviewing (and adjusting where necessary) the naming and coding conventions for SDPs
5 outlining the plan to connect the datasets
6 training staff to build GIS capacity
7 establishing procedures to sustain links between the LMIS and GIS
The level of resources required to implement the plan will depend on the existing infrastructure and the type of GIS outputs envisaged The plan should outline how the GIS will be integrated within the context of the existing LMIS and the available resources
Determine Required Resources When you develop a plan for implementing the GIS your goal should be to work with the existing resources whenever possible Only when it is necessary should you bring in additional human resources or purchase software and hardware
Staffing The two key staff members are the data manager and the monitoring and evaluation (MampE) advisor Increasing their existing scope of work will create additional workload in the initial phase (allow six months) while they are establishing the linkage and mapping the outputs for the LMIS data If the first six months of the implementation are well designed it will require less of their time in the long term to maintain and generate data The goal is to create a system that minimizes the effort required to sustain the linkage between the GIS and the LMIS allowing staff more time to focus on the application and use of the data
6
0
The estimated staff time required during the first year of linking a GIS with an LMIS is summarized below
Initial PhasemdashEstablishing a GIS linkage (six months)
Management
Project managermdashoversees the process (10ndash15 percent of time)
Technical staff
Data managermdashcreates the crosswalk table (see Create the Linkage) sets up maintenance processes sets up database linkage (40ndash50 percent of time)
Monitoring and evaluationmdash creates the crosswalk table sets up maintenance processes and sets up the mapping and GIS outputs (40ndash50 percent of time)
Technical support
GIS advisormdashgives GIS training to technical staff supports technical staff in planning and sets up the maintenance processes (15 percent of time)
Application of GIS linkage (after sixndash12 months)
Management
Project managermdashoversees the process (5ndash10 percent of time)
Technical staff
Data managermdashmaintains crosswalk table and database linkages (10ndash20 percent of time)
Monitoring and evaluationmdashgenerates mapping and GIS outputs allocates time depending on level of sophistication of GIS applications used for the project (25ndash50 percent of time)
Technical support
GIS advisormdashsupports technical staff in on-going development of GIS skills and applications (up to 5 percent of time)
Determine GIS software When selecting GIS software the goal is to invest in software that simplifies the link between the LMIS and the GIS as much as possible using software from the same family usually supports the technically easiest linkage Considering this the main factors to consider when selecting either open source or proprietary software are a cost analysis and an assessment of the software currently being used for the LMIS database
If you use open source software for the LMIS database (ie MySQL Postgres) the best choice for GIS software is also open source such as the Quantum Geographical Information System (QGIS) (Quantum GIS website) This product is growing in popularity for organizations where the cost of proprietary GIS software is prohibitive
If you use proprietary software for the LMIS (ie Microsoft Access) then we recommend the Earth Sciences Resources Institute (Esri) ArcGIS (Esri website) Often called the gold standard of GIS software ArcGIS is available at many different levels For the work described in this guide we recommend ArcGIS ArcView or ArcGIS Basic as the platformsF
1 The goal is to simplify the ability
1 Esri is changing the naming of ArcView to ArcGIS Basic
7
to link the LMIS and the GIS datasets as much as possible using software from the same family makes the linkage work
A third approach is to combine both open source and proprietary software because the GIS data can be easily exchanged between the different programs Even if multiple people need access to the GIS all the users may not have the proprietary GIS software The solution is for the lead person on the project to have the license to use the software to link the GIS and LMIS others can use open source GIS software to analyze the data Additionally QGIS and ArcView are similar in many ways as soon as a user is comfortable using one type of software they should be able to use another program particularly if their main function is to link and map LMIS data (See appendix B for a list of training materials for QGIS and Esri software)
Apart from GIS software we also recommend that you purchase several global positioning system (GPS) handheld units or GPS-enabled mobile phones to use with ad hoc data collection and special needs of the LMIS systemmdashfor example warehouse locations
Build Capacity When linking a GIS to an LMIS try to build on the existing human resources and develop the skills to use GIS as part of existing workplace functions Using the existing staff builds skills in people who are already familiar with the data and understand how to use the data in the LMIS to strengthen the supply chain
The training for staff while customized for each organizationoffice has two main components
training staff to generate and maintain the linkage between the LMIS and GIS
training staff to use this linkage to create GIS outputs which will be used for analysis and decisionmaking on current and future activities
Staff training should combine a workshop with ongoing on-the-job training The workshop should only occur after the LMIS and GIS data are available and ready to be linked A typical workshop is five days followed by an equal amount of time dedicated to on-the-job training The aim is to build both technical skills in using GIS and an understanding of how GIS can be used to support and improve existing activities
Synchronizing GIS capacity building with linking GIS and LMIS datasets A critical stage of the process is generating the linkage between the LMIS and GIS After you generate the initial link you should be able to see the potential value that a GIS can add to LMIS data Therefore capacity building and creating the linkage should occur together Decisionmakers need to know how the data is linkedmdashthen they will understand and appreciate both the potential value and the limitations of linking For example in Zambia the process of linking the GIS to the LMIS data enabled the management information systems (MIS) advisor to identify where he could use maps to visualize the LMIS he demonstrated this by presenting mapping of the LMIS data at a planning meeting
8
Review Existing Data and Plan for Linkage Determine the Desired GIS Output Before you look at the LMIS or GIS data you must determine what level of GIS output you need this decision depends on the quality of the data GIS outputs have two main levels (1) data visualization and (2) spatial analysis
Data visualization requires that at least 70 percent of all SDPs have a geo-code
Spatial analysis requires higher-level GIS data quality than data visualization you must be able to map at least 95 percent of the SDPs It also requires additional time and resources to collate and review the GIS data
Review Existing Data Before you can link a GIS to an LMIS you must satisfy two main data requirements
An electronic LMIS database that can be disaggregated to the SDP level
Validated GIS data from the SDPs
The first task is to review the LMIS database and the existing GIS data that are available from SDPs During this review you will assess the data and prepare it for linkage The review will also help determine if you have all the parts available to efficiently and effectively make the link
If during the review you identify an insufficient level of GIS data or quality issues with the existing GIS data available you may need to adjust the expectations for outputs In the beginning at least 70 percent of the SDPs must have GIS data available If this GIS data are not available you will need resources to collect the missing data or your team may want to reconsider whether the systems are ready to link with each other
The second task is to plan how to link two datasets as described below After the datasets are linked you need to continue efforts to strengthen the linkage between them
GIS data of service delivery points To map the LMIS data you will need the geographic locations of all the facilities including SDPs and warehouses You can use many different sources for the geographic locationsmdashGPS units to collect the location asking the Ministry of Health (MOH) for the geo-coded facility list or gathering location information during facility surveys Usually you will have to combine various sources to build and maintain a complete GIS dataset for all the SDPs
9
Box 1 Health Facility List in Rwanda
The Ministry of Health (MOH) in Rwanda has a geo-coded list of 516 facilities that you can download from the ministryrsquos web site (Republic of Rwanda Ministry of Health website) The list includes the region district and sector boundaries the health management information system department at the MOH updates it regularly
This first step in gathering GIS data from the SDPs is to contact the health management information system (HMIS) department at the MOH and ask if the list of health facilities is geo-coded Many MOHs now recognize the advantages of establishing geo-coded health facilities datasets and they are building and maintaining lists they can share To assist with verifying and updating the facility list and geo-codes most database managers have set up feedback mechanisms for dataset users that can over time help improve the lists The more the lists are used the more robust the feedback which improves the completeness accuracy and timeliness of the data (see Sustain the GIS and Its Linkage)
If the MOH has a facility list but it is not geo-coded the organizations that have been involved in facility surveys can be helpful because most facility surveys include the collection of GPS locations Examples of such surveys include the Service Availability Mapping (SAM) from the World Health Organization (WHO) Facility Census from the Japan International Cooperation Agency (JICA) and Service Provision Assessment (SPA) from the MEASURE Demographic and Health Survey You can use a facility survey list with GPS location data as the baseline for building the GIS dataset of SDPs
After collecting the GIS data from outside sources you will need to fill in the missing geo-codes for the SDPs and warehouses that are not included on an MOH list or a facility survey list For this step use GPS units or GPS-enabled devices (smartphones PDAs cameras etc) You can collect this data when conducting field visits to these facilities (for example supportive supervision delivery of products collection of reports and others)
Having a geo-coded facilities list is a good foundation for a geo-coded SDP list it will reduce the number of site-level geo-codes that you need to collect For example in Zambia by using the lists of geo-coded health facilities the USAID | DELIVER PROJECT staff were able to geo-code 81 percent of all SDPs in the LMIS database This significantly reduced the number of SDPs they needed to physically visit with GPS units
Linking electronic LMIS data To link LMIS data to a GIS the data must be in both electronic format and disaggregated by location (ie SDP district etc) You must understand the structure of the LMIS database when you integrate GIS into a LMIS infrastructure because the structure dictates what LMIS data you can map
The structure of the LMIS database also affects the level of difficulty when linking to GIS datasets The critical questions are to what geographic level can data be disaggregated and how well can the geographic information be maintained over time Based on reviews of electronic LMIS systems in Rwanda and Zambia the LMIS is typically disaggregated to the SDP level because the list of unique SDPs already have unique identifiers these identifiers are essential to maintain the integrity of the LMIS data However in both countries although maintaining the SDPs geographic information is desirable it is not essential for maintaining the quality of the LMIS data However when a GIS is incorporated it is essential to maintain the geographic information Keeping geographic information up-to-date not only adds value in terms of mapping LMIS data but it is also important when integrating information from other databases such as physical inventories and training rosters Analyzing these integrated datasets can assist with managing data quality supply management capacity building and advocacy
10
Prepare to Generate the Linkage After reviewing the existing datasets the next step is to prepare a plan for generating the linkage between the LMIS and GIS data
Complete three main activities
1 Strengthen the geographic information for the SDPs within the LMIS data (geo-coding)
2 Collate the existing GIS datasets
3 Plan a time to fill in the missing geo-codes between the LMIS and GIS lists of the SDPs
Note that the LMIS data will probably not match the GIS data 100 percent therefore prepare a strategy for increasing the LMIS and GIS data match to as close to 100 percent as possible
Strengthen the geographic information in the LMIS data The LMIS database has a table that lists the SDPs and their characteristics unique identifier name type address administrative region etc When you review the LMIS you must determine if this table is both complete and current If you see gaps or inconsistencies in the key fields they must be filled or resolved A common cause for inconsistencies is when data has not been kept up-to-date Review the SDP list to ensure that the SDP information is current
Your review should also identify and remove any duplicate SDPs duplicate entries create problems when you develop the linkage with the GIS data When removing the duplicate SDPs you must follow the protocols for maintaining the integrity of the LMIS For example before removing a duplicate SDP listing ensure that it will not cause problems for other queries within the LMIS that may be linked to this entry
Before linking the LMIS data to a GIS you must accurately complete four fields (see Generate a Crosswalk Table)
unique identifier
facility name
facility type
administrative location
Collate existing GIS datasets Before you link to the LMIS dataset you will also need to collate and compile into one list the GIS datasets collected from different sources Because multiple data sources may yield significant overlaps you must identify validate and remove duplicates from the GIS datasets When removing duplicates you must review the locations of SDPs and categorize them into three main groupings
1 Data are validated When the SDP name and location match in two different sourcesmdashadd it to the collated SDP list and mark as validated
2 Data to be validated If a SDP is in only one datasetmdashadd it to the collated SDP list and mark to be validated
3 Data to be validated If an SDP has two different sources and the name or location do not matchmdashreview the details and select the most accurate name and location mark it to be validated
11
By marking the SDP to be validated you are clearly indicating the sites that need to be checked either against another source or during a visit
At this point ensure that the GIS dataset has more locations than the LMIS The LMIS a sub-set of the GIS dataset should include all sites not just those receiving commodities If you have more sites in the GIS dataset than the LMIS you probably have a high match rate between the two datasets which will allow for valid use of the data
Quality Check the GIS Data Service Delivery Points After collating and compiling the GIS dataset you must assess the data quality The standard benchmark for using GIS datasets for spatial analysis is that the recorded coordinates of the site must be within 100 meters of its actual location and its recorded location confirmed against other sources To assess the quality of the GIS data you must compare the locations with other GIS datasets andor ensure it is validated by people who have local knowledge of the sites When you compare GIS datasets to each other a common method is to compare sites by administrative region (preferably at the district or ward level) If the reported location falls outside the specified area categorize the location as to be validated you will need to confirm this by using another source You can ask people with local knowledge to assess the quality of the data (Is this where this facility is located Is this facility on the road to the next town) If you cannot validate all the sites ask about at least ten percent so you can gain an understanding of the overall reliability of the data
GIS data are graded according to quality grades As shown in table 2 if the quality is not high it will limit how you can use GIS For example if the GPS locations appear in the correct administrative region and they are less than 1ndash2 kilometers from the exact location you can use the data for advocacy and national-level decisionmaking However you cannot use the same data for spatial analysis for an accurate basis for analysis the recorded location must be within 100 meters of the exact location
Table 2 Quality Ranking for Global Information System Data
Grade GIS Data Collection Method Data Usage
High GPS data that is validated against other sources All levels of visualization and spatial analysis
Medium GPS data or collected from highly detailed maps but is not validated against other sources
Visualization of data at national and regionalprovincial level including some spatial analysis
Poor Data collected from unknown sources or gazette locations and not validated against other sources
Visualization of data at the national level with caveats Not valid for spatial analysis
The more you use the GIS the more accurate the data will become Feedback reports enable users to identify quality issues within the GIS data this information can help correct inaccurate data and improve the quality of the GIS data
Method for validating geo-codes and collecting missing geo-codes After the GIS datasets are collated and checked for quality the next step is to plan how to collect the missing data and to authenticate existing GIS information categorized as to be validated
At this stage focus on the process and how to combine it with the existing activities for visiting SDPs Collecting GPS data takes less than 10 minutes and it is a simple taskmdashtherefore you can easily complete this when you visit SDPs for other purposes This cost-effective process increases the integration of GIS into the supply chain strengthening activities
12
You can use the same method to collect the missing geo-codes when you collect the locations of new facilities when collecting the geo-codes you can simultaneously do GPSGIS capacity building Train the staff who regularly visit SDPs to collect the GPS coordinates
The Logistics Indicators Assessment Toolkit (LIAT) developed by the DELIVER project explains how to use GPS units to collect GPS coordinates for the SDPs This toolkit includes the training materials necessary to efficiently train staff to collect the location information
You will also need to validate SDPs with missing location information by comparing the GPS coordinates to another GIS dataset (see Quality check the GIS data service delivery points) For GIS data categorized as to be validated compare the GPS data to the existing data if they match the location is validated If they do not match you need to investigate further
To determine what new GPS geo-code information you need to collect you must understand the level of matching and the desired GIS outputs The match rate to the LMIS data determines how you can use the GIS data as demonstrated in figure 2
Figure 2 Determining the Level of Matching Data
Proof of Concept Only
If the match level is less than 70 percent you will have a weak linkage that will probably produce inaccurate or incomplete visualization That in turn may misrepresent the data In this case you will need to collect additional GIS data before using the GIS to make decisions Having a plan on how to collect GPS coordinates before you link the data will enable you to respond quickly and cost effectively to collect the needed GPS coordinates
Box 2 Matching Data in Rwanda
In Rwanda the match between the existing global information system data and the logistics management information system is 75 percent for all service delivery points (SDPs) The match for male condom SDPs is 85 percent injectables is 84 percent implants is 85 percent and oral contraceptives is 84 percent You can do individual spatial analysis on each of the different commodities but do not do this for all commodities together because the match rate is only 75 percent
13
14
Create the Linkage After you prepare the appropriate databases you are ready to establish the connection or link between the GIS and LMIS data This section covers the technical aspects of how to generate the link includingmdash
using unique identifiers
generating a crosswalk table
preparing LMIS data to link with GIS
Unique Identifier A unique identifier is a specific descriptive characteristic that is guaranteed to be one-of-a-kind among all other descriptions used for an objectmdashin this case SDPs For an LMIS it is used to uniquely identify all SDPs within the LMIS database At a minimum for each object in most LMIS and GIS datasets there are at least two unique identifiersmdashpeople use one and the software program uses the other one
Staff often use the name of the facility for the identifiermdashthe name is known and easily recognized For example Iringa Regional Hospital is a facility in Iringa and it is the regional hospital For computer programs however to ensure absolute consistency we recommend numeric coding If the coding changes even slightly the computer cannot correctly match the data While a person can understand that Iringa Reg Hospital is the same as Iringa Regional Hospital a computer cannot distinguish the two identifiers as representing the same location
See appendix A for additional information on naming and coding conventions associated with unique identifiers
Logistics management information systemmdashunique identifier Most electronic databases have many unique identifiers that are used internally to manage the data within the database In the case of an LMIS we focus on unique identifiers associated with the SDPs For example in Supply Chain Manager (an LMIS software developed by the DELIVER project) the table of SDPs contains two unique identifiers Fac_Code and Fac_Name The Fac_Code is the primary unique key for the SDP it cannot be duplicated Although you can customize the coding structure in this field you must have a unique code value for each SDP Fac_Name like Fac_Code has customizable field name conventions and it must have a unique name for each SDP The table of SDPs must have at least two unique identifiers (1) the name of the site and (2) the site code Without these identifiers you cannot use the location of the site to link the LMIS data to the GIS data
In reviewing the unique identifiers for the electronic databasesmdash
You need to understand the naming and coding conventions - Document the conventions (1) how a facility name is recorded in the database and (2) how
the code is assigned To know how to use unique identifiers users need to understand them when they develop linkages to other databases
Ensure that the unique identifiers remain constant over time - If you refine the unique identifier it will remain unique over time (see appendix A for
additional information)
15
If the naming and coding conventions are based on an external source ensure that you understand how they are updated and how that affects the naming and coding in the LMIS - If the main source for the SDPs is from an external source use the original SDP list of
naming and coding conventions This will enable you to generate a link between your data and the external source If the MOH is the external source you will have direct linkage to any other database using the same coding within the MOH and its partners
- If the external source does not have all the SDP sites in the LMIS use the same naming convention and code structure but in addition insert another tag to identify that it is not currently on the external source When the external source is updated you must adjust the coding in the LMIS data naming and coding to match the updated list
The key to maintaining the quality of the SDP list is to document all changes when they occur
GIS datasetsmdashunique identifier It is becoming more common to geo-code health facilities and to share the geo-coded data Organizations recognize the value of sharing information about the location of all facilities in a region and increasingly ministries are expanding the master facility list (MFL) to include geo-coded facilities lists
Geo-coded lists of health facilities usually have two main unique identifiers (1) the name of the facility and (2) a code (usually numeric) assigned by the creators of the list If an external source (as with the LMIS) provides the geo-code you need to assess the unique identifiers to determine if the code identifiers can remain the same over time Is the way the dataset provider manages their dataset similar to the procedures you have for maintaining the SDP list If they do not match you may need to add a new identifier (see Sustain the GIS and its Linkage and the naming and coding conventions of the list in appendix A)
Generate a Crosswalk Table A crosswalk table which has two columns establishes a one-to-one relationship between unique identifiers in the two databases The table enables two independent databases to link across a common element and enables you to manage that linkage
The crosswalk table in figure 3 connects the source table (LMIS data) to the target table (GIS data) even though the names between the two datasets are not identical The target table on the left represents a database for example the MFLmdashit will be linked to the source table In this example the source table lists the number of doctors in each facility and the target table lists the number of beds at each facility The crosswalk table links the two data sources (the table has at least two fields) In this example the facilities in the target table are Hospital A Hospital B and so on In the source table the same facilities have slightly different names Hosp A Hosp B and so on The crosswalk table establishes a one-to-one relationship between the source table and the target table it links the two tables through a normal database join
Figure 3 Example of a Crosswalk Table
Source World Health Organization Forthcoming
16
Establishing a crosswalk table can be tedious but the benefits are worth the initial investment of time and staff resources A linking dataset is based on shared elements known as signature domain elements (name type administration) they determine the match of SDPs between the different databases Even if you use an existing matching code to generate the link you must still manually verify the link If the databases do not have a common code then you must link them manually After you generate the crosswalk table and verify the initial linkage you can use the table to link data at any time without regenerating the linkage
(See the Sustain GIS and Its Linkage for information on how to maintain the crosswalk table when changes occur)
Set up a crosswalk table to link GIS data to LMIS data The MEASURE Evaluation projectrsquos Signature Domain document (MEASURE Evaluation Project 2007) describes the key elements you need within a list of facilities if you plan to link datasets based on location You need five elements to link and confirm that the geo-codes are associated with the correct facility
Facility Name
Facility Ownership
Facility Type
Administrative Location (region district etc)
Geographic Coordinates
The Supply Chain Manager database (within the LMIS database) contains fields for three of the required elements in the signature domain
Facility Name
Facility Type
Administrative Location
Because the LMIS work under the USAID | DELIVER PROJECT focuses on public sector programs Supply Chain Manager does not contain a Facility Ownership field because the government usually owns all the facilities in the LMIS database
Using Facility Name Facility Type and Administrative Location you can make a crosswalk table from the matched sites The sites that cannot be matched still require geo-codes which you can collect when you visit the facilities for other purposes
To generate a crosswalk table when there is no common code the GIS dataset and the LMIS must have the following elements
GIS dataset Unique Code Facility name Facility Ownership Facility Type Administrative location (Region District etc) Geographic Coordinates
17
LMIS dataset Unique Code
Facility name
Facility Type
Administrative Location (region district etc)
Initially the Facility Name joins the datasets The signature domain elements help confirm the linkage between the two datasets For example it appears that Iringa Regional Hospital from the LMIS dataset matches Iringa RegHospital from the GIS dataset To confirm this ensure that the facility type is the same in both datasets and ensure that the administrative location is the same in both datasets If these elements match then the proposed matched locations between the GIS dataset and the LMIS dataset are correct and you can verify the link
The crosswalk table generated from this process has the following
LMIS Unique Code
GIS Unique Code
Facility Name
Facility Type
Administrative Location
Geographic Coordinates
To generate or update the GIS dataset from the crosswalk table place the geo-codes within the crosswalk table This will also simplify linking sharing and maintaining the geo-coded SDP list
The ease of joining two datasets based on the facility name will depend on the data quality of both lists and the extent of data cleaning by the database manager
Use the crosswalk table The crosswalk table identifies where there are and are not linkages between the datasets This helps the managers of both databases resolve missing matches and manage changes in the logistics-related databases You can look at the table and instantly see where the datasets are linked and where they are not linked (for example when you add a new site) You can also use crosswalk tables to link multiple databases and track changes in databases
We recommend that you establish a crosswalk table of SDPs that contains all the signature domain elements described previously plus all the unique identifiers that allow it to be linked to other databases Put the crosswalk table in a separate database to ensure that it can be linked to other databases (like a training database) or you can use it as part of the foundation for a new database
The process of creating the crosswalk table illustrates the importance of creating the linkage maintaining the unique identifiers and keeping the database well organized and structured
18
Link and Map LMIS Data in the GIS A crosswalk table links the data from the LMIS to the GIS To use the LMIS data in the GIS you need to organize the data so you can generate a map that is useful for decisionmaking An LMIS produces reports from the LMIS data this requires the use of internal queries and tables that organize and format raw LMIS data into a report that is easy to interpret and use for decisionmaking Similarly when linking an LMIS with a GIS you should organize and format the data in the LMIS to ensure the LMIS is easy to use and focuses on mapping the information that decisionmakers need
After you create a functional crosswalk table to bring the LMIS data into the GIS you will need to follow a four-step technical process to move LMIS data into a GIS platform to create outputs
The first step in the process is tomdash
1 Define the message for the maps and determine the audience
Complete the next three steps as many times as you need to until you are comfortable with the results
2 Link data from the LMIS to the GIS dataset
3 Generate maps and GIS outputs
4 Review and refine
This process is demonstrated in figure 4
Figure 4 Steps to Link the LMIS to the GIS
19
Box 3 Generating Maps Is an Iterative Process
In Rwanda and Zambia the initial discussions with the USAID| DELIVER PROJECT staff centered on the question ldquoWhat maps do you wantrdquo After the team answered the question they set a framework for the database queries to draw information out of the supply chain databases However when the team reviewed the initial maps it was obvious that they needed to refine the subset of data Discussions after the second set of maps led to further refining of the queries they also added new queries to develop the maps for decisionmaking By engaging in ongoing review and discussion about the maps as they were generated and refined the team created a final product that met the needs of the users and the project
Define the Message and the Audience Defining your message determines what data to selectmdashit is also a reference point to return to during the review process to ensure the final map contains the required information The message should focus on the information illustrated by the map for example ldquoWhat is the stock status of male condoms at SDPs for the last monthrdquo The defining message is not necessarily about interpreting the map but is more about the content of the map
You must also consider the audience for the maps and think about questions Will the intended audience want to see results that highlight successes or current challenges How will the audience interpret the map Based on the map what action will they take Because different audiences have different backgrounds and objectives they need different levels of information For example a map for donors that shows dissemination plans may need more background information than a map presented at an internal planning meeting
Box 4 Stay on Task
When creating a map write down the message and your intended audience as you create the map you will need to constantly refer back to the message When generating maps it is easy to become distracted by interesting patterns in the data If you write down the desired message it will help you stay focused on your objective
How the map conveys this message After you define the message the next step is to determine how the map will convey the message This step determines how to best map the data within the limitations of the data available For example when you map the number of commodities available at the SDP level what data should you extract from the LMIS How will the map represent changes in the number of commodities and over what time period The following points will help you answer these questions
Data extraction The selection and organization of data from the LMIS database that meets the defined section criteria
Which data meets the criteria for the message
- For example Number of commodities at an SDPmdashis it the number of currently available commodities at the SDP or is it the commodities that are available according to plan Make sure the data extracted matches the desired message
Mapping The process of selecting LMIS data and visually representing it on a map
What map layout and symbology (symbols) should you use
20
- Is the map going to be interactive for example and will it display the number of commodities at the SDP when the cursor hovers over the SDP on the map
Elements Key principles that will affect the data extraction and mapping
What level of disaggregation do you needmdashSDP district etc
- This defines the aggregation for all the extracted data
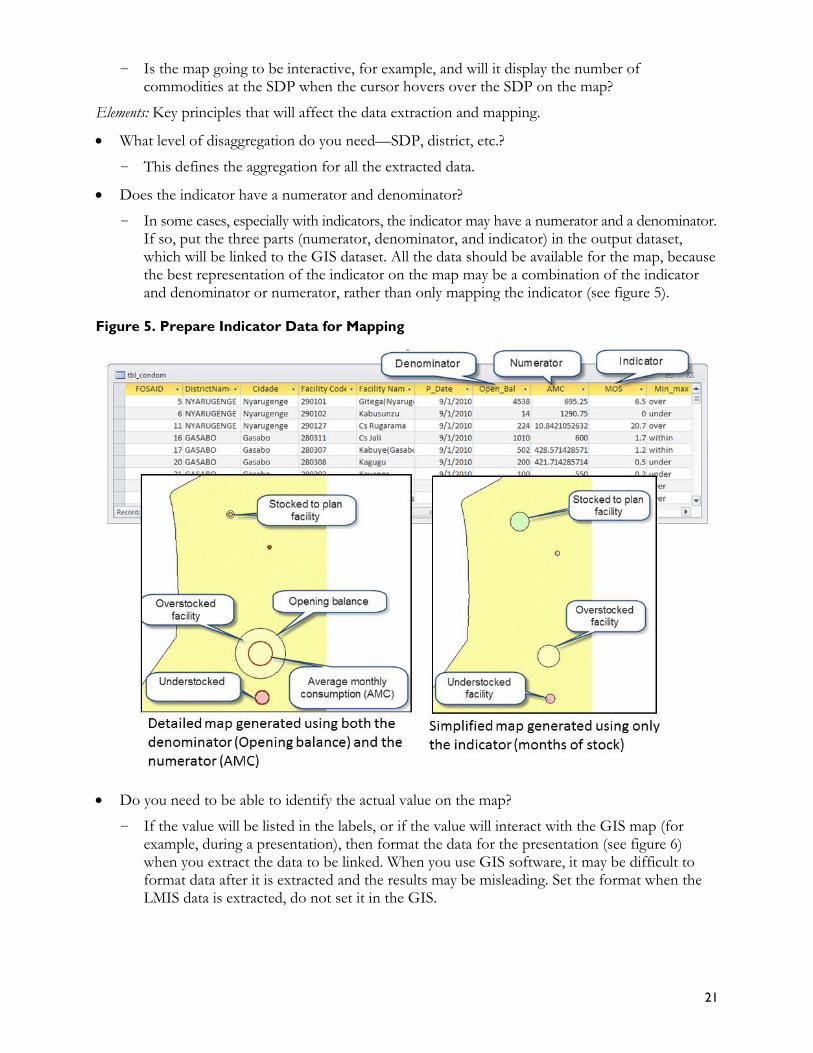
Does the indicator have a numerator and denominator
- In some cases especially with indicators the indicator may have a numerator and a denominator If so put the three parts (numerator denominator and indicator) in the output dataset which will be linked to the GIS dataset All the data should be available for the map because the best representation of the indicator on the map may be a combination of the indicator and denominator or numerator rather than only mapping the indicator (see figure 5)
Figure 5 Prepare Indicator Data for Mapping
Do you need to be able to identify the actual value on the map
- If the value will be listed in the labels or if the value will interact with the GIS map (for example during a presentation) then format the data for the presentation (see figure 6) when you extract the data to be linked When you use GIS software it may be difficult to format data after it is extracted and the results may be misleading Set the format when the LMIS data is extracted do not set it in the GIS
21
Figure 6 Format Numbers
Does the data allow for graduated or class symbology
- Depending on the data you may or may not be able to use graduated symbology If the data is the ratio scalemdashfor example the number of male condomsmdashthen graduated symbology is appropriate With graduated symbology size andor color of the symbol changes as the number of male condoms recorded changes However if the data is nominal scale for example stock status of a commodity (stocked out overstocked etc) you can only use class symbology (see figure 7) Class symbology marks each class with a different symbol
When you use graduated symbology you can also use class symbology
When you use class symbology you cannot use graduated symbology
Figure 7 Graduated Symbology or Class Symbology
22
Will you develop multiple maps (a time series)
- If you want the output to be data on a map over a period of time set up the query(s) to define the exact date(s) to extract the data (see figure 8) You can also set the date within the extracted data or set it to replicate the same data extraction and only change the time period The preferred approach is to generate a small macroquery that does the extraction based on the time period you set As more data becomes available you can map a time series more often
Figure 8 Time Series for Logistics Management Information System Data
Will the data be used in combination with other data
- When you link with other data through a GIS you should correctly format and clearly label all the data This is critical if you plan to share the data with others Unlike the previous examples the user may not know or be familiar with LMIS data
- Determine the subset of data needed from the LMIS
Box 5 Correcting Data in a Global Information System
When you prepare the logistics management information system (LMIS) do not manipulate the LMIS data after it is in global information system (GIS) If you see mistakes that you need to correct go back to the LMIS change the data and then relink to the GIS
23
Format for extracted data Ensure that the data from the LMIS is in a table structure and is formatted so it can be linked to GIS data and used by the GIS software Using SDP data as an example organize the data as a flat table with the SDP code in the first column and the content data in the next column(s) include a record for each SDP Use this basic table structure to link any data to GIS data (see figure 9)
Figure 9 Formatting Data Tables (service delivery points)
Other formatting guidelines are available when you make and use the LMIS data in GIS
FIELD TYPE The type of unique identifiers in the LMIS and GIS must be the same If they are not even if the unique identifiers are the same data will not be joined Mismatching the field type is a common problem when linking data particularly if the field type is not defined
JOINED DATA Include all the data elements involved when you generate the indicator to be mapped in the table to be joined For example if you are generating an index to be mapped extract the results of the index and any key individual components of the index so that information can be queried or mapped to help explain the index
DECMIAL POINT Define the number of decimal points for each field with the numeric data that will be used If you do not define the number of decimal points the data will be rounded to whole numbers
FORMATING If you plan to use data in an interactive formatmdashfor example showing the name of the SDPs or the open balance of stocksmdashset the formatting in the extracted file For example if you are going to use the name of the facility and Title Case is the desired formatting set the names in title case (for example Owoina Hospital) in the data extracted from the LMIS as you cannot easily change the text to uppercase or lowercase in the GIS software
Link the Output File to the GIS Dataset You can link the extracted LMIS data to GIS in two different ways a single join and a live join
The single join exports the data from the LMIS database and then joins it to the GIS dataset To do a single join all the steps are done manually
To link via a live join prepare a flat table in the database using the crosswalk table (it will stay in the LMIS database) Then through a database connection (for example Open DataBase Connectivity [ODBC] the GIS software will connect to the table in the LMIS database and join with the GIS dataset (see figure 10) The live join is a semi-automated to automated process that is more complex than the single join to set up However after it is set up you can quickly generate maps and other GIS outputs
24
Figure 10 OCBD Live Linkage
Generally the single join is better for a one-time map and analysis while the live join is better for routine mapping of LMIS data for decisionmaking You must always do a single join first before you do a live join
The LMIS database software and the GIS software also influence the process of joining This guide includes examples from joins with QGIS and ARCGIS software using a Microsoft Access database
Single join A single join is always the first step when you link an LMIS to a GIS A single join proves that the link is working and identifies any issues with the crosswalk table If all the matched elements (for example SDPs or districts) are correctly joined the next step is to use the joined data to generate a map or conduct spatial analysis The overall process for joining data to GIS data is very similar in all GIS software
The steps aremdash
1 Add the GIS data and LMIS data with matching unique identifiers to the GIS software
2 Open the joining function
3 Identify matching identifiers in both GIS data and LMIS data
4 Run the joining function to keep only the matching records
5 Review the output
6 Save the joined output as a new GIS file1F
2
By reviewing the output of the join you can ensure that the LMIS data has been joined successfully to the GIS data based on the crosswalk table The output will show a general visual review of how well the join worked You can then compare the number of records matched to the number of records exported from the LMIS data At this point the percentage of matched records should be the same as the percentage identified (see Method for validation of geo-codes and collecting missing geo-codes) If they do not match there is probably a problem with the crosswalk table If the percentages are the same then you can use the joined data
Using Quantum GIS (open source software) If you use the single join function in QGIS the LMIS data should be exported in either a dbf or a csv file format You can generate both formats in Microsoft Access if you use Excel you can only use a csv format If possible use a dbf and not a csv The formatting of fields in csv format are often
2 When you use ArcGIS it is very important to save the join as a new GIS file If you forget this step and you need to use the join again you may need to recreate the join of the map
25
lost and the data may not be useable in the GIS software (see Format for extracted data) QGIS always generates a new permanent output from the joinmdashyou do not need to save the join as a new GIS file
Using ArcGIS (proprietary software) You can use the single join function in ArcGIS for many types of file formats including Microsoft Access and Excel files Before the software runs the join it runs a validation function that assesses the join and identifies any issues The join created in ArcGIS is only temporary To keep the join you need to save it as a new GIS dataset
Live join If you update the LMIS data monthly you can produce new maps each month that show changes in the supply chainmdashthis information can help decisionmakers plan and respond to issues This constant flow of data works best with a semi-automated to automated system to regularly produce maps it requires a direct link through a database connection between the LMIS database and the GIS software When you create the database connections depending on the LMIS and GIS software you use many different methods are available
To link the database to the GISmdash
1 Create a single join to test the unique identifiers
2 Determine the routine information to be mapped
3 Generate a template of routine maps (based on using a single join)
4 Finalize the design and the data that will be used for routine maps
5 Generate queries in the LMIS database to create the table(s) to be linked to GIS
6 Using a database connection link the GIS software to LMIS data
7 Using the data connection load the LMIS data into GIS
8 Open the joining function
9 Confirm the matching identifiers in both GIS data and the loaded LMIS data
10 Run the joining function keep only the matching records
11 Review the output
12 Save the joined output database as a new GIS file
13 Use templates to generate the routine maps
This set-up process is more complex than a single join However if you need to routinely generate maps for a number of commodities and indicators the process will now takes hours instead of days allowing more time to analyze the map products Like all active databases you need to maintain the link between the LMIS database and GIS any changes you make will affect your ability (both negatively and positively) to generate routine mapping
Using QGIS (open source software) You can use many different database connections to link the LMIS database to QGIS from many different database platforms The ideal combination however is to link to the Postgres or MySQL database because the initial database connection protocols were based on Postgres databases Other database platforms also workmdashfor example Oracle SQL and Microsoft Accessmdashbut the
26
functionality is reduced and the process may be more complex because the QGIS community has focused on building the database connections with Postgres and MySQL
Using ArcGIS (proprietary software) You can link the LMIS database to ArcGIS through many different database connections to many different database platforms ArcGIS functions best when linked to Microsoft SQL or Oracle SQL You can also link it to MySQL and Postgres but the functionality is reduced and the process may be more complex because ArcGIS has focused on building the database connections with Microsoft
Box 6 Using MS Access to Generate a Live Link
In both Rwanda and Zambia staff used Microsoft Access to generate a live link between the LMIS and the GIS The countries selected MS Access because the main supply chain data was already in an MS Access database in both cases Supply Chain Manager
Generate GIS Outputs and Maps This section focuses on the process of putting the selected data into the GIS The following sections cover the process of generating maps or GIS outputs (interactive maps spatial analysis) that you can use to manage supply chains (see appendix B for GIS software training resources and technical details) Map generation is an iterative process It creates a visual representation of data and through a process of review and adjustment produces an outcome that enables decisionmakers to see and process information in new and innovative ways and to make decisions
Below are steps 3 and 4 as outlined in the beginning of the chaptermdash
3 Generate maps and GIS outputs
ldquoI know it will take4 Review and refine days to produce the maps
The overall goal for the process is to generate GIS outputs needed but I want to be able in a reasonable time and in a format that can be easily used to look at the map and make to make decisions at the right time and place decisions in minutesrdquo
USAID Adviser Bangkok
Examine the LMIS data in a GIS The first step after bringing the LMIS data into GIS for the first time is to examine the data spatially Does it make sense Does it match your expectations For example does the level of oral contraceptives match the local knowledge and experience If it does not match you need to confirm if the data are being used correctlymdashis the join correct Is the data quality adequate for decisionmaking
GIS can expose weaknesses in data quality because it visually represents the data at a disaggregated level it shows details that are not as explicit in other formats As you start to use a GIS you will see an evolution in the types of GIS outputs (see figure 11)
Stage OnemdashData quality
Stage TwomdashProject impact
Stage ThreemdashPolicy impact
27
Figure 11 Evolution in Using a Global Information System
One advantage of a GIS is that you can create a targeted feedback mechanism highlighting where you need to improve the data quality or programs In the initial stages you will use GIS predominantly to improve and validate data quality and to build trust in the geographic information being presented You can only reach the program and policy impact stage after you and others are confident that the maps being produced reflect what is actually happening Sharing these maps with policymakers will help influence policies in practice and plan for future adjustments
After you adjust the data so it represents the actual situation the next step is to decide the best way to represent the data for your audience
Generate GIS outputs for decisionmaking The goal of integrating a GIS with an LMIS is to make the data within the LMIS database available for decisionmaking Therefore when generating GIS outputs you need to make the outputs simple and easy for decisionmakers to interpret Map making entails converting numbers from a database into a visually appealing format It requires a combination of scientific and artistic skills that takes practice to hone Appendix B contains references to training materials that may be useful when you or others are beginning to develop this capacity It is important to ask for feedback when you first begin to generate maps use the feedback to learn how to generate maps that better match your audiencersquos needs
Box 7 Maps for Decisionmaking
Maps for policymaking are not the same as maps that are used for research and analysis Maps for policymaking should have one ideamdashthe point of interest must be clear and easy to understand Maps for research and analysis on the other hand are useful for generating discussionsmdashthey may convey more detailed and often multiple ideas
28
Review and refine outputs When you develop maps or GIS outputs reviewing and refining the outputs is an important phase At this stage decisionmakers and personnel managing the LMIS and GIS should discuss questions such asmdash
Does the output match expectations
When you examine data linked to GIS and the data are consistent then others are more likely to trust the mapping If the data appear to be inconsistent or inaccurate review it to determine if issues in data quality need to be addressed before the data are used for programmatic decisionmaking
Does the output convey the intended message
When first reviewed the outputs should clearly communicate the original defined purpose Occasionally however you may refine the purpose during the review process After decisionmakers see initial results they may ask for different or additional outputs
Is the message clear for the intended audience
One important attribute of GIS outputs is to determine if the message is clear A large amount of information may go into a GIS output which can be confusing The goal is to create maps with a clear message A good test is to ask someone who is unfamiliar with the map to explain the maprsquos message You can use this feedback to refine the map andor message
Do you need to make any changes
During the review process clearly define and document any adjustments to any outputs Explain to decisionmakers the various possibilities and how they can use the GIS in the decisionmaking process
When you generate the final GIS outputs for decisionmakers save and carefully document the LMIS queries and GIS applications Not only will this enable you to easily repeat or refine the GIS outputs in the future but it will also build a foundation for new GIS outputs
Create a template After you generate and review a number of GIS outputs you can develop a template for presenting the outputs which will ensure they are consistent for use over time
The template should includemdash
symbology for the background layers (administrative boundaries roads rivers and others)
common color gradients
fonts for title legend and other text
general layout of the map including a separate orientation layout for portrait and for landscape
One advantage of using a template when you provide GIS outputs to decisionmakers is that it is easier to interpret GIS outputs Make sure the symbology is consistent across all GIS outputs Although you should use a template(s) as the base for all outputs during the refine and review phase you may need to adjust the symbology to ensure that the maprsquos message is clear
29
30
Sustain the GIS and Its Linkage To ensure that the GIS is self-sustaining you should ensure that it has two key characteristics
1 Good system design so that with the least amount of effort and resources possible the staff can maintain the linkage between the LMIS and GIS over the long term
2 The system can meet within a reasonable time the demand for and use of the GIS outputs
The design of the linkage between the LMIS database(s) is critical if you plan to produce GIS outputs within a reasonable time and without adding significant resources Maintaining the linkage depends more on the system design than on the capacity or resources The GIS and LMIS data often come from different sources Therefore to link the two datasets and to leverage LMIS data directly through the GIS the data must be well organized and integrated The goal is to build a system that can routinely manage the linkage and ensure that the GIS can be used across a broad range of applications (in addition to the LMIS)
Design a Process for Integrating GIS When you design the integration of GIS into an LMIS system you need to understand the history and rationale behind the design and implementation of the LMIS If you try to integrate GIS without understanding the context the GIS will probably exist as an appendage without generating synergies and will result in one-off mapping that does not maximize the full potential of the GIS Adding a GIS imposes a certain degree of burden to the system therefore the benefits of a GIS must strengthen the foundation of the LMIS not impede it from performing its primary function
You need to consider a number of elements when you plan to integrate GIS
Routine flow of information from the SDPsmdash
The frequency of reporting at the SDPs affects how often you can generate routine maps (usually monthly) It also affects how often you should review the crosswalk table and the time intervals for any time-series mapping
The time gap between reporting and availability for use in the LMIS is also affected
It affects the timeliness of mapping if the data is not available for mapping until two or three months after the data are reported this gap will affect how and when the data can be used
If data are used for annual planning and advocacy single joins would be sufficient
If mapping is needed for programmatic action you could consider a live join to reduce the time gap
The feedback mechanisms for SDPs can be enhanced because using maps to see data can be a powerful tool for communicating between levels
The method used to manageupdate the current SDPs list is also important formdash
coding of facilities
To develop the crosswalk table you need to know where and how the list of SDPs was obtained and coded
31
updating procedures
When you develop the crosswalk table it is essential that you base procedures on any procedures that already exist this will minimize the extra burden of maintaining linkage to the GIS
Information about the frequency and type of SDP information used for decisionmaking is essential
What is the level of detail desired Do staff need data at the level of the SDP district zonal etc
Different staff have different mapping needs mapping data at the SDP may be too detailed and might be confusing while others may need data at the SDP level Understanding who might need data and what level of data are needed is important in targeting the right maps to the right person at the right time
How do people currently interact with data in the LMIS database
If you understand how the LMIS is currently used andor wanted will help determine the mapping needs and where to focus the initial development of the GIS If you misunderstand the mapping needs this may lead to an ad hoc approach which is an ineffective way to determine how best to use the GIS
What is the timeframe and level of effort for information needs
Set up the process for producing maps to coincide with the time when maps are known to be needed within the constraints of the availability of data and resources A well-maintained dataset reduces the level of effort and turn-around time for map production
Figure 12 Map Production Timeline
32
Consequences of change Systems are constantly changing The most common types of changes for SDPs are new site openings site closing locations moving facility type and ownership
These changes have implications for the linkage between the LMIS and GIS How these changes affect the linkage depends on how the link is designed most significantly in terms of the naming and coding conventions and the updating procedures
For example a site that changes from private to public ownership may depending on the naming and coding conventions change its name and code for that site Because the GIS and LMIS datasets come from different sources the linkage may break If you do not know the naming and coding conventions you may not be able to tell whether or not the link will break To be prepared for this on-going issue you need to know the naming and coding conventions To minimize the impact of changes on the linkage you must also follow the protocol for managing these changes
Changes to both the LMIS and GIS are not necessarily on a regular schedule therefore you may need to update them as needed including adding regularly scheduled periods of review to ensure the crosswalk table is reliable These changes may cause problems so the updating procedures need to identify how and when the naming and coding within the crosswalk table will change the linkage (see appendix A for a description of naming and coding conventions) Two important strategies will minimize the impact of the changes that must be part of any protocol
Clearly define and document the naming and coding conventions for lists used within the crosswalk table
Clearly define and document procedures for updating the crosswalk table lists
when and how to review the list within the crosswalk table
when and how to update the list within the crosswalk table
The existing management structure for managing the SDP list will also influence this protocol additional management may be needed to manage the health facility list and the interaction between the LMIS and other datasets
Maintain the Crosswalk Table Managing the crosswalk table includes maintaining the match between the unique identifiers when changes occur in the two datasets The ability to manage these changes depends on whether the datasets are internal or external Different approaches are needed because of the ability to control changes in the datasets However the overall aim remains the same (1) to keep the link up-to-date and (2) to track changes in the unique identifiers over time so the data can be mapped and analyzed
Internal unique identifiers Consistency in naming and coding is the key to managing the internal unique identifier To ensure consistency begin by defining and documenting the procedures for naming and coding SDPs Set up rules within the database to ensure the procedures for maintaining the naming and coding are followed
Documenting changes over time is also an important part of managing the crosswalk table After you generate the first crosswalk table as changes occur with the SDPsrsquo name andor code document the changes The recommended practice is at a minimum to have the most recent name and code and comments documenting the change including a date-stamp showing when it was last changed Once a year create a copy of the crosswalk table and reference the date Keeping this record of changes
33
and copies of the crosswalk table is important You can use the tables to link data to show changes over time for example to produce an output of commodity levels at SDPs during the last five years you should use the right code for the right period of time to link to the right data
External unique identifiers If the unique identifiers come from external sources it is important to note that the timing of these changes may not match the changes in the internal unique identifiers andor other external sources
As with internal unique identifiers it is important tomdash
maintain consistency over time
understand the coding conventions of unique identifiers
know the procedures for maintaining the unique identifiers
resolve issues and update the crosswalk table
maintain contact with the provider of the external sources
It is important for you to communicate regularly with external providers you need to receive regularly updated versions that you can easily integrate into the crosswalk table Open and frequent communication also enables you to provide updates to the list (for example validated GPS coordinates) which will make the list stronger and will increase its usefulness
Box 8 Differences between Internal and External Unique Identifiers
After a new site is added to the project you can clearly see the differences between an internal and external unique identifier when you look at the results In Zambia a new site opened and began receiving commodities Because the site was new it was not listed on the shared master health facility list from the Ministry of Health (MOH) Therefore it did not have a name or code endorsed by the MOH The new site needed to be added to the supply chain database and it also needed a name and code to track commodities to the site The staff used the same coding structure that the MOH uses for new sites but instead of assigning a facility number they assigned an alphabetic code to establish a unique identifier that was very different than the MOH codes was used These steps ensured that the site had a unique identifier until the MOH released the new facility codes When they released the new code they changed the code in the database to the MOH-endorsed name and code
Build Human Resources Capacity for Linking and Mapping LMIS Data An integral part of maintaining the linkage between the LMIS and GIS is the human resource capacity Build on the existing resources within the projects
Two main activities help build capacity for sustaining the link between a GIS and an LMIS (1) database management and (2) data analysis and use These require two different skill sets but the skills are interconnected Database management relies on staff membersrsquo ability to use LMIS databases and their ability to build and manage a sustained linkage to the GIS datasets Data analysis and use is the ability to use the LMIS data linked to GIS for decisionmaking and managing the supply chain This will drive demand to continue supporting the linkage between the LMIS and GIS
34
Management information system skills Specific skills and tasks needed to integrate the linkage of GIS into LMIS and to manage the SDP list within the LMIS system includemdash
build the crosswalk table database
create database connections that link GIS data and the LMIS database
write queries to extract data from the LMIS database based on defined requirements
maintain and track changes in the crosswalk table
export data from the LMIS data
maintain the live linkage between LMIS and GIS (if deployed)
These are not necessarily GIS-specific skills The data managerrsquos role is to make the LMIS data available for use in a GIS platform In many cases staff that are managing the LMIS databases already have the required skill sets The main adjustments for staff are the scope of work and building technical knowledge in how to use crosswalk tables to link LMIS data to a GIS
Global information system skills within monitoring and evaluation The application of GIS with LMIS data is usually considered part of MampEmdashit uses the LMIS data to show decisionmakers the impact of the supply chain andor to identify where action is needed But how GIS is applied depends on the programrsquos needs For example if a new method of delivery is rolled out to some SDPs and not to others mapping the impact of the two delivery systems can visually show the impact of the new method of delivery and help managers decide whether to roll out the new system or maintain the old one
The skill set for applying the GIS with the LMIS data combines the following
Use GIS software to add and manipulate GIS data to generate the desired outputs
Manage GIS datasets including the LMIS and GIS data such as administrative boundaries road networks and others
Link data from other sources to LMIS data through a GIS
Share and exchange GIS data and outputs with other projects
Interpret and analyze data to provide recommendations
GIS training When building GIS capacity within supply chains you will have two main audiencesmdashtechnical staff and decisionmakers Database managers and MampE officers need the technical capacity to manage and use a GIS with LMIS data Decisionmakers should increase their ability to use GIS outputs for decisionmaking and they should learn how to maximize their investment in the GIS
Technical capacity building focuses onmdash
defining GIS
linking LMIS data to a GIS
mapping LMIS data
integrating other data
generating routine maps and GIS outputs of LMIS data
35
Decisionmaking capacity building focuses onmdash
defining GIS
understanding spatial patterns
using visual data for decisionmaking
using maps for policymaking
Building the demand and use for GIS outputs within a project and building the capacity to supply these outputs can result in greater efficiency and improved outcomes for the whole system
36
Conclusion In this guide we described the processes for assessing whether your system is ready to link GIS data with an LMIS reviewing data and planning to link creating the linkage between a GIS with an LMIS using LMIS data in a GIS platform and building a sustainable linkage
Due to a combination of factors including recent developments in GIS that have made it easier to use and less expensive as well as the expansion in electronic LMIS systemsmdashnow is an opportune time to integrate a GIS with an LMIS system
A GIS usually illustrates the data within the LMIS and makes it more accessible for use by decisionmakers and others
Linking a GIS and an LMIS offer many benefits
When decisionmakers are able to visualize data it is easier for them to interpret it
Mapping makes it easier to explain logistics messages to non-technical stakeholders It conveys information faster than a long report is less technical and it is quickly noticed by others
Mapped data is more transparent because it shows disaggregated points it shows a detailed picture of what is actually happening in a given districtregioncountry and it can help to target supervision visits
Within an in-country supply chain mapping can show the location of commodities at a given point in time (eg central or regional or district stores or in transit) which can be useful when transferring products and can make the best use of the available product
GIS can be used to integrate different datasets for example geo-codes enable you to make linkages between logistics data (from the LMIS) and services data (from the HMIS) at facilities
In these and other ways a GIS can enhance the use and value of LMIS data to strengthen supply chain systems
When deciding whether or not to link a GIS with an LMIS in your country determine if you have sufficient demand financial support and human resources to support this endeavor At the onset stakeholders must clearly state their expected outcomes High-quality LMIS and GPS data must be available Three main elements must be in place (1) physical datasets (GIS and LMIS) (2) procedures for integration and (3) commitment to sustain the linkages As part of your assessment process prior to initiating GIS activities you must take four steps
1 Establish a timeline
2 Review and plan
3 Determine required resources
4 Build capacity
After you decide to incorporate a GIS into the LMIS system the next main steps aremdash
1 Review the existing data and plan to link the LMIS to a GIS infrastructure
2 Build the connection between the LMIS and GIS
37
3 Document build capacity and create processes that will sustain the linkage between the LMIS and GIS
To maintain data quality incorporate GIS linkages into the LMIS procedures already in place consider the environmental context and the design decisions behind the LMIS implementation
Furthermore do not link an LMIS to a GIS as a one-off exercise Build the linkage so it can be sustained and used for multiple purposes Creating the crosswalk table for linking LMIS and GIS data will enable you to link the LMIS data directly with other databases such as Routine Health Information System (RHIS) and human resources and financial databases After you invest the time and resources in creating the linkage between a GIS and an LMIS you will have many opportunities to use it to strengthen the supply chain
38
References Earth Sciences Resources Institute (Esri) website Redlands California httpwwwesricom (accessed
10-03-2011)
MEASURE Evaluation Project Health Facility Technical Working Group 2007 The Signature Domain and Geographic Coordinates A Standardized Approach for Uniquely Identifying a Health Facility Chapel Hill NC MEASURE Evaluation Project
Quantum GIS website Open Source Geographic Information System website httpwwwqgisorgenabout-qgishtml (accessed 10-03-2011)
Republic of Rwanda Ministry of Health website httpwwwmohgovrwindexphpoption=com_contentampview=frontpageampItemid=28 (accessed 10-03-2011)
World Health Organization (WHO) Forthcoming Creating a Master Facility List and a Database of Health Services Geneva WHO
39
40
Appendix A
Method of Coding and Naming Two main considerations when you code and name service delivery points (SDPs) are to ensure (1) that you can maintain the method over time and (2) the logic behind the method is clear when you review the code or name The method of naming is often called the name inventions while coding is often called the coding structure The key is to be consistent within the structure and to have clear procedures for when and how to change the name or code and then document those changes
Documentation is critical because the geographic information system (GIS) is not a one-off linking of data but it can be used to create several maps using updated data over time without regenerating the linkage Certain characteristics of SDPs change over timemdashthey open close move change ownership and change type The physical location of the SDP may or may not change Any of these types of changes could affect the NAME and CODE depending on the naming conventions andor coding structure Therefore you need to manage and track these changes because any change in the NAME andor CODE could break the linkage to the GIS when mapping current andor historical data
Naming Conventions How an SDP name is recorded depends on how the SDP is usually described For example many health facilities are named for the location and the level or type of the facility (dispensary health center hospital) or in some cases after the organization that established the facility When setting up a naming convention keep the name simple and clear For example does the name contain the facility type and is the name of the facility type abbreviated or spelled out
If a facility has multiple names use the official name for the facility Alternative names can be recorded in the list under another field for example ALTERNATIVE NAME You can also use this convention if a facility changes ownership level or type and as a result is given a new name We also recommend that you track all the name changes in a separate table that can be linked to the latest updated master facility list
Coding Structure Of the two main types of coding structuresmdashsequential (a continuous series) and catenated (coded in a series)mdashboth have advantages and disadvantages selecting the method to use depends on how you manage the SDP list
Sequential coding The facility is assigned a number and keeps the same number for as long as it exists New facilities are assigned the next number in the series When facilities close or cease to exist the code is retired The advantage of this system is its stability after a code is assigned to a SDP it will not change a correctly coded list of facilities is easy to maintain One disadvantage is that the code does not contain context If you look at the code no other information about the SDP is available Also to avoid duplicates the code must be centrally assigned and managed If central offices are responsible for assigning codes they must have good communication with the field offices on the coding procedures for new facilities and closing of facilities The most common cause of issues and discrepancies with the coding is poor communication
41
Catenated coding Information about the site is combined to generate a unique identifier The most common catenations are provinceregion code district code and then a sequential value for each site For example Iringa Regional Hospital is in Iringa Region (region code is 08) and Iringa District (district code 01) and it is the first facility (001) therefore the code is 0801001 One advantage of this system is that the code contains context making it easier to manage geographically Also it allows field-based groups autonomy when assigning codes as changes occur at facilities The disadvantage is that over time codes can change when information used to generate the catenated code changes For example when new districts are created the code for some of the facilities will change to the new district This will break the linkage data for SDPs to historical data based on the code change even though the SDP has not changed Therefore all changes in the code should be carefully tracked and managed over time partners and others should receive regular updates
The choice of SDP coding method often reflects the way the SDP list is managed in the country If the facility list is managed centrally a sequential coding system is a good choice For example the master facility list in Kenya uses sequential coding the list is available online at httpwwwehealthorkefacilities
The Rwanda health facility list however is catenated based on district it is also available online at httpwwwmohgovrwindexphpoption=com_contentampview=categoryamplayout=blogampid=37ampI temid=54
The other consideration in selecting a coding method is the historic coding technique Completely changing the system and generating all new codes may create additional complications and confusion Thus when possible use and strengthen the existing coding system instead of creating a new system
42
Appendix B
GIS References The following basic geographic information system (GIS) training materials are available online Listed below are descriptions of the materials and links to other useful sites
Introductory GIS Training Environmental Systems Research Institute (Esri) software Getting Started with GIS (for ArcGIS 10) This introductory online course offered by Esri is the ldquofoundation for understanding what a geographic information system is and the possibilities it offers for discovering patterns relationships and trendshellipinteractive exercises and activities throughout the course you will work with ArcGIS softwarerdquo Available on the Internet the course has three modules you should be able to complete them in about nine hours This is recommended for beginners who have invested in ArcGIS software Access at httptrainingesricomgatewayindexcfmfa=catalogwebCourseDetailampcourseid=1911
Turning Data into Information Using ArcGIS 10 This intermediate course offered by Esri ldquoexamines the scientific methods used to derive useful information from spatial datahellip explore GIS theory related to the visualization measurement transformation and optimization of spatial datardquo The course has six modules you should be able to complete them in about 18 hours Not all the course material is relevant to logistics however it does include a section worth reading ldquoCartography Map Production and Geovisualization GIS-based visualization Representing attributes and spatial objectsrdquo Access at httptrainingesricomgatewayindexcfmfa=catalogwebCourseDetailampcourseid=2017
Quantum GIS (QGIS) Software If you use QGIS training guides and How to guides are available online QGIS users created these materials therefore the training materials are not as professionally written as other proprietary software Because QGIS software is frequently updated the current information is frequently outdated Following are links to the latest versions of training materials available on QGIS
Manuals The QGIS website offers the most recent manual in several languages this is a good starting point for QGIS training materials Access at httpwwwqgisorgendocumentationmanualshtml
How can I do that in QGIS The following URL is a good reference for how to do a number of basic GIS task in QGIS httpwwwqgisorgwikiHow_do_I_do_that_in_QGIS
The USAID| USAID| DELIVER PROJECT developed customized QGIS training materials for Rwanda and Zambia Email a request to askdeliverjsicom
43
Other Training Resources Pennsylvania State University offers free online courses in GIS at the Open Educational Resources website which you can take for no credit Some of the 10-week courses are listed below you may find them useful for expanding your GIS skills Access at httpopenemspsueducourseware
GEOG 482160 Nature of Geographic Information This general course helps ldquopromote understanding of the Geographic Information Sciencerdquo It offers a solid foundation into concepts behind GIS and the questions GIS can answer
GEOG 486 Cartography and Visualization This course covers in detail the principles and technical techniques for the visualization of GIS data The technical instruction is based on ArcGIS It is the next logical step from Geog 482160
GEOG 586 Geographical Information Analysis This advanced course in spatial analysis is for intermediate-to-experienced GIS users who want to expand their GIS skills in detailed spatial analysis
Other GIS options on programming and web mapping are also available
The Presidentrsquos Emergency Plan for AIDS Relief (PEPFAR) e-learning course offers ldquoGeographic Approaches to Global Healthrdquo at the Global Health E-learning Center The course includes an overview of GIS within global public health The course is designed for non-GIS users who are interested in exploring the potential of GIS Access at httpopenemspsueducourseware
To access this free course you will need to register and then login Access at wwwglobalhealthlearningorg
GIS Data Resources Following are GIS data resources available for GIS data
Administrative boundaries
Map Library Contains national and sub-national administrative boundaries in the public domain it primarily focuses on Africa Access at httpwwwmaplibraryorgindexphp
Second Administrative Level Boundaries (SALB) Contains Second Administrative Level Boundaries dataset collected by the UN Geographic Information Working Group (UNGIWG) You must register to access the datasets Access at httpwwwunsalborg
44
Road Networks
Google map maker data download Contains road network and point of interest (POI) data from Google maps To access this data complete an application online and declare that the data will not be used for any commercial purpose or used by any agencyorganizationnon-profit group Access at httpsservicesgooglecomfbformsmapmakerdatadownload
Open Street Map A website of road networks of the world ldquoOpenStreetMap (OSM) follows a similar concept as Wikipedia does but for maps hellip People gather location data from a variety of sources hellip and upload this data to OpenStreetMaprdquo This data is available Access at httpwwwopenstreetmaporg
Cloud made This site collates OSM data into separate countries and regions of the world it can be downloaded at httpdownloadscloudmadecom
Health Facilities
Rwanda health facilities The Ministry of Health provides regular updates for a geo-coded list of all public health facilities in Rwanda it can be downloaded at httpwwwmohgovrwindexphpoption=com_contentampview=categoryamplayout=blogampid=37ampI temid=54
Demographics
Afripop A high-resolution raster dataset (100m2) of the population based on modeling population using in their words ldquoGIS-linked database of census and official population estimate datardquo You need to provide contact information to access the data and download the datasets Access at httpwwwclasufleduusersatatemindex_filesAfriPophtm
GIS data repositories
WHO ndash Geonetwork A repository of metadata (information on the GIS datasets registered with the WHO geo-network) It provides links for requesting the datasets Access at httpappswhointgeonetworksrvenmainhome
International Livestock Research Institute (ILRI) - GIS services ILRI collected and generated an extensive range of spatial data layers that they share with both collaborators and the general public To access the data and download the datasets you must provide contact information Access at http192156137110gis
45
FAO Africover Provides GIS datasets for ten countries Burundi DR Congo Egypt Eritrea Kenya Rwanda Somalia Sudan Tanzania and Uganda To download the data you need to register Access at httpwwwafricoverorgsystemafricover_dataphp
46
For more information please visit deliverjsicom
USAID | DELIVER PROJECT John Snow Inc
1616 Fort Myer Drive 11th Floor
Arlington VA 22209 USA
Phone 703-528-7474
Fax 703-528-7480
Email askdeliverjsicom
Internet deliverjsicom

A Guide for Preparing Mapping and Linking Logistics Data to a Geographic Information System
The authors views expressed in this publication do not necessarily reflect the views of the US Agency for International Development or the United States Government
USAID | DELIVER PROJECT Task Order 4 The USAID | DELIVER PROJECT Task Order 4 is funded by the US Agency for International Development (USAID) under contract number GPO-I-00-06-00007-00 order number AID-OAA-TO-10-00064 beginning September 30 2010 Task Order 4 is implemented by John Snow Inc in collaboration with Asociacioacuten Beneacutefica PRISMA Cargo Management Logistics Crown Agents USA Inc Eastern and Southern African Management Institute FHI 360 Futures Institute for Development LLC LLamasoft Inc The Manoff Group Inc OPS MEND LLC PATH PHD International (a division of the RTT Group) and VillageReach The project improves essential health commodity supply chains by strengthening logistics management information systems streamlining distribution systems identifying financial resources for procurement and supply chain operation and enhancing forecasting and procurement planning The project encourages policymakers and donors to support logistics as a critical factor in the overall success of their healthcare mandates
Recommended Citation Inglis Andrew 2012 A Guide for Preparing Mapping and Linking Logistics Data to a Geographic Information System Arlington Va USAID | DELIVER PROJECT Task Order 4
Abstract This guide is an introduction on how to integrate logistics management information systems (LMIS) with geographic information systems (GIS) It covers the value of integrating these two systems the steps in assessing if it is currently viable to link the systems how to set the linkage the processes for using LMIS within a GIS platform and finally how to sustain the linkage The aim of this guide is to assist logistics managers decisionmakers and technical experts in understanding the value of integrating GIS and of the process involved in integrating these two systems
USAID | DELIVER PROJECT John Snow Inc 1616 Fort Myer Drive 11th Floor Arlington VA 22209 USA Phone 703-528-7474 Fax 703-528-7480 Email askdeliverjsicom Internet deliverjsicom
Contents
Acronyms and Definitions vii
Acknowledgments ix
Introduction 1 Why Is a GIS Important for Logistics 1 What Are the Key Considerations 2 How Do You Link an LMIS and a GIS 2 How Can You Use a GIS to Analyze LMIS Data 3
Where Do You Begin 5 Establish a Timeline 5 Review and Plan 6 Determine Required Resources 6 Build Capacity 8
Review Existing Data and Plan for Linkage 9 Determine the Desired GIS Output 9 Review Existing Data 9 Prepare to Generate the Linkage 11
Create the Linkage 15 Unique Identifier 15 Generate a Crosswalk Table 16 Set up a crosswalk table to link GIS data to LMIS data 17
Link and Map LMIS Data in the GIS 19 Define the Message and the Audience 20 Link the Output File to the GIS Dataset 24 Generate GIS Outputs and Maps 27 Review and refine outputs 29
Sustain the GIS and Its Linkage 31 Design a Process for Integrating GIS 31 Maintain the Crosswalk Table 33 Build Human Resources Capacity for Linking and Mapping LMIS Data34
Conclusion 37
References 39
v
Appendix A 41
Method of Coding and Naming 41 Naming Conventions 41 Coding Structure 41
Appendix B 43
GIS References 43 Introductory GIS Training 43 Other Training Resources 44 GIS Data Resources 44
Figures 1 From an LMIS Database to a GIS Map Converting Tables of Data to a Visual Image1 2 Determining the Level of Matching Data 13 3 Example of a Crosswalk Table 16 4 Steps to Link the LMIS to the GIS 19 5 Prepare Indicator Data for Mapping 21 6 Format Numbers 22 7 Graduated Symbology or Class Symbology 22 8 Time Series for Logistics Management Information System Data 23 9 Formatting Data Tables (service delivery points) 24 10 OCBD Live Linkage 25 11 Evolution in Using a Global Information System 28 12 Map Production Timeline 32
Tables 1 Integrating a GIS with an LMISmdashIllustrative Timeline for Activities 49H5 2 Quality Ranking for Global Information System Data 50H12
vi
Acronyms and Definitions Esri Earth Sciences Resources Institute
GIS geographic information systems (generic)
GPS global positioning system (generic)
HMIS health management information system
JICA Japan International Cooperation Agency
LMIS logistics management information system
MampE monitoring and evaluation
MFL master facility list
MOH Ministry of Health
MIS management information systems
PDA personal digital assistant
QGIS Quantum Geographic Information Systems
RHIS Routine Health Information System
SAM Service Availability Mapping
SPA Service Provision Assessment
SDP service delivery point
USAID US Agency for International Development
WHO World Health Organization
Definitions crosswalk table Two-column table that establishes a one-to-one relationship between two databases
data extraction Selection and organization of data from the LMIS database that meets the defined section criteria
gazette location A list of known locations used when searching by name to find corresponding geographic coordinates
mapping Process of visually representing data on a map
master facility list List of health facilities managed by the Ministry of Health
service delivery point (SDP) list List of SDP locations that receive commodities
unique identifier Specific descriptive characteristic that is guaranteed to be one-of-a-kind among all other descriptions used for an object
vii
viii
Acknowledgments This publication was made possible the through the contributions of Ashley Smith Charles Nzamutuma Jeremy Sikazwe Norbert Pehe and Pat Shawkey Special thanks to both the Rwanda and Zambia field offices for their insights and support in testing and generating the link between their LMIS and GIS systems Also thank you to David Papworth and Lilia Gerberg for their valuable feedback and to Gus Osorio for his work on the design and layout
ix
x
Introduction Integrating a geographic information system (GIS) with a logistics management information system (LMIS) will make the data in the LMIS database readily available for decisionmaking In this guide you will learn the value of linking a GIS and a LMIS and you will learn the steps you need to take when you link the two systems By taking advantage of visualization (data placed on a map) and spatial analysis (logistics data based on geography) to link the two systems you will discover new and valuable ways to use data
Since 2009 many countries have adapted GIS to improve how they manage their public health systems Today many service delivery points (SDPs) include geographic coordinates as one of their reported characteristics which also include the facility name type and ownership (publicprivate) At the same time countries are expanding the use and functionality of electronic LMIS databases By taking advantage of better geographic data and improved electronic LMIS capabilities you can link and use a GIS with LMIS data
In addition new web mapping toolsmdashGoogle Earth and other GIS software optionsmdashoffer improved opportunities for mapping and sharing data With these new options it is possible to map data in an LMIS without expensive technology or technology experts making the linking of GIS and LMIS more affordable feasible and sustainable
Why Is a GIS Important for Logistics A GIS is a map directly connected to a database With respect to logistics a GIS can transform information from an LMIS database into a map Thus a GIS becomes a portal into the LMIS data giving you a new way to explore analyze share and synthesize data With LMIS data displayed in this innovative visually appealing way you can engage a broader audience and approach data from a new perspective Furthermore GIS can organize context for large amounts of data For example a GIS can visually display the stock level of commodities at 1000 service delivery points (SDPs) in a specific country then at a glance you can see stock status and most important be alerted to impending stockouts Figure 1 shows how you can visualize LMIS data on a map
Figure 1 From an LMIS Database to a GIS Map Converting Tables of Data to a Visual Image
1
A GIS enables you to better leverage the data and information stored in an LMIS database bymdash
increasing access use and value of the data within the LMIS database
providing a mechanism for communication and feedback
conducting spatial analysis of the supply chain (eg transportation modeling)
integrating with other data sources (eg routine health information)
creating one map that can be used for multiple purposes
What Are the Key Considerations While linking a GIS to an LMIS offers many advantages it does entail a significant investment of time and resources At the onset stakeholders must be clear about their expected outcomes
If you use inaccurate or inappropriate information when you link a GIS to an LMIS the GIS may not produce a map that accurately depicts your message and may in fact lead you to the wrong conclusions Therefore first and foremost you must ensure that the data is of the highest quality possible
Before you decide to invest in incorporating a GIS into an LMIS you will need to put a number of elements in place These elementsmdashnamely physical datasets (GIS and LMIS) procedures for integration and political and financial commitment to sustain the linkagesmdashare the keys to effectively using a GIS within a logistics context
In addition you need to ensure that decisionmakers will regularly ask for GIS output (eg interactive maps spatial models animations) A GIS is most beneficial when it is used continuously rather than occasionally or as a one-time tool periodic feedback and updates will improve the quality of the output
When you plan how to link the GIS remember the LMIS data must be easily accessible Therefore you must minimize the time between the request for the GIS maps and the time it takes to produce the maps so they are timely and are quickly available for decisionmakers
Finally a GIS requires human resources and training To train experienced LMIS database staff to use a GIS they must already have specific abilities including the ability to write queries and generate new tables within the LMIS database An ideal capacity-building approach includes a mixture of GIS workshop training and ongoing on-the-job training
How Do You Link an LMIS and a GIS To maintain the data quality you should build GIS linkages into the LMIS procedures already in place always considering the environmental context and the history and design decisions behind the LMIS implementation
Use three main steps to incorporate a GIS into the LMIS system
1 Review the existing data and plan for linking the LMIS to a GIS infrastructure (chapter 2)
2 Build the connection between the LMIS and GIS (chapters 3 and 4)
3 Document build capacity and create processes for sustaining the linkage between the LMIS and GIS (chapter 5)
2
How Can You Use a GIS to Analyze LMIS Data After the LMIS is linked to a GIS you will find many opportunities for using the LMIS data to manage and plan supply chain activities including quantification transportation modeling and costing By incorporating GIS into these activities you can use geography in beneficial ways that were not previously available
One of the most common powerful uses for a GIS is to assist in targeting resources For example a GIS can create a map showing the SDPs that regularly have problems with reporting This enables managers to target resources better and to justify where and why support is needed for supervision and training
Of course this information is in the LMIS but if you can show managers a map of the sites that need assistance they may be able to detect patterns strategically plan supervision visits or suggest that higher-performing sites mentor lower-performing sites
Managers can visit the SDPs and subsequently visually show the impact of the support or highlight a continuing issue A GIS can point the way to better targeted actions explain the actions to others plan how to use the available resources and visually show the impact When a GIS is linked to an LMIS you can view the LMIS data from an entirely different perspective
You should also consider other health sector databasesmdashfor example health management information systems (HMISs) finance and human resources You can use a GIS to link data between different databases and compare it to related information from different sources at the same geographic location For example if the human resources database contains the duty station of the pharmacy staff and their training and it is linked to a database that contains the quality of the supply chain data the linkage can show the impact of the pharmacy staff training on the quality of supply chain data at the facility level You can also integrate a GIS with other data if you link tomdash
other health-related datasets human resources and finance
non-healthndashrelated datasets roads demographics socioeconomic education and others
Often the motivation for integrating a GIS originates from a specific goal (ie my manager wants a map of X) However after the linkage is established this technology opens up new opportunities beyond what was initially envisioned
Other examples of how you can use a GIS with LMIS data include the following categories
Advocacy By using maps to look at LMIS data you and others can better understand what the data
meansmdashdata are transformed into a meaningful picture of the supply chain performance within the context of the countryrsquos health system and geography
Maps encourage discussions between staff from the district or regional level and the national or central level by providing a common context and a point of reference for the discussion For example stakeholders can see how a new initiative is progressing in one district compared to another district
3
Program planning Review existing and past activities to understand where activities have occurred directly target future plans identify and pinpoint problematic geographic areas for maintaining continuous supply obtaining timely accurate data and others
System design To help evaluate design options and decide where to pilot test interventions discuss and plan design or redesign strategies with stakeholders at the different levels For example if a country is considering redesigning its delivery system by bypassing the regional level mapping can help assess the impact of the redesign on stockouts or product availability
Advanced application including spatial analysis After the GIS is well established you can use it formdash
network modeling to optimize the transport and storage network for the supply chain
system modeling to predict the potential impact of policy changes on the supply chain
4
Where Do You Begin When considering GIS activities you must take four important steps
1 Establish a timeline
2 Review and plan
3 Determine required resources
4 Build capacity
Establish a Timeline A timeline is the length of time for each activity based on the recommended resources You should allow six to 12 months to set up the linkage and build the GIS capacity You should also integrate the GIS and LMIS in two distinct levels over time The first level will help management plan make decisions and strengthen the system Only after you establish this level of integration and its outputs should you move to the second level of integration This level includes more sophisticated applications such as transport logisticsmdashusing a map or model to optimize a countryrsquos transportation needs Table 1 presents a typical timeline for integrating a GIS with an LMIS
Table 1 Integrating a GIS with an LMISmdashIllustrative Timeline for Activities
ACTIVITY MONTHS
1 2 3 4 5 6 7 8 9 10 11 12
Review and plan
Determine required resources
Collate GIS data
Generate linkage (crosswalk table)
Build capacity for GIS
Maintain linkage (crosswalk table)
Develop ability to product GIS outputs
Maintain the linkage
5
Review and Plan To create and sustain the linkage between a GIS and the LMIS you must first assess the existing infrastructure (ie datasets software and human capacity) of both systems Based on this information you can generate a plan
Review the essential elements
demand for GIS maps to manage and strengthen the supply chain
electronic database of the LMIS with its data segregated by SDP
geo-codes (a location that can be mapped or placed on a map) for health facilities
human resources to build and maintain the linkage between the GIS and LMIS
During the review process determine if the necessary components are available and if the GIS will be able to produce what is expected
After you complete the review generate a plan for how to link the LMIS datasets to the GIS infrastructure and for how to maintain the linkage over time
The plan should include strategies formdash
1 identifying the desired GIS output (maps and others)
2 obtaining GIS software
3 identifying sources of GIS data
4 reviewing (and adjusting where necessary) the naming and coding conventions for SDPs
5 outlining the plan to connect the datasets
6 training staff to build GIS capacity
7 establishing procedures to sustain links between the LMIS and GIS
The level of resources required to implement the plan will depend on the existing infrastructure and the type of GIS outputs envisaged The plan should outline how the GIS will be integrated within the context of the existing LMIS and the available resources
Determine Required Resources When you develop a plan for implementing the GIS your goal should be to work with the existing resources whenever possible Only when it is necessary should you bring in additional human resources or purchase software and hardware
Staffing The two key staff members are the data manager and the monitoring and evaluation (MampE) advisor Increasing their existing scope of work will create additional workload in the initial phase (allow six months) while they are establishing the linkage and mapping the outputs for the LMIS data If the first six months of the implementation are well designed it will require less of their time in the long term to maintain and generate data The goal is to create a system that minimizes the effort required to sustain the linkage between the GIS and the LMIS allowing staff more time to focus on the application and use of the data
6
0
The estimated staff time required during the first year of linking a GIS with an LMIS is summarized below
Initial PhasemdashEstablishing a GIS linkage (six months)
Management
Project managermdashoversees the process (10ndash15 percent of time)
Technical staff
Data managermdashcreates the crosswalk table (see Create the Linkage) sets up maintenance processes sets up database linkage (40ndash50 percent of time)
Monitoring and evaluationmdash creates the crosswalk table sets up maintenance processes and sets up the mapping and GIS outputs (40ndash50 percent of time)
Technical support
GIS advisormdashgives GIS training to technical staff supports technical staff in planning and sets up the maintenance processes (15 percent of time)
Application of GIS linkage (after sixndash12 months)
Management
Project managermdashoversees the process (5ndash10 percent of time)
Technical staff
Data managermdashmaintains crosswalk table and database linkages (10ndash20 percent of time)
Monitoring and evaluationmdashgenerates mapping and GIS outputs allocates time depending on level of sophistication of GIS applications used for the project (25ndash50 percent of time)
Technical support
GIS advisormdashsupports technical staff in on-going development of GIS skills and applications (up to 5 percent of time)
Determine GIS software When selecting GIS software the goal is to invest in software that simplifies the link between the LMIS and the GIS as much as possible using software from the same family usually supports the technically easiest linkage Considering this the main factors to consider when selecting either open source or proprietary software are a cost analysis and an assessment of the software currently being used for the LMIS database
If you use open source software for the LMIS database (ie MySQL Postgres) the best choice for GIS software is also open source such as the Quantum Geographical Information System (QGIS) (Quantum GIS website) This product is growing in popularity for organizations where the cost of proprietary GIS software is prohibitive
If you use proprietary software for the LMIS (ie Microsoft Access) then we recommend the Earth Sciences Resources Institute (Esri) ArcGIS (Esri website) Often called the gold standard of GIS software ArcGIS is available at many different levels For the work described in this guide we recommend ArcGIS ArcView or ArcGIS Basic as the platformsF
1 The goal is to simplify the ability
1 Esri is changing the naming of ArcView to ArcGIS Basic
7
to link the LMIS and the GIS datasets as much as possible using software from the same family makes the linkage work
A third approach is to combine both open source and proprietary software because the GIS data can be easily exchanged between the different programs Even if multiple people need access to the GIS all the users may not have the proprietary GIS software The solution is for the lead person on the project to have the license to use the software to link the GIS and LMIS others can use open source GIS software to analyze the data Additionally QGIS and ArcView are similar in many ways as soon as a user is comfortable using one type of software they should be able to use another program particularly if their main function is to link and map LMIS data (See appendix B for a list of training materials for QGIS and Esri software)
Apart from GIS software we also recommend that you purchase several global positioning system (GPS) handheld units or GPS-enabled mobile phones to use with ad hoc data collection and special needs of the LMIS systemmdashfor example warehouse locations
Build Capacity When linking a GIS to an LMIS try to build on the existing human resources and develop the skills to use GIS as part of existing workplace functions Using the existing staff builds skills in people who are already familiar with the data and understand how to use the data in the LMIS to strengthen the supply chain
The training for staff while customized for each organizationoffice has two main components
training staff to generate and maintain the linkage between the LMIS and GIS
training staff to use this linkage to create GIS outputs which will be used for analysis and decisionmaking on current and future activities
Staff training should combine a workshop with ongoing on-the-job training The workshop should only occur after the LMIS and GIS data are available and ready to be linked A typical workshop is five days followed by an equal amount of time dedicated to on-the-job training The aim is to build both technical skills in using GIS and an understanding of how GIS can be used to support and improve existing activities
Synchronizing GIS capacity building with linking GIS and LMIS datasets A critical stage of the process is generating the linkage between the LMIS and GIS After you generate the initial link you should be able to see the potential value that a GIS can add to LMIS data Therefore capacity building and creating the linkage should occur together Decisionmakers need to know how the data is linkedmdashthen they will understand and appreciate both the potential value and the limitations of linking For example in Zambia the process of linking the GIS to the LMIS data enabled the management information systems (MIS) advisor to identify where he could use maps to visualize the LMIS he demonstrated this by presenting mapping of the LMIS data at a planning meeting
8
Review Existing Data and Plan for Linkage Determine the Desired GIS Output Before you look at the LMIS or GIS data you must determine what level of GIS output you need this decision depends on the quality of the data GIS outputs have two main levels (1) data visualization and (2) spatial analysis
Data visualization requires that at least 70 percent of all SDPs have a geo-code
Spatial analysis requires higher-level GIS data quality than data visualization you must be able to map at least 95 percent of the SDPs It also requires additional time and resources to collate and review the GIS data
Review Existing Data Before you can link a GIS to an LMIS you must satisfy two main data requirements
An electronic LMIS database that can be disaggregated to the SDP level
Validated GIS data from the SDPs
The first task is to review the LMIS database and the existing GIS data that are available from SDPs During this review you will assess the data and prepare it for linkage The review will also help determine if you have all the parts available to efficiently and effectively make the link
If during the review you identify an insufficient level of GIS data or quality issues with the existing GIS data available you may need to adjust the expectations for outputs In the beginning at least 70 percent of the SDPs must have GIS data available If this GIS data are not available you will need resources to collect the missing data or your team may want to reconsider whether the systems are ready to link with each other
The second task is to plan how to link two datasets as described below After the datasets are linked you need to continue efforts to strengthen the linkage between them
GIS data of service delivery points To map the LMIS data you will need the geographic locations of all the facilities including SDPs and warehouses You can use many different sources for the geographic locationsmdashGPS units to collect the location asking the Ministry of Health (MOH) for the geo-coded facility list or gathering location information during facility surveys Usually you will have to combine various sources to build and maintain a complete GIS dataset for all the SDPs
9
Box 1 Health Facility List in Rwanda
The Ministry of Health (MOH) in Rwanda has a geo-coded list of 516 facilities that you can download from the ministryrsquos web site (Republic of Rwanda Ministry of Health website) The list includes the region district and sector boundaries the health management information system department at the MOH updates it regularly
This first step in gathering GIS data from the SDPs is to contact the health management information system (HMIS) department at the MOH and ask if the list of health facilities is geo-coded Many MOHs now recognize the advantages of establishing geo-coded health facilities datasets and they are building and maintaining lists they can share To assist with verifying and updating the facility list and geo-codes most database managers have set up feedback mechanisms for dataset users that can over time help improve the lists The more the lists are used the more robust the feedback which improves the completeness accuracy and timeliness of the data (see Sustain the GIS and Its Linkage)
If the MOH has a facility list but it is not geo-coded the organizations that have been involved in facility surveys can be helpful because most facility surveys include the collection of GPS locations Examples of such surveys include the Service Availability Mapping (SAM) from the World Health Organization (WHO) Facility Census from the Japan International Cooperation Agency (JICA) and Service Provision Assessment (SPA) from the MEASURE Demographic and Health Survey You can use a facility survey list with GPS location data as the baseline for building the GIS dataset of SDPs
After collecting the GIS data from outside sources you will need to fill in the missing geo-codes for the SDPs and warehouses that are not included on an MOH list or a facility survey list For this step use GPS units or GPS-enabled devices (smartphones PDAs cameras etc) You can collect this data when conducting field visits to these facilities (for example supportive supervision delivery of products collection of reports and others)
Having a geo-coded facilities list is a good foundation for a geo-coded SDP list it will reduce the number of site-level geo-codes that you need to collect For example in Zambia by using the lists of geo-coded health facilities the USAID | DELIVER PROJECT staff were able to geo-code 81 percent of all SDPs in the LMIS database This significantly reduced the number of SDPs they needed to physically visit with GPS units
Linking electronic LMIS data To link LMIS data to a GIS the data must be in both electronic format and disaggregated by location (ie SDP district etc) You must understand the structure of the LMIS database when you integrate GIS into a LMIS infrastructure because the structure dictates what LMIS data you can map
The structure of the LMIS database also affects the level of difficulty when linking to GIS datasets The critical questions are to what geographic level can data be disaggregated and how well can the geographic information be maintained over time Based on reviews of electronic LMIS systems in Rwanda and Zambia the LMIS is typically disaggregated to the SDP level because the list of unique SDPs already have unique identifiers these identifiers are essential to maintain the integrity of the LMIS data However in both countries although maintaining the SDPs geographic information is desirable it is not essential for maintaining the quality of the LMIS data However when a GIS is incorporated it is essential to maintain the geographic information Keeping geographic information up-to-date not only adds value in terms of mapping LMIS data but it is also important when integrating information from other databases such as physical inventories and training rosters Analyzing these integrated datasets can assist with managing data quality supply management capacity building and advocacy
10
Prepare to Generate the Linkage After reviewing the existing datasets the next step is to prepare a plan for generating the linkage between the LMIS and GIS data
Complete three main activities
1 Strengthen the geographic information for the SDPs within the LMIS data (geo-coding)
2 Collate the existing GIS datasets
3 Plan a time to fill in the missing geo-codes between the LMIS and GIS lists of the SDPs
Note that the LMIS data will probably not match the GIS data 100 percent therefore prepare a strategy for increasing the LMIS and GIS data match to as close to 100 percent as possible
Strengthen the geographic information in the LMIS data The LMIS database has a table that lists the SDPs and their characteristics unique identifier name type address administrative region etc When you review the LMIS you must determine if this table is both complete and current If you see gaps or inconsistencies in the key fields they must be filled or resolved A common cause for inconsistencies is when data has not been kept up-to-date Review the SDP list to ensure that the SDP information is current
Your review should also identify and remove any duplicate SDPs duplicate entries create problems when you develop the linkage with the GIS data When removing the duplicate SDPs you must follow the protocols for maintaining the integrity of the LMIS For example before removing a duplicate SDP listing ensure that it will not cause problems for other queries within the LMIS that may be linked to this entry
Before linking the LMIS data to a GIS you must accurately complete four fields (see Generate a Crosswalk Table)
unique identifier
facility name
facility type
administrative location
Collate existing GIS datasets Before you link to the LMIS dataset you will also need to collate and compile into one list the GIS datasets collected from different sources Because multiple data sources may yield significant overlaps you must identify validate and remove duplicates from the GIS datasets When removing duplicates you must review the locations of SDPs and categorize them into three main groupings
1 Data are validated When the SDP name and location match in two different sourcesmdashadd it to the collated SDP list and mark as validated
2 Data to be validated If a SDP is in only one datasetmdashadd it to the collated SDP list and mark to be validated
3 Data to be validated If an SDP has two different sources and the name or location do not matchmdashreview the details and select the most accurate name and location mark it to be validated
11
By marking the SDP to be validated you are clearly indicating the sites that need to be checked either against another source or during a visit
At this point ensure that the GIS dataset has more locations than the LMIS The LMIS a sub-set of the GIS dataset should include all sites not just those receiving commodities If you have more sites in the GIS dataset than the LMIS you probably have a high match rate between the two datasets which will allow for valid use of the data
Quality Check the GIS Data Service Delivery Points After collating and compiling the GIS dataset you must assess the data quality The standard benchmark for using GIS datasets for spatial analysis is that the recorded coordinates of the site must be within 100 meters of its actual location and its recorded location confirmed against other sources To assess the quality of the GIS data you must compare the locations with other GIS datasets andor ensure it is validated by people who have local knowledge of the sites When you compare GIS datasets to each other a common method is to compare sites by administrative region (preferably at the district or ward level) If the reported location falls outside the specified area categorize the location as to be validated you will need to confirm this by using another source You can ask people with local knowledge to assess the quality of the data (Is this where this facility is located Is this facility on the road to the next town) If you cannot validate all the sites ask about at least ten percent so you can gain an understanding of the overall reliability of the data
GIS data are graded according to quality grades As shown in table 2 if the quality is not high it will limit how you can use GIS For example if the GPS locations appear in the correct administrative region and they are less than 1ndash2 kilometers from the exact location you can use the data for advocacy and national-level decisionmaking However you cannot use the same data for spatial analysis for an accurate basis for analysis the recorded location must be within 100 meters of the exact location
Table 2 Quality Ranking for Global Information System Data
Grade GIS Data Collection Method Data Usage
High GPS data that is validated against other sources All levels of visualization and spatial analysis
Medium GPS data or collected from highly detailed maps but is not validated against other sources
Visualization of data at national and regionalprovincial level including some spatial analysis
Poor Data collected from unknown sources or gazette locations and not validated against other sources
Visualization of data at the national level with caveats Not valid for spatial analysis
The more you use the GIS the more accurate the data will become Feedback reports enable users to identify quality issues within the GIS data this information can help correct inaccurate data and improve the quality of the GIS data
Method for validating geo-codes and collecting missing geo-codes After the GIS datasets are collated and checked for quality the next step is to plan how to collect the missing data and to authenticate existing GIS information categorized as to be validated
At this stage focus on the process and how to combine it with the existing activities for visiting SDPs Collecting GPS data takes less than 10 minutes and it is a simple taskmdashtherefore you can easily complete this when you visit SDPs for other purposes This cost-effective process increases the integration of GIS into the supply chain strengthening activities
12
You can use the same method to collect the missing geo-codes when you collect the locations of new facilities when collecting the geo-codes you can simultaneously do GPSGIS capacity building Train the staff who regularly visit SDPs to collect the GPS coordinates
The Logistics Indicators Assessment Toolkit (LIAT) developed by the DELIVER project explains how to use GPS units to collect GPS coordinates for the SDPs This toolkit includes the training materials necessary to efficiently train staff to collect the location information
You will also need to validate SDPs with missing location information by comparing the GPS coordinates to another GIS dataset (see Quality check the GIS data service delivery points) For GIS data categorized as to be validated compare the GPS data to the existing data if they match the location is validated If they do not match you need to investigate further
To determine what new GPS geo-code information you need to collect you must understand the level of matching and the desired GIS outputs The match rate to the LMIS data determines how you can use the GIS data as demonstrated in figure 2
Figure 2 Determining the Level of Matching Data
Proof of Concept Only
If the match level is less than 70 percent you will have a weak linkage that will probably produce inaccurate or incomplete visualization That in turn may misrepresent the data In this case you will need to collect additional GIS data before using the GIS to make decisions Having a plan on how to collect GPS coordinates before you link the data will enable you to respond quickly and cost effectively to collect the needed GPS coordinates
Box 2 Matching Data in Rwanda
In Rwanda the match between the existing global information system data and the logistics management information system is 75 percent for all service delivery points (SDPs) The match for male condom SDPs is 85 percent injectables is 84 percent implants is 85 percent and oral contraceptives is 84 percent You can do individual spatial analysis on each of the different commodities but do not do this for all commodities together because the match rate is only 75 percent
13
14
Create the Linkage After you prepare the appropriate databases you are ready to establish the connection or link between the GIS and LMIS data This section covers the technical aspects of how to generate the link includingmdash
using unique identifiers
generating a crosswalk table
preparing LMIS data to link with GIS
Unique Identifier A unique identifier is a specific descriptive characteristic that is guaranteed to be one-of-a-kind among all other descriptions used for an objectmdashin this case SDPs For an LMIS it is used to uniquely identify all SDPs within the LMIS database At a minimum for each object in most LMIS and GIS datasets there are at least two unique identifiersmdashpeople use one and the software program uses the other one
Staff often use the name of the facility for the identifiermdashthe name is known and easily recognized For example Iringa Regional Hospital is a facility in Iringa and it is the regional hospital For computer programs however to ensure absolute consistency we recommend numeric coding If the coding changes even slightly the computer cannot correctly match the data While a person can understand that Iringa Reg Hospital is the same as Iringa Regional Hospital a computer cannot distinguish the two identifiers as representing the same location
See appendix A for additional information on naming and coding conventions associated with unique identifiers
Logistics management information systemmdashunique identifier Most electronic databases have many unique identifiers that are used internally to manage the data within the database In the case of an LMIS we focus on unique identifiers associated with the SDPs For example in Supply Chain Manager (an LMIS software developed by the DELIVER project) the table of SDPs contains two unique identifiers Fac_Code and Fac_Name The Fac_Code is the primary unique key for the SDP it cannot be duplicated Although you can customize the coding structure in this field you must have a unique code value for each SDP Fac_Name like Fac_Code has customizable field name conventions and it must have a unique name for each SDP The table of SDPs must have at least two unique identifiers (1) the name of the site and (2) the site code Without these identifiers you cannot use the location of the site to link the LMIS data to the GIS data
In reviewing the unique identifiers for the electronic databasesmdash
You need to understand the naming and coding conventions - Document the conventions (1) how a facility name is recorded in the database and (2) how
the code is assigned To know how to use unique identifiers users need to understand them when they develop linkages to other databases
Ensure that the unique identifiers remain constant over time - If you refine the unique identifier it will remain unique over time (see appendix A for
additional information)
15
If the naming and coding conventions are based on an external source ensure that you understand how they are updated and how that affects the naming and coding in the LMIS - If the main source for the SDPs is from an external source use the original SDP list of
naming and coding conventions This will enable you to generate a link between your data and the external source If the MOH is the external source you will have direct linkage to any other database using the same coding within the MOH and its partners
- If the external source does not have all the SDP sites in the LMIS use the same naming convention and code structure but in addition insert another tag to identify that it is not currently on the external source When the external source is updated you must adjust the coding in the LMIS data naming and coding to match the updated list
The key to maintaining the quality of the SDP list is to document all changes when they occur
GIS datasetsmdashunique identifier It is becoming more common to geo-code health facilities and to share the geo-coded data Organizations recognize the value of sharing information about the location of all facilities in a region and increasingly ministries are expanding the master facility list (MFL) to include geo-coded facilities lists
Geo-coded lists of health facilities usually have two main unique identifiers (1) the name of the facility and (2) a code (usually numeric) assigned by the creators of the list If an external source (as with the LMIS) provides the geo-code you need to assess the unique identifiers to determine if the code identifiers can remain the same over time Is the way the dataset provider manages their dataset similar to the procedures you have for maintaining the SDP list If they do not match you may need to add a new identifier (see Sustain the GIS and its Linkage and the naming and coding conventions of the list in appendix A)
Generate a Crosswalk Table A crosswalk table which has two columns establishes a one-to-one relationship between unique identifiers in the two databases The table enables two independent databases to link across a common element and enables you to manage that linkage
The crosswalk table in figure 3 connects the source table (LMIS data) to the target table (GIS data) even though the names between the two datasets are not identical The target table on the left represents a database for example the MFLmdashit will be linked to the source table In this example the source table lists the number of doctors in each facility and the target table lists the number of beds at each facility The crosswalk table links the two data sources (the table has at least two fields) In this example the facilities in the target table are Hospital A Hospital B and so on In the source table the same facilities have slightly different names Hosp A Hosp B and so on The crosswalk table establishes a one-to-one relationship between the source table and the target table it links the two tables through a normal database join
Figure 3 Example of a Crosswalk Table
Source World Health Organization Forthcoming
16
Establishing a crosswalk table can be tedious but the benefits are worth the initial investment of time and staff resources A linking dataset is based on shared elements known as signature domain elements (name type administration) they determine the match of SDPs between the different databases Even if you use an existing matching code to generate the link you must still manually verify the link If the databases do not have a common code then you must link them manually After you generate the crosswalk table and verify the initial linkage you can use the table to link data at any time without regenerating the linkage
(See the Sustain GIS and Its Linkage for information on how to maintain the crosswalk table when changes occur)
Set up a crosswalk table to link GIS data to LMIS data The MEASURE Evaluation projectrsquos Signature Domain document (MEASURE Evaluation Project 2007) describes the key elements you need within a list of facilities if you plan to link datasets based on location You need five elements to link and confirm that the geo-codes are associated with the correct facility
Facility Name
Facility Ownership
Facility Type
Administrative Location (region district etc)
Geographic Coordinates
The Supply Chain Manager database (within the LMIS database) contains fields for three of the required elements in the signature domain
Facility Name
Facility Type
Administrative Location
Because the LMIS work under the USAID | DELIVER PROJECT focuses on public sector programs Supply Chain Manager does not contain a Facility Ownership field because the government usually owns all the facilities in the LMIS database
Using Facility Name Facility Type and Administrative Location you can make a crosswalk table from the matched sites The sites that cannot be matched still require geo-codes which you can collect when you visit the facilities for other purposes
To generate a crosswalk table when there is no common code the GIS dataset and the LMIS must have the following elements
GIS dataset Unique Code Facility name Facility Ownership Facility Type Administrative location (Region District etc) Geographic Coordinates
17
LMIS dataset Unique Code
Facility name
Facility Type
Administrative Location (region district etc)
Initially the Facility Name joins the datasets The signature domain elements help confirm the linkage between the two datasets For example it appears that Iringa Regional Hospital from the LMIS dataset matches Iringa RegHospital from the GIS dataset To confirm this ensure that the facility type is the same in both datasets and ensure that the administrative location is the same in both datasets If these elements match then the proposed matched locations between the GIS dataset and the LMIS dataset are correct and you can verify the link
The crosswalk table generated from this process has the following
LMIS Unique Code
GIS Unique Code
Facility Name
Facility Type
Administrative Location
Geographic Coordinates
To generate or update the GIS dataset from the crosswalk table place the geo-codes within the crosswalk table This will also simplify linking sharing and maintaining the geo-coded SDP list
The ease of joining two datasets based on the facility name will depend on the data quality of both lists and the extent of data cleaning by the database manager
Use the crosswalk table The crosswalk table identifies where there are and are not linkages between the datasets This helps the managers of both databases resolve missing matches and manage changes in the logistics-related databases You can look at the table and instantly see where the datasets are linked and where they are not linked (for example when you add a new site) You can also use crosswalk tables to link multiple databases and track changes in databases
We recommend that you establish a crosswalk table of SDPs that contains all the signature domain elements described previously plus all the unique identifiers that allow it to be linked to other databases Put the crosswalk table in a separate database to ensure that it can be linked to other databases (like a training database) or you can use it as part of the foundation for a new database
The process of creating the crosswalk table illustrates the importance of creating the linkage maintaining the unique identifiers and keeping the database well organized and structured
18
Link and Map LMIS Data in the GIS A crosswalk table links the data from the LMIS to the GIS To use the LMIS data in the GIS you need to organize the data so you can generate a map that is useful for decisionmaking An LMIS produces reports from the LMIS data this requires the use of internal queries and tables that organize and format raw LMIS data into a report that is easy to interpret and use for decisionmaking Similarly when linking an LMIS with a GIS you should organize and format the data in the LMIS to ensure the LMIS is easy to use and focuses on mapping the information that decisionmakers need
After you create a functional crosswalk table to bring the LMIS data into the GIS you will need to follow a four-step technical process to move LMIS data into a GIS platform to create outputs
The first step in the process is tomdash
1 Define the message for the maps and determine the audience
Complete the next three steps as many times as you need to until you are comfortable with the results
2 Link data from the LMIS to the GIS dataset
3 Generate maps and GIS outputs
4 Review and refine
This process is demonstrated in figure 4
Figure 4 Steps to Link the LMIS to the GIS
19
Box 3 Generating Maps Is an Iterative Process
In Rwanda and Zambia the initial discussions with the USAID| DELIVER PROJECT staff centered on the question ldquoWhat maps do you wantrdquo After the team answered the question they set a framework for the database queries to draw information out of the supply chain databases However when the team reviewed the initial maps it was obvious that they needed to refine the subset of data Discussions after the second set of maps led to further refining of the queries they also added new queries to develop the maps for decisionmaking By engaging in ongoing review and discussion about the maps as they were generated and refined the team created a final product that met the needs of the users and the project
Define the Message and the Audience Defining your message determines what data to selectmdashit is also a reference point to return to during the review process to ensure the final map contains the required information The message should focus on the information illustrated by the map for example ldquoWhat is the stock status of male condoms at SDPs for the last monthrdquo The defining message is not necessarily about interpreting the map but is more about the content of the map
You must also consider the audience for the maps and think about questions Will the intended audience want to see results that highlight successes or current challenges How will the audience interpret the map Based on the map what action will they take Because different audiences have different backgrounds and objectives they need different levels of information For example a map for donors that shows dissemination plans may need more background information than a map presented at an internal planning meeting
Box 4 Stay on Task
When creating a map write down the message and your intended audience as you create the map you will need to constantly refer back to the message When generating maps it is easy to become distracted by interesting patterns in the data If you write down the desired message it will help you stay focused on your objective
How the map conveys this message After you define the message the next step is to determine how the map will convey the message This step determines how to best map the data within the limitations of the data available For example when you map the number of commodities available at the SDP level what data should you extract from the LMIS How will the map represent changes in the number of commodities and over what time period The following points will help you answer these questions
Data extraction The selection and organization of data from the LMIS database that meets the defined section criteria
Which data meets the criteria for the message
- For example Number of commodities at an SDPmdashis it the number of currently available commodities at the SDP or is it the commodities that are available according to plan Make sure the data extracted matches the desired message
Mapping The process of selecting LMIS data and visually representing it on a map
What map layout and symbology (symbols) should you use
20
- Is the map going to be interactive for example and will it display the number of commodities at the SDP when the cursor hovers over the SDP on the map
Elements Key principles that will affect the data extraction and mapping
What level of disaggregation do you needmdashSDP district etc
- This defines the aggregation for all the extracted data
Does the indicator have a numerator and denominator
- In some cases especially with indicators the indicator may have a numerator and a denominator If so put the three parts (numerator denominator and indicator) in the output dataset which will be linked to the GIS dataset All the data should be available for the map because the best representation of the indicator on the map may be a combination of the indicator and denominator or numerator rather than only mapping the indicator (see figure 5)
Figure 5 Prepare Indicator Data for Mapping
Do you need to be able to identify the actual value on the map
- If the value will be listed in the labels or if the value will interact with the GIS map (for example during a presentation) then format the data for the presentation (see figure 6) when you extract the data to be linked When you use GIS software it may be difficult to format data after it is extracted and the results may be misleading Set the format when the LMIS data is extracted do not set it in the GIS
21
Figure 6 Format Numbers
Does the data allow for graduated or class symbology
- Depending on the data you may or may not be able to use graduated symbology If the data is the ratio scalemdashfor example the number of male condomsmdashthen graduated symbology is appropriate With graduated symbology size andor color of the symbol changes as the number of male condoms recorded changes However if the data is nominal scale for example stock status of a commodity (stocked out overstocked etc) you can only use class symbology (see figure 7) Class symbology marks each class with a different symbol
When you use graduated symbology you can also use class symbology
When you use class symbology you cannot use graduated symbology
Figure 7 Graduated Symbology or Class Symbology
22
Will you develop multiple maps (a time series)
- If you want the output to be data on a map over a period of time set up the query(s) to define the exact date(s) to extract the data (see figure 8) You can also set the date within the extracted data or set it to replicate the same data extraction and only change the time period The preferred approach is to generate a small macroquery that does the extraction based on the time period you set As more data becomes available you can map a time series more often
Figure 8 Time Series for Logistics Management Information System Data
Will the data be used in combination with other data
- When you link with other data through a GIS you should correctly format and clearly label all the data This is critical if you plan to share the data with others Unlike the previous examples the user may not know or be familiar with LMIS data
- Determine the subset of data needed from the LMIS
Box 5 Correcting Data in a Global Information System
When you prepare the logistics management information system (LMIS) do not manipulate the LMIS data after it is in global information system (GIS) If you see mistakes that you need to correct go back to the LMIS change the data and then relink to the GIS
23
Format for extracted data Ensure that the data from the LMIS is in a table structure and is formatted so it can be linked to GIS data and used by the GIS software Using SDP data as an example organize the data as a flat table with the SDP code in the first column and the content data in the next column(s) include a record for each SDP Use this basic table structure to link any data to GIS data (see figure 9)
Figure 9 Formatting Data Tables (service delivery points)
Other formatting guidelines are available when you make and use the LMIS data in GIS
FIELD TYPE The type of unique identifiers in the LMIS and GIS must be the same If they are not even if the unique identifiers are the same data will not be joined Mismatching the field type is a common problem when linking data particularly if the field type is not defined
JOINED DATA Include all the data elements involved when you generate the indicator to be mapped in the table to be joined For example if you are generating an index to be mapped extract the results of the index and any key individual components of the index so that information can be queried or mapped to help explain the index
DECMIAL POINT Define the number of decimal points for each field with the numeric data that will be used If you do not define the number of decimal points the data will be rounded to whole numbers
FORMATING If you plan to use data in an interactive formatmdashfor example showing the name of the SDPs or the open balance of stocksmdashset the formatting in the extracted file For example if you are going to use the name of the facility and Title Case is the desired formatting set the names in title case (for example Owoina Hospital) in the data extracted from the LMIS as you cannot easily change the text to uppercase or lowercase in the GIS software
Link the Output File to the GIS Dataset You can link the extracted LMIS data to GIS in two different ways a single join and a live join
The single join exports the data from the LMIS database and then joins it to the GIS dataset To do a single join all the steps are done manually
To link via a live join prepare a flat table in the database using the crosswalk table (it will stay in the LMIS database) Then through a database connection (for example Open DataBase Connectivity [ODBC] the GIS software will connect to the table in the LMIS database and join with the GIS dataset (see figure 10) The live join is a semi-automated to automated process that is more complex than the single join to set up However after it is set up you can quickly generate maps and other GIS outputs
24
Figure 10 OCBD Live Linkage
Generally the single join is better for a one-time map and analysis while the live join is better for routine mapping of LMIS data for decisionmaking You must always do a single join first before you do a live join
The LMIS database software and the GIS software also influence the process of joining This guide includes examples from joins with QGIS and ARCGIS software using a Microsoft Access database
Single join A single join is always the first step when you link an LMIS to a GIS A single join proves that the link is working and identifies any issues with the crosswalk table If all the matched elements (for example SDPs or districts) are correctly joined the next step is to use the joined data to generate a map or conduct spatial analysis The overall process for joining data to GIS data is very similar in all GIS software
The steps aremdash
1 Add the GIS data and LMIS data with matching unique identifiers to the GIS software
2 Open the joining function
3 Identify matching identifiers in both GIS data and LMIS data
4 Run the joining function to keep only the matching records
5 Review the output
6 Save the joined output as a new GIS file1F
2
By reviewing the output of the join you can ensure that the LMIS data has been joined successfully to the GIS data based on the crosswalk table The output will show a general visual review of how well the join worked You can then compare the number of records matched to the number of records exported from the LMIS data At this point the percentage of matched records should be the same as the percentage identified (see Method for validation of geo-codes and collecting missing geo-codes) If they do not match there is probably a problem with the crosswalk table If the percentages are the same then you can use the joined data
Using Quantum GIS (open source software) If you use the single join function in QGIS the LMIS data should be exported in either a dbf or a csv file format You can generate both formats in Microsoft Access if you use Excel you can only use a csv format If possible use a dbf and not a csv The formatting of fields in csv format are often
2 When you use ArcGIS it is very important to save the join as a new GIS file If you forget this step and you need to use the join again you may need to recreate the join of the map
25
lost and the data may not be useable in the GIS software (see Format for extracted data) QGIS always generates a new permanent output from the joinmdashyou do not need to save the join as a new GIS file
Using ArcGIS (proprietary software) You can use the single join function in ArcGIS for many types of file formats including Microsoft Access and Excel files Before the software runs the join it runs a validation function that assesses the join and identifies any issues The join created in ArcGIS is only temporary To keep the join you need to save it as a new GIS dataset
Live join If you update the LMIS data monthly you can produce new maps each month that show changes in the supply chainmdashthis information can help decisionmakers plan and respond to issues This constant flow of data works best with a semi-automated to automated system to regularly produce maps it requires a direct link through a database connection between the LMIS database and the GIS software When you create the database connections depending on the LMIS and GIS software you use many different methods are available
To link the database to the GISmdash
1 Create a single join to test the unique identifiers
2 Determine the routine information to be mapped
3 Generate a template of routine maps (based on using a single join)
4 Finalize the design and the data that will be used for routine maps
5 Generate queries in the LMIS database to create the table(s) to be linked to GIS
6 Using a database connection link the GIS software to LMIS data
7 Using the data connection load the LMIS data into GIS
8 Open the joining function
9 Confirm the matching identifiers in both GIS data and the loaded LMIS data
10 Run the joining function keep only the matching records
11 Review the output
12 Save the joined output database as a new GIS file
13 Use templates to generate the routine maps
This set-up process is more complex than a single join However if you need to routinely generate maps for a number of commodities and indicators the process will now takes hours instead of days allowing more time to analyze the map products Like all active databases you need to maintain the link between the LMIS database and GIS any changes you make will affect your ability (both negatively and positively) to generate routine mapping
Using QGIS (open source software) You can use many different database connections to link the LMIS database to QGIS from many different database platforms The ideal combination however is to link to the Postgres or MySQL database because the initial database connection protocols were based on Postgres databases Other database platforms also workmdashfor example Oracle SQL and Microsoft Accessmdashbut the
26
functionality is reduced and the process may be more complex because the QGIS community has focused on building the database connections with Postgres and MySQL
Using ArcGIS (proprietary software) You can link the LMIS database to ArcGIS through many different database connections to many different database platforms ArcGIS functions best when linked to Microsoft SQL or Oracle SQL You can also link it to MySQL and Postgres but the functionality is reduced and the process may be more complex because ArcGIS has focused on building the database connections with Microsoft
Box 6 Using MS Access to Generate a Live Link
In both Rwanda and Zambia staff used Microsoft Access to generate a live link between the LMIS and the GIS The countries selected MS Access because the main supply chain data was already in an MS Access database in both cases Supply Chain Manager
Generate GIS Outputs and Maps This section focuses on the process of putting the selected data into the GIS The following sections cover the process of generating maps or GIS outputs (interactive maps spatial analysis) that you can use to manage supply chains (see appendix B for GIS software training resources and technical details) Map generation is an iterative process It creates a visual representation of data and through a process of review and adjustment produces an outcome that enables decisionmakers to see and process information in new and innovative ways and to make decisions
Below are steps 3 and 4 as outlined in the beginning of the chaptermdash
3 Generate maps and GIS outputs
ldquoI know it will take4 Review and refine days to produce the maps
The overall goal for the process is to generate GIS outputs needed but I want to be able in a reasonable time and in a format that can be easily used to look at the map and make to make decisions at the right time and place decisions in minutesrdquo
USAID Adviser Bangkok
Examine the LMIS data in a GIS The first step after bringing the LMIS data into GIS for the first time is to examine the data spatially Does it make sense Does it match your expectations For example does the level of oral contraceptives match the local knowledge and experience If it does not match you need to confirm if the data are being used correctlymdashis the join correct Is the data quality adequate for decisionmaking
GIS can expose weaknesses in data quality because it visually represents the data at a disaggregated level it shows details that are not as explicit in other formats As you start to use a GIS you will see an evolution in the types of GIS outputs (see figure 11)
Stage OnemdashData quality
Stage TwomdashProject impact
Stage ThreemdashPolicy impact
27
Figure 11 Evolution in Using a Global Information System
One advantage of a GIS is that you can create a targeted feedback mechanism highlighting where you need to improve the data quality or programs In the initial stages you will use GIS predominantly to improve and validate data quality and to build trust in the geographic information being presented You can only reach the program and policy impact stage after you and others are confident that the maps being produced reflect what is actually happening Sharing these maps with policymakers will help influence policies in practice and plan for future adjustments
After you adjust the data so it represents the actual situation the next step is to decide the best way to represent the data for your audience
Generate GIS outputs for decisionmaking The goal of integrating a GIS with an LMIS is to make the data within the LMIS database available for decisionmaking Therefore when generating GIS outputs you need to make the outputs simple and easy for decisionmakers to interpret Map making entails converting numbers from a database into a visually appealing format It requires a combination of scientific and artistic skills that takes practice to hone Appendix B contains references to training materials that may be useful when you or others are beginning to develop this capacity It is important to ask for feedback when you first begin to generate maps use the feedback to learn how to generate maps that better match your audiencersquos needs
Box 7 Maps for Decisionmaking
Maps for policymaking are not the same as maps that are used for research and analysis Maps for policymaking should have one ideamdashthe point of interest must be clear and easy to understand Maps for research and analysis on the other hand are useful for generating discussionsmdashthey may convey more detailed and often multiple ideas
28
Review and refine outputs When you develop maps or GIS outputs reviewing and refining the outputs is an important phase At this stage decisionmakers and personnel managing the LMIS and GIS should discuss questions such asmdash
Does the output match expectations
When you examine data linked to GIS and the data are consistent then others are more likely to trust the mapping If the data appear to be inconsistent or inaccurate review it to determine if issues in data quality need to be addressed before the data are used for programmatic decisionmaking
Does the output convey the intended message
When first reviewed the outputs should clearly communicate the original defined purpose Occasionally however you may refine the purpose during the review process After decisionmakers see initial results they may ask for different or additional outputs
Is the message clear for the intended audience
One important attribute of GIS outputs is to determine if the message is clear A large amount of information may go into a GIS output which can be confusing The goal is to create maps with a clear message A good test is to ask someone who is unfamiliar with the map to explain the maprsquos message You can use this feedback to refine the map andor message
Do you need to make any changes
During the review process clearly define and document any adjustments to any outputs Explain to decisionmakers the various possibilities and how they can use the GIS in the decisionmaking process
When you generate the final GIS outputs for decisionmakers save and carefully document the LMIS queries and GIS applications Not only will this enable you to easily repeat or refine the GIS outputs in the future but it will also build a foundation for new GIS outputs
Create a template After you generate and review a number of GIS outputs you can develop a template for presenting the outputs which will ensure they are consistent for use over time
The template should includemdash
symbology for the background layers (administrative boundaries roads rivers and others)
common color gradients
fonts for title legend and other text
general layout of the map including a separate orientation layout for portrait and for landscape
One advantage of using a template when you provide GIS outputs to decisionmakers is that it is easier to interpret GIS outputs Make sure the symbology is consistent across all GIS outputs Although you should use a template(s) as the base for all outputs during the refine and review phase you may need to adjust the symbology to ensure that the maprsquos message is clear
29
30
Sustain the GIS and Its Linkage To ensure that the GIS is self-sustaining you should ensure that it has two key characteristics
1 Good system design so that with the least amount of effort and resources possible the staff can maintain the linkage between the LMIS and GIS over the long term
2 The system can meet within a reasonable time the demand for and use of the GIS outputs
The design of the linkage between the LMIS database(s) is critical if you plan to produce GIS outputs within a reasonable time and without adding significant resources Maintaining the linkage depends more on the system design than on the capacity or resources The GIS and LMIS data often come from different sources Therefore to link the two datasets and to leverage LMIS data directly through the GIS the data must be well organized and integrated The goal is to build a system that can routinely manage the linkage and ensure that the GIS can be used across a broad range of applications (in addition to the LMIS)
Design a Process for Integrating GIS When you design the integration of GIS into an LMIS system you need to understand the history and rationale behind the design and implementation of the LMIS If you try to integrate GIS without understanding the context the GIS will probably exist as an appendage without generating synergies and will result in one-off mapping that does not maximize the full potential of the GIS Adding a GIS imposes a certain degree of burden to the system therefore the benefits of a GIS must strengthen the foundation of the LMIS not impede it from performing its primary function
You need to consider a number of elements when you plan to integrate GIS
Routine flow of information from the SDPsmdash
The frequency of reporting at the SDPs affects how often you can generate routine maps (usually monthly) It also affects how often you should review the crosswalk table and the time intervals for any time-series mapping
The time gap between reporting and availability for use in the LMIS is also affected
It affects the timeliness of mapping if the data is not available for mapping until two or three months after the data are reported this gap will affect how and when the data can be used
If data are used for annual planning and advocacy single joins would be sufficient
If mapping is needed for programmatic action you could consider a live join to reduce the time gap
The feedback mechanisms for SDPs can be enhanced because using maps to see data can be a powerful tool for communicating between levels
The method used to manageupdate the current SDPs list is also important formdash
coding of facilities
To develop the crosswalk table you need to know where and how the list of SDPs was obtained and coded
31
updating procedures
When you develop the crosswalk table it is essential that you base procedures on any procedures that already exist this will minimize the extra burden of maintaining linkage to the GIS
Information about the frequency and type of SDP information used for decisionmaking is essential
What is the level of detail desired Do staff need data at the level of the SDP district zonal etc
Different staff have different mapping needs mapping data at the SDP may be too detailed and might be confusing while others may need data at the SDP level Understanding who might need data and what level of data are needed is important in targeting the right maps to the right person at the right time
How do people currently interact with data in the LMIS database
If you understand how the LMIS is currently used andor wanted will help determine the mapping needs and where to focus the initial development of the GIS If you misunderstand the mapping needs this may lead to an ad hoc approach which is an ineffective way to determine how best to use the GIS
What is the timeframe and level of effort for information needs
Set up the process for producing maps to coincide with the time when maps are known to be needed within the constraints of the availability of data and resources A well-maintained dataset reduces the level of effort and turn-around time for map production
Figure 12 Map Production Timeline
32
Consequences of change Systems are constantly changing The most common types of changes for SDPs are new site openings site closing locations moving facility type and ownership
These changes have implications for the linkage between the LMIS and GIS How these changes affect the linkage depends on how the link is designed most significantly in terms of the naming and coding conventions and the updating procedures
For example a site that changes from private to public ownership may depending on the naming and coding conventions change its name and code for that site Because the GIS and LMIS datasets come from different sources the linkage may break If you do not know the naming and coding conventions you may not be able to tell whether or not the link will break To be prepared for this on-going issue you need to know the naming and coding conventions To minimize the impact of changes on the linkage you must also follow the protocol for managing these changes
Changes to both the LMIS and GIS are not necessarily on a regular schedule therefore you may need to update them as needed including adding regularly scheduled periods of review to ensure the crosswalk table is reliable These changes may cause problems so the updating procedures need to identify how and when the naming and coding within the crosswalk table will change the linkage (see appendix A for a description of naming and coding conventions) Two important strategies will minimize the impact of the changes that must be part of any protocol
Clearly define and document the naming and coding conventions for lists used within the crosswalk table
Clearly define and document procedures for updating the crosswalk table lists
when and how to review the list within the crosswalk table
when and how to update the list within the crosswalk table
The existing management structure for managing the SDP list will also influence this protocol additional management may be needed to manage the health facility list and the interaction between the LMIS and other datasets
Maintain the Crosswalk Table Managing the crosswalk table includes maintaining the match between the unique identifiers when changes occur in the two datasets The ability to manage these changes depends on whether the datasets are internal or external Different approaches are needed because of the ability to control changes in the datasets However the overall aim remains the same (1) to keep the link up-to-date and (2) to track changes in the unique identifiers over time so the data can be mapped and analyzed
Internal unique identifiers Consistency in naming and coding is the key to managing the internal unique identifier To ensure consistency begin by defining and documenting the procedures for naming and coding SDPs Set up rules within the database to ensure the procedures for maintaining the naming and coding are followed
Documenting changes over time is also an important part of managing the crosswalk table After you generate the first crosswalk table as changes occur with the SDPsrsquo name andor code document the changes The recommended practice is at a minimum to have the most recent name and code and comments documenting the change including a date-stamp showing when it was last changed Once a year create a copy of the crosswalk table and reference the date Keeping this record of changes
33
and copies of the crosswalk table is important You can use the tables to link data to show changes over time for example to produce an output of commodity levels at SDPs during the last five years you should use the right code for the right period of time to link to the right data
External unique identifiers If the unique identifiers come from external sources it is important to note that the timing of these changes may not match the changes in the internal unique identifiers andor other external sources
As with internal unique identifiers it is important tomdash
maintain consistency over time
understand the coding conventions of unique identifiers
know the procedures for maintaining the unique identifiers
resolve issues and update the crosswalk table
maintain contact with the provider of the external sources
It is important for you to communicate regularly with external providers you need to receive regularly updated versions that you can easily integrate into the crosswalk table Open and frequent communication also enables you to provide updates to the list (for example validated GPS coordinates) which will make the list stronger and will increase its usefulness
Box 8 Differences between Internal and External Unique Identifiers
After a new site is added to the project you can clearly see the differences between an internal and external unique identifier when you look at the results In Zambia a new site opened and began receiving commodities Because the site was new it was not listed on the shared master health facility list from the Ministry of Health (MOH) Therefore it did not have a name or code endorsed by the MOH The new site needed to be added to the supply chain database and it also needed a name and code to track commodities to the site The staff used the same coding structure that the MOH uses for new sites but instead of assigning a facility number they assigned an alphabetic code to establish a unique identifier that was very different than the MOH codes was used These steps ensured that the site had a unique identifier until the MOH released the new facility codes When they released the new code they changed the code in the database to the MOH-endorsed name and code
Build Human Resources Capacity for Linking and Mapping LMIS Data An integral part of maintaining the linkage between the LMIS and GIS is the human resource capacity Build on the existing resources within the projects
Two main activities help build capacity for sustaining the link between a GIS and an LMIS (1) database management and (2) data analysis and use These require two different skill sets but the skills are interconnected Database management relies on staff membersrsquo ability to use LMIS databases and their ability to build and manage a sustained linkage to the GIS datasets Data analysis and use is the ability to use the LMIS data linked to GIS for decisionmaking and managing the supply chain This will drive demand to continue supporting the linkage between the LMIS and GIS
34
Management information system skills Specific skills and tasks needed to integrate the linkage of GIS into LMIS and to manage the SDP list within the LMIS system includemdash
build the crosswalk table database
create database connections that link GIS data and the LMIS database
write queries to extract data from the LMIS database based on defined requirements
maintain and track changes in the crosswalk table
export data from the LMIS data
maintain the live linkage between LMIS and GIS (if deployed)
These are not necessarily GIS-specific skills The data managerrsquos role is to make the LMIS data available for use in a GIS platform In many cases staff that are managing the LMIS databases already have the required skill sets The main adjustments for staff are the scope of work and building technical knowledge in how to use crosswalk tables to link LMIS data to a GIS
Global information system skills within monitoring and evaluation The application of GIS with LMIS data is usually considered part of MampEmdashit uses the LMIS data to show decisionmakers the impact of the supply chain andor to identify where action is needed But how GIS is applied depends on the programrsquos needs For example if a new method of delivery is rolled out to some SDPs and not to others mapping the impact of the two delivery systems can visually show the impact of the new method of delivery and help managers decide whether to roll out the new system or maintain the old one
The skill set for applying the GIS with the LMIS data combines the following
Use GIS software to add and manipulate GIS data to generate the desired outputs
Manage GIS datasets including the LMIS and GIS data such as administrative boundaries road networks and others
Link data from other sources to LMIS data through a GIS
Share and exchange GIS data and outputs with other projects
Interpret and analyze data to provide recommendations
GIS training When building GIS capacity within supply chains you will have two main audiencesmdashtechnical staff and decisionmakers Database managers and MampE officers need the technical capacity to manage and use a GIS with LMIS data Decisionmakers should increase their ability to use GIS outputs for decisionmaking and they should learn how to maximize their investment in the GIS
Technical capacity building focuses onmdash
defining GIS
linking LMIS data to a GIS
mapping LMIS data
integrating other data
generating routine maps and GIS outputs of LMIS data
35
Decisionmaking capacity building focuses onmdash
defining GIS
understanding spatial patterns
using visual data for decisionmaking
using maps for policymaking
Building the demand and use for GIS outputs within a project and building the capacity to supply these outputs can result in greater efficiency and improved outcomes for the whole system
36
Conclusion In this guide we described the processes for assessing whether your system is ready to link GIS data with an LMIS reviewing data and planning to link creating the linkage between a GIS with an LMIS using LMIS data in a GIS platform and building a sustainable linkage
Due to a combination of factors including recent developments in GIS that have made it easier to use and less expensive as well as the expansion in electronic LMIS systemsmdashnow is an opportune time to integrate a GIS with an LMIS system
A GIS usually illustrates the data within the LMIS and makes it more accessible for use by decisionmakers and others
Linking a GIS and an LMIS offer many benefits
When decisionmakers are able to visualize data it is easier for them to interpret it
Mapping makes it easier to explain logistics messages to non-technical stakeholders It conveys information faster than a long report is less technical and it is quickly noticed by others
Mapped data is more transparent because it shows disaggregated points it shows a detailed picture of what is actually happening in a given districtregioncountry and it can help to target supervision visits
Within an in-country supply chain mapping can show the location of commodities at a given point in time (eg central or regional or district stores or in transit) which can be useful when transferring products and can make the best use of the available product
GIS can be used to integrate different datasets for example geo-codes enable you to make linkages between logistics data (from the LMIS) and services data (from the HMIS) at facilities
In these and other ways a GIS can enhance the use and value of LMIS data to strengthen supply chain systems
When deciding whether or not to link a GIS with an LMIS in your country determine if you have sufficient demand financial support and human resources to support this endeavor At the onset stakeholders must clearly state their expected outcomes High-quality LMIS and GPS data must be available Three main elements must be in place (1) physical datasets (GIS and LMIS) (2) procedures for integration and (3) commitment to sustain the linkages As part of your assessment process prior to initiating GIS activities you must take four steps
1 Establish a timeline
2 Review and plan
3 Determine required resources
4 Build capacity
After you decide to incorporate a GIS into the LMIS system the next main steps aremdash
1 Review the existing data and plan to link the LMIS to a GIS infrastructure
2 Build the connection between the LMIS and GIS
37
3 Document build capacity and create processes that will sustain the linkage between the LMIS and GIS
To maintain data quality incorporate GIS linkages into the LMIS procedures already in place consider the environmental context and the design decisions behind the LMIS implementation
Furthermore do not link an LMIS to a GIS as a one-off exercise Build the linkage so it can be sustained and used for multiple purposes Creating the crosswalk table for linking LMIS and GIS data will enable you to link the LMIS data directly with other databases such as Routine Health Information System (RHIS) and human resources and financial databases After you invest the time and resources in creating the linkage between a GIS and an LMIS you will have many opportunities to use it to strengthen the supply chain
38
References Earth Sciences Resources Institute (Esri) website Redlands California httpwwwesricom (accessed
10-03-2011)
MEASURE Evaluation Project Health Facility Technical Working Group 2007 The Signature Domain and Geographic Coordinates A Standardized Approach for Uniquely Identifying a Health Facility Chapel Hill NC MEASURE Evaluation Project
Quantum GIS website Open Source Geographic Information System website httpwwwqgisorgenabout-qgishtml (accessed 10-03-2011)
Republic of Rwanda Ministry of Health website httpwwwmohgovrwindexphpoption=com_contentampview=frontpageampItemid=28 (accessed 10-03-2011)
World Health Organization (WHO) Forthcoming Creating a Master Facility List and a Database of Health Services Geneva WHO
39
40
Appendix A
Method of Coding and Naming Two main considerations when you code and name service delivery points (SDPs) are to ensure (1) that you can maintain the method over time and (2) the logic behind the method is clear when you review the code or name The method of naming is often called the name inventions while coding is often called the coding structure The key is to be consistent within the structure and to have clear procedures for when and how to change the name or code and then document those changes
Documentation is critical because the geographic information system (GIS) is not a one-off linking of data but it can be used to create several maps using updated data over time without regenerating the linkage Certain characteristics of SDPs change over timemdashthey open close move change ownership and change type The physical location of the SDP may or may not change Any of these types of changes could affect the NAME and CODE depending on the naming conventions andor coding structure Therefore you need to manage and track these changes because any change in the NAME andor CODE could break the linkage to the GIS when mapping current andor historical data
Naming Conventions How an SDP name is recorded depends on how the SDP is usually described For example many health facilities are named for the location and the level or type of the facility (dispensary health center hospital) or in some cases after the organization that established the facility When setting up a naming convention keep the name simple and clear For example does the name contain the facility type and is the name of the facility type abbreviated or spelled out
If a facility has multiple names use the official name for the facility Alternative names can be recorded in the list under another field for example ALTERNATIVE NAME You can also use this convention if a facility changes ownership level or type and as a result is given a new name We also recommend that you track all the name changes in a separate table that can be linked to the latest updated master facility list
Coding Structure Of the two main types of coding structuresmdashsequential (a continuous series) and catenated (coded in a series)mdashboth have advantages and disadvantages selecting the method to use depends on how you manage the SDP list
Sequential coding The facility is assigned a number and keeps the same number for as long as it exists New facilities are assigned the next number in the series When facilities close or cease to exist the code is retired The advantage of this system is its stability after a code is assigned to a SDP it will not change a correctly coded list of facilities is easy to maintain One disadvantage is that the code does not contain context If you look at the code no other information about the SDP is available Also to avoid duplicates the code must be centrally assigned and managed If central offices are responsible for assigning codes they must have good communication with the field offices on the coding procedures for new facilities and closing of facilities The most common cause of issues and discrepancies with the coding is poor communication
41
Catenated coding Information about the site is combined to generate a unique identifier The most common catenations are provinceregion code district code and then a sequential value for each site For example Iringa Regional Hospital is in Iringa Region (region code is 08) and Iringa District (district code 01) and it is the first facility (001) therefore the code is 0801001 One advantage of this system is that the code contains context making it easier to manage geographically Also it allows field-based groups autonomy when assigning codes as changes occur at facilities The disadvantage is that over time codes can change when information used to generate the catenated code changes For example when new districts are created the code for some of the facilities will change to the new district This will break the linkage data for SDPs to historical data based on the code change even though the SDP has not changed Therefore all changes in the code should be carefully tracked and managed over time partners and others should receive regular updates
The choice of SDP coding method often reflects the way the SDP list is managed in the country If the facility list is managed centrally a sequential coding system is a good choice For example the master facility list in Kenya uses sequential coding the list is available online at httpwwwehealthorkefacilities
The Rwanda health facility list however is catenated based on district it is also available online at httpwwwmohgovrwindexphpoption=com_contentampview=categoryamplayout=blogampid=37ampI temid=54
The other consideration in selecting a coding method is the historic coding technique Completely changing the system and generating all new codes may create additional complications and confusion Thus when possible use and strengthen the existing coding system instead of creating a new system
42
Appendix B
GIS References The following basic geographic information system (GIS) training materials are available online Listed below are descriptions of the materials and links to other useful sites
Introductory GIS Training Environmental Systems Research Institute (Esri) software Getting Started with GIS (for ArcGIS 10) This introductory online course offered by Esri is the ldquofoundation for understanding what a geographic information system is and the possibilities it offers for discovering patterns relationships and trendshellipinteractive exercises and activities throughout the course you will work with ArcGIS softwarerdquo Available on the Internet the course has three modules you should be able to complete them in about nine hours This is recommended for beginners who have invested in ArcGIS software Access at httptrainingesricomgatewayindexcfmfa=catalogwebCourseDetailampcourseid=1911
Turning Data into Information Using ArcGIS 10 This intermediate course offered by Esri ldquoexamines the scientific methods used to derive useful information from spatial datahellip explore GIS theory related to the visualization measurement transformation and optimization of spatial datardquo The course has six modules you should be able to complete them in about 18 hours Not all the course material is relevant to logistics however it does include a section worth reading ldquoCartography Map Production and Geovisualization GIS-based visualization Representing attributes and spatial objectsrdquo Access at httptrainingesricomgatewayindexcfmfa=catalogwebCourseDetailampcourseid=2017
Quantum GIS (QGIS) Software If you use QGIS training guides and How to guides are available online QGIS users created these materials therefore the training materials are not as professionally written as other proprietary software Because QGIS software is frequently updated the current information is frequently outdated Following are links to the latest versions of training materials available on QGIS
Manuals The QGIS website offers the most recent manual in several languages this is a good starting point for QGIS training materials Access at httpwwwqgisorgendocumentationmanualshtml
How can I do that in QGIS The following URL is a good reference for how to do a number of basic GIS task in QGIS httpwwwqgisorgwikiHow_do_I_do_that_in_QGIS
The USAID| USAID| DELIVER PROJECT developed customized QGIS training materials for Rwanda and Zambia Email a request to askdeliverjsicom
43
Other Training Resources Pennsylvania State University offers free online courses in GIS at the Open Educational Resources website which you can take for no credit Some of the 10-week courses are listed below you may find them useful for expanding your GIS skills Access at httpopenemspsueducourseware
GEOG 482160 Nature of Geographic Information This general course helps ldquopromote understanding of the Geographic Information Sciencerdquo It offers a solid foundation into concepts behind GIS and the questions GIS can answer
GEOG 486 Cartography and Visualization This course covers in detail the principles and technical techniques for the visualization of GIS data The technical instruction is based on ArcGIS It is the next logical step from Geog 482160
GEOG 586 Geographical Information Analysis This advanced course in spatial analysis is for intermediate-to-experienced GIS users who want to expand their GIS skills in detailed spatial analysis
Other GIS options on programming and web mapping are also available
The Presidentrsquos Emergency Plan for AIDS Relief (PEPFAR) e-learning course offers ldquoGeographic Approaches to Global Healthrdquo at the Global Health E-learning Center The course includes an overview of GIS within global public health The course is designed for non-GIS users who are interested in exploring the potential of GIS Access at httpopenemspsueducourseware
To access this free course you will need to register and then login Access at wwwglobalhealthlearningorg
GIS Data Resources Following are GIS data resources available for GIS data
Administrative boundaries
Map Library Contains national and sub-national administrative boundaries in the public domain it primarily focuses on Africa Access at httpwwwmaplibraryorgindexphp
Second Administrative Level Boundaries (SALB) Contains Second Administrative Level Boundaries dataset collected by the UN Geographic Information Working Group (UNGIWG) You must register to access the datasets Access at httpwwwunsalborg
44
Road Networks
Google map maker data download Contains road network and point of interest (POI) data from Google maps To access this data complete an application online and declare that the data will not be used for any commercial purpose or used by any agencyorganizationnon-profit group Access at httpsservicesgooglecomfbformsmapmakerdatadownload
Open Street Map A website of road networks of the world ldquoOpenStreetMap (OSM) follows a similar concept as Wikipedia does but for maps hellip People gather location data from a variety of sources hellip and upload this data to OpenStreetMaprdquo This data is available Access at httpwwwopenstreetmaporg
Cloud made This site collates OSM data into separate countries and regions of the world it can be downloaded at httpdownloadscloudmadecom
Health Facilities
Rwanda health facilities The Ministry of Health provides regular updates for a geo-coded list of all public health facilities in Rwanda it can be downloaded at httpwwwmohgovrwindexphpoption=com_contentampview=categoryamplayout=blogampid=37ampI temid=54
Demographics
Afripop A high-resolution raster dataset (100m2) of the population based on modeling population using in their words ldquoGIS-linked database of census and official population estimate datardquo You need to provide contact information to access the data and download the datasets Access at httpwwwclasufleduusersatatemindex_filesAfriPophtm
GIS data repositories
WHO ndash Geonetwork A repository of metadata (information on the GIS datasets registered with the WHO geo-network) It provides links for requesting the datasets Access at httpappswhointgeonetworksrvenmainhome
International Livestock Research Institute (ILRI) - GIS services ILRI collected and generated an extensive range of spatial data layers that they share with both collaborators and the general public To access the data and download the datasets you must provide contact information Access at http192156137110gis
45
FAO Africover Provides GIS datasets for ten countries Burundi DR Congo Egypt Eritrea Kenya Rwanda Somalia Sudan Tanzania and Uganda To download the data you need to register Access at httpwwwafricoverorgsystemafricover_dataphp
46
For more information please visit deliverjsicom
USAID | DELIVER PROJECT John Snow Inc
1616 Fort Myer Drive 11th Floor
Arlington VA 22209 USA
Phone 703-528-7474
Fax 703-528-7480
Email askdeliverjsicom
Internet deliverjsicom