a guide for laboratory information management system (lims) for
TRANSCRIPT

U. S. Department of the Interior U. S. Geological Survey
A Guide for the Laboratory Information Management System (LIMS) for Light Stable Isotopes—Versions 7 and 8 __________________________________________________________________________________ Open-File Report 00-345 (Revision of Open-File Report 98-284)

A Guide for the Laboratory Information Management System (LIMS) for Light Stable Isotopes—Versions 7 and 8 __________________________________________________________________________________
By Tyler B. Coplen
U.S. Geological Survey
Open-File Report 00-345 Revision of Open-File Report 98-284
Reston, Virginia
2000

U.S. DEPARTMENT OF THE INTERIOR BRUCE BABBITT, Secretary
U.S. GEOLOGICAL SURVEY Charles G. Groat, Director The use of trade, brand or product names in this report is for identification purposes only and does not constitute endorsement by the U.S. Geological Survey. For additional information write to: Copies of this report can be purchased from: Chief, Isotope Fractionation Project U.S. Geological Survey U.S. Geological Survey Branch of Information Services MS 431 - National Center Box 25286, Federal Center Reston, Virginia 20192 Denver, Colorado 80225-0286

iii
CONTENTS Abstract ....................................................................................................................................................... 1 Introduction ............................................................................................................................................... 3 Hardware Requirements........................................................................................................................ 4 Software Requirements ......................................................................................................................... 4 Installation Instructions......................................................................................................................... 5 Installation on a single computer from the Internet ...................................................................... 5 Adding LIMS to the Start menu ..................................................................................................... 7 Installation on a network............................................................................................................... 7 Showing Two-digit or Four-digit Years in Dates ................................................................................. 8 Instructions for Removing LIMS for Light Stable Isotopes 7 and 8..................................................... 8 Microsoft Access Bug Preventing Proper Closing ............................................................................... 9 Basic Concepts of LIMS............................................................................................................................. 10 Tutorial ....................................................................................................................................................... 19 Introduction......................................................................................................................................... 19 Login New Samples Form .................................................................................................................. 24 Import New Project Button ................................................................................................................. 28 Search for a Project Form ................................................................................................................... 28 Projects Form...................................................................................................................................... 29 Sample Form....................................................................................................................................... 31 Add Samples To Be Analyzed Form .................................................................................................. 36 Print Sample Range Form................................................................................................................... 37 Printing a Template and the Samples To Be Analyzed Form............................................................. 38 Mass Spectrometers Form................................................................................................................... 49 Media Form ..................................................................................................................................... 51 Procedure Codes Form........................................................................................................................ 51 Low Procedure Codes Form ............................................................................................................... 52 High Procedure Codes Form............................................................................................................... 52 How to Add Media, Procedures, Low Procedures, and High Procedures .......................................... 54 How to Delete Media, Procedures, Low Procedures, and High Procedures ...................................... 55 Analysis Form..................................................................................................................................... 55 Add or Edit Analyses Form ................................................................................................................ 55 Import Analyses Button ...................................................................................................................... 59 LIMS Default Import Format ...................................................................................................... 59 Analytical Precision Import Format............................................................................................ 60 PDZ Europa Ltd Import Format.................................................................................................. 60 Finnigan MAT Import Format .................................................................................................... 60 Introduction ......................................................................................................................... 60 Dual Inlet Format ................................................................................................................ 61 GCC Format ........................................................................................................................ 63 EA Format ........................................................................................................................... 65 Micromass Import Format........................................................................................................... 65 Correction Factors and Normalization Equations Form..................................................................... 66 Print Samples in Progress Form........................................................................................................... 76

iv
Edit Samples in Progress Form............................................................................................................ 77 Store Samples in Progress Form.......................................................................................................... 81 Add Samples To Samples in Progress Form....................................................................................... 82 Normalization Equation Ranges Form................................................................................................ 82 Installing a New Database File ................................................................................................................... 83 Importing Projects Using the Excel 5.0 Template...................................................................................... 85 Special Features .......................................................................................................................................... 88 Options Form ...................................................................................................................................... 88 Software Preferences................................................................................................................... 88 Form Colors ................................................................................................................................ 90 Alternative Field Names ............................................................................................................. 90 Next Our Lab IDs Form...................................................................................................................... 90 Reference Samples Form .................................................................................................................... 90 Gas Types Form.................................................................................................................................. 91 Mass Spectrometers Form................................................................................................................... 92 Faraday Cup Information Form .......................................................................................................... 93 Mass Spectrometer Error Codes Form................................................................................................ 94 NAWID, NWQL, and Access Forms.................................................................................................. 94 Designing, Creating, and Editing Templates ...................................................................................... 96 Using LIMS with 14C ........................................................................................................................ 103 Using LIMS with 3H ......................................................................................................................... 104 Using LIMS with CFCs .................................................................................................................... 105 Analysis Import Formats ...................................................................................................................... 107 Introduction ....................................................................................................................................... 107 LIMS Default Analysis Import Format............................................................................................. 107 Analytical Precision Analysis Import Format ................................................................................. 107 PDZ Europa Ltd Analysis Import Format ...................................................................................... 107 Finnigan MAT Analysis Import Format ......................................................................................... 110 Micromass Analysis Import Format ................................................................................................ 112 Sample Export Formats .......................................................................................................................... 114 Introduction ....................................................................................................................................... 114 LIMS Default Sample Export Format ............................................................................................. 114 Sample Export Format for Analytical Precision ............................................................................. 114 Sample Export Format for PDZ Europa Ltd ................................................................................. 114 Sample Export Format for Finnigan MAT ..................................................................................... 115 Sample Export Format for Micromass ............................................................................................ 115 Modifying Code of the Mean Final Delta Algorithm............................................................................... 117 Acknowledgments..................................................................................................................................... 120 References ........................................................................................................................................... 121

v
ILLUSTRATIONS Figure 1. LIMS Main Menu ........................................................................................................... 22 2. Login sample tasks ........................................................................................................... 24 3. Tasks to analyze and report data ...................................................................................... 25 4. Login New Samples form .................................................................................................. 26 5. Search for project form ...................................................................................................... 29 6. Projects form ..................................................................................................................... 30 7. Example of project report after being logged in ............................................................... 32 8. Example of a small labels report ....................................................................................... 33 9. Sample form .................................................................................................................... 34 10. Add Samples To Be Analyzed form .................................................................................. 37 11. Example of Print Samples Range report ........................................................................... 39 12. Samples To Be Analyzed form for the EA for C and N .................................................. 40 13. Example of List of Samples To Be Analyzed for the EA for C & N template .............. 43 14a. Page 1 of multi-sheet template (EA for C & N) for an elemental analyzer .................... 44 14b. Page 2 of multi-sheet template (EA for C & N) for an elemental analyzer ........................ 45 14c. Page 3 of multi-sheet template (EA for C & N) for an elemental analyzer ........................ 46 14d. Page 4 of multi-sheet template (EA for C & N) for an elemental analyzer ........................ 47 14e. Page 5 of multi-sheet template (EA for C & N) for an elemental analyzer ........................ 48 15. Mass Spectrometers form.................................................................................................... 50 16. Analysis form ...................................................................................................................... 56 17. Add or Edit Analyses form.................................................................................................. 57 18. Importing Criteria form for dual inlet analyses................................................................... 62 19. Importing Criteria form for continuous flow analyses........................................................ 64 20. Analyses and Normalization Equations form...................................................................... 70 21. Normalization Equation Coefficients form......................................................................... 72 22. Example of Normalization Equation Coefficients report.................................................... 77 23. Print Samples in Progress form ......................................................................................... 78 24. Example of Print Samples in Progress report ................................................................... 79 25. Example of Print Samples in Progress report with Print Aliquot IDs and Interfering Masses checkboxes enabled........................................................................ 80 26. Edit Samples in Progress form .......................................................................................... 87 27. Alta.xls Excel 5.0 template for creating projects ................................................................ 89 28. Options form........................................................................................................................ 89 29. Reference Samples form ..................................................................................................... 91 30. Design Templates form ....................................................................................................... 97 31a. Micromass CO2-H2O equilibration system in author’s laboratory ................................... 98 31b. Template for this system set up with 48 samples................................................................ 98 32. Example of List of Samples To Be Analyzed for the CO2-H2O equilibration template with 48 samples .................................................................................................................. 99 33. Example of the 4-page CO2-H2O equilibration template with 48 samples. .................. 100 34. Ports & References form................................................................................................... 103

vi
TABLES Table 1. Media codes used in LIMS versions 7 and 8 ...................................................................... 11 2. List of sample prefixes used in LIMS versions 7 and 8 ...................................................... 12 3. List of isotopes, isotope ratios, and CFCs that can be selected in LIMS versions 7 and 8................................................................................................................... 13 4. List of sample preparation procedures used in LIMS versions 7 and 8 .............................. 14 5. Minimum and Maximum Sample Preparation Procedure Codes in LIMS versions 7 and 8 as a Function of Isotope Code Between Codes 2 and 15 ......................... 53 6. List of mass spectrometer error codes in LIMS versions 7 and 8.......................................... 95 7. Fields of the LIMS versions 7 and 8 default table for importing isotopic analyses.......... 108 8. Fields of the Analytical Precision Microsoft Access table of isotopic analyses, LIMSInput.......................................................................................................... 109 9. Fields of the PDZ Europa Ltd file of isotopic analyses, Mercury.txt ............................... 109 10. Fields of the LIMS versions 7 and 8 default sample export table SamplesToBeAnalyzed ..................................................................................................... 115 11. Fields of the sample export file for PDZ Europa Ltd .................................................... 116

1
A GUIDE FOR THE LABORATORY INFORMATION MANAGEMENT SYSTEM (LIMS) FOR LIGHT STABLE ISOTOPES—VERSIONS 7 and 8 Tyler B. Coplen ABSTRACT The reliability and accuracy of isotopic data can be improved by utilizing database software to (i) store information about samples, (ii) store the results of mass spectrometric isotope-ratio analyses of samples, (iii) calculate analytical results using standardized algorithms stored in a database, (iv) normalize stable isotopic data to international scales using isotopic reference materials, and (v) generate multi-sheet paper templates for convenient sample loading of automated mass-spectrometer sample preparation manifolds. Such a database program, the Laboratory Information Management System (LIMS) for Light Stable Isotopes, is presented herein. Major benefits of this system include (i) a dramatic improvement in quality assurance, (ii) an increase in laboratory efficiency, (iii) a reduction in workload due to the elimination or reduction of retyping of data by laboratory personnel, and (iv) a decrease in errors in data reported to sample submitters. Such a database provides a complete record of when and how often laboratory reference materials have been analyzed and provides a record of what correction factors have been used through time. It provides an audit trail for laboratories. LIMS for Light Stable Isotopes is available for both Microsoft Office 97 Professional and Microsoft Office 2000 Professional as versions 7 and 8, respectively. Both source code (mdb file) and precompiled executable files (mde) are available. Numerous improvements have been made for continuous flow isotopic analysis in this version (specifically 7.13 for Microsoft Access 97 and 8.13 for Microsoft Access 2000). It is much easier to import isotopic results from Finnigan ISODAT worksheets, even worksheets on which corrections for amount of sample (linearity corrections) have been added. The capability to determine blank corrections using isotope mass balance from analyses of elemental analyzer samples has been added. It is now possible to calculate and apply drift corrections to isotopic data based on the time of day of analysis. Whereas Finnigan ISODAT software is confined to using only a single peak for calculating delta values, LIMS now enables one to use the mean of two or more reference injections during a continuous flow analysis to calculate delta values. This is useful with Finnigan’s GasBench II online sample preparation system. Concentrations of carbon, nitrogen, and sulfur can be calculated based one or more isotopic reference materials analyzed with a group of samples. Both sample data and isotopic analysis data can now be exported to Excel files. A calculator for determining the amount of sample needed for isotopic analysis based on a previous amount of sample and continuous flow area is now an integral part of LIMS for Light Stable Isotopes. LIMS for Light Stable Isotopes can now assign an error code to Finnigan elemental analyzer analyses in which one of the electrometers has saturated due to analysis of too much sample material, giving rise to incorrect isotopic abundances.

2
Information on downloading this report and downloading code and databases is provided at the Internet addresses: http://water.usgs.gov/software/geochemical.html or http://www.geogr.uni-jena.de/software/geochemical.html in the Eastern Hemisphere.

3
INTRODUCTION Over the past two decades, the laboratory of the Isotope Fractionation Project of the Water Resources Division of the U.S. Geological Survey in Reston, Virginia has analyzed water and solid samples submitted by numerous individuals for the determination of stable hydrogen, carbon, nitrogen, oxygen, and sulfur isotope ratios. In order to track these samples, we have developed a laboratory information management system for light stable isotopes (LIMS) based on the relational database program Microsoft Access. This manual discusses this database program and is an update of Coplen (1998). 3H users are directed especially to the section on 3H beginning on page 104. 14C users should pay particular attention to the section on 14C beginning on page 103. CFC users should pay particular attention to the section on CFCs beginning on page 105. Access is available as one of the applications in Microsoft Office Professional. Access allows storage of more data than can be stored in spreadsheet programs. An Access database can be larger than 1 GB. Because LIMS is a relational database application, data are stored in separate tables in such a way as to eliminate or minimize repeating of data. LIMS for Light Stable Isotopes has proven useful in laboratories that (i) receive samples for isotopic analysis from numerous individuals, and (ii) perform at least a few thousand isotopic analyses each year. Users who do not meet at least one, and likely both these criteria, will probably not find worthwhile the investment in time that it takes to learn and fully apply LIMS for Light Stable Isotopes. Experience has shown that approximately one week is required to become reasonably acquainted with LIMS for Light Stable Isotopes and set it up for operation in a laboratory. The user should plan one day for the tutorial (see page 19) and three to four days to set up a new database and begin importing isotopic analyses from mass spectrometers in the laboratory. Although this may seem like a large investment in time, current users report that the rewards in increased productivity and better organization in a laboratory far outweigh this setup cost. LIMS for Light Stable Isotopes can store information about samples and analytical results for the following isotope ratios, isotopes, and CFCs: 2H/1H 11B/10B 18O/16O 37Cl/35Cl UserDefIsotope1 3H 13C/12C 21Ne/20Ne 38Ar/36Ar UserDefIsotope2 3He 14C 22Ne/20Ne 40Ar/36Ar CFC-11 4He 15N/14N 30Si/28Si 83Kr/84Kr CFC-12
7Li/6Li 17O/16O 34S/32S 86Kr/84Kr CFC-113 where UserDefIsotope1 and UserDefIsotope2 are user defined isotope 1 and user defined isotope 2, respectively. Three versions of LIMS for Light Stable Isotopes are available. LIMS for Light Stable Isotopes version 1.4 runs on the Microsoft Windows 3.x platforms under Microsoft Access 2.0. The manual for

4
version 1.4 is Coplen (1998). LIMS for Light Stable Isotopes version 7 operates on the Microsoft Windows 9x or Windows NT 4.0 (or higher) platforms under Microsoft Office 97 Professional or Access 97. LIMS for Light Stable Isotopes version 8 operates on the Microsoft Windows 9x or Windows NT 4.0 (or higher) platforms under Microsoft Office 2000 Professional or Access 2000. This report discusses only versions 7 and 8 of LIMS for Light Stable Isotopes (specifically, versions 7.13 and 8.13). Hardware Requirements LIMS for Light Stable Isotopes version 7 and 8 require an IBM compatible computer. Although a 200 MHz Pentium computer with 24 MB of memory is satisfactory, a 450-Mhz computer with 64 MB of memory is recommended to minimize Access query delays. A screen resolution of at least 800 x 600 pixels is required. Although a 15-inch monitor can be used, a 17-inch monitor serves to view more easily small fonts used on some of the forms. A screen resolution of 1024 x 768 pixels works satisfactorily with 17-inch and 21-inch monitors. A mouse is required. A Hewlett Packard LaserJet III printer was used to generate the reports in this report. If a different printer is employed, the user should confirm that the fonts available are sufficiently small such that no information is omitted from the user’s reports. A laser jet printer with a minimum resolution of 300 dpi is recommended. Software Requirements The software requirements of LIMS for Light Stable Isotopes (abbreviated LIMS from here on) version 7 include: • Microsoft Windows 9x or Windows NT 4.0 (or higher) • Microsoft Access 97 Service Release 2 (SR-2) • Microsoft Excel 97 LIMS version 7 will not function properly with the original version of Access 97 or Access 97 Service Release 1 (SR-1). Users must upgrade to Access 97 Service Release 2 (SR-2) in order to run LIMS. Likewise, LIMS will not run using Access 95. Access 97 is one of the applications in the Microsoft Office 97 Professional suite. The software requirements of LIMS version 8 include: • Microsoft Windows 9x or Windows NT 4.0 (or higher) • Microsoft Access 2000 • Microsoft Excel 2000 Access 2000 and Excel 2000 are found in Microsoft Office 2000 Professional.

5
The complete LIMS applications or only the most recent code file can be downloaded from the Internet (http://water.usgs.gov/software/geochemical.html, or in the Eastern Hemisphere from http://www.geogr.uni-jena.de/software/geochemical.html). Installation Instructions As is done for many database applications, LIMS is divided into a front-end code database file holding Microsoft Access forms, queries, and modules and a backend database file holding the user’s isotopic data. The location of these two files is unimportant—they can reside in separate folders, in the same folder on the user’s hard drive, or on another computer on the user’s network (such as a centrally-located file server). LIMS runs on a single computer or on computers networked together. The front-end code database file may be simultaneously located on several networked computers and these may access the single backend database file simultaneously. In this way several users can edit isotopic data in the laboratory database simultaneously. Installation on a single computer from the Internet The strategy in these instructions is to have the user create a new directory and download a file called a distribution file from the Internet to this newly created directory. The user will then be asked to run this self-expanding compacted distribution file, and this action will create several subdirectories and populate them with files used in the tutorial, which are then used for examples and for running the application. These files will serve as the user’s original copy, much like a CD-ROM serves as the source for repeated installations of a software application. It is recommended that no user files be kept in this new directory structure, and that none of the files in it be edited. These instructions assume that the newly created directory in which you are installing the software is c:\wrdapp, which we strongly recommend. You may use other directories or disk drives, but you must change each occurrence of “c:” and “\wrdapp” in all of the following instructions to the alternative location that you choose. The following installation instructions are for version 7. For version 8 instructions, replace each occurrence of “7” by “8” unless otherwise indicated. The installation on a single computer is as follows:
1. Install Microsoft Access 97 Service Release 2 (SR-2) on your computer (from Microsoft Office Professional 97 CD-ROM if desired) if not already installed. (Install the latest Service Release of Access 2000 or Office 2000 if installing LIMS version 8.) Two optional components must be installed when Access 97 is installed:
i. Database Drivers option under Data Access components, and ii. Microsoft Graph under Office Tools.

6
For LIMS version 8, install Microsoft Access 2000.
2. Install Microsoft Excel 97 on your computer (from Microsoft Office Professional 97 media if desired) if not already installed.
For LIMS version 8, install Microsoft Excel 2000.
3. If a previous version of LIMS is already installed, remove it. If you happened to store the data
storage database (backend database) in the LIMS installation directory, move the database file to another location before removing LIMS.
i. Delete the limsx.xx directory and its contents, where x.xx is the version number of the
previously installed version. ii. Remove “LIMS” from the Start menu: (1) Select Settings from the Start menu, click Taskbar, select the Start Menu
Programs tab, and click Remove. (2) Select the LIMS icon and click Remove.
4. Create the directory c:\wrdapp if it does not already exist.
5. Download the distribution file lims713.exe into the directory c:\wrdapp from the Internet: (http://water.usgs.gov/software/geochemical.html or in the Eastern Hemisphere http://www.geogr.uni-jena.de/software/geochemical.html).
6. Select Run from the Start menu and type: c:\wrdapp\lims713 -d Be sure to include the -d (restore directory structure) option. The following directory structure will be created within the directory c:\wrdapp (the contents of
each directory are shown to the right): lims7.13 ; copy of the README file `-----bin ; LIMS application (front-end database, both executable file and
source code file) `-----bin_data ; data storage database starter file (new backend database) `-----doc ; documentation files `-----template ; Excel template files for importing sample information

7
`-----tutorial ; example files for use in tutorial It is recommended that no user files be kept in the lims7.13 directory structure. If you do plan to
put files in the lims7.13 directory structure, do so only by creating subdirectories of lims7.13. 7. New users of LIMS should create a separate directory for data storage because it is important to
store LIMS user data separately from the LIMS installation directory to avoid overwriting or inadvertently deleting stored data when newer versions of LIMS are installed. (The author uses c:\My Documents\lims for this separate directory.) Copy the database starter file (new backend database), c:\lims7.13\bin_data\lm7data.mdb, to this newly created data storage directory. When prompted by LIMS for the location of the data storage database, specify lm7data.mdb when using this application for your laboratory data needs. Note that it is preferable to go through the tutorial before using lm7data.mdb.
8. Create a directory for storing the executable application program, the LIMS front-end database
file containing the application’s forms, queries, modules, etc. (The author uses c:\My Documents\lims for this directory—the same as in the step above.) Copy c:\lims7.13\bin\lims7.mde into this directory. Note that the LIMS source code file (lims7.mdb) is provided should the user want to modify the code.
Adding LIMS to the Start menu Add “LIMS” to the Start menu of any computer containing the LIMS front-end database file by performing the following steps: 1. Select Settings from the Start menu, click Taskbar, and select the Start Menu Programs
tab. 2. Click Add and then click Browse. In the Browse dialog box, specify All Files in the Files of
type field. Locate and double-click the directory selected in step 8 above. 3. Select lims7.mde and click Open. Click Next, click the Start Menu to select the folder in
which to place the LIMS shortcut, and click Next again. 4. Type “LIMS” for the shortcut name and click Finish. Installation on a network The following network installation instructions are for version 7. For version 8 instructions replace each occurrence of “7” by “8.” Multiple users simultaneously from networked computers can use LIMS. The LIMS executable application file (front-end database file, Lims7.mde) is installed on network

8
computers, as desired. A limit of three users simultaneously accessing the backend database file is advised to avoid record-locking problems. Note that all the network computers on which LIMS will be used must meet the system requirements listed above including the requirements that Microsoft Access 97 (SR-2) be installed with Database Drivers and Microsoft Graph and that Microsoft Excel 97 be installed (Access 2000 and Excel 2000 for version 8). The LIMS application is installed on each computer as follows:
1. To make the LIMS executable file available to other computers on the network, on the computer on which LIMS has been installed, in Windows Explorer, select c:\wrdapp\lims7.13. Select Sharing from the File menu, click Shared As, enter “lims7.13” as the Share Name, and click OK.
2. To make the backend database available to other computers on the network, on the computer on
which the LIMS backend database has been installed, in Windows Explorer, select the directory created in step 7 above for installation of a single computer from the Internet. Select Sharing from the File menu, click Shared As, enter “LIMSDATA” as the Share Name, and click OK.
3. Install the executable application program on each computer by following steps 1, 2, 3, and 7
above for installation of a single computer from the Internet. Upon initially running the application, the user will be prompted by LIMS for the location of the data storage database (backend database). Using Network Neighborhood, specify lm7data.mdb created in “LIMSDATA.”
Showing Two-digit or Four-digit years in dates Access 2000 allows users to display dates in two-digit years or four-digit years. Thus, in LIMS version 8.13 only users can choose to display and print two-digit or four-digit years. To carry out this selection, do the following when the Main Menu form of LIMS is visible. With the mouse grab the Main Menu and pull it down to expose the button Design. Click Design. The message References have not been saved. will appear. Click OK. Select Tools, Options, and General. Enable either of the Use four-digit year formatting checkboxes as desired. Click OK. Select File and Exit. Instructions for Removing LIMS for Light Stable Isotopes 7 and 8 To remove LIMS version 7 open Microsoft Explorer and delete the following: 1. Subdirectories “\lims7.13” and everything in it.

9
2. All occurrences of Lims7.mde, Lims7.mdb, Tutor7.mdb, Lm7data.mdb, Limsdata.log,
Lm7prefs.mdb, Import.log, Lims_err.log. To remove LIMS version 8, replace each occurrence of “7” by “8” and carry out the above steps. Microsoft Access Bug Preventing Proper Closing Upon occasion, after exiting LIMS, Microsoft Access 97 will not close properly but will simply be minimized. When this happens, the only way to close Microsoft Access is to press Ctrl-Alt-Delete and terminate the MSACCESS.EXE process using the Microsoft Task Manager and clicking on End Task. This is a known bug in Microsoft Office software. It is important that Microsoft Access be terminated because any automatic backup software (for example, Total Access Agent, http:/www.fmsinc.com) will be unable to make a backup of the backend database with Access minimized. This bug may also exist in Microsoft Office 2000.

10
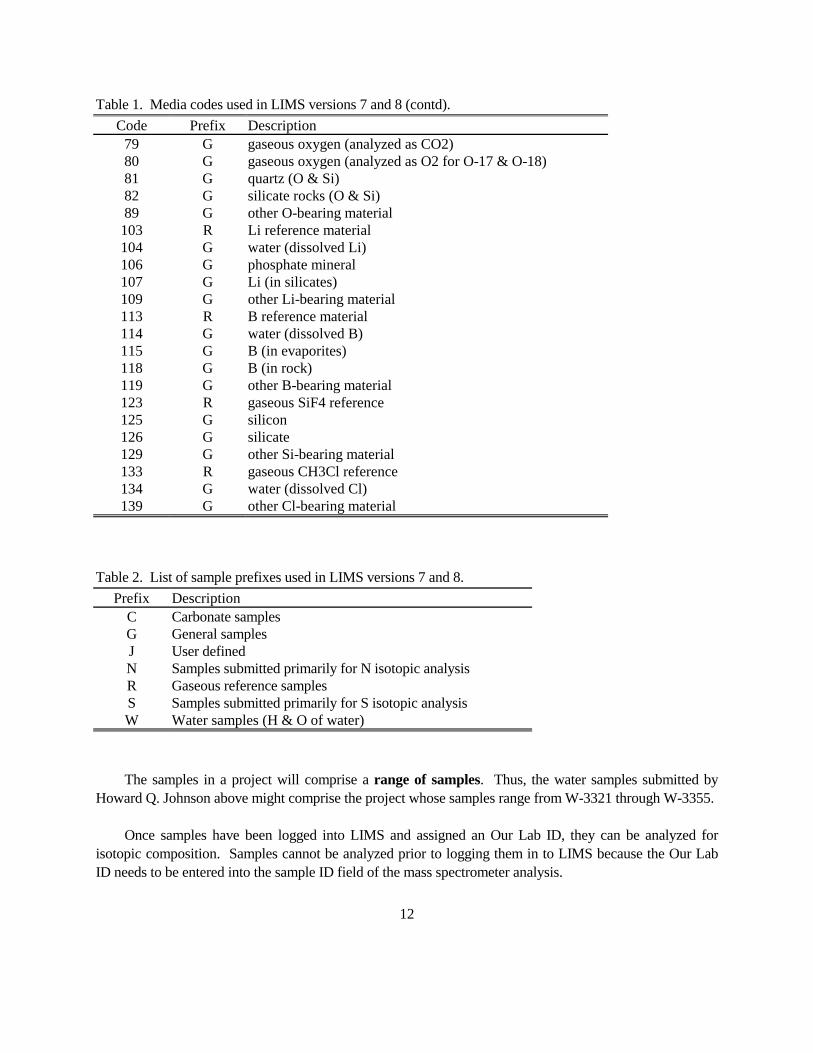
BASIC ONCEPTS OF LIMS Most isotope laboratories can accept a variety of sample types. These sample types are called media in LIMS terminology and represent the type of material or compounds analyzed. The media codes at the writing of this report appear in table 1. There may be slight variations between table 1 and other versions of LIMS because media codes are added or deleted, as necessary, for different versions of this manual. When samples are submitted to a laboratory, they normally are accompanied by a document listing the samples and describing the analyses to be performed. In LIMS, this document is called the sample submission document. Before the samples can be analyzed, the samples must be logged in to LIMS. This activity is commonly called “logging in samples.” The date on the sample submission document is the submission date and is a key for storing the samples in LIMS. A group of samples of a single medium comprises a project in LIMS. Suppose Howard Q. Johnson submits a group of organic toxic waste samples for C and N isotopic analysis and water samples for δ 2H and δ 18O determination. These samples must be logged in as two separate projects with media numbers of 1 and 26 (see table 1). Note that the sample medium is the medium of the samples that arrives at the laboratory, not the media that might be prepared during sample preparation in the laboratory. Thus, coal samples submitted for δ 34S analysis might be converted to BaSO4 or Ag2S during sample preparation, but they would be logged in as medium 28 (C- and S-bearing material) or as medium 69 (other S-bearing material) and not as medium 72 (sulfate mineral) or medium 66 (sulfide mineral). Note that users are free to delete and add media in LIMS as necessary for their specific laboratory use. If a coal sample is to be analyzed for δ 2H, δ 13C, and δ 34S, then it must be logged in twice. The reason for this is discussed below. When samples arrive at the laboratory, each sample must have a unique identifier by which the sample submitter distinguishes his (her) samples. In LIMS this is called the Sample ID or the Field ID. When samples are logged into LIMS, LIMS will assign an alphabetic Prefix and an integer, separated by a hyphen, to each sample. This is called the Our Lab ID in LIMS, and it is the unique identifier by which LIMS knows each sample. Examples are N-3345, W-332, and R-10. The prefix is determined by the medium. Possible prefixes are listed in table 2. Consider sample prefixes as “cabinets” in which samples are stored. Water samples (for δ 2H and δ 18O analysis) are stored in the “W” cabinet and thus have the prefix W. Carbonates are stored in the “C” cabinet, and so on. Samples analyzed primarily for nitrogen and sulfur isotopic composition are given the prefixes N and S, respectively. The prefix R is commonly used for gaseous reference samples, but one may choose samples with other prefixes for use as reference samples. Lastly, the prefix J is user definable. It is not used for any media. Originally it was thought that it would be used for reference samples identified by Julian date, thus, the letter J. In a laboratory analyzing primarily extraterrestrial samples, the prefix J could be used for various extraterrestrial media analyzed by the laboratory. Using this system samples are kept in numeric order and they are easy to locate in cabinets, saving laboratory personnel time.

11
Table 1. Media codes used in LIMS versions 7 and 8. Code Prefix Description
1 W water (H & O) 2 C calcite 3 C dolomite 4 C DIC 5 G gaseous carbon dioxide 6 G gaseous hydrogen 7 G gaseous carbon monoxide 8 R gaseous carbon dioxide reference 9 G gaseous carbon monoxide reference
10 R gaseous hydrogen reference 12 R gaseous nitrogen reference 13 R gaseous nitrous oxide reference 14 R gaseous sulfur dioxide reference 16 R gaseous oxygen reference 19 G H- and O-bearing material 20 G methane (H & C) 21 G coal (H & C) 22 G oil (H & C) 23 G cellulose (H & C) 24 G other H-bearing material 25 G organic C 26 G C- and N-bearing material 27 G C- and O-bearing material 28 G C- and S-bearing material 29 G C- and Cl-bearing material 30 G other C-bearing material 31 C aragonite 45 C other carbonate 46 G graphite 50 N pure nitrogen gas 52 N N-bearing solid (salts, rock, etc) 55 N water (dissolved nitrate) 58 N other N- & O-bearing materials 59 N other N-bearing material 60 N nitrous oxide 64 S water (dissolved sulfate) 65 S water (dissolved sulfide) 66 S sulfide mineral 69 S other S-bearing material 70 S gaseous sulfur dioxide 71 S elemental sulfur 72 S sulfate mineral
12
Table 1. Media codes used in LIMS versions 7 and 8 (contd). Code Prefix Description
79 G gaseous oxygen (analyzed as CO2) 80 G gaseous oxygen (analyzed as O2 for O-17 & O-18) 81 G quartz (O & Si) 82 G silicate rocks (O & Si) 89 G other O-bearing material
103 R Li reference material 104 G water (dissolved Li) 106 G phosphate mineral 107 G Li (in silicates) 109 G other Li-bearing material 113 R B reference material 114 G water (dissolved B) 115 G B (in evaporites) 118 G B (in rock) 119 G other B-bearing material 123 R gaseous SiF4 reference 125 G silicon 126 G silicate 129 G other Si-bearing material 133 R gaseous CH3Cl reference 134 G water (dissolved Cl) 139 G other Cl-bearing material
Table 2. List of sample prefixes used in LIMS versions 7 and 8.
Prefix Description C Carbonate samples G General samples J User defined N Samples submitted primarily for N isotopic analysis R Gaseous reference samples S Samples submitted primarily for S isotopic analysis W Water samples (H & O of water)
The samples in a project will comprise a range of samples. Thus, the water samples submitted by Howard Q. Johnson above might comprise the project whose samples range from W-3321 through W-3355. Once samples have been logged into LIMS and assigned an Our Lab ID, they can be analyzed for isotopic composition. Samples cannot be analyzed prior to logging them in to LIMS because the Our Lab ID needs to be entered into the sample ID field of the mass spectrometer analysis.

13
Samples may be analyzed for a variety of isotopes, isotope ratios, and CFCs (see table 3).
Table 3. List of isotopes, isotope ratios, and CFCs that can be select-ed in LIMS versions 7 and 8.
Code Description
2 2H/1H 3 13C/12C 5 15N/14N 6 34S/32S 7 17O/16O 8 18O/16O 10 7Li/6Li 11 11B/10B 12 30Si/28Si 13 37Cl/35Cl 14 14C 15 3H 16 3He 17 4He 18 38Ar/36Ar 20 40Ar/36Ar 21 21Ne/20Ne 22 22Ne/20Ne 23 83Kr/84Kr 24 86Kr/84Kr 25 UserDefIsotope1 26 UserDefIsotope2 27 CFC-11 28 CFC-12 29 CFC-113
In addition to regular submitters, it is useful to have some additional submitters, such as “Reference” and “Test.” Test and Reference have both submitted samples in the tutorial database discussed below and are included in the table of customers in this database.

14
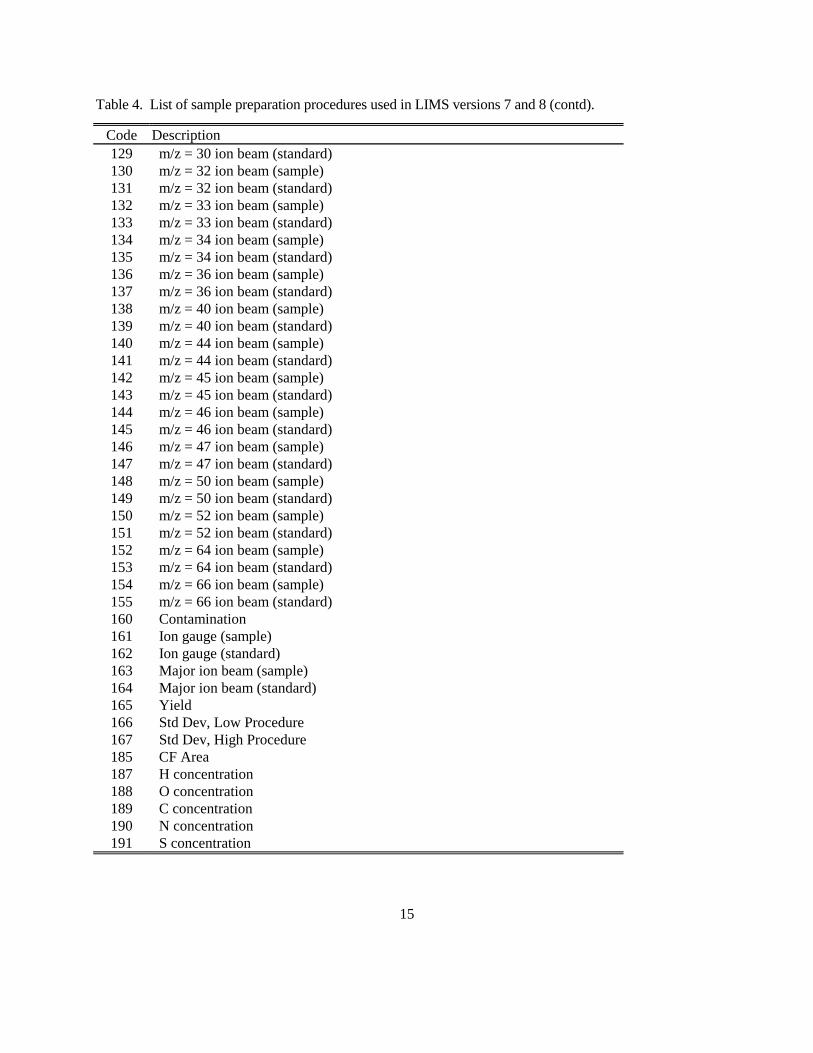
Samples are prepared for isotopic analysis using set methods or procedures. Table 4 lists the procedures (this list may differ slightly in some versions of LIMS) that can be selected. Procedures can be edited, added, and deleted (see page 51) except that procedures that are currently used in other tables in the database should not be deleted. The codes between 100 and 199 are miscellaneous codes for a variety of
Table 4. List of sample preparation procedures used in LIMS versions 7 and 8.
Code Description 0 N/A
100 m/z = 2 ion beam (sample) 101 m/z = 2 ion beam (standard) 102 m/z = 3 ion beam (sample) 103 m/z = 3 ion beam (standard) 104 m/z = 4 ion beam (sample) 105 m/z = 4 ion beam (standard) 106 m/z = 12 ion beam (sample) 107 m/z = 12 ion beam (standard) 108 m/z = 13 ion beam (sample) 109 m/z = 13 ion beam (standard) 110 m/z = 14 ion beam (sample) 111 m/z = 14 ion beam (standard) 112 m/z = 15 ion beam (sample) 113 m/z = 15 ion beam (standard) 114 m/z = 16 ion beam (sample) 115 m/z = 16 ion beam (standard) 116 m/z = 17 ion beam (sample) 117 m/z = 17 ion beam (standard) 118 m/z = 18 ion beam (sample) 119 m/z = 18 ion beam (standard) 120 m/z = 20 ion beam (sample) 121 m/z = 20 ion beam (standard) 122 m/z = 22 ion beam (sample) 123 m/z = 22 ion beam (standard) 124 m/z = 28 ion beam (sample) 125 m/z = 28 ion beam (standard) 126 m/z = 29 ion beam (sample) 127 m/z = 29 ion beam (standard) 128 m/z = 30 ion beam (sample)
15
Table 4. List of sample preparation procedures used in LIMS versions 7 and 8 (contd).
Code Description 129 m/z = 30 ion beam (standard) 130 m/z = 32 ion beam (sample) 131 m/z = 32 ion beam (standard) 132 m/z = 33 ion beam (sample) 133 m/z = 33 ion beam (standard) 134 m/z = 34 ion beam (sample) 135 m/z = 34 ion beam (standard) 136 m/z = 36 ion beam (sample) 137 m/z = 36 ion beam (standard) 138 m/z = 40 ion beam (sample) 139 m/z = 40 ion beam (standard) 140 m/z = 44 ion beam (sample) 141 m/z = 44 ion beam (standard) 142 m/z = 45 ion beam (sample) 143 m/z = 45 ion beam (standard) 144 m/z = 46 ion beam (sample) 145 m/z = 46 ion beam (standard) 146 m/z = 47 ion beam (sample) 147 m/z = 47 ion beam (standard) 148 m/z = 50 ion beam (sample) 149 m/z = 50 ion beam (standard) 150 m/z = 52 ion beam (sample) 151 m/z = 52 ion beam (standard) 152 m/z = 64 ion beam (sample) 153 m/z = 64 ion beam (standard) 154 m/z = 66 ion beam (sample) 155 m/z = 66 ion beam (standard) 160 Contamination 161 Ion gauge (sample) 162 Ion gauge (standard) 163 Major ion beam (sample) 164 Major ion beam (standard) 165 Yield 166 Std Dev, Low Procedure 167 Std Dev, High Procedure 185 CF Area 187 H concentration 188 O concentration 189 C concentration 190 N concentration 191 S concentration

16
Table 4. List of sample preparation procedures used in LIMS versions 7 and 8 (contd).
Code Description 192 Delta 2H received unexpectedly 193 Delta 13C received unexpectedly 195 Delta 15N received unexpectedly 196 Delta 34S received unexpectedly 197 Delta 17O received unexpectedly 198 Delta 18O received unexpectedly 200 DI, Delta 2H 201 DI, 2 mL, 30 deg., Pt equil., Delta 2H 210 DI, Zn reduction, Delta 2H 220 DI, U reduction, Delta 2H 225 DI, combus. & U reduction, Delta 2H 240 CF, Delta 2H 245 CF, H2 gas, Delta 2H 250 CF, TC/EA, Delta 2H 300 DI, Gaseous carbon dioxide, Delta 13C 303 DI, Filtered, Delta 13C 312 DI, 100% phosphoric acid, Delta 13C 340 DI, CH4 combus. to CO2, Delta 13C 352 DI, Quartz sealed tube, 800 deg, Delta 13C 354 CF, CO2 gas, Delta 13C 355 CF, GCC, Delta 13C 356 CF, EA, Delta 13C 360 CF, CO gas, Delta 13C 362 CF, CO2 gas, Delta 13C 500 DI, Gaseous nitrogen, Delta 15N 510 DI, Total N, solid sample, combust, Delta 15N 580 DI, Delta 15N 581 CF, N2 gas, Delta 15N 582 CF, N2O, Delta 15N 583 CF, GCC, Delta 15N 584 CF, EA, Delta 15N 589 CF, TC/EA, Delta 15N 600 DI, Delta, Delta 34S 662 CF, EA, Delta 34S 688 CF, SO2, Delta 34S 700 DI, ref. or working std O2, Delta 17O 780 DI, gaseous O2, Delta 17O 784 CF, O2 gas, Delta 17O

17
Table 4. List of sample preparation procedures used in LIMS versions 7 and 8 (contd).
Code Description 800 DI, 2 mL equilibration, Delta 18O 809 DI, Guanidine H2O, Delta 18O 810 DI, Delta 18O 820 DI, 25 deg., 100% phosphoric acid, Delta 18O 821 DI, 50 deg., 100% phosphoric acid, Delta 18O 850 DI, SO2, Delta 18O 859 DI, User definable oxygen-isotope fractionation factor, Delta 18O 860 DI, BrF5, Delta 18O 875 CF, CO gas, Delta 18O 878 DI, O2 gas converted to CO2, Delta 18O 879 CF, O2 gas converted to CO2, Delta 18O 880 DI, O2 gas as O2, Delta 18O 881 CF, O2 gas as O2, Delta 18O 883 CF, convt. to O2 for analysis, Delta 18O 884 CF, convt. to CO2 for analysis, Delta 18O 886 CF, CO2, Delta 18O 887 CF, N2O, Delta 18O 888 CF, SO2, Delta 18O 889 CF, TC/EA, Delta 18O 890 DI, N-bearing material, Delta 18O
1030 Delta 7Li 1040 Delta 7Li 1060 Delta 7Li 1070 Delta 7Li 1090 Delta 7Li 1130 Delta 11B 1140 Delta 11B 1150 Delta 11B 1180 Delta 11B 1190 Delta 11B 1230 DI, Delta 30Si 1240 DI, BrF5, Delta 30Si 1320 DI, Delta 37Cl 1330 DI, Delta 37Cl 1340 DI, diss. Cl, Delta 37Cl
purposes. Thus, ion gauge readings of the sample and standard (161 and 162) can be stored. Concentrations of C, N, and S from elemental analyzers can be stored (codes 189, 190, and 191). Codes 200 to 299 are for δ 2H procedures, codes 300 to 399 are for δ 13C procedures, etc. The abbreviations “DI” and “CF” are dual inlet and continuous flow.

18
When samples are analyzed for isotopic composition, LIMS requires that each mass spectrometric isotopic analysis have a unique integer value, known in LIMS as the analysis number. This is required for its relational database structure. In the case that a mass spectrometer measures two isotopic ratios simultaneously, such as δ 13C and δ 18O on CO2 with a mass spectrometer having three Faraday-cup collectors, both isotope-ratio analyses can be stored with the same integer analysis number. For compound specific continuous flow isotopic analyses, δ values from as many as 999 peaks can be stored for each analysis number. Because the majority of the samples analyzed by the author’s laboratory have been either water or carbonate samples, each sample has normally required two isotopic analyses: δ 2H and δ 18O for water samples and δ 13C and δ 18O for carbonates, for example. Thus, the LIMS Table of Samples has been designed to store and present conveniently two types of isotopic analyses for a medium. Usually, the analysis of the element with the lower mass is the low analysis, which is analyzed using a low procedure and generates a low delta value. The other is the high analysis, which is analyzed using a high procedure and generates a high delta value. If a medium has only a single isotope, such as gaseous nitrogen, then it has no high procedure code or high delta value. One consequence of this scheme is that occasionally one may want to analyze a sample for three isotopic ratios (C, N, and S, for example). There are two possible solutions to this problem. One is to save the third isotopic ratio using a procedure code between 100 and 199. As many as 100 parameters can be stored for each analysis using these special procedure codes. For an example of the use of these codes, see page 61. Alternatively, the user might log in the sample twice. For example, one might use medium 26 (C- & N-bearing material) and medium 69 (other S-bearing material). If this is not acceptable, the user can modify the existing structure of LIMS and can add more fields to the Table of Samples and to the samples form. LIMS is reasonably flexible and can be modified by users. Users can add new media codes and procedure codes (see page 54), or delete existing ones. Once samples have been analyzed, the isotopic analyses are imported into LIMS. The isotopic results are “corrected” using isotopic reference materials analyzed with the samples. The isotopic results are then saved in the table that contains the sample information. This activity is called “storing data.” Once all the samples in a project have been analyzed and the isotopic results have been stored, the project is reported. This is commonly called “reporting results.” The next section is a tutorial that describes these activities in more detail.

19
TUTORIAL Introduction This tutorial uses an example database as the LIMS backend database file to help the reader to familiarize himself or herself with the various forms and reports in LIMS, and it will illustrate where and how various types of data are stored in LIMS. These instructions assume that LIMS was installed in the directory c:\wrdapp. If this is not the case, the user must change each occurrence of “c:” and “\wrdapp” in all of the following instructions to the alternative location that was chosen. If LIMS has been used previously and a new database has been installed, the user should record any preferences that have been saved in the configuration table because they will be changed during this tutorial. After the tutorial is completed and the new database is reinstalled, the user can edit these preferences to their values prior to execution of the tutorial. The following instructions are for LIMS version 7. For version 8 replace each “7” by an “8.” To set up the tutorial, perform the following steps:
1. Install LIMS on the computer following the instruction on page 5 if not already installed. 2. Copy the files in the subdirectory c:\wrdapp\lims7.13\template to a diskette and label it “LIMS for
Light Stable Isotopes 7—Excel 5.0 Template for Creating Sample Projects.” 3. Create a new directory to hold the backend database file. Copy the file
c:\wrdapp\lims7.13\tutorial\Tutor7.mdb to this new directory. Copy the remainder of the files in the lims7.13\tutorial directory to a diskette labeled “LIMS for Light Stable Isotopes 7.13—Tutorial.”
4. If another backend database has been installed, the user will need to temporarily change its name to
force LIMS to query the user for Tutor7.mdb just created.
5. Start LIMS by selecting LIMS from the Start button menu or run Access 97 and open the file Lims7.mde created in step 8 on page 7. Be careful not to open the file c:\wrdapp\lims7.13\bin\lims7.mde.
After the features of LIMS have been explored using the tutorial, a new backend database (created in step 7 on page 7) can be installed (see page 83). Be sure to delete the database for the tutorial (or change its name or move it to another folder) to force LIMS to query the user for the location of the new database. The figures and text in this tutorial apply to the U.S. English regional settings for Microsoft Windows. If another regional setting is used, reports and input will correspond to that setting. Thus, for Sweden a date-time would be entered as 1996-09-30 16:32 and a depth of three and one-half meters would be entered

20
as 3,5. If LIMS indicates that an entry error has been made and that the entry needs to be a numeric value, the user should check to be sure that the correct decimal separator (comma versus decimal point) is being entered. WARNING. The reports shown in this tutorial were printed using a Hewlett Packard LaserJet III printer. Some printers will not support the same fonts as the HP LaserJet III. If the user’s printer employs a font with wider characters, some characters may be omitted from LIMS reports. The user should compare closely the printer output of Figs. 7, 8, 11, 13, 14, 23, 25, and 26 to ensure that no characters have been omitted. In the event that characters have been omitted, the user should contact the author (Email: [email protected]). When one opens LIMS for the first time, the code module will be unable intentionally to locate the backend database. A message similar to the following will appear: Welcome to LIMS for Light Stable Isotopes. Please find the database for your samples and
analyses. For running the tutorial it is Tutor7.mdb. The user should click OK. The file dialog form will appear and the user should locate the backend database, Tutor7.mdb, that was created in step 3 on page 19. LIMS will then take a minute or so to complete linking to tables in the backend database. Once this process is complete, a message similar to the following may appear: A previous LIMS preferences file has been found. LIMS will replace the preferences and tokens
in this new version of LIMS with those saved by the previous version of LIMS. If this message does appear, click Cancel. A message similar to the following may appear: Welcome to LIMS for Light Stable Isotopes. Currently, U.S. paper (8.5" x 11") is enabled for reports. To change this option, click Special
Features on Main Menu, click Options, click Edit, click A4, click Save, and click Close. Click OK. LIMS will now display an information message about the new features of this version, similar to the following:
In this new version of LIMS, several parameters previously edited in the Options form (previously called the Configuration form) have been moved to the Mass Spectrometers form. These include:
1. Checking for missing analyses when starting LIMS. 2. Requiring port numbers to be integers between 0 and 99.

21
3. Requiring dual-inlet std name to be an integer between 1 and 365. 4. Storing (dual inlet) major ion beam values. 5. Storing (dual inlet) major ion gauge values. 6. Storing (dual inlet) interfering masses. 7. Storing continuous flow areas. 8. Calculating and storing continuous flow EA concentrations. 9. Our Lab IDs of continuous flow reference gases. 10. Spreadsheet column headings of GCC delta values.
Users can now edit these options for each mass spectrometer individually. Click the Special Features button on the Main Menu form, and click the Mass Specs button.
These items need not be discussed here. They will be discussed at the appropriate time in this tutorial. Click OK. The LIMS Main Menu is now shown on the screen. Click Special Features and the Special Features sub form will open on the Main Menu (Fig. 1). The functions of the buttons on the Main Menu are summarized below. Projects Opens the Search Projects form and allows the user to locate a project (group of
samples of the same media). New Project Login Login samples to be analyzed. Import New Project Login samples to be analyzed using the Excel diskette provided by the sample
submitter. Samples & Analyses Open the sample form with the desired sample, and open the analysis form if the
sample has been analyzed. Print Sample Range Prints a range of samples, such as between C-4444 and C-4449. Import Analyses Import isotopic analyses from a diskette written to by a mass spectrometer. Print Templates Edit the list of samples to be analyzed and print a multi-sheet template for laying
out the samples for organized isotopic analysis. Add or Edit Analyses Add or Edit mass spectrometric isotopic analyses. Correction Factors and Allows the user to adjust (“correct”) the isotopic data to account for drift in Normalization Equations the working standard, blank correction, etc. Normalization Equation Allows the user to view and print out the equations for the corrections made in Ranges the step above.

22
Fig. 1. LIMS Main Menu. Edit Samples in Progress Allows the user to view isotopic analyses of samples just analyzed and to ignore
analyses of samples in the calculation of their final mean δ value. Print Samples in Progress Prints or saves to an Excel file the isotopic analyses of samples recently analyzed,
calculating final δ values where possible. Store Samples in Progress Once the user is satisfied with the mean final δ value of a sample, the δ value is
saved in the Table of Samples. Add Samples to Samples Reevaluate the isotopic analysis that went into determining the final mean in Progress δ value of a sample. Exit Exit LIMS and close Access 97. About Information about LIMS for Light Stable Isotopes. Options Edit various preferences and parameters in LIMS. Prefixes & Next Sample # Edit the integers of the Our Lab ID numbers assigned during login of samples.

23
References Add, edit, or delete information about laboratory reference materials. Gas Types Add, edit, or delete information about the type of gas analyzed by mass spectrometers—this information is used when importing isotopic analyses . of some data formats. Mass Spec Install, edit, or delete a mass spectrometer. Mass Spec Error Codes Add, edit, or delete mass spectrometric error codes. Media Add, edit, or delete media. Procedures Add, edit, or delete procedure codes. Low Procedures Add, edit, or delete low procedure codes. High Procedures Add, edit, or delete high procedure codes. Data log Future use. LIMS Log A log of LIMS code errors. Import Log Summary of importing activities. Error Log A log of LIMS code errors and importing errors. Templates Add, edit, or delete the instructions for designing a multi-sheet paper template used
for laying out samples to be analyzed as a group (such as in a carousel). Maint Check the database for various kinds of errors in the backend database where the
user’s data is stored. There are two ways to actuate each of these buttons. First is to click them using the mouse. The second is to use the access keys provided. Access keys are a two-key combination consisting of the Alt key simultaneously with another key. For example, the About button has the letter b underlined. Thus, to activate the About button, type Alt + B (hold the Alt key down and press the B key). This feature is implemented on most forms in LIMS. Click OK to close the message box. The tasks necessary to login samples, analyze samples, and report isotopic results are shown in Figs. 2 and 3. This tutorial takes the reader through these tasks. In Figs. 2 and 3, tasks are shown on the left and the applicable Main Menu (Fig. 1) button to execute the task is shown on the right. The user should now click Close to close the Special Features sub form.

24
Login New Samples Form When samples are delivered to a laboratory, they normally are sent with a document listing the samples and describing the analyses to be performed. In LIMS this is called the sample submission document. The date on this document is the submission date and is a key for storing projects, a group of the same medium, in LIMS. Suppose a box of organic samples from Howard Q. Johnson has arrived in the laboratory for isotopic analysis. Click New Project Login on the Main Menu to open the Login New Samples form (Fig. 4). The Login New Samples form allows the user to enter basic information about a project, such as the date, sample submitter, Sample ID’s, country, and other information. When the Login New Samples form opens, the country combo box is set to the default country selected in the LIMS Options form (see page 88 for instructions), which one accesses by clicking Special Features on the Main Menu. After completing Tasks to login samples: Use this button on the Main Menu of LIMS for Light Stable Isotopes: 1. Samples received 2. Login samples to add them New Project Login
to the Table of Samples 3. Print labels Projects Print Labels 4. Add samples to Table of Projects Templates
Samples to be Analyzed 5. Label sample containers 6. Put samples into cabinets for
storage until analyzed Fig. 2. Login sample tasks.

25
Tasks to analyze and Use this Button on the Main Menu of report data: LIMS for Light Stable Isotopes: 1. Generate daily list of Samples New Project Login
to be Analyzed and Template 2. Technician loads template with
samples 3. Technician analyzes samples
with mass spectrometer 4. Technician saves isotopic data
to diskette 5. Import isotopic data from diskette Import Analyses
(LIMS will add samples to Table of Samples in Progress)
6. Determine additive correction Correction Factors and factor and expansion factor Normalization Equations
and apply to isotopic data 7. Print list of isotopic results in Print Samples in Progress
Table of Samples in Progress 8. Review and edit isotopic Edit Samples in Progress
results 9. Add samples reruns to Table
of Samples to be Analyzed 10. Store isotopic results to Table Store Samples in Progress
of Samples in Progress (LIMS will remove samples from Table of Samples in Progress)
11. Remove samples from Table Projects Templates of Samples To Be Analyzed
12. Print reports and save isotopic Projects Results data in ASCII or Excel format
Fig. 3. Tasks to analyze and report data.

26
Fig. 4. Login New Samples form. the LIMS tutorial and installing a new backend database, the user will want to change the default country to his or her own country. Enter the date on the sample submission letter. If U.S. regional settings are in effect, the user would enter “June 6, 1995” or “6/6/95” and press the Enter key. For Swedish regional settings, the user would enter “1995-06-06.” Select “Johnson” as the customer from the Customer combo (combination) box by clicking on the down arrow on the right side of the control to open it. Then select Johnson by clicking on Johnson. Select “26 --> G [C & N] C- and N-bearing material.” (Note that this informs the user that for medium number 26, the sample prefix is G, the abbreviation of this medium is “C & N,” and the medium description is “C- & N-bearing material.”) Set the Country to “Canada.” Set the State/Province to “002! BC, British Columbia.” For the Project Purpose or Title enter “Weller Toxics Study.” For Location put “Victoria, BC.” Howard Johnson submitted 18 samples with Sample ID’s of Yta-01 through Yta-10

27
and Yta-12 through Yta-19 that can be added as a range of samples. Click Add Range. Since we will be omitting one Yta value, it will be easier if we add 19 lines and delete 1. Enter “Yta-01” in the From box. Press the Enter key. Enter “Yta-19” in the to box. Press the Enter key or the Add button and the message similar to the following appears. You have chosen to add 19 rows. Is this correct? Click Yes. Now one needs to delete “Yta-11.” Using the vertical scroll control, bring “Yta-11” into view if it is not already in view. Click on the gray area at the far left of the screen in the row Yta-11. This row should be selected (blackened). Press the Delete key on the keyboard. A message similar to the following should appear: You are about to delete 1 record(s). If you click Yes, you won’t be able to undo this Delete operation. Are you sure you want to
delete these records? Click Yes and save the project by clicking Save. A message similar to the following appears. Create project record 06/06/1995 Johnson, Howard Q G-16 to G-33 Click OK. The project has now been added to the database and the second task in Fig. 2 is completed. A comment about the values entered in the Add Range form above is useful. The user might be tempted to enter Yta-1 (instead of Yta-01) and Yta-19. If these values are entered, LIMS responds with the message Invalid Range because LIMS is unable to determine correct sample IDs. (This problem may be attacked in a future version of LIMS.) In any one project, Sample IDs must be unique. If one adds two samples with identical Sample IDs, a message similar to the following appears. The changes you requested to the table were not successful because they would create duplicate
values in the index, primary key, or relationship. Change the data in the field or fields that contain duplicate data, remove the index, or redefine the index to permit duplicate entries and

28
try again. This is Microsoft Access’ way of informing the user that one of the duplicate Sample IDs will need to be changed to continue. Import New Project Button The second way to add a project to LIMS is by clicking Import New Project on the Main Menu to importing sample headings (the information about each sample such as collection date, latitude, etc.) and project information from an Excel 5.0 file on a diskette. Commonly sample submitters send diskettes with sample information to the laboratory with their samples (see page 85). This method has the great advantage that the sample submitter enters all of the Sample IDs; thus, laboratory personnel do not need to retype any of them. Any mistakes are the responsibility of the sample submitter! Search for a Project Form Now is a good time to print a project report and to print adhesive-backed labels for the samples just entered (the third task in Fig. 2). These tasks are performed from the Projects form. Click Projects on the Main Menu. The Search for a project form (Fig. 5) should open. In the sub form (the light area on the form), the entry 02/08/96 Test G-11 to G-15 Analytical Precision mass spectrometer test Main Facility or similar is highlighted. The first column contains the submission date of the project, the second is the last name of the sample submitter, the third is the range of samples in the project, the fourth is the project title or purpose, and the fifth is the location. One can use the vertical scroll bar or the up and down arrow keys to move to another project. Note that there are about 30 projects in the database. Several projects contain only a single sample. The first twenty or so projects have been found useful in the author’s laboratory. These include: 1. Several test or “garbage” samples for testing, such as W-1, C-1, etc, 2. C-3, G-3, N-3, and S-3 are defined to be a blank (with no boat) for an elemental analyzer, 3. C-4, G-4, N-4, and S-4 are defined to be an empty boat for an elemental analyzer, and
4. R-1 through R-5 are defined to be continuous flow reference gases, H2, N2, etc. To open a project highlight it, and either double-click it, press the Enter key, or click Find (but don’t do it yet). One can limit searches by using the search tools on this form. Suppose one only wants to see the samples submitted by Johnson. From the Name combo box select Johnson. Click Search. Only the six

29
Fig. 5. Search for project form. Johnson projects should be displayed. One can limit searches with multiple criteria. Suppose one only want to see Johnson’s prefix G samples. From the Prefix combo box select “G! General” and then click Search. Two projects are shown. If only one project had been displayed, LIMS would have opened the project. Projects Form Select the project “06/06/95 Johnson” and double-click on it to open the Projects form (see Fig. 6). On the Projects form those text boxes that cannot be edited are shown with a darker background. If one wants to edit an entry, one must first click Edit. This feature is used throughout LIMS to prevent workers from accidentally changing data.

30
Fig. 6. Projects form. The following describes the buttons on the Projects form: List displays all the projects in the database. The four navigation buttons, , allow one to go to the first, the previous, the
next, and the last project, respectively. The navigation buttons work the same way on other forms in LIMS. When the current project is the last project, the next and the last navigation buttons are grayed out to indicate that they are disabled.
Delete allows one to delete a project (and all the samples in that project). Thus, one could delete the
Johnson project entered (but do not do it). Delta Plot loads Microsoft Graph and displays a δ 2H versus δ 18O plot of samples in the project (unless
Microsoft Graph has not been loaded, and then one needs to add this component from the Microsoft Office 97 Professional installation media). This button is enabled only for medium 1, water samples, and is demonstrated later in this tutorial.
Results allows one to save (i) project δ values as an ASCII text file to a diskette or (ii) data from an
entire project to a diskette in Excel 5.0 format. The latter is a useful feature because sample submitters occasionally need all of the sample information (latitude, longitude, etc., including δ values) in an Excel spreadsheet. This button provides LIMS with that functionality.

31
Import transfers data from an Excel 5.0 spreadsheet to the Table of Samples (see page 85). Two unpopulated (empty) Excel 5.0 spreadsheet templates are provided (see page 85) in the directory c:\wrdapp\lims7.13\template if LIMS was installed using the recommendations herein. They are useful when someone does not have all of the required sample information when samples are submitted. For example, latitudes and longitudes are sometimes provided after samples have been submitted. Using a populated spreadsheet, data can be added to the database without retyping by laboratory personnel.
Print Report prints a report containing the δ values of all samples in the selected project. Print Labels and Print Small Labels print two sizes of labels, 30 or 80 labels per page of U.S.
standard 8.5-inch by 11-inch label stock, or 21 or 84 labels per page on A4 stock, respectively. The Avery stock numbers for 30 and 80 labels per page are 5260 and 5267, respectively. These labels are also available in colors. A4 stock with 21 labels per page is available from Ryman (stock number P21). Avery (stock number L7656) provides 84 labels per A4 page.
The user should now click Print Report to print a report containing the δ values of all samples in the project (Fig. 7). Since the project has just been logged in and no samples have yet been analyzed, no isotopic results are shown on the report. The user should compare his or her printer output with that in Fig. 7 to ensure that no characters have been omitted. Click Print Small Labels. LIMS will prompt if one wants to print labels for every sample in the project. The user has the possibility to print a single label or labels for a range of samples. Click Yes to print a label for every sample in the project. LIMS will query the user for the number of labels for each sample. Enter 3 and click OK or press the Enter key. The printer should print a page of 56 labels (Fig. 8). The user should compare his or her printer output with that in Fig. 8 to ensure that no characters have been omitted. Had the user loaded adhesive label stock in the printer, adhesive labels for samples would have been printed. This completes the third task in Fig. 2.
Sample Form The user should add some geographic information to some of the Johnson toxic waste samples. Click Samples on the Projects form to open the Sample form (Fig. 9). The Sample form shows the first sample in the project (G-16). (One can also open the Sample form by clicking Samples & Analyses on the Main Menu.) Click List and select G-17. Alternatively, the navigation buttons can be used to move through samples in a project. On the Sample form, there are ten fields that the user can set with the user’s own defined captions (also see page 86). They are: Sample ID User Def Caption 6 User Def Caption 2 Caption 7 User Def Caption 3 Other Info

32
Submission: 06/06/1995 Johnson, Howard Q G-16 to G-33 1/19/1998 Medium: 26 ! G [C & N] C- and N-bearing material Purpose: Weller Toxics Study Location: Victoria, BC δδδδ 13C δδδδ 15N Collection VPDB(‰) AIR(‰) Sample ID: Date Our Lab ID Value Comment Value Comment Yta-01 G-16 Yta-02 G-17 Yta-03 G-18 Yta-04 G-19 Yta-05 G-20 Yta-06 G-21 Yta-07 G-22 Yta-08 G-23 Yta-09 G-24 Yta-10 G-25 Yta-12 G-26 Yta-13 G-27 Yta-14 G-28 Yta-15 G-29 Yta-16 G-30 Yta-17 G-31 Yta-18 G-32 Yta-19 G-33
Fig. 7. Example of project report after being logged in. No δ values are shown because no isotopic analyses have been performed on these samples.

33
G-16 G-16 G-16 G-17 Yta-01 Yta-01 Yta-01 Yta-02 G-17 G-17 G-18 G-18 Yta-02 Yta-02 Yta-03 Yta-03 G-18 G-19 G-19 G-19 Yta-03 Yta-04 Yta-04 Yta-04 G-20 G-20 G-20 G-21 Yta-05 Yta-05 Yta-05 Yta-06 G-21 G-21 G-22 G-22 Yta-06 Yta-06 Yta-07 Yta-07 G-22 G-23 G-23 G-23 Yta-07 Yta-08 Yta-08 Yta-08 G-24 G-24 G-24 G-25 Yta-09 Yta-09 Yta-09 Yta-10 G-25 G-25 G-26 G-26 Yta-10 Yta-10 Yta-12 Yta-12 G-26 G-27 G-27 G-27 Yta-12 Yta-13 Yta-13 Yta-13 G-28 G-28 G-28 G-29 Yta-14 Yta-14 Yta-14 Yta-15 G-29 G-29 G-30 G-30 Yta-15 Yta-15 Yta-16 Yta-16 G-30 G-31 G-31 G-31 Yta-16 Yta-17 Yta-17 Yta-17 G-32 G-32 G-32 G-33 Yta-18 Yta-18 Yta-18 Yta-19 G-33 G-33 Yta-19 Yta-19
Fig. 8. Example of a small labels report.

34
Fig. 9. Sample form. User Def Caption 4 Top User Def Caption 5 Bottom (Note that there are no periods in any of the above captions. A period is not allowed in a field name (see page 86 for all disallowed characters). Perhaps a user is analyzing urine from diabetic patients. One of the fields could be defined as “Days After Dose.” In case samples are for repay, the Project Account field may be useful. There are over 200 “countries” on the Countries combo control. This information comes from the 1997 World Factbook, prepared for the U.S. Dept. of State for use by U.S. embassies (Central Intelligence Agency, 1997). The information can be updated by editing the underlying tables of countries and states. States, provinces, or administrative districts are listed for some countries.

35
One can use as many of the fields on the Sample form as are desired. If only a few fields will ever be used, one could easily modify the code and make unused labels and text boxes invisible. If this is done, one may also want to make the same changes to the Range of Samples report (page 37). On the Sample form, one can see blocks identified as Low Analysis and as High Analysis. These will contain the low and high δ values discussed on page 18 once the sample has been analyzed and δ values have been stored. A Comment field is available for both the low and high delta values. The user might use these to indicate the standard deviation of the analyses, to indicate a sample bottle has broken, etc. Clicking Analyses opens the Analysis form with analyses of the sample. Since this project has just been logged in, no isotopic analyses yet exist. Try it. Print Project will print a report identical to the report generated by clicking Print Project on the Projects form (Fig. 7). Edit enables editing of the information in the light colored text boxes (those not grayed out). The latitude and longitude of many samples are important. One can enter or display data in either degrees-minutes-seconds (DMS) format (e.g., 1214512) or in decimal degrees format (e.g., 121.75333). The symbols °, ', and " are not accepted for data entry. One can set the display default to either Decimal Degrees or DMS using a checkbox on the Options form (see page 88). The user needs to enter the latitude and longitude of sample Yta-02. To locate this sample, click List to display all the samples in the project. Click Yta-02; it is G-17. If necessary, click Decimal Degrees to toggle the format to DMS. Click Edit. Click the Lat text box and enter “483807” for the latitude. Press the Enter key. Enter “-1233015” for the longitude (the minus sign is for the Western Hemisphere). Press the Enter key. The accuracy of the latitude and longitude can be selected if desired. The elevations and depths of some samples are important. One can view lengths in meters or feet. Sample Yta-02 came from a site with an elevation of 142 meters. If the length units are set to Feet, click to change it to Meters. Click the Elevation text box and enter the elevation of “142.” Press the Enter key. The depth to the top of the perforated interval in the well is 3.5 m. Enter “3.5” in Top and press the Enter key. The depth to the bottom of the perforated interval in the well is 4 m. Enter “4” in Bottom and press then Enter key. Both a collection date/time and ending date/time are available. The ending date/time is useful for rain samples. The collection date/time of sample G-17 is February 2, 1995 11:30 a.m. Click the Collection Date text box. Enter “2/2/95 11:30” as the collection date and time.

36
Click Save to save the information entered thus far. The Copy button can be used to copy sample information to another sample. It is useful in the event a user has submitted samples with more than one medium from the same location. For example, water samples may be submitted for δ 2H and δ 18O analysis along with samples for δ 34S analysis. The Copy button is used to copy the headings entered for W samples to the S samples. Suppose the water sample, S-5, was collected from the same location as sample G-17 (Yta-02). The user needs to copy the location information of G-17 to S-5. Click Copy. Several fields will be highlighted and LIMS will inform the user: This command will copy the highlighted information to another sample. Use this command very
carefully! Click OK. Enter “S-5” by selecting the Prefix S and entering “5” into the Sample text box. Click Copy. LIMS will advise the user: The Sample ID of the sample selected is BaSO4. Click OK and the highlighted fields are copied to sample S-5 as will be shown later in this tutorial. Click Close to return to the Projects form. Add Samples To Be Analyzed Form LIMS can populate a multi-sheet template with samples for isotopic analysis. One first needs to add the samples to the Table of Samples To Be Analyzed. Click Templates on the Projects form (Fig. 5) to add samples to this table. The Add Samples To Be Analyzed form should open (Fig. 10). (The user should not confuse the Add Samples To Be Analyzed form with the Samples To Be Analyzed form. The latter is opened by clicking on Print Templates on the Main Menu and is discussed later in this tutorial.) The information used to set the default entries on the Add Samples To Be Analyzed form is obtained from template configuration tables. These are edited by clicking on Special Features on the Main Menu and then selecting Templates (but don’t do it now). Only the template “EA for C & N” is available for medium 26 (C- & N-bearing material), so it is automatically loaded into the Template combo box by LIMS. The From and To values that define the sample range are set to 16 and 33. The user can edit them. The default number of repeat analyses is 1; thus, samples will only be put on templates once. The user can increase this value if needed. Leave it at 1. The default low procedure code is 356 (CF, EA, Delta 13C), so this value is entered into the low procedure combo box by LIMS. Two other low procedure codes (352 and 355) are valid for medium 26 and can be selected by the user. Likewise, the user may accept the default high procedure code of 584 (CF, EA, Delta 15N) or choose

37
Fig. 10. Add Samples To Be Analyzed form. one of the other values in the high procedure combo box. Click the Front of the queue toggle button to add these samples to the top of the Table of Samples To Be Analyzed. Click Add to add the samples to the Table of Samples To Be Analyzed. LIMS will respond with a message box indicating that the repeats have been added. This completes the fourth task in Fig. 2. If one wants to delete all the samples of a project from the Table of Samples To Be Analyzed, one would click Delete (but don’t do it). Click Close to close the Add Samples to be Analyzed form. Close the Projects form. The user can now confirm that information was copied from sample G-17 to sample S-5. Click Samples & Analyses. Click the Prefix S, enter 5, and click Find. The Sample form opens showing that the Sample ID of sample S-5 is Yta-02; note that data was copied from G-17. Click Close. Print Sample Range Form Clicking Print Sample Range opens the Print Sample Range form. Users may print information from the Table of Samples for a range of samples. By enabling the Save as Excel File checkbox, users can

38
instead save data to an Excel file. Try printing the range W-41 to W-42. The Access report generated is shown in Fig. 11. The user should compare his or her printer output with that in Fig. 11 to ensure that no characters have been omitted. Click Close. Printing a Template and the Samples To Be Analyzed Form After sample projects are created in LIMS, one can add the samples to the Table of Samples To Be Analyzed [(as the user did above (page 36)] in order to load them in turn on a multi-sheet template that LIMS can generate. Additionally, LIMS can save the sample headings to a diskette and these headings are available to the mass spectrometer data acquisition and control program. If the computer controlling the mass spectrometer can read these sample headings from the diskette, then the operator need not type the headings into the mass spectrometer computer. If a user’s computer software is not able to read these sample headings, the user may want to contact the mass spectrometer manufacturer and “encourage” the manufacturer to provide software that can read these headings since this is a significant time saver. On the Main Menu click Print Templates to open the Samples To Be Analyzed form (Fig. 12). Click List and select the template “EA for C & N.” “EA for C & N” is the C and N elemental analyzer template. One can see that there are 18 samples waiting to be analyzed by the elemental analyzer for δ 13C and δ 15N. The sample list shows the low and (or) high procedure code(s) and the number of repeats remaining. The number of repeats is the number of times that a sample needs to appear on a template. When generating a template, LIMS takes samples from the top of the list. Each time a sample is taken, the number of repeats is decremented by one. One can edit the list of samples by adding samples, deleting samples, editing the sample number and prefix of a sample, and changing the number of repeats. A sample can appear more than once. The user should first add a sample to the list. Click on the last record of the sub form marked by an asterisk in the left column. LIMS immediately fills in the low procedure code, the high procedure code, and the default number of repeats, respectively, 356, 584, and 1. For an experiment, try to enter W-1 as the sample. Enter W as the prefix and 1 as the sample. When the user attempts to update the record by clicking another record on the sub form, LIMS prompts the user This record is not compatible with the EA for C & N. Perhaps the medium is of an incorrect
type or the sample does not exist. Press the Esc key twice to cancel the entry. Click OK. Enter “G” for the prefix and “17” for the sample. To cancel an entry, press the Escape key on the keyboard, but don’t do it now. To locate a sample quickly, one can use Find. Click Find and the Search form appears. Click the G !!!! General option button, enter “17” in Sample text box, and click Find. The cursor will locate the first

39
Fig. 11. Example of Print Sample Range report.
Sam
ple
rang
esC
reat
ed:9
/19/
00 9
:47:
22 P
M
W-41
950240138
Del
ta:
Com
men
t:
1/20/95 11:00:00 A
Top
:
Oth
er In
fo:
01 --> W [Water] water (H &
6/8/97 10:08:12 AM
Las
t Edi
t:
Lab
ID:
Med
ium
:
Sam
ple
ID:
Use
r D
ef C
aptio
n 2:
08N/04W 29E2
344524117193402
Cou
ntry
:
Use
r D
ef C
aptio
n 3:
Lat
itude
:
Ele
vatio
n:
Cap
tion
7:
Beg
/End
Col
lect
:
Phon
e:
Proc
edur
e:US --> United States
Del
ta:
Com
men
t:
Proc
edur
e:
Nam
e:Johnson
006 --> CA, CALIFORNIA
Use
r D
ef C
aptio
n 4:
Use
r D
ef C
aptio
n 5:
Proj
ect A
cct:
Subm
issi
on:
1/21/95
Hig
h
Low
Use
r D
ef C
aptio
n 6:
Stat
e:
Lon
gitu
de:
Unc
:
Bot
tom
:
W-42
950240139
Del
ta:
Com
men
t:
1/19/95 1:30:00 PM
Top
:
Oth
er In
fo:
01 --> W [Water] water (H &
6/8/97 10:08:12 AM
Las
t Edi
t:
Lab
ID:
Med
ium
:
Sam
ple
ID:
Use
r D
ef C
aptio
n 2:
08N/04W 29E1
344524117193401
Cou
ntry
:
Use
r D
ef C
aptio
n 3:
Lat
itude
:
Ele
vatio
n:
Cap
tion
7:
Beg
/End
Col
lect
:
Phon
e:
Proc
edur
e:US --> United States
Del
ta:
Com
men
t:
Proc
edur
e:
Nam
e:Johnson
006 --> CA, CALIFORNIA
Use
r D
ef C
aptio
n 4:
Use
r D
ef C
aptio
n 5:
Proj
ect A
cct:
Subm
issi
on:
1/21/95
Hig
h
Low
Use
r D
ef C
aptio
n 6:
Stat
e:
Lon
gitu
de:
Unc
:
Bot
tom
:

40
Fig. 12. Samples To Be Analyzed Form for the EA for C and N. G-17. The user will next move samples to the bottom of the queue. Move the focus to sample G-16 by clicking on the cell containing 16. Click on the down arrow button. G-16 will be moved to the bottom of the queue. Next, move it to the top of the queue. Click on the cell containing 16. Click on the up arrow button. G-16 should be moved to the top of the queue. One will notice that it is quicker to move samples to the end of the queue than it is to move them to the top of the queue. The user may also move a group of records to the top or bottom of the queue. This is done by selecting a group of records and then clicking the up or down arrow button. For example, to move the records G-19 through G-28 to the bottom of the queue, click on the cell containing 19, hold the Shift key down and click on the cell containing 28, release the Shift key, and click the down arrow button. LIMS will display the

41
message: Samples G-19 through G-28 will be moved to the bottom of the queue. Click Cancel since we do not want to move them now. Once the number of repeats reaches zero, the user commonly deletes a sample by selecting it with the mouse and pressing the keyboard Delete key. A range of samples can be deleted by first selecting the range of samples to be deleted (drag the mouse along the left edge of the list box) and then by pressing the Delete key on the keyboard. Clicking the Delete button on the form allows one to delete a single sample, the sample that has the focus. One can also use Delete on the Add Samples To Be Analyzed form (see page 40) to delete all the samples from the selected project or to delete a range of samples. Click on the last record, G-17. Replace “17” by “4.” Our Lab ID G-4, which is an empty boat (empty tin cup), has been added for making a background correction. This form has right mouse capability. Using the right mouse pad, click on 4 of row G-4. LIMS will display a message similar to the following: Sample ID: Empty boat Submitter: Test Submitted: 1/3/1995 Purpose: No boat and empty boat for EA for C and/or N Samples The user should now generate a multi-sheet template and diskette for the EA for C & N template. Click New Template. LIMS will advise the user of the number of samples waiting to be analyzed (19 in this case). Click OK. LIMS populates the template with samples and reference samples according to the specifications of the template. Each port must be filled with one of the following: (1) an unknown sample, (2) a fixed reference sample, (3) a floating reference sample, (4) a user-specified sample for unfilled positions, needed in case all samples waiting to be analyzed have been analyzed, or (5) nothing (left empty). A fixed reference sample in a port signifies that this port always contains a reference material specified by the user. A floating reference sample is a user-specified reference material that is randomly interspersed among the samples x times, where x is specified by the user. To populate the template, LIMS performs the following steps:
1. LIMS determines if any ports are to be empty according to the user’s template design specifications and makes these ports empty. If a port is not working properly due to improper operation of a valve or solenoid, that port may be set to “Empty” by editing the template design specifications (click Special Features on the Main Menu and then click Templates, but don’t do it now).
2. LIMS examines the user’s template design specifications and places fixed reference samples in
any ports so specified. For example, the user may want the second port to always have a

42
particular reference sample in it. 3. LIMS determines how many floating reference samples (if any) are to be placed in each bank
(manifold) of the preparation device and places them in ports using a random number generation routine. A floating reference sample is a reference sample that is randomly interspersed among a group of samples.
4. LIMS fills in the remaining ports with unknowns taken from the Table of Samples To Be
Analyzed. If LIMS reaches the bottom of the list and still needs more samples to complete population of the template, LIMS begins again selecting unknown samples from the top of the queue, choosing samples that have repeats greater than zero. Thus, a sample can appear more than once on a template.
5. If LIMS exhausts samples from the Table of Samples To Be Analyzed, LIMS fills the remaining
ports with a sample for unfilled positions designated on the Design Templates form (see page 97). This often is W-1, or an equivalent “test” sample.
Designing a new template format and editing an existing template format is discussed beginning on page 96. After the template is generated, LIMS will display the message You can add Aliquot IDs if desired. You cannot edit any other field. Click OK. LIMS shows a datasheet form with 50 samples. For each port, the sample prefix, sample number, and procedure code(s) are shown. This form has right mouse capability. Right click 18 of Sample G-18 and LIMS will advise the user that this Howard Johnson’s sample Yta-03, submitted 6/6/1995 for the Weller Toxics Study. Commonly, the aliquot ID of each sample would be printed on the isotopic analysis sheet by the mass spectrometer, assuming that the vendor’s software can import the information saved to a file on a diskette by LIMS. Click Print. When prompted by LIMS, insert a blank diskette into the computer and click OK. The following actions now take place: 1. A list of samples is printed (Fig. 13). This list helps the analyst locate the samples.
2. A multi-sheet template is printed (Figs. 14a–14e),
3. Sample headings are saved on the diskette in two formats (Excel 5.0 xls and Access 2.0 mdb) for use by the mass spectrometer, and
4. A backup of the Table of Samples To Be Analyzed is made. 5. The number of repeats for each sample shown on the template is decremented by one.

43
EA for C N Samples To Be Analyzed 1/20/1998 9:50:45 AM
Port Sample # Amount 00 G-16 _________ 40 G-5 _________ 01 G-17 _________ 41 G-3 _________ 02 G-18 _________ 42 G-3 _________ 03 G-19 _________ 43 G-3 _________ 04 G-6 _________ 44 G-3 _________ 05 G-20 _________ 45 G-3 _________ 06 G-21 _________ 46 G-3 _________ 07 G-22 _________ 47 G-3 _________ 08 G-23 _________ 48 G-3 _________ 09 G-24 _________ 49 G-3 _________ 10 G-25 _________ 11 G-26 _________ 12 G-27 _________ 13 G-6 _________ 14 G-28 _________ 15 G-29 _________ 16 G-30 _________ 17 G-31 _________ 18 G-32 _________ 19 G-33 _________ 20 G-4 _________ 21 G-3 _________ 22 G-3 _________ 23 G-3 _________ 24 G-3 _________ 25 G-3 _________ 26 G-3 _________ 27 G-3 _________ 28 G-3 _________ 29 G-3 _________ 30 G-3 _________ 31 G-3 _________ 32 G-3 _________ 33 G-5 _________ 34 G-3 _________ 35 G-3 _________ 36 G-3 _________ 35 G-3 _________ 38 G-3 _________ 39 G-3 _________ Fig. 13. Example of List of Samples To Be Analyzed for the EA for C & N template.

44
45/G-3
46/G-3
47/G-3
30/G-3
31/G-3
32/G-3
15/G-29
16/G-30
17/G-31
00/G-16
01/G-17
02/G-18 EA for C N 20-Jan-98
Page 1 Fig. 14a. Page 1 of multi-sheet template (EA for C & N) for an elemental analyzer.

45
48/G-3
49/G-3
33/G-5
34/G-3
35/G-3
18/G-32
19/G-33
20/G-4
03/G-19
04/G-6
05/G-20 EA for C N 20-Jan-98
Page 2 Fig. 14b. Page 2 of multi-sheet template (EA for C & N) for an elemental analyzer.

46
36/G-3
37/G-3
38/G-3
21/G-3
22/G-3
23/G-3
06/G-21
07/G-22
08/G-23 EA for C N 20-Jan-98
Page 3 Fig. 14c. Page 3 of multi-sheet template (EA for C & N) for an elemental analyzer.

47
39/G-3
40/G-5
41/G-3
24/G-3
25/G-3
26/G-3
09/G-24
10/G-25
11/G-26 EA for C N 20-Jan-98
Page 4 Fig. 14d. Page 4 of multi-sheet template (EA for C & N) for an elemental analyzer.

48
42/G-3
43/G-3
44/G-3
27/G-3
28/G-3
29/G-3
12/G-27
13/G-6
14/G-28 EA for C N 20-Jan-98
Page 5 Fig. 14e. Page 5 of multi-sheet template (EA for C & N) for an elemental analyzer.
49
LIMS will inform the user that the oldest backup has been replaced successfully. Click OK. Note that the last approximately 30 positions on your template are populated with G-3 (see Fig. 13), an empty sample port on the elemental analyzer carousel (see page 43). Also, because a random number generator is used to position the three floating reference samples (G-5), the user’s template will be slightly different than the one shown in Figs. 13 and 14a–14e. The last multi-sheet template is saved in case the printer malfunctions. Click Last Template on the Samples To Be Analyzed form to print it again. Clicking Make Backup creates a backup of the Table of Samples to Be Analyzed shown on the Samples To Be Analyzed form (Fig. 12). If users make numerous changes to the Table of Samples to Be Analyzed, it may be useful to employ this button. To restore a previous backup, click Retrieve Backup and select the day and time of the backup to be restored. The last nine backups are retained by LIMS. Close the Samples To Be Analyzed form. This completes the first task in Fig. 3. The technician would now load the template with samples and analyze them (tasks 2 and 3 on Fig. 3) using an isotope ratio mass spectrometer. The isotopic analyses would then be entered or imported into LIMS. Prior to discussing entering and importing mass spectrometer analyses, it is useful to review the properties of each mass spectrometer in LIMS. Mass Spectrometers Form Click Special Features on the Main Menu and click Mass Specs to open the Mass Spectrometers form (Fig. 15). Each mass spectrometer in the laboratory is assigned a unique single letter code to identify it and its analyses throughout LIMS. Once assigned, this code cannot be changed. Fig. 15 shows an Analytical Precision mass spectrometer that was assigned the code A. The Analysis Import Format is the format used for isotopic analyses that will be imported. Current LIMS formats include Analytical Precision, PDZ Europa Ltd, Finnigan ISODAT, Micromass, and LIMS default. Prior to importing isotopic analyses, the user will be asked to specify the mass spectrometer that generated the isotopic analyses. LIMS will then parse the imported data using the appropriate import format. In the Sample Export Format combo (combination) box the user specifies the format of a file LIMS generated to export sample identification information to the mass spectrometer’s computer. LIMS can create a list of samples to be analyzed and save this list to a diskette in three different formats: Analytical Precision, PDZ Europa Ltd, and LIMS default. The diskette is then used by the mass spectrometer operator to eliminate retyping of sample names. Additionally, LIMS can generate multi-sheet templates and (or) sample lists. The Prefix of the most common sample analyzed is not required, but eliminates keystrokes in some parts of LIMS.

50
Fig. 15. Mass Spectrometers form. Mass spectrometer data acquisition and control software from some manufacturers can save analysis results to LIMS in real time. In order to make sure that all analyses have been received, the user can require LIMS, when it starts, to check the last 1000 analyses to see if any are missing. Analyses might be missing for two reasons. First, the analyst might have made a typographic mistake and entered an invalid Our Lab ID. Second, the mass spectrometer might have tried to save analysis data during the time a LIMS backup was in progress. In either case, the analysis will be missing. As many as 25 “isotopes” are available in LIMS. Two of these (UserDefIso1 and UserDefIso2) are user definable isotopes. They can be used for such purposes as saving results for gas ratios. For example, the mass spectrometer may measure Ar/N ratios. The user could decide to assign this ratio to UserDefIso1. The user would need to create media, procedures, and low procedures for this “isotope” in order to be able to fully use the capabilities of LIMS.

51
Each mass spectrometer may have dual inlet capability and (or) continuous flow capability. For some dual inlet analysis import formats, LIMS can import the major ion-beam outputs of the sample and standard gases, the ion-gauge values of the sample and standard gases, and interfering masses. For Finnigan dual inlet ISODAT files and for Micromass files, users need to specify unique column headings for each isotopic delta value to be imported. Users can set Finnigan default values by clicking Set Finnigan Default Column Headings. For mass spectrometers with continuous flow capability, users should identify the Our Lab ID of each of the reference injection gases. LIMS can import peak areas (such as from elemental analyzers) of some import formats if the user enables the Store continuous flow areas checkbox. If the user is importing ISODAT GC combustion analyses, it is useful to specify the unique character string that specifies the columns in which delta values for C, N, and O are found. Users can set default values by clicking Edit and clicking Set Finnigan Default Column Headings. Installing a new mass spectrometer is discussed further on page 92. Click Close to close the Mass Spectrometers form and close the Special Features sub form.
Media Form Clicking Special Features on the Main Menu and clicking Media opens the Media form. One can add, edit, and delete media in a manner similar to that used with the Reference Samples form. The description can always be edited. The prefix cannot be edited if any samples of the medium have been logged in because labels may already exist on sample containers with this prefix. One is required to select one isotope, and one may select two isotopes for a medium. These will become the low and high isotopes of the medium. An example of adding a medium is given on page 54. Information about deleting media codes is given on page 55. Procedure Codes Form Clicking Special Features on the Main Menu and clicking Procedures opens the Procedure Codes form. One can add, edit, and delete procedure codes using this form in a manner similar to that used with the Reference Samples form (page 90). Note that only the description of the procedure code can be edited. When LIMS was designed, it was decided to build in a relationship between the procedure codes (table 4) and the isotope codes (table 3) in order to minimize disk accesses and to speed up the program. This relationship is: Integer(Procedure code)/100 = Isotope code Thus, all of the procedure codes for δ 2H lie between 200 and 299 because the isotope code for 2H is 2 (table 3). The situation with oxygen is a little more complicated. It was decided that normalization coefficients

52
for δ 18O of water should be in a list separate from that of other O-bearing substances. Thus, δ 18O procedure codes for water range from 800 through 809 and those for other O-bearing materials lie between 810 and 899. The situation for isotope codes 2 through 15 is summarized in table 5. The values for codes above 15 are analogous to the values for isotope code 15. If more than 100 procedure codes were needed for any isotope, one could easily modify the algorithm above. For example, the value of 100 could be changed to 1000. Then each isotope could have 1000 procedure codes. To add a new procedure code and make use of it in LIMS is a two-step process. First, the user should add the procedure code to LIMS using this form. Next the user must link the procedure to each medium that uses the new procedure by using the Low Procedure Codes form or the High Procedure Codes form. An example of adding a medium, procedures, low procedures, and high procedures is given on page 54. Information about deleting media codes, procedure codes, low procedure codes, and high procedure codes is given on page 55.
Low Procedure Codes Form The Low Procedure Codes form is opened by clicking Special Features on the Main Menu and clicking Low Procedures. One can add, edit, and delete low procedure codes. The low procedure code links the low isotope of a medium to a procedure code. When a new procedure has been added to the table of procedures, the user can open the Low Procedure Codes form, click Add, select the medium, select the new procedure, and click Save. If this medium has entries in both the low and high procedures tables, then the user must ensure that procedure 000 (N/A) has been added to both the low and high procedures tables. This gives the user the possibility to select individually either the low or the high procedure code, but not to require both. For every medium, one and only one procedure should be selected as the default procedure. The default procedure is selected by assigning an asterisk to the Default field on the Low Procedure Codes form. An example of adding a medium, procedures, low procedures, and high procedures is given on page 54. Information about deleting media codes, procedure codes, low procedure codes, and high procedure codes is given on page 55. High Procedure Codes Form Clicking Special Features on the Main Menu and clicking High Procedures opens the High Procedure Codes form. One can add, edit, and delete high procedure codes. The high procedure code links the high isotope of a medium to a procedure code. High procedure codes are edited and added in the same manner as low procedure codes (see 52). An example of adding a medium, procedures, low procedures, and high procedures is given below. Information about deleting media codes, procedure codes, low procedure codes, and high procedure codes is given on page 55.

53
Table 5. Minimum and Maximum Sample Preparation Procedure Codes in LIMS versions 7 and 8 as a Function of Isotope Code Between Codes 2 and 15.
Isotope Isotope Code
Prefix Minimum Procedure
Code
Maximum Procedure
Code 2H 2 G 200 299 2H 2 J 200 299 2H 2 R 200 299 2H 2 W 200 299 13C 3 C 300 399 13C 3 G 300 399 13C 3 J 300 399 13C 3 R 300 399 15N 5 G 500 599 15N 5 J 500 599 15N 5 N 500 599 15N 5 R 500 599 34S 6 G 600 699 34S 6 J 600 699 34S 6 R 600 699 34S 6 S 600 699 17O 7 G 700 799 17O 7 J 700 799 17O 7 R 700 799 18O 8 C 810 899 18O 8 G 810 899 18O 8 J 810 899 18O 8 N 810 899 18O 8 R 810 899 18O 8 S 810 899 18O 8 W 800 809 7Li 10 G 1000 1099 7Li 10 J 1000 1099 7Li 10 R 1000 1099 11B 11 G 1100 1199 11B 11 J 1100 1199 11B 11 R 1100 1199 30Si 12 G 1200 1299 30Si 12 J 1200 1299 30Si 12 R 1200 1299 37Cl 13 G 1300 1399 37Cl 13 J 1300 1399 37Cl 13 R 1300 1399 14C 14 G 1400 1499 14C 14 J 1400 1499 14C 14 R 1400 1499 3H 15 G 1500 1599 3H 15 J 1500 1599 3H 15 R 1500 1599

54
How to Add Media, Procedures, Low Procedures, and High Procedures Suppose a large project on the variability of δ 18O and δ 30Si of olivine samples is starting. Suppose δ 18O preparation will be by a new laser ablation technique and δ 30Si preparation will be performed by reaction with gaseous fluorine. Assume that some samples will have δ 18O analyses only and some will have δ 30Si analyses only. The user will need to add a new medium, two procedure codes, and low and high procedure codes. Because this will be a major project spanning decades, the user should choose a unique prefix for the medium. Click Special Features on the Main Menu and click Media to open the Media form. Click Add. LIMS will inform the user to select the prefix last. Click OK. Enter “85” (since “85” is not used) in the Medium Code text box, “olivine” in the Medium Description text box, and “olv” in the Abbr text box. Either one or two isotopes need to be selected. Click the 18O/16O and the 30Si/28Si checkboxes. Select “J” from the Prefix combo box. Click Save and LIMS will remind the user to add this medium to the list of media on the Excel 5.0 template for importing projects. Click OK. Click Close. Now add two new procedure codes. From table 5 one knows that the δ 18O procedure needs to be between 810 and 899 because this is an O-bearing material that is not water. Choose 870 since it is not used. For the δ 30Si use 1225 since it is unused. Click Procedures, click OK at the LIMS information message, and click Add. Enter “870” in the Code text box, “DI, laser ablation, Delta 18O” in the Description text box, and click Save. The Amount of Sample text box is not used (this text box is for future use in LIMS). Click Add. Enter “1225” in the Code text box, “DI, gaseous fluorine, Delta 30Si” in the Description text box, and click Save. Click Close. Now link the medium and procedures. Let 870 be the low procedure code. Click Low Procedures. Click Add, select “85” from the Medium combo box, select “870” from the Low Procedure combo box, and set the Default combo box to “*” (this indicates that procedure code 870 will be selected as the default for the determination of δ 18O in olivine samples). Click Save. One needs the possibility to select only the δ 30Si preparation. This is done by adding the following additional low procedure code. Click Add. Select “85” for the Medium combo box, select “000 ! N/A” for the Low Procedure combo box, and click Save. Click Close. Now either 0 or 870 can be selected as the procedure code for the low isotope (18O). Repeat in a similar manner for the high procedure code. Click High Procedures. Click Add. Select “85” for the Medium combo box, select “1225” for the High Procedure combo box, select “*” for the Default combo box, and click Save. Click Add. Select “85” for the Medium combo box, select “000 ! N/A” for the High Procedure combo box, and click Save. Click Close. Now either 0 or 1225 can be selected as the procedure code for the high isotope (30Si). This completes the addition of a medium, procedure code, low procedure code, and high procedure code.
55
How to Delete Media, Procedures, Low Procedures, and High Procedures Media codes, procedure codes, low procedure codes, high procedure codes must be deleted in the reverse order in which they are installed. Therefore, if a procedure code is to be deleted, all of the low and high procedure codes using this procedure must first be deleted. If a medium is to be deleted, all of the low and high procedure codes using this procedure must first be deleted. Media codes, procedure codes, low procedure codes, high procedure codes cannot be deleted if they have been used for samples or isotopic analyses in the database. Analysis Form The tutorial will digress briefly to discuss the Analysis form, which is one method to display the isotopic analysis of a sample that has been analyzed. To open the Analysis form, it is first necessary to open the Sample form. The easiest way to open the Sample form (Fig. 9) is to click Samples and Analyses on the Main Menu. Click Samples and Analyses. The W is already selected, so enter 8 and press the Enter key. The sample form should open. Open the Analysis form by clicking Analyses on the Sample form. LIMS will indicate that there are no analyses for sample W-8. This is correct because the Comment text box indicates that the sample was broken (this is a real sample and it was broken). Move to sample W-9 by clicking List or the navigation buttons. Click Analyses and the Analysis form opens (Fig. 16). Analysis D-117229 is visible. To view other analyses, select them by clicking List. There are two δ 18O analyses from the DuPont mass spectrometer and two δ 2H analyses from the VG mass spectrometer. To edit an analysis, the user could click Edit and the Edit Analysis form would open. Close the Analysis form and the Sample form to return to the Main Menu. Add or Edit Analyses Form Assume the Johnson toxic waste samples have now been analyzed along with numerous other samples. The user needs to add these isotopic analyses to LIMS. Isotopic analyses are added in either of two ways, they are entered using the keyboard or they are imported from a file created by the mass spectrometer software. First enter isotopic data using the keyboard. Enter the missing mass spectrometer analysis information as follows. Click Add or Edit Analyses. The Add or Edit Analyses form should appear (Fig. 17). From the Mass Spec combo box, select “V!VG in 5B131.” When the hourglass cursor disappears, W has been selected as the sample prefix. Note that only three prefixes are shown for this mass spectrometer (G, R, and W) because it can only analyze hydrogen isotopic ratios. [The Table of Media (table 1) shows that there are no media with prefixes C, J, N, or S for hydrogen isotopic analysis.] Above the Mass Spec combo box is Range of Mass Spec Analyses for List option group. This only applies to the List button, which is used below. Generally, the user will want to

56
Fig. 16. Analysis form. accept the default of the last 1,000 analyses because selecting all analyses may require a query of all the analyses in the database that takes more than a minute in the case of large databases. The analysis number of the missing analysis is 128329. Click New Analysis. LIMS determines that the next analysis number should be 128329 and LIMS inserts this value in the Analysis # text box. By chance it is exactly the analysis that is missing, so press the Enter key and the focus (cursor) moves to the Aliquot ID text box. Users often identify the aliquot of the sample analyzed with A, B, etc. This 20-character field can be used as one chooses. It will not be used now, so press the Enter key. The cursor should move to the Standard text box. Enter 24 for the working standard (dual-inlet reference gas in this case). The integers 1 to 366 are normally used in the author’s laboratory for identification of working standards (the day of the year in which it was loaded). One can force error checking for the integers 1 to 366 using one of the checkboxes on

57
Fig. 17. Add or Edit Analyses form. the Mass Spec form (see pages 49 and 92). In the case of Finnigan continuous flow analyses, the standard is commonly left blank. Enter 31 for the Port. Port identifiers can be up to six characters long. Integer port numbers between 0 and 99 are used in the author’s laboratory. One can ensure that users enter only integer port numbers between 0 and 99 by selecting this option on the Mass Spectrometers form (Fig. 15). The cursor should move to the Amount text box. The amount of sample is not a required field. If used, the entry must be numeric. It is not needed now; therefore, press the Enter key to move to the Date/time analyzed field. The date/time of each analysis is required in LIMS. Enter March 1, 1997 6:24 PM (or 18:24) for the date/time analyzed. The date/time format may be different depending upon the Window’s date and time default settings of the user’s computer.

58
The cursor should move to the Comment text box. This 32-character field can be used to store text for each analysis, as one chooses. It is not used now, so press the Enter key. The cursor moves to the Prefix W. Accept this prefix and press the Enter key. The cursor moves to the Sample text box. The Our Lab ID of the missing analysis is W-6, so enter 6 and press the Enter key. LIMS will now search the database for information about W-6 and it will provide the following information: Sample submitter Reference Submission date Jan. 5, 1995 Sample ID Light Lab Ref Media 01 ! W [Water] water (H & O) The cursor should be in the Isotope combo box. Select “2H” from the Isotope combo box if it is not already selected and press the Enter key. The cursor should move to the Procedure combo box; procedure 201 is selected because it is the default low procedure code for the medium water. Enter “-389.86” for the Penult Delta value and press the Enter key. The penultimate delta is the final delta value generated by the mass spectrometer. It is the penultimate delta value in LIMS because the user will be able to apply drift, background, and expansion/contraction scale corrections to calculate the final delta value. This is discussed on page 66. The mass spectrometer Error code is 0 (no error), so press the Enter key. The error code is similar to the Micromass “Run Code.” The focus should move to Save. Click Save or press the Enter key to save this analysis. The user has completed entry of one delta value. If the user were entering isotopic data for calcite samples on a triple collector instrument, for example, the user would need to now repeat the above process and enter the isotopic data for the second delta value—one for δ13C and one for δ18O. Next the user should select “P ! My Delta Plus” from the Mass Spec combo box. Note that LIMS now makes the Peak Number text box visible because the Delta Plus has continuous flow capabilities. Click List and the analyses, peaks, and procedure codes for the last 1000 analyses of the Delta Plus are shown. Additionally, the date and time of analysis, Aliquot ID, Port, Our Lab ID, Standard, Comment, and δ value are shown. Click on “P-110” and this analysis is loaded into the form. The functions of the buttons on this form are similar to those on other forms and is described below: Edit enables the user to edit the isotopic analysis (and peak number if shown). Most fields can be
edited. LIMS will perform data validation whenever possible. Thus, LIMS would not allow the user to change the Our Lab ID of a sample on the VG mass spectrometer from W-1 to S-1 because the VG mass spectrometer is not able to analyze sulfur isotopic ratios.
New Peak enables the user to enter a new peak to an existing mass spectrometric analysis. It is only
available for mass spectrometers with continuous flow capabilities.

59
New Procedure enables the user to enter a new procedure code. LIMS will constrain the isotope and procedure codes to those that are valid for the medium of the sample and the capabilities of the mass spectrometer, that is, the isotopes it can analyze.
Delete enables the user to delete an analysis and peak number. As mentioned above, isotopic data can be entered into the database in two manners. One is to key it in, as has just been demonstrated. The second is to import the analytical results from a file on a diskette that was created by the mass spectrometer. Click Close to close the Add or Edit Analyses form. Import Analyses Button The Import Analyses button on the Main Menu is used to import isotopic analyses from a file on a diskette that has been saved by a mass spectrometer. In addition to the LIMS default format, LIMS can import isotopic analyses from analysis files created by Analytical Precision, PDZ Europa Ltd, Finnigan MAT, and Micromass mass spectrometers. The format for each manufacturer is discussed is some detail beginning on page 107. LIMS cannot import all formats of all manufacturers. In particular, importing of Micromass continuous flow isotopic results is not yet available because there are a variety of formats rather than a unique format. When any sample analysis is imported, the Our Lab ID and the isotope (see table 3) is appended to the Table of Samples in Progress unless it already is present in this table. Typically, the user will “apply corrections to” the penultimate δ values (discussed below) and store the mean final δ value in the Table of Samples so that final reports of results can be generated. When the mean final δ value is stored in the Table of Samples, the sample is deleted from the Table of Samples in Progress. LIMS Default Import Format The LIMS default import format for isotopic analyses is a Microsoft Access 97 mdb database file (see page 107). Next import isotopic results in the LIMS default format. Insert into the computer the diskette labeled “LIMS for Light Stable Isotopes 7.13—Tutorial” that was created on page 19. Click Import Analyses. When prompted to select a mass spectrometer, select “D ! DuPont.” Note that the Import Format combo box is set to “LIMS Default” because this is the only choice for the DuPont mass spectrometer. [It is the only choice because the import format on the Mass Spec form (see pages 49 and 92) for the DuPont mass spectrometer has been set to “LIMS Default.” Had it been left blank, LIMS would have prompted the user to select the import format from the list of import formats.] Click Import and the file dialog form opens and displays the mdb files on the diskette. The DuPont mass spectrometer generated the file LmImpDef.mdb, so select it and click Select. The status form should open. The form is updated after each line of data in the file of isotopic results is processed. Six analyses should be imported and LIMS should advise the user that D-117457 through D-117462 have been imported. Click OK. If one were to import LmImpDef.mdb again, one would see that the status form would process 6 lines and that there would

60
be 6 duplicate records, unless the user had checked the Replace Existing Analyses checkbox. Analytical Precision Import Format Software from Analytical Precision saves isotopic results in an Access 2.0 database file (see page 107 for the format). Next import isotopic results from an Analytical Precision file. Click Import Analyses. Select “A ! My AP” from the mass spectrometer combo box. Click Import and the file dialog form will show all of the mdb files on the diskette. Select the file “APformat.mdb” and click Select. Thirteen records should be imported, A-1318 through A-1323. To view these analyses, click Add or Edit Analyses. Select mass spectrometer “A ! My AP”, and click List. Note that for the first analysis, A-1318, both δ 13C and δ 18O values have been imported (procedure code 300 is the δ 13C analysis and procedure code 810 is the δ 18O analysis). The user will note that analyses A-1318 through A-1322 are for gaseous CO2 samples from a mass spectrometer test (samples G-7 through G-11). Analysis 1323 is an elemental analyzer analysis of sample G-1 and has two peaks, the first is N2 and its δ 15N value is +0.33; the second is CO2 and its δ 13C value is -24.35. Note that a value of -1.58 is listed for procedure code 198 of peak 2. Select this analysis. Procedure code 198 is δ 18O received unexpectedly. The Analytical Precision mass spectrometer saved the δ 18O value of the CO2 sample on the diskette. But LIMS knows that the medium of sample G-1 is 26, C- and N-bearing material. Thus, LIMS knows that this medium has no oxygen in it (as far as LIMS is concerned). When LIMS imported the δ 18O value, the only way LIMS could store it was as procedure code 198. Click Close to close the Add or Edit Analyses form. The user can set one of the checkboxes in Mass Spec form to prevent importing such data (see pages 49 and 92).
PDZ Europa Ltd Import Format In March 1997, PDZ Europa Ltd adopted a new format given the name Mercury.txt (see discussion on page 107). Click Import Analyses to import a PDZ Europa Ltd file. Choose “U ! My Europa.” The PDZ Europa Ltd import format is automatically selected. Click Import. The file dialog form should open showing the txt files on the “LIMS for Light Stable Isotopes 7.13—Tutorial” diskette. Choose Mercury.txt. Click Select. The status form should show that 7 lines have been processed and 7 analyses imported. LIMS will advise the user that analyses U-25 through U-30 have been imported. One can view these analyses as done above. Click Add or Edit Analyses. Select “U ! My Europa” for the mass spectrometer and click List. One can see that U-25 through U-29 are δ 15N elemental analyzer analyses—the procedure code is 584. U-30 shows 2 peaks from a nitrogen isotope GC combustion analysis (a compound specific isotopic analysis of sample G-1). Select U-25 and click Close. Finnigan MAT Import Format Introduction. Finnigan MAT isotopic results need to be saved in a Lotus (.wks) format using ISODAT at the Finnigan mass spectrometer computer. See page 110 for details on creating a wks file that is compatible
61
with LIMS. When Finnigan ISODAT analyses are imported, the unique integer that LIMS uses for the analysis number is the Finnigan mass spectrometer Spec No. This number must be unique. Therefore, if a user needs to replace a computer or hard disk or needs to reinstall ISODAT software, the Spec No must be set during installation to the next unique integer. For example, if the last Spec No. of the last analysis before the computer failed was 33115, the replacement computer must be installed with a Spec No. of 33116. The format for Finnigan dual inlet, GC combustion (GCC), and EA (elemental analyzer) files are different. They are discussed in detail beginning on page 110. Each will be imported in turn by the user in this tutorial. Dual Inlet Format. Click Import Analyses. Select “F ! My 251” from the mass spectrometer combo box. “Finnigan ISODAT” is automatically displayed in the Import Format combo box. Click Import. The file dialog form will open and display all of the wks files on the diskette. Highlight “Finn_DI.wks” and click Select. The Import Criteria form (Fig. 18) should open. The Import Criteria form is used to specify the isotope(s) to import and to specify the column(s) in which delta values are found. For each isotope the Column Headings list box displays the gas type, the isotope, the column heading of the isotope, and an enable checkbox. The gas type is always DI (dual inlet) Gas, by default for dual inlet analyses. In the bottom half of the form, the user can view the ISODAT worksheet to ensure that delta values from the correct column are imported. For Finnigan ISODAT analyses it is possible to import major ion beam values for sample and standard, to import interfering masses, and to import ion gauge values of the sample and standard by enabling the appropriate checkbox. In this example, LIMS identified only one column with delta values to be imported, the column with “d-29/28” in it—column F12. The parameter “d-29/28” is unique to 15N and is specified on the Mass Spectrometers form (see pages 49 and 92). The Import Row checkbox for 15N should be checked to import delta values because LIMS recognizes there is only one isotope to import. Click Import. LIMS will prompt that data will be imported for 15N. Click OK. The status form should open and three lines should be processed—this may take a few minutes. LIMS will inform the user that 24 records have been added. Click OK. Three δ 15N values and 21 other values should have been imported. These include sample and standard major ion beam voltages, ion gauge values for the standard and sample, and voltages of some interfering masses of the sample. One can examine these analyses as follows. Click Add or Edit Analyses. Click “F ! My 251” and click List. The first line shows a δ 15N value (procedure code 580) of 0.73 of N-40 for analysis F-18206. In addition to the δ 15N value, LIMS has imported seven other values. Specifically, the following procedure codes have been imported for each of the three analyses:

62
Fig. 18. Import Criteria form shown for dual inlet analyses. 124 m/z = 28 ion beam (sample) 138 m/z = 40 ion beam (sample) 140 m/z = 44 ion beam (sample) 161 Ion gauge (sample) 162 Ion gauge (standard)
163 Major ion beam (sample) 164 Major ion beam (sample)
Values for all of these parameters have been saved in LIMS. Select procedure code 161 of analysis F-18206. A value of 2.9617180824 has been saved in LIMS for ion gauge reading of the sample. Click Close.

63
GCC Format. Click Import Analyses. Select “P ! My Delta Plus” from the mass spectrometer combo box. “Finnigan ISODAT” is automatically displayed in the Import Format combo box. Click Import. LIMS will display the message: If analyses to be imported are continuous flow analyses, have you identified all rows of standard
peak data to LIMS by placing an asterisk in those rows? Users of Finnigan’s ISODAT data system will know that when ISODAT saves a continuous flow data file, the row that ISODAT uses as the standard in delta calculations for every Spec No (analysis number) is identified by placing an asterisk in a column with a heading of “STD.” This is important for two reasons. First, ISODAT does not put the name of the standard either in “Sample Name #1”, “Sample Name #2”, or “Sample Name #3” columns as one might expect. Instead, the name(s) of the sample is repeated. Second, users might set up a method in which several reference injections occur during each Spec No. ISODAT cannot assign the mean delta of these as the value used for the standard in delta calculations, but must instead choose only one of them. Prior to importing analytical results into LIMS, the user should place an asterisk in the “STD” column for each row of continuous flow reference injection gas. LIMS will then use each asterisk to identify a row of data for the reference injection gas, and LIMS will change the name of the sample to that for the reference injection gas. It will be shown later (page 74) that the user will be able to choose any, or all, of the reference injection peaks for calculating delta values of a Spec No. For this LIMS example, click Yes. The file dialog form will open and display all of the wks files on the diskette. Double click FigccCO2.wks. The Import Criteria for continuous flow analyses (Fig. 19) will open. Although the Import Criteria form for continuous flow analyses is similar to that for dual inlet analyses (Fig. 18), there are several important differences. The Column Headings list box has an additional column, Our Lab ID of CF Reference Gas. All continuous flow reference injection gases for the isotopes 13C and 18O in the Table of References can be displayed. A Data storage checkbox allows the user to import continuous flow areas or not. LIMS will replace the sample ID (Our Lab ID of the unknown) with the value in the Our Lab ID of CF Reference Gas column for each continuous flow reference injection gas (each row in ISODAT where an asterisk appears in the STD column). The user should look at the worksheet for A:\FigccCO2.wks shown in the list box at the bottom of the form. Notice that the STD column (F18) shows that Peak 2 of each Spec No is a reference injection gas because each Peak 2 has an asterisk. For each of these, LIMS will replace the sample ID, G-1, by R-2. The comment appears in column F9 and will be imported by LIMS. There is no entry for the data cell of columns Sample Name #1 or Sample Name #3. However, Sample Name #2 contains three items separated by the forward space (/) delimiter. These are (1) the Our Lab ID of the sample, the Aliquot ID, and the low procedure code. LIMS will import all three of these items. (See page 111 for further discussion of formatting this column for importing data to LIMS.) This information can be entered when the samples are analyzed, or the wks file can be edited prior to importing analyses into LIMS. In order to import isotopic data, the user needs to specify the isotopes to import. In the column Import Row, check both 13C and 18O rows. Immediately, LIMS will update the Continuous Flow Reference

64
Fig. 19. Import Criteria form shown for continuous flow analyses. Injection Gases list box showing all of the continuous flow gases in the Table of References for the selected isotopes and gas types. Click Import. LIMS will prompt the user that Isotopic data will be imported for delta 13C of CO2. Isotopic data will be imported for delta 18O of CO2. Click OK. LIMS will open the Status form, will import the δ 13C and δ 18O values, and advise the user that 21 lines were processed, 63 records were imported, and three analyses (P-515 through P-517) were imported. Click OK. Delta values for 7 peaks of each analysis have been imported [3 analyses × 7 peaks × 3 records (2 δ values per peak and a peak area) = 42 records]. To view these data click Add or Edit Analyses, select mass spectrometer P, and click List. Note that the Aliquot ID, Std, Amount, Comment, and Penultimate Delta values have been imported. For each peak, three procedure codes have been imported: 355 for each δ 13C value, 185 for each peak area, and 198 for each δ 18O value. Click on

65
pprocedure code 198 of peak 7 of analysis P-517. Note that the procedure description says delta 18O received unexpectedly. This is a situation in which LIMS knows that G-1 is medium 26 (C- and N-bearing material). G-1 has no oxygen in it as far as LIMS is concerned; therefore, when the δ 18O value is imported, LIMS assigns it a procedure code of 198. If one had it to do over again, one might not enable the Import Row checkbox for the row with the isotope 18O (Fig. 19). Then, δ 18O values would not be imported. EA Format. The user needs to import the isotopic data for Mr. Johnson’s samples from Victoria, BC. It was mentioned earlier that prior to importing analytical results into LIMS, the user should place an asterisk in the “STD” column for each row of continuous flow reference injection gas. LIMS will then use each asterisk to identify a row of data as that of the reference injection gas, and LIMS will change the name of the sample to that of the reference injection gas. The file for Mr. Johnson’s samples is just such a file. Using Excel open the file FinEA.wks on the diskette created for this tutorial. Examine the last analysis on the worksheet, P-660. The mass spectrometric method of this analysis, C-BLANK, analyzes the empty tin cup and then measures the reference injection gas twice for δ 13C; thus, there are three peaks. Peak two is already assigned to be the standard; thus, an “*” appears in the STD column of peak 2 (column N in the Excel worksheet). The user needs to put an “*” in the STD column of peak 3; this should be cell N88. Save the file in the same format (wks). When Excel is closed be careful not to update the file to an Excel format file (xls). Click Import Analyses. Select My Delta Plus and click Import, and then Yes. Select FinEA.wks and click Select. The Import Criteria form should open. Put a checkmark in both the 13C and 15N rows to import delta values of these isotopes. Click Import. LIMS prompts that δ 13C values of CO2 and δ 15N values of N2 will be imported. Click OK. LIMS will process 83 lines and import 166 records (analyses P-620 through P-660). Click OK. For each elemental analyzer analysis of a C- and N-bearing substance, ISODAT provides two peaks and two isotopic analyses. The first analysis is of N2 gas (peak 1 is the N2 reference and peak 2 is the sample), and the subsequent analysis is of CO2 gas (peak 1 is the sample and peak 2 is the CO2 reference). The last analysis of the blank for CO2 provides 3 peaks and 6 records (peak 1 is the blank and peaks 2 and 3 are reference gases). If the user checks analyses P-620 and P-621 by clicking Add or Edit Analyses, selecting “P! My Delta Plus” from the Mass Spec combo box, and clicking List, the user will find that both δ 13C and δ 15N analyses have been imported. This completes the fifth task in Fig. 3. Click analysis P-100 and click Close to close the Add or Edit Analyses form. Although ISODAT provides N and C concentration values, LIMS does not import them. Rather, LIMS allows the user to calculate N and C concentrations as shown later in this tutorial. Micromass Import Format Micromass uses comma separated variable (csv) text files that can be imported into spreadsheet programs. The format of dual inlet files for various gases is relatively similar according to Micromass; however, the format for continuous flow samples has varied often. Providing a stable format for continuous flow measurements with columns for both an integral analysis number and an integral peak number has not

66
been given a high priority. Therefore, currently LIMS cannot import Micromass continuous flow analyses. Next, the user will import some δ 18O values of water from a dual inlet Micromass file. Click Import Analyses. Select “M ! Micromass” from the mass spectrometer combo box and “Micromass” will be loaded into the Import Format combo box. Click Import and the file dialog form will show all of the csv files on the diskette. Select the file Mm_o18w.csv and click Select. LIMS will inform the user that there are no Micromass analyses in the database and will suggest a default value of 1 for the first analysis number. Because Micromass does not maintain an integer analysis number, incremented sequentially for each analysis, Micromass users are forced to generate and maintain such analysis numbers themselves. The user should accept the default of 1 and click OK. Five lines are processed and 30 records are imported (Analyses M-1 through M-5). Click OK. Results of 6 procedures have been stored for each analysis (line in the file). In addition to importing δ 18O values, LIMS has imported the following procedure codes: 161 Ion gauge (sample) 162 Ion gauge (standard) 163 Major ion beam (sample) 164 Major ion beam (standard) 193 Delta 13C received unexpectedly The user can open the Add or Edit Analyses form and verify this. (Select “M ! Micromass” for the mass spectrometer, and click List. The code 193, “Delta 13C received unexpectedly,” appears for each analysis because water samples (medium 1) were analyzed, and LIMS knows that water sample have only H and O it them—no C. But the mass spectrometer analyzed CO2 samples and saved both δ 13C and δ 18O values. Thus, LIMS imports δ 13C values and stores them as procedure 193. Note that Micromass’ “Run Serial Number,” if available, is stored in the comment field, for example for analysis M-5 as “RSN = 2572.” Close the Add or Edit Analyses form. The user might want to prevent LIMS from importing any unexpected procedure codes (codes 192 - 198). This is accomplished using the Mass Spectrometers form (see pages 49 and 92). One would deselect the checkbox Store unexpected procedures, such as 13C during an 18O analysis of water by equilibration with CO2. Correction Factors and Normalization Equations Form The δ values imported into the table of analyses in LIMS are called penultimate delta values, that is, the delta value before the last. To calculate the final delta value, LIMS uses the equation Final delta = (Penultimate Delta + b + d) e + a where
b is the blank correction (commonly used for elemental analyzer analyses; if not used, it is set to null or 0),

67
d is the hourly drift correction that takes into account the change in isotopic composition of the working standard during the day,
e is the expansion factor or expansion coefficient, which typically has a value of about 1 and takes into account contraction of the δ scale of a user’s mass spectrometer or variation in the H+
3 contribution to the m/z = 3 ion beam when analyzing hydrogen, and
a is the additive correction factor, which can be thought of as a long term drift correction or offset of the standard gas from its anticipated value.
These coefficients are determined by analyzing reference materials with known δ values (see Coplen, 1988, for a discussion of normalization). In many situations mass spectrometer corrections are not linear, and such corrections are typically made by the user “off-line,” that is, prior to importing into LIMS. An example is that the linearity correction (correction for amount of S in the sample) for organic sulfur samples for a Finnigan Delta Plus mass spectrometer can be represented by a logarithmic function. This data correction would commonly be performed on a worksheet prior to importing isotopic results into LIMS. Likewise, if a user needs to make background corrections for effects in the mass spectrometer source, these would commonly be performed prior to importing delta values into LIMS. Click Correction Factors and Normalization Equations. The Analyses and Normalization Equations form opens (Fig. 20). Select 18O of water samples on the DuPont mass spectrometer by selecting “D (DuPont) for 18O (water)” from the Correction Factor List combo box. The Analyses from and to text boxes are automatically filled with the last 501 analyses. Click Query to display the list of all DuPont analyses in the database between D-116962 and D-117462. The mass spectrometric analysis number in the first column increases downward and consists of the single letter prefix of the mass spectrometer and the integer analysis number. The peak number is given in the second column. The value of the peak number will be 1 for all dual inlet analyses. It can range between 1 and 999 for continuous flow analyses. The date and time occupy the third column. The sample analyzed (Our Lab ID) is given in the fourth column, and port and working standard ID are given in the fifth and sixth columns. The coefficients appear in the seventh column and are given in the order e, a, b, and d. No values for b or d appear in this correction factor list for the DuPont mass spectrometer. In the last 6 analyses in Fig. 20 only the value for e is listed—it is 1.00000. In the eighth column are shown two range markers. A range marker shows a range of analyses (such as 117446 through 117456) and the coefficients, e and a, that are applicable to the analyses in that range. The “pd” stands for penultimate delta value. Thus, the last range marker on screen, 117446 - 117456; 1.00000*pd–0.47 indicates that the final delta value of each analysis of a water sample in the range D-117446 to D-117456 is calculated by multiplying the penultimate δ value by 1.00000 and subtracting 0.47. The range marker is shown at the bottom of a range of analyses, that is, on the last analysis (D-117456). Note that range markers never include the blank correction, b, or the hourly drift correction, d. If values for b or d are

68
Fig. 20. Analyses and Normalization Equations form. given, the final delta value is determined using the equation on page 66. Note that all of the DuPont analyses are shown, not just the δ 18O analyses. Because DuPont for 18O (water) was selected from the Correction Factor List, one can only put range markers on δ 18O analyses of water samples, not on δ 13C analyses. Each δ 18O analysis of a water sample is indicated by an addition sign (+) following the Our Lab ID in the fourth column. Unmark is used to delete a range marker. Click (do not double click) on the range marker “117409 - 117445; 1.00000*pd–0.55” at analysis D-117445. Note that the next range marker which is at D-117456 covers the range 117446 - 117456. Click Unmark. The range marker on D-117445 is removed and the range of the range marker at D-117456 is updated to 117409 - 117456. One can create a range marker in either of two ways. The first is by highlighting an analysis and then double-clicking on it. Alternatively, one can highlight (select) an analysis and press the Enter key. The user

69
should Select “D (DuPont) for 13C” from the Correction Factor List combo box. The Analyses from and to text boxes are automatically filled with the last 501 analyses. All of the DuPont isotopic analyses need to be evaluated so replace 116962 in the Analyses from text box by 1. Click Query to display the list of analyses. The working standard was changed on Feb. 22, 1995—the standard changed from 362 to 53 at analysis D-117334. Therefore, the user will put the first range marker at the last δ 13C analysis before the working standard was changed, that is, at D-117332. Move to this analysis and select it. One can move from analysis to analysis by using the vertical scroll bar on the right side of the form. The user should double-click on analysis D-117332 or press the Enter key to create a range marker. In a few seconds, the Normalization Equation Coefficients form should appear (Fig. 21). The Normalization Equation Coefficients form is used to calculate the coefficients e, b, d, and a from the isotopic analysis of reference materials interspersed with the samples over a range of analyses. The top pane of the form contains text boxes that show the mass spectrometer and the range of analyses, and a button that allows the user to print a report. In the upper left section, the Show option buttons allow the user to display all of the analyses of a single reference material, all of the analyses of all reference materials, all analyses, or all analyses except those of continuous flow references. All of the δ 13C analyses of reference material C-5 analyzed between D-000001 and D-117332 are currently shown in the bottom section of the form. D-116957 is the first analysis. One can use the vertical scroll bar to scroll through the analyses. In this example, we have 23 analyses. The date/time of each analysis is shown in the first column. The Our Lab ID appears in the second column, and this column has right mouse response. Click the right mouse on C-5 and LIMS provides the sample submitter, submission date, project purpose, aliquot ID, etc. The integral analysis number appears in the third column concatenated with the mass spectrometer prefix. The peak number appears in the fourth column. It is always 1 for dual inlet analyses. It can range to 999. The procedure code is shown in the next column. It has right mouse capability. Clicking the right mouse on code 312 provides the message “312 ! DI, 100% phosphoric acid, Delta 13C.” The port number is given in the next column. The amount is shown in the seventh column, and is commonly available and useful for EA analyses. Continuous flow peak areas, if they have been imported, are shown in the next column. If amounts and peak areas of EA samples are shown, LIMS can calculate elemental concentrations and displays these results in the next column. Column 10 shows mass spectrometer error messages if the manufacturer’s software generates them. This column has right mouse capability. The imported delta value, the penultimate delta, is shown in the next column. LIMS may use –999 as a default delta value to indicate a null penultimate delta value. Analysis D-117195 was evidently lost, and the mass spectrometer error code indicates that the sample was too small. The DuPont mass spectrometer then provided the value of -999 as the penultimate delta value and set the Ignore (column 17) checkbox to checked. The blank correction, b, is useful for EA analyses. The hourly drift correction, d, appears in the next column if it is employed. The expansion factor appears in the next column. Note that by default, it is 1.00000. The additive correction factor, a, is shown in the next column. The final delta is shown in column 16. Because no blank corrections or hourly drift corrections appear in Fig. 21, the final delta = penultimate delta × expansion factor + additive correction factor. In underlying tables, LIMS maintains the blank correction, hourly drift correction, and additive correction factors to three significant figures after the decimal point and maintains the expansion coefficient to six significant figures after the decimal point. The blank correction, drift correction, and concentration controls on Fig. 21 will be discussed in examples below.

70
Fig. 21. Normalization Equation Coefficients form. Fig. 21 shows reference material C-5 in the Normalization pane of the form. This is the only sample that LIMS found in both the Table of References and in the analysis range. When C-5 was added to the Table of References, it was assigned a ‘true’ value of 1.89 per mill [note that the ISO spelling of ‰ is used herein, (ISO, 1992)]. See page 90 for instructions on adding samples to and editing data in the Table of References. Because C-5 is the only reference material analyzed in the range shown in Fig. 21, the option button All References in the option group Show and the Normalize with All References in the group Normalization are not enabled—it is not possible to click on either of them. Consequently, LIMS will normalize all of the analyses in this range using only the data of C-5. By default the expansion coefficient is set to 1.00000; the Force Exp Coef to 1.00000 checkbox is checked and 1.00000 appears as the Proposed Exp Coef. The ‘true’ delta value of C-5 is 1.89. The mean intermediate delta value (the sum of the penultimate delta, the blank correction, and the hourly drift correction) is 2.04. Therefore, the

71
additive drift correction is 1.89 – 2.04 = –0.15, and it is shown in yellow as the proposed additive correction, a, in a text box labeled Proposed Add Corr. The yellow color indicates that these values have not been saved to the underlying data tables. The user should click on the button with the blue arrow pointing to the right to update underlying tables. The proposed coefficients of 1.00000 and –0.15 are saved to the underlying tables, the yellow background turns white, and the Accepted Exp Coef and Accepted Add Corr text boxes are filled, respectively, with the values 1.00000 and –0.15. The range marker 1 - 117332; 1.00000*pd–0.15 has been created in column seven of the underlying data form, the Analyses and Normalization Equations form. The user can grab the top of the Normalization Equation Coefficients form with the mouse and move it down to view the Analyses and Normalization Equations form. This is an easy way to apply correction factors to a large quantity of data quickly. It potentially eliminates errors that commonly can occur when correcting data “by hand.” Suppose the user had some superior knowledge and wanted to set the expansion coefficient and additive correction factor to 1.000088 and –0.188, respectively. The user should deselect the Force Exp Coef to 1.00000 checkbox. Replace the proposed expansion coefficient of 1.00000 by 1.000088. The text box will immediately update to 1.00009, but the underlying value of 1.000088 will be used in calculations. The background color will change to yellow. Replace –0.15 in the proposed additive correction factor text box by –0.188. The text box will update to –0.19 and the background color will change to yellow. As before, –0.188 will be used in calculations. Click the update button with the blue arrow, and the Accepted Exp Coef and Accepted Add Corr text boxes are filled, respectively, with the values 1.00009 and –0.19. The yellow background is replaced by white and the underlying data are updated (using 1.000088 and –0.188). The user should select the Force Exp Coef to 1.00000 checkbox to force the expansion coefficient back to 1.00000. Click the update button with the blue arrow to update the underlying tables. The user should now click Print to obtain a permanent record of this determination of normalization coefficients (see Fig. 22). The user should compare his or her printer output with that in Fig. 22 to ensure that no characters have been omitted. Click Close and move to analysis D-117407. Click Unmark. Move to analysis D-117461, the last δ 13C analysis in the list. Double-click on it. A correction factor of –0.17 should be shown. Apply it by clicking the large arrow button and close the form. The correction factors for all of the δ 13C data in the database have now been completed. To calculate correction factors (normalization coefficients) for the δ 18O values of the carbonates, select “D (DuPont) for 18O (other than water)” from the Correction Factor List combo box and press the Enter key. Replace the current value of 116962 in the Analyses from test box with 1. Press the Enter key and

72
References for D (DuPont) for 13C 1/20/1998 4:44:49 PM Between 1 And 117332 Expansion Coefficient: 1.00000 Additive Correction Factor: -0.15 Proc Error Penultimate Blank Hr Intermediate Date Analysis Pk Port Code Messages Delta Corr Corr Delta Ig C-5 1/6/1995 9:32:32 AM 116957 1 77 312 10 ! Ignore 1.84 1.84 X 1/6/1995 9:50:46 AM 116958 1 77 312 10 ! Duplicate 2.03 2.03 X 1/6/1995 10:18:04 AM 116959 1 77 312 2.04 2.04 1/7/1995 12:14:18 AM 116993 1 84 312 2.04 2.04 1/7/1995 3:07:16 AM 117003 1 89 312 2.04 2.04 1/8/1995 1:39:18 PM 117011 1 73 312 2.02 2.02 1/9/1995 8:13:36 PM 117023 1 75 312 2.05 2.05 1/9/1995 10:29:59 PM 117031 1 84 312 2.05 2.05 1/11/1995 12:33:03 AM 117053 1 75 312 2.03 2.03 1/11/1995 4:33:47 AM 117067 1 83 312 2.04 2.04 1/12/1995 7:12:21 AM 117089 1 74 312 2.04 2.04 2/10/1995 11:46:37 AM 117107 1 83 312 2.03 2.03 2/13/1995 6:19:52 PM 117121 1 74 312 2.01 2.01 2/13/1995 8:38:46 PM 117129 1 78 312 2.04 2.04 2/15/1995 2:27:56 AM 117154 1 76 312 2.04 2.04 2/15/1995 9:24:37 AM 117178 1 89 312 2.03 2.03 2/15/1995 3:36:28 PM 117182 1 71 312 2.03 2.03 2/16/1995 7:20:38 AM 117195 1 71 312 03 ! Too Small or pe -999.00 X 2/17/1995 3:45:41 PM 117251 1 89 312 2.06 2.06 2/18/1995 8:44:25 PM 117263 1 83 312 2.01 2.01 2/20/1995 6:19:34 PM 117328 1 74 312 2.01 2.01 2/21/1995 8:45:39 PM 117330 1 77 312 2.04 2.04 2/21/1995 10:30:02 PM 117332 1 81 312 2.06 2.06 2.04 ± 0.02 Computed value of C-5 relative to VPDB: 1.89 per mill Value should be (from reference table): 1.89 per mill Fig. 22. Example of Normalization Equations Coefficients report. click Query to show the DuPont analyses again. This time the addition signs denote δ 18O analyses (other than water). Water is treated separately because the coefficients e and a are sometimes different for water than for non-water samples. Double-click on D-117333. The standard deviation is 0.05 so accept the existing isotopic results. Click the large arrow button and the additive correction factor of –1.25 is applied to the analyses in the selected range. Close the Normalization Equation Coefficients form. The range

73
marker 1 - 117333; 1.00000*pd–1.25 is shown in column eight of the Analyses and Normalization Equations form. Move to D-117462, the last δ 18O analysis for a non-water sample in the list, and double-click. The proposed additive correction factor is –1.32. Accept it (click the blue arrow button) and close the Normalization Equation Coefficients form. The δ 13C and δ 18O correction factors for carbonates in the database (also for G samples if there were any for δ 13C and δ 18O) are completed. LIMS allows one to take into account expansion or contraction of the δ scale. As an example, the user will next calculate the normalization coefficients and allow the expansion coefficient to differ from 1.00000. From the Analyses and Normalization Equations form select “V (VG in 5B131) for 2H” and click Query. The correction factors (normalization equation coefficients) have been calculated for all but the last 21 analyses. Thus, one only needs to determine correction factors for these 21 analyses. Since these analyses extend over less than 1/4 day, one can treat them as one range. Double-click on V-128329. When the Normalization Equation Coefficients form opens, click the Reference combo box and select W-5 if it is not already selected. The standard deviation of the analyses of W-5 is 0.63. This is fully satisfactory. Select the All References option button in the Show option group to show all of the analyses of W-5 and W-6. The proposed expansion coefficient and additive correction factor are 1.00000 and 8.03, respectively. Note that the final delta values of W-6, shown in column 16 of the lower pane, are about –382. The true value W-6, –395.1, can be found by clicking the Reference combo box to open it (it now contains W-5; click on the down arrow to display this value). What has happened is that the mass spectrometer has “misbehaved” and the H3
+ value has increased significantly. An expansion factor of 1.00000 is unsatisfactory, and the user needs to normalize with the delta values of both references W-5 and W-6. Deselect the Force Exp Coef to 1.00000 checkbox and click the Normalize With All References option button. The message Will determine best fitting normalization equation coefficients. appears. Click OK or press the Enter key. The proposed and accepted expansion coefficient and additive correction factor have changed to 1.03879 and 10.42. The Final Delta values for the two analyses of W-6 samples should have changed to –395.63 and –394.57, appropriate for a true value of –395.1. Click the blue arrow button to update underlying tables. If the user has three or more reference materials in the range of analyses, analyses of all three will appear in the sub form and will be used to calculate the best fitting coefficients unless one has checked the IG (Ignore) checkbox for one or more of them. Given analyses for three materials, analyses for any one can be eliminated by ignoring all of its analyses (checking the IG checkboxes of each of its analyses). Close the Normalization Equation Coefficients form. The second method to create a range marker is to use Mark. In the event that there are no analyses of reference samples in the range to be marked, the Mark button is the only method to create a range marker.

74
The user will first be prompted for the expansion coefficient and then for the additive correction factor. The user should select “F (My 251) for 15N” from the Correction Factor List combo box. Click Query. Click (do not double-click) on analysis F-18208 to select it unless it is already selected. Click Mark. Enter a value of 1.00000 for the expansion coefficient. Accept it and click OK. Enter -0.28 for the additive correction factor and click OK. The range marker 1 - 18208; 1.00000*pd–0.28 should be created. View/Edit opens the Normalization Equation Coefficients form using the range marker affecting a particular analysis unless there are no reference samples in that range. In that case, LIMS displays the message: No reference samples found in the correction range selected. Note that the highlighted selector bar need not be on a range marker, and the current analysis remains highlighted rather than moving the highlighting to a range marker. If the highlighted analysis does not have an addition sign in column 4 (Our Lab ID), the user will be advised that they need to move to an analysis that does, that is, one that matches the type selected in the Correction Factor List combo box. Now determine the normalization coefficients for Mr. Johnson’s samples from Victoria, BC. Select “P (My Delta Plus) for 13C.” Click Query. Note the asterisks in column 6. ISODAT uses these to indicate analyses of the reference injection standard gas. Analyses P-620 to P-660 need to be included in the range, and analyses earlier than P-620 should not be included in the range. The user needs to make sure that there is a range marker at the last δ 13C analysis before P-620. Note that peak 7 of analysis P-517 is the last δ 13C analysis that is not in the desired range. Therefore, put the cursor on this analysis and click Mark. Click OK to accept an expansion coefficient of 1.00000, and click OK to make the additive correction factor null. The range marker 515 - 517.007 will be created, indicating that the selected expansion coefficient and additive correction factor will be used for the range: peak number 1 of analysis number 515 through peak number 7 of analysis number 517. Double click on peak 3 of analysis P-660. As discussed above, the mass spectrometric method for measuring the δ 13C blank involves three peak numbers. The first is for the blank, and the second and third are for the reference injection gas. ISODAT has used only the second reference to calculate the δ 13C of the blank. The user needs to have LIMS use the mean δ 13C of peaks 2 and 3. Click on All Analyses in the Show option group. Note that the penultimate delta values of peaks numbers 1, 2 and 3 of P-660 are respectively, 21.16, –41.22, and –41.42. To have LIMS recalculate the delta values of these three peaks, click Normalize CF Std Gases & Samples. LIMS will issue an information message.

75
Click OK. LIMS will request whether all analyses are to be updated or only one analysis is to be updated. Click No to update only one analysis number (P-660). When LIMS prompts for the numeric portion of the analysis number, enter 660 and press the Enter key or click OK. The penultimate delta values of peaks numbers 1, 2 and 3 of P-660 should have changed to 21.26, -41.12, and –41.32; in accord with a mean value for –41.12 and –41.32 of –41.22, the value in the Table of References. Next the user should determine blank correction values. Click the Use This Sample option button for blank correction. Then select G-4 as the blank sample. The Mean Delta and Mean Area text boxes in the Blank Correction pane should be updated to 21.26 and 0.46, respectively. These values come from the values for peak 1 of analysis P-660. Blank correction values calculated by isotope mass balance should appear in the Blank Corr column of the sub form. Had there been more than one analysis of G-4, the mean of all penultimate delta values not ignored would have been used in the isotope mass balance equation. Next calculate hourly drift corrections by selecting the Use Hourly Drift Corrections checkbox. The value –0.056‰/hr should appear in yellow as the drift correction. Note that the value in the Std Dev text box is set to 0.00 because there are only two analyses of G-6 in the selected range. The user should determine the carbon concentrations next. Select “Base on G-6” from the Concentration combo box control. The C (%) column in the sub form should be updated. Click the button with the blue arrow to apply the additive correction factor and update the underlying tables with these data. New with this version of LIMS is the capability to assign a mass spectrometer error code to analyses in which one of the electrometers might have been saturated or to analyses which might have such small peak amplitudes that their isotopic abundances might be in doubt. Right click on the cell showing MS Err for analysis P-633 (peak number 1); this is column 10. The message “Mass Spectrometer Error Code 90: >9V Amplitude” should appear, indicating that either the m/z = 44, m/z = 45, or m/z = 46 electrometer amplitude exceeded the value of 9 V; the value of 9 V is set by the user on the Mass Spectrometers form (see pages 49 and 92). If the user right clicks on the mass spectrometer error code for P-660 (peak number 1), the following message appears, “Mass Spectrometer Error Code 220: <0.2 V Amplitude,” as would be expected for G-4, a blank. Thus, peaks that are both too small and too large can be flagged in LIMS. The user will see that these mass spectrometer error codes also appear on the Edit Samples in Progress form discussed below. Click Close to close the Normalization Equation Coefficients form. Repeat for My Delta Plus for δ
15N. Select “P (My Delta Plus) for 15N.” Replace the Analyses from value of 160 by 1, and click Query. Select analysis P-115. Click Mark, click OK, and click OK to create the range marker 111 - 115. Double click on the last δ 15N analysis, that is, the last one with an addition sign in column 4 (peak 2 of P-658) and the Normalization Equation Coefficients form opens with values of 1.00000 and –0.13 for the proposed expansion factor and additive correction factor, respectively. There is only one reference material, G-6, in the selected range; therefore, LIMS uses 1.00000 for the proposed expansion coefficient. No blank correction is necessary for nitrogen; therefore, leave the Blank Correction option

76
group set to None. Select the Use Hourly Drift Corrections checkbox and a value of 0.0445‰/hr should appear; the additive correction factor should change to –0.20. Select “Base on G-6” from the Concentration combo box control to calculate N concentrations. Click the button with the blue arrow to apply the additive correction and update the underlying tables with these data. Click Close. This completes task 6 in Fig. 3. Close the Analyses and Normalization Equations form. Print Samples in Progress Form When mass spectrometer analyses are added to the Analyses table in LIMS, they are also automatically added to the Table of Samples in Progress. When the user is satisfied with the δ value of a sample (assuming that the sample may require replicate analysis), the final δ value is “stored,” saving its δ value in the Table of Samples. When a δ value of a sample is stored, that sample is removed from the Table of Samples in Progress. As an example, print the δ 13C results for the samples C-5 through C-9. Click Print Samples in Progress and the Print Samples in Progress form should open (Fig. 23). Select C for the Prefix. The Isotope combo box is automatically updated and opened displaying 13C and 18O as possible selections. Select 13C. Enter 5 and 9 in the From and to boxes, respectively. Click Print. LIMS displays the message Do you really want to print all of the analyses of reference sample C-5? This message appears in order to allow the user to modify the selection to minimize wasting of paper. Click Yes. A Samples in Progress report is printed for the selected range (Fig. 24). The user should compare his or her printer output with that in Fig. 24 to ensure that no characters have been omitted. Note that analyses D-116957, D-116958, and D-117195 are ignored for sample C-5 (note large X in right column of Fig. 24). LIMS calculates a mean δ 13C value, 1.89, and two standard deviations. The first is labeled Std Dev 1 and includes all of the analyses. The second, Std Dev 2, is calculated after the farthest outlier is eliminated. Means for both standard deviations are determined and the one that appears as the Final Delta is the one associated with the Mean and Std Dev in bold font. This algorithm in LIMS can be modified to suit the user’s own needs—an example of modifying LIMS code is given on page 117. Aliquot IDs, comments, concentrations, amounts, and (or) interfering mass values can be printed (assuming they exist in the database). Concentrations and amounts can be very useful for elemental analyzer analyzes. Select the Prefix N from the Print Samples in Progress form. Select 15N for the Isotope. Check the Print Aliquot ID’s and the Print Interfering Masses checkboxes. Enter 41 in the From text box. Enter 41 in the to text box. Click Print. The report printed (Fig. 25) shows values of m/z = 28, 40, and 44 for this sample (procedure codes 124, 138, and 140, respectfully—see Table 4 for procedure codes). The user should compare his or her printer output with that in Fig. 25 to ensure that no characters have been omitted. Ion gauge values for the sample and standard are shown, and values for the major ion beam electrometer outputs of the sample and standard are shown.

77
Fig. 23. Print Samples in Progress form. Click Print Samples in Progress, select Prefix G, and select 13C for the Isotope, enter a sample range of 16 to 33, and click Print. This will print the δ 13C analyses of Mr. Johnson’s samples. Repeat for δ 15N. It is sometimes desirable to print selected analyses of a single mass spectrometer. For example, on a daily basis the user may need to print a few of the most recent analyses of a reference material for which there are a total of hundreds of analyses in the database. This is accomplished by clicking Advanced, which displays several controls to perform this query. Additionally, users may save the output to an Excel file by checking the Save As Excel File checkbox. LIMS will assign a file name in a Save As dialog form.
(Note that there is a bug in Microsoft Access. Sometime if the name of the filename is changed in
the File name text box of the Save As dialog form, a general protection fault will cause Access and LIMS to abruptly close. Therefore, it is best to change the file name after the file has been created.) Click Close to close the Print Samples in Progress form. This completes the seventh task in Fig. 3. Edit Samples in Progress Form Edit Samples in Progress is used to edit the analyses that determine the Final δ value. Click Edit Samples in Progress to open the Edit Samples in Progress form. Select C as the Prefix and 13C as the Isotope. Enter 5 in the From text box. Click Query. LIMS will ask if you want to list all 25 analyses of

78
Samples in Progress for 13C 1/20/1998 1:42:23 PM Between C-5 And C-9 Proc MS Penultimate Blank Hr Expan Add Final Date Analysis Pk Port Code Error Delta Corr Corr Coef Corr Delta Ig C-5 Reference Calcite ref 1 02 !C [Cal]calcite 01/06/1995 D-116957 1 77 312 10: Ignore 1.84 1.00000 -0.15 1.69 X 01/06/1995 D-116958 1 77 312 2: Duplicate 2.03 1.00000 -0.15 1.88 X 01/06/1995 D-116959 1 77 312 2.04 1.00000 -0.15 1.89 01/07/1995 D-116993 1 84 312 2.04 1.00000 -0.15 1.89 01/07/1995 D-117003 1 89 312 2.04 1.00000 -0.15 1.90 01/08/1995 D-117011 1 73 312 2.02 1.00000 -0.15 1.87 01/09/1995 D-117023 1 75 312 2.05 1.00000 -0.15 1.90 01/09/1995 D-117031 1 84 312 2.05 1.00000 -0.15 1.91 01/11/1995 D-117053 1 75 312 2.03 1.00000 -0.15 1.89 01/11/1995 D-117067 1 83 312 2.04 1.00000 -0.15 1.89 01/12/1995 D-117089 1 74 312 2.04 1.00000 -0.15 1.89 02/10/1995 D-117107 1 83 312 2.03 1.00000 -0.15 1.88 02/13/1995 D-117121 1 74 312 2.01 1.00000 -0.15 1.86 02/13/1995 D-117129 1 78 312 2.04 1.00000 -0.15 1.90 02/15/1995 D-117154 1 76 312 2.04 1.00000 -0.15 1.90 02/15/1995 D-117178 1 89 312 2.03 1.00000 -0.15 1.88 02/15/1995 D-117182 1 71 312 2.03 1.00000 -0.15 1.89 02/16/1995 D-117195 1 71 312 3: Too Small -999.00 1.00000 -0.15 X 02/17/1995 D-117251 1 89 312 2.06 1.00000 -0.15 1.92 02/18/1995 D-117263 1 83 312 2.01 1.00000 -0.15 1.86 02/20/1995 D-117328 1 74 312 2.01 1.00000 -0.15 1.86 02/21/1995 D-117330 1 77 312 2.04 1.00000 -0.15 1.89 02/21/1995 D-117332 1 81 312 2.06 1.00000 -0.15 1.91 03/04/1995 D-117399 1 85 312 2.06 1.00000 -0.17 1.90 03/04/1995 D-117407 1 85 312 2.05 1.00000 -0.17 1.88 Mean 1 = 1.89 Std Dev 1 = 0.02 Mean Final Delta = 1.89 Mean 2 = 1.89 Std Dev 2 = 0.01 C-9 Johnson DHC2-0.25 02 !C [Cal]calcite 01/05/1995 D-116943 1 70 312 -2.07 1.00000 -0.15 -2.22 02/09/1995 D-117093 1 75 312 -2.05 1.00000 -0.15 -2.20 Mean 1 = -2.21 Std Dev 1 = 0.01 Mean Final Delta = -2.21 Fig. 24. Example of Print Samples in Progress report.

79
Samples in Progress for 15N 1/20/1998 1:48:44 PM Between N-41 And N-41 Proc MS Penultimate Blank Hr Expan Add Final Date Analysis Pk Port Code Error Delta Corr Corr Coef Corr Delta Ig N-41 Johnson 1286 60 !N [N2O] nitrous oxide Aliquot ID: Aliquot 5 Comment: 0.636v Conc: Amount: mg Area: 06/06/1996 F-118206 1 124 0.996 1.00000 06/06/1996 F-118206 1 138 2.078 1.00000 06/06/1996 F-118206 1 140 0.039 1.00000 06/06/1996 F-118206 1 161 2.9371979237 1.00000 06/06/1996 F-118206 1 162 2.9368069172 1.00000 06/06/1996 F-118206 1 163 1.001180768 1.00000 06/06/1996 F-118206 1 164 1.0041996241 1.00000 06/06/1996 F-118206 1 580 -2.85 1.00000 -0.28 -3.13 Mean 1 = -3.13 Fig. 25. Example of Print Samples in Progress report with Print Aliquots IDs and Interfering Masses
checkboxes enabled. the reference C-5. Click OK. The analyses of C-5 are shown (Fig. 26). As for reports, two standard deviations are shown. To show the effect of including poor analytical data, click on the IG (Ignore) checkboxes for analysis D-116957 to deselect it. Both standard deviations are immediately recalculated. Note that Std Dev 1 changes from 0.02 to 0.04. Click the same checkbox again to ignore D-116957. A Final Delta will not be calculated for a sample with a null value (or -999) in Penult Delta field (penultimate delta). To demonstrate this, click the IG checkbox of D-117195 to deselect this analysis. Note that Final Delta and both standard deviations are blank (null). Click the IG checkbox of D-117195 so that a numerical value is again displayed in the Final Delta text box. Click Prefix G, select 13C from the Isotope combo box, and click Query. Click OK when LIMS prompts about showing all 4 analyses of G-6. Click List and select sample G-6. To delete the sample from the Table of Samples in Progress, click Delete and click Yes. This act does not delete the sample (or analyses) from the database. It only removes the sample from the Table of Samples in Progress. To add it back, the user can click Add Samples to Samples in Progress on the Main Menu discussed below. Generally, the Delete button is rarely used because samples are removed automatically from the Table of Samples in Progress when the Final Delta is stored in the Table of Samples by clicking Store Samples in Progress as described below.

80
Fig. 26. Edit Samples in Progress form. Click List and select sample G-16. The user can review the δ 13C values of Mr. Johnson’s samples. [The same information can be reviewed by scanning the lists of Samples in Progress that were printed on page 77.] Use the List button or the navigation buttons to move to another sample. The user can repeat for δ 15N values by selecting 15N from the Isotope combo box and clicking Query. No editing of the samples is necessary; thus, this completes the eighth task in Fig. 3. No sample reruns are necessary because we only planned to analyze each sample once. Thus, the ninth task in Fig. 3 is also completed. Occasionally one may realize that the mean δ value calculated from several mass spectrometer analyses is in error and needs to be corrected. If the user has a good idea of what the true δ value of the sample should be, e.g., the average of two “close” δ values, the Add Ethereal button can be clicked to add this value to the table of analyses. Clicking this button brings up the “Ethereal mass spectrometer.” The user can then enter the δ value for the sample—this is the corrected δ value, not the penultimate δ value. It is best to ignore (check the IG checkboxes) all of the other analyses of the selected sample. If all analyses except the Ethereal δ value are ignored by checking each of the IG checkboxes, then the Ethereal δ value is stored in the Table of Samples when samples are stored with the Single Analysis checkbox checked (see below). The Ethereal mass spectrometer might be used when there are two analyses of a sample that are fairly close, but not close enough to satisfy the algorithm that calculates the mean final delta. If the sample

81
were exhausted, the user could store an average of the two extant analyses. The other buttons on the Edit Samples in Progress form are described below: Retrieve allows one to add a sample to the Table of Samples in Progress. The prefix of the sample
added and the isotope will be the values currently selected (see also page 82). Print allows the user to print analyses of the prefix, isotope, and range selected. However, it is not
quite as flexible as the Print Samples in Progress form because the options of printing aliquot IDs, printing interfering masses, saving to an Excel file, or printing analyses of a single mass spectrometer are not available.
Close the Edit Samples in Progress form. Store Samples in Progress Form Ranges of samples are “stored” (mean final delta values of samples in the Table of Samples in Progress are calculated and saved in the Table of Samples, and the sample is removed from the Table of Samples in Progress) using the Store Samples in Progress form. Click Store Samples in Progress. Select Prefix C and the Isotope combo box is updated and opened. Select 13C. For the range choose a range large enough to include all the samples to be stored. Use 1 to 999. Click Store and the Status form will display the samples, as they are stored. Only samples for which a mean final delta can be calculated will be stored. Thus, there must be at least two analyses for every sample that is stored. Samples for which correction factors have not been determined cannot be stored because a mean final delta cannot be calculated for them. Once the samples have been stored, click OK. Store Mr. Johnson’s toxic waste samples for δ 13C and all others that have only a single analysis—in this case the mean final delta is identical to the final delta of the single analysis. To store samples that have only a single analysis, the user must check the Store Single Analysis checkboxes. Click Prefix G, select Isotope 13C, enter 1-999 for the sample range, check the Store Single Analysis checkboxes, and click Store. When the samples have been stored, click OK. Repeat for Prefix G and Isotope 15N. Mr. Johnson’s samples have now been “stored,” completing the tenth task in Fig. 3. Click Close to close the Store Samples in Progress form. To print a report of Mr. Johnson’s samples, click Projects. Double click on 06/06/1995 Johnson to open the Projects form. Click Print Report and a final project report is printed. To save isotopic data from this project in ASCII format on a diskette, click Results and click Yes. Insert a diskette into the computer at the prompt. LIMS will advise the user that the file will create a file with 18 samples and will save the file with a default value of Johnson.txt on the diskette. The user can change this file specifier if desired. Click Select and the file is created. To save all of the information in the Table of Samples about each sample in this project to a diskette in Excel 5.0 format, click Results and click No. Using LIMS default

82
file specifier, the file G-16.xls is created on the diskette. (Note that there is a bug in Microsoft Access. Sometime if the name of the file is changed in the File name text box of the Save As dialog form, a general protection fault will cause Access and LIMS to abruptly close. Therefore, it is best to change the file name after it has been created.) Click Close. This completes the tasks on Fig. 3 for Mr. Johnson’s samples and the results could be sent via regular mail or E-mail to him. Add Samples to Samples in Progress Form In the event that one wants to reevaluate normalization coefficients for a sample, one will need to add the sample back into the Table of Samples in Progress. This can be done by clicking Add Samples to Samples in Progress on the Main Menu. The sample prefix, the isotope, and the sample range will need to be selected. If a sample is reanalyzed and the analysis is either imported or entered by hand, the sample is automatically added to the Table of Samples in Progress. One can also add a sample to the Table of Samples in Progress by clicking Retrieve on the Edit Samples in Progress form. Normalization Equation Ranges Form For audits, one may want to print the coefficients of the normalization equations and their ranges. This is done with the Normalization Equation Ranges form, which is accessed by clicking Normalization Equation Ranges on the Main Menu. One needs to select a mass spectrometer and isotope from the Normalization Equation List combo box and enter the range of the mass spectrometer analyses. This completes the discussion of the tutorial.

83
INSTALLING A NEW DATABASE FILE A new backend database file is installed when the user is ready to begin using LIMS in their laboratory. Such a file was installed in step 7 on page 7 of the installation instructions. This step can be repeated to create a new backend database file. When LIMS is opened with a new backend database file, one or more mass spectrometers will need to be installed. Follow the instructions for installing a new backend database on page 83 and then close the Mass Spectrometers form. Click New Project Login on the Main Menu to open the Login New Samples form. Click Add/Edit Customer to open the Customers form. Customer # 001 should be visible. Click Edit. Replace MyLastName with the user’s last name. Replace MyFirstName with the user’s first name, etc. When finished, click Save. Click List or use the navigation buttons to view the customers in the table of customers. The customers “Test” and “Reference” will be found. “Test” is often used for samples that are employed to test a mass spectrometer or for fill-in samples whose δ values are not needed. “Reference” is normally used to designate reference materials. Click Close to close the Customers form and click Cancel to close the Login New Samples form. When the Login New Samples Form opens, the Country combo box is set to the country selected in the Options Form. See page 88 for instruction on how to set the default country to the user’s country. The user should at this time set preferences on the Options Form. The user should change Organization Name to that desired. The user should modify the Alternative Field Names on the Options form (Fig. 28). For example, the user might be primarily interested in oceanographic samples and might prefer the names “Station”, “Cast”, “Niskin”, and “Depth”, instead of “User Def Caption 2”, “User Def Caption 3”, “User Def Caption 4”, and “Bottom” (see page 90). If the user plans to employ the Excel 5.0 template for importing projects of samples entered by those submitting samples to the laboratory (this is strongly advised), the column headings will also need to be changed on the worksheet Alta.xls (see page 85). Note that the worksheet Alta.xls is protected, but there is no password. Thus, users can easily unprotect it, make the necessary changes, and protect it again. All cells with yellow backgrounds should remain unprotected; all others can be protected so that column headings cannot be changed accidentally by those submitting samples to the laboratory. Click Projects on the Main Menu to open the Search for Projects form. More than a dozen projects have already been created and should be shown. The submitter of several projects is Reference, including projects for H2, CO2, SO2, N2, and O2 that may be used as the reference injection gases in continuous flow measurements. If one does not plan to employ continuous flow techniques, these projects can be deleted. There are numerous projects submitted by Test. These are useful for testing. Several are for an elemental analyzer. There are samples for empty cups (boats) and no cups for use in background determination. If other media are needed, now is a good time to add them (see pages 51–54). Stable isotope laboratories will typically employ a number of internally produced reference materials on a daily or weekly basis for their own quality assurance. The user should log all such reference materials into

84
LIMS now. The known δ values versus VSMOW, VCDT, VPDB, AIR, or other internationally accepted references should be added to the table of references (see page 90). The new database is now ready for use. The user should make backups of the backend database on a regular interval. Have at least two backups, for example, one for even days of the month and one for odd days of the month. In the author’s laboratory, a copy is saved to another hard disk daily using an automatic backup program for mdb files (Total Access Agent, http:/www.fmsinc.com). The importance of regular, frequent backups cannot be stressed too strongly. If power fails while LIMS is writing to the user’s backend database, it will likely be corrupted and could be a total loss. Thus, an uninterruptible power supply for the LIMS computer is very worthwhile.

85
IMPORTING PROJECTS USING THE EXCEL 5.0 TEMPLATE An easy way for a user to create a project in LIMS is to import the sample headings and project information entered in an Excel 5.0 template file by the customer submitting the samples. This technique eliminates typographic errors by the laboratory staff. Any errors are the responsibility of the submitter of the samples. The minimum required information that must be provided by the template file includes: (1) the submission date, (2) the name of the submitter (only last name may be needed if the last name is unique in the
table of customers), (3) the numeric media code, and (4) Sample IDs for each of the samples submitted. Other project information will be imported if it is present, e.g., project purpose and location. Additional sample information, such as latitude, longitude, country, etc., will be imported if it is present. The LIMS diskette titled Excel 5.0 Template for Creating Sample Projects contains two Microsoft Excel 5.0 files: USGS.xls and Alta.xls. The two template files are unpopulated with data. The choice of which one to use is based on the following: Alta.xls This is for use by submitters who use a laboratory where Alternative Field Names are
employed (see page 90). This probably includes the vast majority of users. The advantage of this template is that column headings can be changed to match the alternative field names.
USGS.xls This is for use by users who submit samples to a laboratory that has not checked the
Alternative Field Names Enabled checkbox on the Options form, e.g., the author’s laboratory. The column names cannot be changed or importing will fail.
There is a significant difference in size between Alta.xls and USGS.xls, 87 KB and 383 KB, respectively. Most of this difference is due to the fact that USGS.xls contains all the counties in the U.S. In order to use USGS.xls, the user only needs to ensure that the Alternative Field Names Enabled checkboxes on the Options form is deselected. After a customer has entered his project and sample information in the spreadsheet, LIMS should import this information and create a project.

86
Part of Excel 5.0 template Alta.xls is shown in Fig. 27. In addition to customer information (last name, first name, address, etc.) and project information (submission date, title, and general location), the following fields are provided for sample information: Sample ID User Def Cap 2 Country Code User Def Cap 3 State/Province Code User Def Cap 4 Latitude User Def Cap 5 Longitude User Def Cap 6 Lat. Long. Accuracy Cap 7 Collection Date/Time Other Info Ending Collection Date/Time Top Elevation Bottom Length Unit It is possible to change 10 of these (Sample ID, User Def Cap 2 through 6, Cap 7, Other Info, Top, and Bottom) using the Options form and selecting the Alternative Field Names Enabled checkboxes. If this has been done, the user must change the names on the Excel template to match exactly or LIMS cannot import the project. The Excel template files can then be distributed to customers. A Sample ID (or equivalent name if the user has changed the name of this column) must be provided for each sample. Sample IDs must be unique. LIMS will check to be sure that Sample IDs are unique and will not import a project if they are not unique. The Country Codes are listed on the spreadsheet titled “Countries.” The State/Province Codes are listed on the spreadsheet titled “States-Provinces.” Latitude and longitude can be entered as 45.3333 in the Degrees field or 45 in the Degrees field and 20 in the Minutes field. No characters other than numbers and decimal points should be entered (for example, do not enter 20" for 20 seconds). The Collection Date/Time and Ending Collection Date/Time should be entered in a format compatible with that in your Microsoft Windows settings. The ending date/time is used when collecting a precipitation or similar sample. The Elevation of the site must be a numeric entry. The unit of distance (meters or feet) is specified in the column Length Unit. Valid entries are m and ft. If the columns Top or Bottom are used, they must contain only numeric data (no alpha characters are allowed). The seven remaining fields, beginning with User Def Cap 2, can contain alphanumeric entries. As supplied, the maximum length of entries that will be imported and stored in LIMS is: Sample ID 35 characters User Def Cap 2 40 characters User Def Cap 3 20 characters User Def Cap 4 20 characters User Def Cap 5 20 characters User Def Cap 6 22 characters Cap 7 26 characters Other Info 70 characters

87
Any of these can be easily increased by the user—see the Microsoft Access Help or Microsoft 1997a, 1997b.
Fig. 27. Alta.xls Excel 5.0 template for creating projects.

88
SPECIAL FEATURES The Special Features button on the Main Menu allows the user to change preferences in LIMS and to add, delete, and edit mass spectrometers, procedure codes, media codes, etc. Clicking Special Features opens the Special Features sub form shown in Fig. 1. Many of the buttons on this sub form have been discussed in the tutorial. The others are discussed below.
Options Form Clicking Options opens the Options form (Fig. 28). This form allows the user to (i) edit ten alternative field (column) names that appear as labels on the Samples form, (ii) change the color of many forms, and (iii) set preferences in LIMS. When you click Exit on the Main Menu, LIMS makes a backup of these item in the Access database Lm7prefs.mdb. If the user install a new code file, Lims7.mde, LIMS will search for Lm7prefs.mdb. If LIMS finds it, LIMS will prompt the user if the configuration parameters should be updated. The user should choose OK. Software Preferences The following software preferences may be selected: 1. Organization name that appears at the top of the Main Menu can be changed. 2. Default country code can be selected from the Default country combo box. 3. Paper size can be selected—either A4 or U.S. standard letterhead. 4. Show latitudes and longitudes on forms and reports using decimal degrees (33.34221, for
example) rather than DDMMSS (Degree Degree Minute Minute Second Second) format. Data in the LIMS Table of Samples are always stored in decimal degrees.
5. Display elevations and depths on forms and reports using meters instead of feet. Data in the
LIMS Table of Samples are stored in feet. (This, of course, could be changed.) 6. Use ‘Rel. to VPDB’ for δ 18O values of carbonates instead of ‘Rel. to VSMOW.’ 7. Display “Headings Complete” text box on the Projects form. This is useful when extensive
amounts of information may need to be added to the Sample form, often after the samples are analyzed.

89
Fig. 28. Options form. 8. Reston features enabled. This switch changes several values to Reston default values. It
enables an algorithm for preventing isotopic replicate analyses from being stored unless the standard deviation is sufficiently low, makes visible NWQL, NAWID, and Access buttons and forms, makes visible some buttons on the Projects form, and enables several other features.
9. Display CFC-11, CFC-12, and CFC-113 on sample forms and reports. 10. Enable debugging. Debugging enabled will make numerous text boxes visible on forms. Once
you toggle this checkbox, it is a good idea to exit LIMS and restart it. 11. Generate barcodes using the Add Samples to be Analyzed form. This preference requires Reston
features to be enabled, unless the user modifies the code.

90
Form Colors To change the color of a form, select the form from the Form Colors combo box, click Edit, click New Color, choose a color from the palette, click OK to close the color palette, and click Save. Try it with the Main Menu first because it can be seen below the Options form. One can reset the colors to the initial LIMS for Light Stable Isotopes colors by clicking Edit and clicking Set default colors. If one has a video card that can produce more than 256 colors, one can click Define Custom Colors on the color palette to produce more colors than employed in LIMS (LIMS requires and assumes you have at least 256 colors). Alternative Field Names If users check the Alternative Field Names Enabled checkboxes, they may change the names of ten fields on the Sample form (and Range of Samples report) as shown in Fig. 28 (also see page 86). For example, one might want one of the fields to be Dose if one is working with urine from diabetic patients. Generally one will use upper and lower case letters and the underscore character. In no case should the following five characters be used: [ ] ` . ! Next Our Lab IDs Form The Next Our Lab ID form is opened by clicking Special Features on the Main Menu and clicking Prefixes & Next Sample #. One can only edit the positive integer in the Next Sample text box. This is the integer used for assigning the next Our Lab ID in the Login New Samples form. If one changes this integer, one needs to be careful that samples with duplicate Our Lab IDs are not generated. This is a sure method of creating havoc in LIMS. Reference Samples Form Clicking Special Features on the Main Menu and clicking References opens the Reference Samples form (Fig. 29). This form is used to add, delete, or edit reference samples used in the normalization equation calculations. To add a reference sample, click Add, select the isotope from the Isotope combo box, select the sample prefix from the Prefix combo box, enter the integer sample number, and enter the “true value” in the Final Delta text box. In the reference material is used in an elemental analyzer, the user can enter the concentration of the element. For example, for acetanilide the user would enter 71.09 for 13C and 10.36 for 15N. Select Continuous Flow Reference Injection Gas if appropriate. The delta value entered for continuous flow reference injection gases should be identical to that used in the mass spectrometric analysis data entry. If the sample represents an empty cup on an elemental analyzed, select the appropriate checkbox; in this case, no delta value is allowed. To save results, click Save. To edit an existing reference click List or the navigation buttons to move to the reference. Click Edit, make the

91
Fig. 29. Reference Samples form. change, and click Save. Click Delete to delete a reference sample.
Gas Types Form The Gas Types form is opened by clicking Special Features on the Main Menu and clicking Gas Types. The GasType specifies the type of gas analyzed by the mass spectrometer (commonly, a continuous flow mass spectrometer) when importing isotopic analyses. The GasType appears in the column GasType of Finnigan Isodat continuous flow data (see Fig. 19 on page 64). Either one or two isotopes must be

92
specified for each GasType. Mass Spectrometers Form Clicking Special Features on the Main Menu and clicking Mass Specs opens the Mass Spectrometers form (Fig. 15). Install a new mass spectrometer as follows: 1. Click Add. 2. Enter a single letter code for the mass spectrometer. Once a mass spectrometer is created, this
single letter code cannot be changed (the mass spectrometer must be deleted and a new mass spectrometer must be installed). One probably should avoid using the letters already used for sample prefixes (C, G, J, N, R, S, and W) and the letters O and I. The letter E is not available because it is used for the Ethereal mass spectrometer. The short name is used in several combo boxes.
3. Enter the vendor serial number, which may be used by some mass spectrometer manufacturers on
the file of isotopic results in order to identify the mass spectrometer that generated the isotopic results. If your mass spectrometer manufacturer supports LIMS, ask what entry needs to go into this field.
4. Enter an analysis import format appropriate for your mass spectrometer.
5. Enter a sample export format as appropriate for your mass spectrometer. If a user’s manufacturer
is not listed, “LIMS Default” can be selected. The user can then generate multi-sheet templates and (or) sample lists even though the file on the diskette generated by the template code cannot be used. The user may want to encourage mass spectrometer vendors to modify their mass spectrometer software so that it can make use of the LIMS sample export file.
6. Enter the sample prefix of the most common sample analyzed. This field can be left blank. 7. If the user wants LIMS to check the last 1000 analyses for any missing analyses when LIMS is
started, select the appropriate checkbox. They might be missing for two reasons. First, the analyst might have made a typographic mistake and entered an invalid Our Lab ID. Second, the mass spectrometer might have tried to save analysis data during the time a LIMS backup was in progress. Enter the sample prefix of the most common sample analyzed. This field can be left blank.
8. Select the appropriate checkbox if one wants to require port numbers to be integers between 0 and
99.

93
9. Select the appropriate checkbox if one wants to require that reference standard name be integers between 1 and 366.
10. Select all isotopes that will be analyzed by the mass spectrometer. 11. Check the Continuous flow capability checkbox if appropriate. If checked, the user needs to
enter the Our Lab IDs of all continuous flow reference injection gases. Check the Store continuous flow areas checkbox if desired. Finnigan default identifiers for GC combustion analyses can be added by clicking Set Finnigan Default Column Headings. New with this version of LIMS is the capability to have LIMS check N2, CO2, and SO2 ion beam electrometer voltages of Finnigan elemental analyzer samples (and GCC samples) and assign an error code if these voltage either exceed a specified value (usually near the saturation voltage of electrometers) or are less than a specified value (indicating the sample amount is too small to give a reliable delta value). Set the Check Finnigan peak amplitudes checkbox and the Min amplitude and Max amplitude combo boxes as desired.
12. Check the Dual inlet capability checkbox if appropriate. If checked, select desired preferences.
If the manufacturer of the mass spectrometer is Finnigan or Micromass, enter unique single line column headings for each isotope in the Spreadsheet Column Names pane. Finnigan default identifiers can be added by clicking Set Finnigan Default Column Headings.
13. Click Save to create your mass spectrometer. One may edit most fields for an existing mass spectrometer. One cannot deselect an isotope if there are any analyses of that isotope in the table of analyses. Likewise, one cannot delete a mass spectrometer if there are any analyses for it in the table of analyses. Faraday Cup Information Form Information about Faraday cups is used by LIMS to import Finnigan interfering mass data. The Faraday Cup Information form is accessed from the Mass Spectrometers form. When the user clicks Faraday Cups on the Mass Spectrometers form, LIMS advises the user that Faraday cup information for all mass spectrometers can be edited. Click Faraday Cups. Click OK and the Faraday Cup Information form opens. For each Faraday cup of each mass spectrometer, one can assign an electrometer output coefficient. This is the expansion coefficient that is used when an interfering mass value is imported and that is printed on the Samples in Progress report for interfering masses. If analyses with interfering masses are imported and no Faraday cup electrometer output coefficients are found, a default value of 1 is employed.

94
Mass Spectrometer Error Codes Form Clicking Special Features on the Main Menu and clicking Mass Spec Error Codes opens the Mass Spectrometer Error Codes form. The mass spectrometer error codes to date are shown in table 6. These error codes include ones used by the author’s Microsoft Visual Basic mass spectrometric data acquisition and control software and ones that are useful in continuous flow mass spectrometry. One can add additional codes, delete these, or edit existing codes. One of the serious problems with continuous flow isotope ratio mass spectrometry is acquisition of incorrect isotopic compositions. One way in which this can occur is analysis of such a large sample that one of the electrometers is saturated (usually at about –12 V) during the analysis. It is critical that isotopic data generated in such a manner is identified to the user. One method is to assign an error code indicating that an electrometer has exceeded a certain voltage. Thus, error code 110 in table 6 would indicate that an electrometer exceeded 11 V during the measurement. Mass spectrometer vendors can detect such over limit situations with their data acquisition and control software and can identify such analyses by using the appropriate error code in table 6. Finnigan’s continuous flow Lotus files, created from elemental analyzer analyses using ISODAT, contain the amplitude in a column labeled “Ampl.” When importing such data, LIMS can test whether this amplitude exceeds the limit set by the user using the Mass Spectrometers form. If the amplitude does exceed this limit, the error code of the analysis is changed from zero to the appropriate error code from table 6. An additional complication can occur depending upon the values of the feedback resistors on the electrometers. Suppose nitrogen gas is being analyzed for nitrogen isotopic composition and that the m/z = 29 beam indicates 8 V at the same time that the m/z = 28 beam indicates 4 V. Although the m/z = 28 electrometer will not saturate until –12 V, the m/z = 29 electrometer will begin to saturated when the m/z = 28 electrometer reaches approximately 6 V. Therefore LIMS needs to take into account the value in the “Ratio” column on the Lotus worksheet in determining whether or not to assign an error code. In this example, if the value in the “Ampl.” Column were 7.02, the value in the “29/28 ratio” column were 2.01, and the limit selected were 9 V, then LIMS calculates that the voltage of the m/z = 29 electrometer is (7.02)(2.01) = 14.1 V, which exceeds 9 V. Therefore, LIMS changes the error code of this analysis to 90. For analysis of carbon dioxide samples, LIMS also evaluates the value for the m/z = 46 electrometer using the value found in the “46/44 ratio” column. In addition to performing this analysis on nitrogen gas and carbon dioxide, LIMS also evaluates sulfur dioxide data. In like manner, LIMS can also assign an error code when the amplitude of an electrometer is less than 0.05 V to 0.6 V using error codes 205 – 260. NAWID, NWQL, and Access Forms NAWID, NWQL, and Access are program features used only by the U.S. Geological Survey and are only visible when Reston Features is enabled.

95
Table 6. List of mass spectrometer error codes in LIMS versions 7 and 8. Error Code Error Description
0 No Error 1 Error Code 1 2 Duplicate 3 Too Small or peak not found 4 High Ion Gage 5 Error Code 5 6 Contaminated 7 Voltage Not Optimal 8 Different Ratios of Voltmeters 9 Voltages Not Equal
10 Ignore 11 Unknown Problem 12 Minor Overload 13 Lost data 14 Peak too large (overflow) 40 >4 V Amplitude 50 >5 V Amplitude 60 >6 V Amplitude 70 >7 V Amplitude 80 >8 V Amplitude 90 >9 V Amplitude
100 >10 V Amplitude 110 >11 V Amplitude 120 >12 V Amplitude 205 <0.05 V Amplitude 210 <0.1 V Amplitude 215 <0.15 V Amplitude 220 <0.2 V Amplitude 225 <0.25 V Amplitude 230 <0.3 V Amplitude 240 <0.4 V Amplitude 250 <0.5 V Amplitude 260 <0.6 V Amplitude
Data Log Form Clicking DataLog opens the Data Log form, which is for future use in LIMS.

96
LIMS Log Form Clicking LIMS Log opens the LIMS Log form, which is used to log code errors in LIMS.
Import Log Form Clicking ImportLog opens the Import Log form, which lists errors during importing of isotopic analyses.
Designing, Creating, and Editing Templates Multi-sheet paper templates are used for two purposes: (i) to set out samples to be analyzed so that they correspond to the location of sample preparation vessels, and (ii) to provide a list of the sample that goes into each location on an elemental analyzer. Templates are populated with samples from the Table of Samples To Be Analyzed, and printed by clicking Print Templates on the Main Menu. However, before a template can be populated and printed, it must be designed and created. Clicking Templates on the Special Features sub form opens the Design Templates form (Fig. 30) and allows the user to add or edit a template. The user may want to examine the templates in the tutorial database. Templates for elemental analyzers and water equilibration devices can be found in the tutorial database. The user should examine these templates prior to generating any templates. To view these templates (first make sure the tutorial database is active—see page 19), click Special Features on the Main Menu, and click Templates. Fig. 31 shows a photograph of the 48-port Micromass sample equilibration system in the author’s laboratory and a template set up with 48 water samples for this preparation system. The multi-sheet paper template is shown in Figs. 32 and 33. Note that there are 12 samples in each of 4 rows (48 samples total) laid out on a four-page template. (Twelve samples, whether they be water, carbonates, or other samples, has been found to be a convenient number to put on one sheet of paper. If samples are larger, then fewer samples can be placed on each page, leaving desired positions blank.) Samples can be placed on the template the day prior to sample preparation; thus, a designated technician has time to check to make sure that each position on the template has the correct sample on it. This has led to a significant reduction in errors in the laboratory. The plastic holder in the front is used to load the samples from each row and to transport them to the equilibration system. It is important to consider the layout of your multi-sheet template. Proper design can lead to important savings in sample preparation time and reduction of error by minimizing the possibility of a sample getting into the wrong sample port. As an example, for the 48-port CO2-H2O equilibration device above, there are four banks, A, B, C, and D. There are 12 sample ports on each bank. Thus, one might use the port names A1, A2, A3, ... B1, B2, ... D12. However, in the author’s laboratory operators find it easier to identify each sample port by an integer; thus, 1, 2, ... 47, and 48 are used. Personnel find it quickest to load 12 samples at a time. The first 12 samples are 6 samples on one side of bank A and 6 samples on the same side of bank B.

97
Fig. 30. Design Templates form. The next 12 samples are the samples on the other side of banks A and B. The third set of 12 samples consists of 6 samples on bank C and 6 on bank D. The last 12 samples are on the other side of banks C and D. This relatively complicated layout scheme allows personnel to load samples in a minimum of time and it minimizes the possibility of error in sample loading. It is presented to demonstrate to the reader that it is important to consider various scenarios for loading samples. Before starting be sure that the reference samples you want to use as floating (see step 14 below) and fixed (see step 25 below) references are in the Table of Reference Samples. To design and add a template follow these steps: 1. Click Special Features on the Main Menu and then click Templates. 2. Click Add. 3. Enter a name for the template, such as “Pegasus.” Each template must have a unique name.

98
Fig. 31. (a) Micromass CO2-H2O equilibration system in author’s laboratory. (b) Template for this system set up with 48 samples.

99
Neptune Samples To Be Analyzed 1/20/1998 3:54:33 PM Port Sample # Amount 11 W-69 _________ 34 W-102 _________ 09 W-5 _________ 36 W-5 _________ 07 W-70 _________ 38 W-103 _________ 05 W-71 _________ 40 W-104 _________ 03 W-72 _________ 42 W-105 _________ 01 W-73 _________ 44 W-106 _________ 23 W-74 _________ 46 W-107 _________ 21 W-75 _________ 48 W-108 _________ 19 W-6 _________ 17 W-6 _________ 15 W-5 _________ 13 W-76 _________ 02 W-77 _________ 04 W-78 _________ 06 W-79 _________ 08 W-80 _________ 10 W-81 _________ 12 W-82 _________ 14 W-83 _________ 16 W-84 _________ 18 W-5 _________ 20 W-85 _________ 22 W-86 _________ 24 W-87 _________ 35 W-88 _________ 33 W-89 _________ 31 W-5 _________ 29 W-90 _________ 27 W-91 _________ 25 W-92 _________ 47 W-93 _________ 45 W-94 _________ 43 W-95 _________ 41 W-96 _________ 39 W-97 _________ 37 W-98 _________ 26 W-99 _________ 28 W-100 _________ 30 W-101 _________ 32 W-5 _________ Fig. 32. Example of List of Samples To Be Analyzed for the CO2-H2O equilibration template with 48 samples.

100
26/W-99
28/W-
100
30/W-
101
32/W-5
34/W-
102
36/W-5
38/W-103
40/W-104
42/W-
105
44/W-106
46/W-107
48/W-108
35/W-88
33/W-89
31/W-5
29/W-90
27/W-91
25/W-92
47/W-93
45/W-94
43/W-95
41/W-96
39/W-97
37/W-98
02/W-77
04/W-78
06/W-79
08/W-80
10/W-81
12/W-82
14/W-83
16/W-84
18/W-5
20/W-85
22/W-86
24/W-87
11/W-69
09/W-5
07/W-70
05/W-71
03/W-72
01/W-73
23/W-74
21/W-75
19/W-6
17/W-6
15/W-5
13/W-76
Page 1 Page 2 Page 3 Page 4
Fig. 33. Example of the 4-page CO2-H2O water equilibration template with 48 samples. Note placement of pages side by side.
4. Enter the description.
5. Select the mass spectrometer.
6. Select the sample export format if necessary.
7. Select the media for the template. The user will need to fill the Media Selected for Template list box with all of the media for the template. First click on a medium in the Available Media list box to highlight it. Then click Add to add this medium to the Media Selected for Template list box. As many media as required can be included. If one makes a mistake, one can highlight the medium to be deleted in the Media Selected for Template list box, and one can click Delete Medium.
8. Select an isotope for the low procedure code if necessary. 9. Select the default low procedure code if necessary. 10. Select the default number of repeats for the low procedure if necessary. The default number of
repeats is the number of times a sample added to the template will be analyzed. For example, in the author’s laboratory, every water sample for H equilibration is analyzed twice.
11. Select an isotope for the high procedure code if necessary. 12. Select the default high procedure code if necessary.

101
13. Select the default number of repeats for the high procedure if necessary. 14. Select the sample that will serve as the floating reference. A floating reference is a reference
sample that is randomly interspersed with samples. LIMS will determine the location of all floating reference samples using a random number generator. Only samples from the table of reference samples that have a medium found in the Media Selected for Template list box will appear in this combo box.
15. Enter the number of floating reference samples on your template. Often it is 10 to 15% of the
total number of samples on a template. 16. Select a sample for unfilled positions. This sample is used to fill or pad the remainder of a
template in the event that there are not sufficient samples in the Table of Samples To Be Analyzed to populate all the spaces in a template. Often a sample such as W-1, C-1, etc. is selected.
17. Select the printing option. Usually, one wants to print a multi-sheet template and a list of samples. 18. Click Save.
19. Click Ports & References to open the Ports & References form (Fig. 34) and design the multi-sheet paper template that will holds the samples. Even though one may only want to print a list of samples and not a multi-sheet template, one still needs to use this form to provide necessary information to LIMS (port identification, etc.).
102
20. Layout the multi-page template. The user will need to decide the following: a. Will all 12 positions on each page be used? If not, which will remain blank? b. What is the port number for each of the positions on the page that will hold a sample? c. Which ports should be left empty? These might be ones with vacuum leaks or such other
problem that prevents their use. d. Which ports must always hold a reference sample, that is, a fixed reference sample? e. By default, the remaining ports can hold a floating reference sample. A floating reference
sample “floats” from port to port and has no fixed location. 21. Click Edit to enable editing. 22. Page 1 of your template should be shown. Enter port numbers (or port identifiers for each of the
12 positions that should hold a sample. 23. Enter the list number of each port specified above. This is the ordinal number of the sample in the
sample list printed out for the user. For example, the sample position that is always at the top of the list is 1, the second is 2, etc.
24. For each position that should be empty, select “Empty.”
25. For each position that should be a fixed reference, select “Fixed Ref” and select the reference
sample from the Fixed Ref combo box. The remaining positions should be identified as “Floating Ref” positions. This completes the entry for this page.
26. Click Save to save your entries. 27. If the template consists of only a single page, click Close and this completes the creation of the
template. Otherwise, click Add Page. 28. Enter the entries on page 2 in a manner similar to that done for page 1. 29. Repeat data entry for remaining template pages. 30. When all pages are complete, click Close. Additional pages may be added and entries may be edited by clicking Edit. If the user needs to delete a page, only the last page of a template can be deleted. This completes the creation of the template. In order to use this template, the user will need to add samples to the Table of Samples To Be Analyzed. This can be done from the Projects form (page 29) by clicking Templates, or from the Samples To Be Analyzed form (page 40). Once samples have been added to the Table of Samples To Be Analyzed, a list of samples (and a template of samples to analyze) can be printed (e.g., see Figs. 32 and 33).

103
Fig. 34. Ports & References form. Using LIMS with 14C LIMS can be used for 14C samples. 14C media and procedures must be added to the default database because no media or procedures using them are otherwise available. The following illustrates how this is done.

104
Add a new medium containing 13C and 14C, and add a procedure code for 14C. Click Special Features, click Media from the Special Features sub form, and click Add on the Media form. LIMS will prompt the user to select the Prefix last. Click OK. Enter “140” for the Code, enter “C-bearing material” for the Medium, and enter “14C” for the Abbr. Click the checkboxes 13C/12C and 14C. Select Prefix “G,” and click Save. (Note, that the user could have selected “C ! Carbonate.” LIMS will remind the user that this medium should be added to the Excel Template file for Creating Sample Projects in case the user is using this feature (see page 85). Click OK. Click Close to close the Media form. Note that the user can create a medium containing only 14C, or one containing 13C and 14C with Prefix C, etc. Next add a new procedure for 14C. Click Procedures on the Special Features sub form. LIMS will display a message box advising the user of valid ranges of procedure codes for various isotopes, isotope ratios, and CFCs. Note that valid procedure codes for 14C are between 1400 and 1499 (see table 5). Click Ok. Click Add. Enter “1400” for the Code and press the Enter key. LIMS will advise the user that a code for 14C is being added. Click OK. Enter “14C by AMS” for the Description. Click Save. Click Close to close the Procedure Codes form. The user next needs to link procedures to the medium created. Click Low Procedures on the Special Features form. Click Add. Select “140 !G [14C] C-bearing material” from the Medium combo box. Select “352 ! DI, Quartz sealed tube, 800 deg. Delta 13C” from the Low Procedure combo box. If a user had several procedure codes for the same medium and needed to indicate to LIMS which should be used as a default (such as when importing isotopic analyses), the user could select “*” from the Default combo box in order to make the selected procedure code the default low procedure code. Click Save and close the Low Procedure Codes form by clicking Close. Next click High Procedures on the Special Features sub form to open the High Procedure Codes form. Click Add. Select “140 !G [14C] C-bearing material” from the Medium combo box. Select “1400 ! 14C by AMS” from the High Procedure combo box. Click Save and close the High Procedure Codes form by clicking Close. A media code, and procedures codes are now available for 14C use in LIMS. To demonstrate this, click New Project Login on the Main Menu. Click the Medium combo box and verify that medium 140 is available. Using LIMS with 3H LIMS can be used for 3H samples. 3H media and procedures must be added to the default database because no media or procedures using 3H are otherwise available. The following illustrates how this is done. Add a new medium containing 3H, and add a procedure code for 3H. Click Special Features, click Media from the Special Features sub form, and click Add on the Media form. LIMS will prompt the user to select the Prefix last. Click OK. Enter “150” for the Code, enter “3H-bearing material” for the Medium,

105
and enter “3H” for the Abbr. Click the checkbox 3H. Select Prefix “G,” and click Save. LIMS will remind the user that this medium should be added to the Excel Template file for Creating Sample Projects in case the user is using this feature (see page 85). Click OK. Click Close to close the Media form. Note that the user can create a medium containing only 3H, or one containing 2H and 3H, for example. Next add a new procedure for 3H. Click Procedures on the Special Features sub form. LIMS will display a message box advising the user of valid ranges of procedure codes for various isotopes, isotope ratios, and CFCs. Note that valid procedure codes for 3H are between 1500 and 1599. Click Ok. Click Add. Enter “1500” for the Code and press the Enter key. LIMS will advise the user that a code for 3H is being added. Click OK. Enter “3H by electrolytic enrichment and LSC” for the Description. Click Save. Click Close to close the Procedure Codes form. The user next needs to link procedures to the medium created. Click Low Procedures on the Special Features form. Click Add. Select “150 !G [3H] 3H-bearing material” from the Medium combo box. Select “1500 ! 3H by electrolytic enrichment and LSC” from the Low Procedure combo box. If a user had several procedure codes for the same medium and needed to indicate to LIMS which should be used as a default (such as when importing isotopic analyses), the user could select “*” from the Default combo box in order to make the selected procedure code the default low procedure code. Click Save and close the Low Procedure Codes form by clicking Close. A media code, and procedures codes are now available for 3H use in LIMS. To demonstrate this, click New Project Login on the Main Menu. Click the Medium combo box and verify that medium 150 is available. Using LIMS with CFCs The CFCs, CFC-11, CFC-12, and CFC-113, are available in LIMS. CFC media and procedures must be added to the default database because no media or procedures using them are otherwise available. The following illustrates how this is done. First add a new medium by clicking Special Features, clicking Media from the Special Features sub form, and clicking Add on the Media form. LIMS will prompt the user to select the prefix last. Click OK. Enter “270” for the Code, enter “CFC-11, 12, & 113” for the Medium, and enter “CFCs” for the Abbr. Click the checkboxes CFC-11 and CFC-12. Select Prefix “G,” and click Save. LIMS will remind the user that this medium should be added to the Excel Template file for Creating Sample Projects in case the user is using this feature (see page 85). Click OK. Click Close to close the Media form. Next add two new procedures, one for CFC-11 and one for CFC-12. Click Procedures on the Special Features sub form. LIMS will display a message box advising the user of valid ranges of procedure codes for various isotopes, isotope ratios, and CFCs. Note that valid procedure codes for CFC-11 are between 2700 and 2799, and for CFC-12 are between 2800 and 2899. Click Ok. Click Add. Enter “2700” for the Code and press the Enter key. LIMS will advise the user that a code for CFC-11 is being added. Click OK.

106
Enter “CFC-11” for the Description. Click Save. The first procedure code has been added. Enter the second code by clicking Add, entering “2800” for the Code, entering “CFC-12” for the Description, and click Save. Click Close to close the Procedure Codes form. The user next needs to link these two procedures to the medium created. Click Low Procedures on the Special Features form. Click Add. Select “270 !G [CFCs] CFC-11, 12 & 113” from the Medium combo box. Select “2700 ! CFC-11” from the Low Procedure combo box. If a user had several procedure codes for the same medium and needed to indicate to LIMS which should be used as a default (such as when importing isotopic analyses), the user could select “*” from the Default combo box in order to make the selected procedure code the default low procedure code. Click Save and close the Low Procedure Codes form by clicking Close. Next click High Procedures on the Special Features sub form to open the High Procedure Codes form. Click Add. Select “270 !G [CFCs] CFC-11, 12 & 113” from the Medium combo box. Select “2800 ! CFC-12” from the High Procedure combo box. Click Save and close the High Procedure Codes form by clicking Close. A media code, and procedures codes are now available for use in LIMS. To demonstrate this, click New Project Login on the Main Menu. Click the Medium combo box and verify that medium 270 is available. LIMS allows users to display, print, and store CFC-113 results on a medium created for CFC-11 and CFC-12 by selecting this preference in the Options form.

107
ANALYSIS IMPORT FORMATS Introduction LIMS can import isotopic results from a file on a diskette. The formats that existed when this document was printed are discussed below. The user may discover that additional import formats have been added. LIMS Default Analysis Import Format The LIMS Default format for importing isotopic analyses is a Microsoft Access 97 mdb database file. The database specifications are listed below. Isotopic data is stored in a single table; the field names of this table are listed in table 7. Extension of the Microsoft Access file: mdb Microsoft Access version: 97 Name of Microsoft Access table: tbl_IsotopicResults Analytical Precision Analysis Import Format Analytical Precision saves analyses in a Microsoft MDB file with the specifications below (see table 8): Microsoft Jet engine version: 2.0 Microsoft Access Table name: LIMSInput PDZ Europa Ltd Analysis Import Format The format employed by PDZ Europa Ltd is a comma separated ASCII text file with all values in quotes (see table 9). Null values are indicated by "". File name: Mercury.txt An example of one line of data follows: "U","45741","1","W","4578","Aliquot 2","10101","Y123","23/03/1997 23:15:17","","-9.23","200","0"

108
Table 7. Fields of the LIMS versions 7 and 8 default table for importing isotopic analyses. Field name
Data type
Maximum string size
Description
rstr_MassSpec Text 1 Single letter mass spectrometer identification. Primary key of tbl_MassSpec. Does not need to be supplied as long as str_VendorMSID is supplied.
str_VendorMSID Text 50 Mass spectrometer serial number or vendor identification number. Does not need to be supplied as long as rstr_MassSpec is supplied.
lng_Analysis Number (long)
Analysis number. Unique integer that should be generated by the mass spectrometer and printed on the analysis report. This number must be able to be changed by user so that it can be set to required value in case mass spectrometer computer requires replacement.
lng_PeakNumber Number (long)
Peak number. Acceptable values are 1 to 999. Default value for dual inlet mass spectrometers is 1.
rstr_Prefix Text 1 Single letter sample prefix; C, G, J, N, R, S, or W (see table 1). Together with sample prefix, this forms the Our Lab ID.
rlng_Sample Number (long)
Integer sample number. Together with sample prefix, this forms the Our Lab ID, e.g., W-45677.
str_AliquotID Text 20 Aliquot identification.
str_Port Text 5 Name or identifier of the sample port on the preparation unit, manifold, carousel, etc.
str_Std Text 14 The name or identifier of the working standard.
dbl_Amount Number (double)
Amount of sample.
str_AmountUnit Text 4 The unit of amount, e.g., mg or mL.
dat_Analyzed Date/Time Date and time sample analysis of this peak is begun. Generally increments for each peak.
str_Comment Text 32 Comment.
int_Procedure Number (integer)
Procedure code from table tbl_Procedure (table 4).
dbl_PenultimateDelta Number (double)
Penultimate delta value.
rint_Error Number (integer)
Error code. Primary key of table tbl_Error. Default value is 0.
ysn_Ignore Yes/No Default value is No. Mass spectrometer can set this field to Yes if it can determine that isotopic analysis is unsatisfactory and should not be included in a calculation by LIMS of the final delta value. Usually this is the case when the mass spectrometer software performs another isotopic analysis of the sample.

109
Table 8. Fields of the Analytical Precision Microsoft Access table of isotopic analyses, LIMSInput.
Field name data type Size Comments
Counter long Not used by LIMS MassSpecID string 9 This is the VendorID of the mass spec. AnalysisCounter long Analysis number. PeakNo integer Peak number. Name string 20 OurLabID must be here. Position long PortID GasName string 10 Not used by LIMS. RunDate Date/Time Date/Time Comment Memo First 32 characters should be saved in LIMS comment field. Isotope Integer Isotope from tbl_Isotope. Delta Double Delta value RunCode Long Same as LIMS’ error code. Barcode string 10 Equivalent to LIMS’ Sample ID. Table 9. Fields of the PDZ Europa Ltd file of isotopic analyses, Mercury.txt.
Item
#
Description
Maximum String Length
Comment
1 mass spectrometer ID 1 LIMS mass spectrometer ID 2 analysis number 7 LIMS long integer 3 peak number 3 LIMS long integer 4 sample prefix 1 LIMS text with length of 1 5 sample number 6 LIMS long integer 6 aliquot ID 20 LIMS text with length of 20 7 port ID 5 LIMS text with length of 5 8 standard ID 14 LIMS text with length of 14 9 date/time 19 LIMS date/time
10 comment 32 LIMS text with length of 32 11 penultimate delta LIMS double 12 procedure 4 LIMS integer 13 error code 5 LIMS integer

110
Finnigan MAT Analysis Import Format The format for Finnigan ISODAT dual inlet, GC combustion (GCC), and EA (elemental analyzer) files are different. Importing isotopic data from any of these three formats into LIMS is a two- or three-step process:
1. Save the isotopic data on a diskette in Lotus wks format using the mass spectrometer’s computer.
2. If desired, open the Lotus file on the diskette with Excel and add a column with the column heading “Ignore”. Format every cell in this column as text. For each row of data that you would like LIMS to ignore (by putting a check in the ignore checkbox), put a “True” in “Ignore” column.
3. If desired, open the Lotus file on the diskette with Excel and put an asterisk in each row that you
want LIMS to import as a continuous flow reference injection analysis. This operation was performed in the tutorial (see page 65).
4. Insert the diskette with the wks file into the LIMS computer, click Import Analyses, and import the
wks file. Finnigan MAT is currently investigating possible formats for incorporation into their ISODAT-NT software, now under development. Importing Finnigan isotopic data is not always straight forward. An example of importing the dual inlet file Finn_DI.wks is given in the tutorial on page 61. If one opens this file with Excel, one finds the following 17 column headings in row 4: 1. date/time 2. spec.- no. 3. sample ident 4. standard name 5. Comment 6. SA 7. ST 8. SA28[V] 9. ST28[V] 10. SA29[V] 11. ST29[V]
12. d-29/28 13. std.dev. 29/28
14. Baseline 15. Interfering mass 1 16. Interfering mass 2 17. Interfering mass 3
111
This spreadsheet file was created with ISODAT version 5.2-0009 software using the following ISODAT configuration parameters: * 2 Date * 3 Spec.-No. / Sample Ident / Sample Size * 6 Standard Name * 8 Comment * 13 Ion-Gauge * 25 Delta Mean * 26 Std.Deviation * 50 New Page * 52 Interfering Masses For importing δ 18O values of water the user may want to put an asterisk on parameter 44, “sample (alpha H2O).” For importing δ 18O values of CO2 gas, the user may want to put an asterisk on parameter 42, “Delta O-18 vs SMOW.” A few comments are in order. The date/time column is imported by LIMS. Column 2, the spec. no., is the LIMS analysis number. This must be a unique integer for use by LIMS. Therefore, if a user needs to replace a computer or hard disk, the Spec No must be set during installation to the next unique integer analysis number. Column four contains the standard name. Column five contains the analysis comment. Column three is used to provide information about the description of the sample and the analysis. Currently LIMS does not import Baseline information (column 14). LIMS does import some interfering masses (columns 15 through 17). LIMS needs a value for the peak number. It uses a value of 1 as default for dual inlet analyses. Column three, sample ident, can contain as many as five items of information as shown an example below: Example Value Our Lab ID C-1 Aliquot ID My test #34 Low Procedure Code 312 High Procedure Code 820 Comment Temp = 41 C When all five items are provided, they are delimited with forward slashes as: Our Lab ID / Aliquot ID / Low Procedure Code / High Procedure Code / Comment

112
This format can be used for both Finnigan dual inlet and continuous flow wks files and for Micromass csv files discussed below. The minimum information needed by LIMS to import the analysis is Our Lab ID. LIMS will use default procedure codes for the medium if not provided. The following are examples for valid entries in column 3: C-1/My test #34/312/820/Temp = 41 C C-1 / My test #34 / 312 / 820 / Temp = 41 C C-1 C-1 //// Temp = 41 C C-1 / My test #34 /// Temp = 41 C C-1/My test #34 C-1 // 312 / 820 C-1 // 820 Note that if the comment is provided as a unique column (column 5 in this example), then it should not be provided in column 3. The δ 15N values are found in column 12 in this example. The column header is “d-29/28”. LIMS needs a mechanism to uniquely identify the column of the δ values to be imported. Often δ values are found in several columns so the user must specify the correct column. The procedure the user follows is to open the Mass Spectrometers form by clicking Special Features on the Main Menu and then clicking Mass Specs. The user can click List and can select the appropriate mass spectrometer. Click Edit. Enter “d-29/28” as the Column Heading for 15N in the Spreadsheet column names pane because this is the descriptor that uniquely identifies the column with δ 15N data to be imported. Micromass Analysis Import Format Micromass uses comma separated variable (CSV) text files that can be imported into spreadsheet programs. An example of importing the dual inlet file Mm_H2.csv is given in the tutorial on page 65. The format of dual inlet files is relatively similar according to Micromass; however, the format for continuous flow samples has varied often. Therefore, LIMS does not currently import Micromass continuous flow analyses. Micromass dual inlet files often contain more than 150 columns; thus, standard importing tools of Access will not work. Examples of Micromass dual inlet files of δ 2H of water, δ 15N of other N-bearing material, and δ 18O of water are provided by the files Mm_H2.csv, Mm_N2.csv, and Mm_O18w.csv, respectively. Column 1, “Sample Name”, must contain the Our Lab ID. Just as for Finnigan importing, the Aliquot ID, the low procedure code, the high procedure code, and the comment can be appended together in this field using the record separator forward slash (see above). The user has the choice to select the column of δ values to be imported.

113
Note that no analysis number is maintained by Micromass software. Therefore, users are prompted by LIMS to input an analysis number that must be separately maintained by the user. The “Run Serial Number” that Micromass generates is stored in the comment field of the analysis table. If a comment has been entered, the two are appended. The δ 18O values are found in column 39 in this example. The column header is “delta O18 wrt SMOW”. LIMS needs a mechanism to uniquely identify the column of the δ values to be imported. Often δ values are found in several columns so the user must specify the correct column. The procedure the user follows is to open the Mass Spectrometers form by clicking Special Features on the Main Menu and then clicking Mass Specs. The user can click List and select the appropriate mass spectrometer. Click Edit. Enter “Delta O18 wrt SMOW” as the Column Heading for the isotope 18O-Water in the Spreadsheet column names pane because this is the description that uniquely identifies the column with δ 18O values of water to be imported. Note that tokens are also available for δ 18O of other materials, δ 13C, δ 34S, etc. If the user is having difficulty importing isotopic data into LIMS, it is important to verify that the token specifying the column with the δ values to be imported is unique and spelled exactly as it appears. It cannot differ, even by a space. The author uses the copy and paste features of Windows to copy these column specifiers. LIMS can import ion gauge readings and sample and standard ion beam voltages if these are present in the spreadsheet to be imported. The user enables importing of these by selecting the appropriate checkboxes on the Mass Spectrometers form. When LIMS imports date and time from Micromass files, it first tries to import them assuming they are in the format 18-03-1997 18:03. If that is unsuccessful, LIMS attempts to import them as valid dates for the existing Window’s setting. Therefore, be careful not to enter 09/03/97, expecting that September 3, 1997 will be imported. LIMS will import it as March 9, 1997.

114
SAMPLE EXPORT FORMATS Introduction When the user generates a template of samples to be analyzed, LIMS creates a file on the user’s diskette that contains the sample names, the position of the samples in the preparation system, and information about the isotopic analyses requested. The data acquisition and control software of the user’s mass spectrometer can use this information to perform the requested isotopic analyses of each of the user’s samples. This technique eliminates typing in the sample heading and potential typographic errors. This method has been used in the author’s laboratory for a decade. LIMS Default Sample Export Format LIMS saves information on samples to be analyzed in two files, as a Microsoft Access 2 mdb database file and as a Microsoft Excel 5.0 file. The specifications of the database and table are listed below (table 10). Analytical Precision also saves information on samples to be analyzed in the same Microsoft Access 2.0 format. Name of Microsoft Access file: LIMS_TBA.mdb Name of Microsoft Access table: SamplesToBeAnalyzed Name of Microsoft Excel 5.0 file: LIMS_TBA.xls Sample Export Format for Analytical Precision The sample export format used by Analytical Precision is the LIMS default format, discussed above. Sample Export Format for PDZ Europa Ltd The format employed by PDZ Europa Ltd is a comma separated text file with all values in quotes (see table 11). Each line corresponds to one sample. Missing information is presented as "". Name of text file: ZEUS.TXT An example of two rows of data follows: "EA 1","U","4KM33","1","10001","G","4451","Aliquot 1","3","380","5","584" "EA 1","U","4KM33","2","10002","C","751","Aliquot 1","3","356","",""

115
Table 10. Fields of the LIMS versions 7 and 8 default sample export table, SamplesToBeAnalyzed.
Description Field name Data type Size Date and time of template generation
dat_Stamp Date/Time 8
template name rstr_TemplateName Text 50 mass spectrometer ID rstr_MassSpec Text 1 mass spectrometer serial number or vendor ID
rstr_VendorMSID Text 50
ordinal position of sample in list
rlng_OrdinalPositionInList Number (Long) 4
port ID rstr_Port Text 5 flag; 1 = fixed reference sample in this port, 2 = floating reference sample in this port, and 3 = port is empty.
rlng_PortRefEmpty Number (Long) 4
sample prefix of Our Lab ID rstr_Prefix Text 1 sample number of Our Lab ID rlng_Sample Number (Long) 4 aliquot ID rstr_AliquotID Text 20 low isotope code byt_LIsotope Number (Byte) 1 low procedure code rint_LProcedure Number (Integer) 2 high isotope code byt_HIsotope Number (Byte) 1 high procedure code rint_HProcedure Number (Integer) 2 method (for future use) rstr_Method Text 32
Sample Export Format for Finnigan MAT Finnigan MAT’s sample export format is currently being developed on Finnigan’s ISODAT-NT data acquisition and control software that operates on the Microsoft Windows NT platform. Sample Export Format for Micromass Currently Micromass has no sample export format.

116
Table 11. Fields of LIMS sample export file for PDZ Europa Ltd.
Item
#
Description
Maximum String Length
1 template name 50 2 mass spectrometer ID 1 3 mass spectrometer serial
number or vendor ID 50
4 ordinal position in list 5 5 port ID 5 6 sample prefix 1 7 sample number 6 8 aliquot ID 20 9 isotope of low procedure 2
10 low procedure 5 11 isotope of high procedure 2 12 high procedure 5

117
Modifying Code of the Mean Final Delta Algorithm This example shows the user how to modify code in order to alter the algorithm that allows one to display a value in Mean Final Delta. Users can only modify code of Lims7.mdb or Lims8.mdb. The code in Lims7.mde or Lims8.mde cannot be changed. Instead, the user show modify the code in either Lims7.mdb or Lim8.mdb and then create a new mde file using Tools/Datbase Utilities/Make MDE file in Microsoft Access. Before making any changes, make a backup of the code module (Lims7.mdb or Lims8.mdb) in case of difficulties. Suppose one desires the following algorithm for analyzing hydrogen isotope ratio samples: If the value calculated for the standard deviation of all replicates (the value in StdDev1) is less than
3 per mill, then display the mean value in Mean Final Delta so that the mean final delta value can be stored and analyses can be removed from the Table of Samples in Progress. Otherwise, leave Mean Final Delta blank.
To incorporate this algorithm in the code, the user only needs to add 4 lines of code and modify 2 other lines of code. Assuming LIMS is running do the following.
1. With the mouse, grab the Main Menu by its title bar and pull it half way down the monitor screen, exposing the command button Design.
2. Click Design. LIMS will respond "Preference have not been saved."
3. Click OK. The LIMS for Light Stable Isotopes database window will be exposed. Its title is
“LIMS7: Database” or “LIMS8: Database.”
4. With the mouse grab the bottom of the database window and pull it down to enlarge it.
5. Select the Modules tab.
6. Double click the module bas_delta_Delta. The code window should open.
7. From the right side combo box select s_GetMeanDeltasAndStdDevs. Find the line of code “'GET FINAL DELTA”.
The code for hydrogen reads as follows: Select Case w_Cnt Case 0 Case 1 gvar_SingleAnalysisDelta = pvar_MeanDelta1 Case 2 If (((Abs(pvar_StdDev1) < 1.55) Or (pvar_MeanDelta1 > 200 And … pvar_FinalDelta = Format(pvar_MeanDelta1, "##,##0.00#") ElseIf b_AtLeastTwoPeaks And f_RestonRules Then pvar_FinalDelta = Format(pvar_MeanDelta1, "##,##0.00#") pb_HighStdDev = True End If

118
Case Is >= 3 If (((Abs(pvar_StdDev1) < 1.55) Or (pvar_MeanDelta1 > 200 And … pvar_FinalDelta = Format(pvar_MeanDelta1, "##,##0.00#") ElseIf pvar_StdDev2 < 1.8 Then pvar_FinalDelta = Format(pvar_MeanDelta2, "##,##0.00#") ElseIf pvar_StdDev2 < 2.5 And w_Cnt = 3 Then pvar_FinalDelta = Format(pvar_MeanDelta2, "##,##0.00#") ElseIf (pvar_StdDev1 - pvar_StdDev2 > 1.1 And … pvar_FinalDelta = Format(pvar_MeanDelta2, "##,##0.00#") ElseIf pvar_MeanDelta2 > 200 And pvar_StdDev2 / pvar_MeanDelta2 … pvar_FinalDelta = Format(pvar_MeanDelta2, "##,##0.00#") ElseIf b_AtLeastTwoPeaks And f_RestonRules Then pvar_FinalDelta = Format(pvar_MeanDelta1, "##,##0.00#") pb_HighStdDev = True Else 'pvar_FinalDelta remains Null End If End Select If there are two analyses, the code under Case 2 is evaluated. If there are three or more analyses, the code under Case Is >= 3 is evaluated. The flag f_RestonRules is true when the Reston rules checkbox is enabled in the Options form. The code is revised as shown below. Following “Case 2” two new lines of code have been added. In the next line, the “If” has been replaced by “ElseIf.” Following “Case Is >= 3” two new lines of code have been added. In the next line, the “If” has been replaced by “ElseIf.” Select Case w_Cnt Case 0 Case 1 gvar_SingleAnalysisDelta = pvar_MeanDelta1 Case 2 If ((Abs(pvar_StdDev1) < 3)) And Not f_RestonRules Then pvar_FinalDelta = Format(pvar_MeanDelta1, "##,##0.00#") ElseIf (((Abs(pvar_StdDev1) < 1.55) Or (pvar_MeanDelta1 > 200 And … pvar_FinalDelta = Format(pvar_MeanDelta1, "##,##0.00#") ElseIf b_AtLeastTwoPeaks And f_RestonRules Then pvar_FinalDelta = Format(pvar_MeanDelta1, "##,##0.00#") pb_HighStdDev = True End If Case Is >= 3 If ((Abs(pvar_StdDev1) < 3) And Not f_RestonRules Then pvar_FinalDelta = Format(pvar_MeanDelta1, "##,##0.00#") ElseIf (((Abs(pvar_StdDev1) < 1.55) Or (pvar_MeanDelta1 > 200 And … pvar_FinalDelta = Format(pvar_MeanDelta1, "##,##0.00#") ElseIf pvar_StdDev2 < 1.8 Then pvar_FinalDelta = Format(pvar_MeanDelta2, "##,##0.00#") ElseIf pvar_StdDev2 < 2.5 And w_Cnt = 3 Then pvar_FinalDelta = Format(pvar_MeanDelta2, "##,##0.00#") ElseIf (pvar_StdDev1 - pvar_StdDev2 > 1.1 And … pvar_FinalDelta = Format(pvar_MeanDelta2, "##,##0.00#") ElseIf pvar_MeanDelta2 > 200 And pvar_StdDev2 / pvar_MeanDelta2 … pvar_FinalDelta = Format(pvar_MeanDelta2, "##,##0.00#") ElseIf b_AtLeastTwoPeaks And f_RestonRules Then pvar_FinalDelta = Format(pvar_MeanDelta1, "##,##0.00#") pb_HighStdDev = True Else 'pvar_FinalDelta remains Null End If End Select

119
Once changes are completed, the user needs to compile and save the code. In Access 97 select Debug, then Compile and Save. In Access 2000 select Debug, then Compile; select File, then Save. Broken code references are common in Access 2000. If they occur, LIMS will provide instructions to repair them when LIMS is next opened.

120
ACKNOWLEDGMENTS The author is indebted to numerous individuals that provided suggestions, comments, examples of mass spectrometer data output, and ideas in storing and handling isotopic data. For a decade, Carol Kendall (USGS) was instrumental in helping to develop concepts employed in LIMS. Mark Farnsworth (ex-USGS) using his Visual Basic expertise created much of the code in the first version of LIMS. Gilles St-Jean (University of Ottawa, Ottawa, Ontario, Canada) was instrumental in getting LIMS to work effectively with other than Windows U.S. regional settings, and he suggested numerous improvements. Len Wassenaar (Environment Canada, Saskatoon, Saskatchewan, Canada) has been a strong supporter of this project and has offered numerous suggestions. Willi Brand (University of Jena, Jena, Germany) pointed out that the inclusion of peak number was critical to the success of the database for use in continuous flow isotopic analysis. Bonnie Hower (USGS) obtained and formatted the countries, states, provinces, and administrative districts from the CIA’s World Factbook. Rebecca Carmody (ex-USGS), Daniel Snyder (ex-USGS), Gilles St-Jean, Joe Wildman (USGS, retired), and Steve Gossin (ex-USGS) provided editorial suggestions to the manual. Jun Abrajano (Memorial University, St. John’s, Newfoundland, Canada), Paul Dennis (UEA, Norwich, United Kingdom), Carol Kendall, Robert Michener (Boston University, Boston, MA), Devon Rowe (University of Alberta, Edmonton, Alberta, Canada), Gilles St-Jean, and Len Wassenaar provided various examples of mass spectrometer output. The cooperation of the mass spectrometer vendors Analytical Precision, PDZ Europa Ltd, Finnigan MAT, and Micromass is greatly appreciated. In particular Barry Graney from Analytical Precision offered numerous suggestions on coding and data storage.

121
REFERENCES Central Intelligence Agency, The World Factbook 1997. http://www.odci.gov/cia/publications. Coplen, T. B., 1988, Normalization of oxygen and hydrogen isotope data: Chemical Geology (Isotope
Geoscience Section), v. 72, p. 293-297. Coplen, T. B., 1997, A Laboratory Information Management System (LIMS) for light stable isotopes—
Version 7.0: U.S. Geological Survey Open-File Report 97-812, 118 p. Coplen, T. B., 1998, A Manual for a Laboratory Information Management System (LIMS) for light stable
isotopes—Version 7.0: U.S. Geological Survey Open-File Report 98-284, 124 p. ISO, 1992, ISO 31-0, Quantities and Units, Part 0, General Principles, subclause 2.3.3, International
Organization for Standardization. Microsoft, 1997a, Microsoft Access Language Reference and Microsoft Office Data Access Reference,
Microsoft Press, Redmond, Washington. Microsoft, 1997b, Microsoft Visual Basic for Applications and Shared Libraries References, Microsoft
Press, Redmond, Washington.