a growth agenda for spain
TRANSCRIPT

A Growth Agenda for Spain
A G
row
th A
gend
a fo
r S
pai
n
COPYRIGHT © 2010

Alejandro BeltránMcKinsey & Company
Michele BoldrinFEDEA
Nicolás BorgesMcKinsey & Company
João Castello-Branco McKinsey & Company
J. Ignacio Conde-RuízFEDEA
Enrique GarcíaMcKinsey & Company
Luís GaricanoLondon School of Economics. FEDEA
Pablo VázquezFEDEA

A Growth Agenda for Spain


Over the past 18 months, I have had the privilege of talking to business and political leaders around the world. While the mood has improved since the financial crisis started in 2008, there are still many uncertainties on how economic scenarios will unfold for most countries. One thing that is clear is that this is a time when strong leadership and the courage to undertake change is more crucial than ever.
Spain has made significant progress on many counts over the last couple of decades. Spain and Spanish leading companies hold a position in today’s global landscape that is far more important than 15-20 years ago. Yet, as explained by this report by our Spanish office and by FEDEA, the country must address the need for some fundamental changes. The most important issue to tackle is what at McKinsey we call the “productivity imperative”. To put it simply, Spanish businesses and administrations need to do more to embrace best-in-class practices and policies to boost productivity growth rates. This is critical to regaining competitiveness and sustainable growth. Another issue that I would like to stress as critical is the adaptation to the global rebalancing underway -- that is to say to become a more outward economy and, in particular, to follow the creation of the next big pools of growth (especially in Asia).
As a Firm we have observed and often participated in the transformation of many countries. We have seen that change is possible and we should be optimistic about it -- in particular, when one builds on the strengths of a large developed economy like Spain. Among the most important conditions for success, we find the creation of a broad consensus on what needs to be done, as well as the existence of strong leadership who can push forward a vision that is shared by a large majority. Those two elements -- direction and leadership -- are as important as the actual set of initiatives to be put in place.
That is the challenge that Spain must take on – success is both possible and necessary.
Dominic Barton Global Managing Director of McKinsey and Company

Executive summary
Spain needs to grow. Sustained growth is the only way for Spain to overcome the social and economic burden of chronic unemployment that affects our economy. At the same time, growth will increase state revenue and reduce expenditure relative to GDP, providing credibility to the huge fiscal consolidation effort that lies ahead.
This study focuses on the future: we attempt to identify the best growth opportunities for Spain. In particular, two key questions are addressed: which driving forces should Spain emphasize in its return path to sustainable growth? and, what key influences will speed up the achievement of these opportunities?
Spain’s most recent growth cycle skipped over the fundamental base of productivity that is needed to sustain growth. Our increases in productivity were insufficient and not competitive with those of Europe and the USA. As a result Spain must now build a new growth model based on a virtuous cycle of productivity, competitiveness and, therefore, with a greater capacity to capture external demand and generate sustainable domestic demand, not based on growing leverage.
Our analysis on a sector-by-sector basis has led us to conclude that Spain could create up to 3 million sustainable jobs if the right actions are taken. With this purpose we highlight two growth engines – trade (including tourism), and services:

1) Tradable Goods and Tourism These two sectors will play a fundamental role in driving the country’s international trade balance away from current deficit. From the standpoint of employment growth, they can be thought of as (large) ‘starter motors’ rather than the main engines. We estimate that the maximum job-creation potential for these two sectors is 600,000. To achieve this number, Spain must maintain a healthy exports quota, increasing its orientation towards the new sources of global demand. The essential levers to speed up growth in these sectors would be aggressive economic diplomacy and, in the mid-term, a set of policies targeted at fostering differentiation, innovation, cost competitiveness (including labour levers), and consolidation and cooperation between companies.
2) Services. The services sectors have the greatest job-creation potential for Spain. Some might not have predicted this, but Spain’s real growth engine in the mid-term will be in business and local services. First place will go to business services, including engineering, IT, legal services, advertising, and internet services, followed in importance by local services, including retail and wholesale distribution of all types of goods and services. Spain has created far fewer services jobs than have been created in the rest of Europe and the USA. In Europe services accounted for over 15 percent of jobs created between 1995 and 2005, while in Spain this figure was below 5 percent. Our estimates show that if Spain manages to achieve the levels of productivity and employment of more advanced countries in these types of activities, it could create up to 2.5 million sustainable jobs. Creating quality jobs in these sectors has not only direct effects, but could also help improve productivity of companies in other areas of our economy. To accelerate this job creation a number of levers should be applied. Regulation should be optimized to foster competition and increase the sector’s dynamism. Efficiency within these markets should be promoted through the creation of open certifications to distinguish quality suppliers. Most important of all, Spain should invest in professionalizing our people, mainly through vocational training, so that we have specialists needed in all future areas where demand will exceed supply.

For the key job-growth sectors to flourish, a change programme will have to directly address other sectors with policy and action steps. The two most important of these sectors are Infrastructure and Construction:
3) Infrastructure, including transportation, telecoms, and energy. Spain has an excellent infrastructure starting point, but must ensure that sector regulation contributes to productivity and competitiveness of growth sectors.
4) Construction. This sector faces two main challenges. First sector restructuring must be accelerated, but in such a way that the effects of this are actively managed, through better employment policies. Second within the financial sector, loss recognition must be improved and the real estate market adjusted, as this sector undergoes recapitalization and restructuring.
Based on the set of needs identified through this sector-based analysis, we can identify seven significant issues around which a transformative change programme can be structured to foster sustainable growth.
A. Support companies in their outward orientation, and in particular towards opportunities in new sources of growth such as the Asian market.
B. Promote the creation of larger companies. Productivity of Spanish companies is comparable to that of its European peers across all sizes, but Spain has many more smaller companies whose productivity is below their European counterparts.
C. Use labour reform to simplify, remove redundancy and decentralize collective agreements. This will enable investment in greater value-added activities, as well as the creation of quality jobs. It will also enable the matching of salaries and employment conditions to the economic reality of each company.
D. Ensure the availability and access to suitable human capital at all levels. It is particularly necessary to drastically increase vocational training and make sweeping reforms to active labour market policies.

E. Radically simplify regulation to facilitate business activity, and allow the entry and exit of competitors to and from the market. According to the World Bank, Spain ranks 147th out of 183 countries in convenience of opening a new business.
F. Improve innovation, specifically in those sub-sectors where this is the key to competitiveness and growth (mainly a part of exportable goods and business services).
G. Foster availability of capital for business initiative, in particular through the release of capital currently concentrated in the real estate sector.
In deriving the seven transformative action areas from our sector analyses of the growthchallenges facing the Spanish economy, we also sought outside confirmation. Specifically, welooked to the experiences of other countries that have successfully deployed comprehensivereform and growth programmes. The dissection of these experiences revealed many differences,but also important commonalities. Foremost among the elements the different changeprogrammes held in common were three basic factors on which their separate successesdepended. These ran like three bright red threads across the programmes, from region to region: i) A joint public-private initiative to define the ambition and priorities for a project that sets thegoal and vision for the society as a whole; ii) A comprehensive and agreed-upon change programme, with a clear set of initiatives, accountability, and timelines; iii) Rigorous monitoring of the execution of this programme, in particular through clear and objective performance indicatorsIt is our hope that the analyses we have made and the policies, and actions we have proposed fordiscussion provide an essential framework for a transformative change programme for Spain. It isour decided view that such a programme is necessary, that the work on it should begin right away,and that its forward motion be predicated on these three key factors. We believe strongly thatSpain has in abundance the people and the will that is needed for success.

In 2009 our unemployment rate was 18%, versus 12% for EU-15
Per capita income in Spain is still 11% lower than in EU-15
Over 55% of the productivity gap is explained through a lower sector by sector productivity
Employment dedicated to Business Services in our economy is 35% less than in Europe

The wealth gap between Spain and Europe decreased by 35% since 1995
The number of individuals with tertiary education already accounts for 28% of our job market, versus 24% in Europe
Our labour market participation rate has increased 25% since 1995, exceeding EU-15 levels
Since 1995 we have created almost 6 million jobs
Spain is the worldwide leader in Tourism, generating 45% more jobs than the European average

12 A Growth Agenda for Spain
Contents

13Spain’s present growth model is unsustainable
1. Spain’s present growth model is unsustainable
2. A possible future
3. Maximizing the potential in each sector
3.1 Secure Spain’s trade balance with a more sustainable Tradable Goods sector
3.2 Redefine Spain’s value proposition to maintain global tourism leadership
3.3 Increase productivity of Local Services
3.4 Encourage growth in Business Services
3.5 Ensure Spain’s Infrastructure supports growth
3.6 Accelerate the restructuring of the Construction sector
4. Setting up the new model
Appendix: Methodology to estimate Spain’s growth potential

1

Spain’s present growth model is unsustainable

16 A Growth Agenda for Spain
1. Spain’s present growth model is unsustainableSpain’s wealth grew rapidly over the last 15 years. Since 1995 until the downturn in 2008, Spain’s real per capita income gap versus the rest of Europe closed by over 7 percentage points; average income in Spain reached about 90 percent of EU-15 levels (Exhibit 1).
Exhibit 1Evolution of wealth in Spain compared to Europe
Real indexed per capita GDP, 1 = EU-15
Source: The Conference Board; IMF
The driving engine for growth during this period was the increase in jobs. Job growth explains over 75 percent of the per capita income growth in Spain. In 1995, the number of hours worked per capita in Spain (560) was 20 percent s less than in Europe (675). In 2007, this situation had changed dramatically: 740 in Spain versus 720 in Europe. The main factor behind this change was a structural increase in the labour market participation rate1, which has risen from 60 to 75 percent, mainly by women entering the labour market (Exhibit 2).
1 Persons prepared to work out of the total number of individuals of working age.

17Spain’s present growth model is unsustainable
Exhibit 2Breakdown of labour utilisation into factors and contribution
Per capita hours worked
Source: The Conference Board, IMF, INE (National Statistics Institute), team analysis.
Despite the recent crisis, almost 6 million jobs have been created in Spain since 1995, distributed among almost all the sectors of the economy (Exhibit 3).
Exhibit 3Increase of jobs by sector in Spain since 1995
Thousands of jobs. 1995 - 2010-Q2
Source: INE (National Statistics Institute).
1 In order to assign the increase corresponding to each group we have calculated what the rate of participation would be in 2009 if each of these remained at 1995 levels, deducting the real rate of participation and approximating the real increase as the sum of these differences
2 Each combined effects of the different variables has been distributed equally among them

18 A Growth Agenda for Spain
However, this job and wealth creation process has proven unsustainable, and job losses have greatly accumulated since 2008. There are two keys to understanding the unsustainability of Spain’s production model: insufficient productivity increases and accumulation of trade imbalances.
Spain’s productivity has not increased enough Productivity improvement in Spain has been clearly insufficient. Spanish growth has come at an unsustainably high cost in terms of capital and human effort (hours worked), factors which have already led to lower growth in Spain than in other countries when using comparable amounts of resources (Exhibit 4).
Exhibit 4Contribution of factors to real GDP growth
Average percentage increase 1995 - 2007
Source: EU KLEMS.
In the period from 1995 to 2008, Spain was one of the few European countries with a negative contribution of multi-factor productivity.
Since 1995 Spain has experienced an ongoing erosion of its productivity when compared to Europe, mainly derived from the destruction of low-productivity jobs in our country (Exhibit 5).
1 Increase of GDP stemming from increase in production (Multifactor productivity). Data for EU-15 are from the 1995 - 2005 period and only include countries for which the multifactor effect can be calculated: AUT, BEL, DNK, ESP, FIN, FRA, GER, ITA, NLD & UK

19Spain’s present growth model is unsustainable
Exhibit 5 Evolution of labour usage and productivity compared to Europe
Real productivity indexed, 1 = EU-15; Labour usage, annual per capita hours
Source: The Conference Board, IMF
This is very worrying, mainly because productivity is the key variable determining the level of welfare an economy can sustain. Not surprisingly, to increase the well-being of its citizens any economy will need to produce more goods and services per employed worker (Exhibit 6).
Exhibit 6Ratio between productivity and wealth of a country
2009
Source: Conference Board; IMF; team analysis
1 The ‘EUR SPA 2009’ note indicates that parity ratios of purchasing power and deflators required has been used to express the data in Spanish prices and currency of 2009

20 A Growth Agenda for Spain
Spain’s incapacity to generate growth in productivity over the past 15 years has been the key weakness of its growth model. If we fail to remedy this issue, the year-over-year negative differences in productivity growth will inevitably accumulate into a huge gap when compared to the rest of Europe. The productivity gap will ultimately limit not only the quantity of goods and services we produce, but also the amount of leisure time we can enjoy and the benefits, including pensions and public healthcare, we can afford.
While part of the difference in labour productivity can be chalked up to the preponderance in Spain of fairly unproductive sectors such as construction, more than 50 percent of the difference in productivity is derived from a lower relative productivity in each sector (Exhibit 7).
Exhibit 7Breakdown of the productivity gap vs. Europe, between the composition effect and contribution by sector
Productivity difference between Spain and the EU-15 in 2005, percentage
Source: EU KLEMS, team analysis
N.B.: The public sector and real estate activities have been excluded from the analysis
1 The effect of the sector-by-sector contribution is calculated as the increase of productivity that Spain would have if it maintains its sector mix constant and the productivity of each sector is the same as the European one. The contribution of the sector mix represents the increase of productivity that Spain would have with regard to the European mix.

21Spain’s present growth model is unsustainable
In other words: most Spanish sectors are less productive than their counterparts in the rest of Europe. Moreover, the few sectors that are more productive have experienced an erosion in their advantage. Only the banking sector has seen increased productivity. In fact this sector is a notable exception as it is not only more productive than in Europe but has also increased its productivity differential, although this differential will probably be influenced negatively by the effects of the real estate crisis and the construction sector.
The mediocre evolution of Spanish productivity, tied to a significant increase of labour costs, is eroding Spain’s competitiveness with other economies (Exhibit 8).
Exhibit 8Evolution of the labour cost in Europe
Source: OECD
This is one of the most important direct effects of poor performance in terms of productivity evolution.
N.B.: The line represents the constant unit labour cost points. The slope is based on the Consumer Price Index in the Euro zone

22 A Growth Agenda for Spain
External imbalances stress the need for change The evolution of trade activity with other countries since 1995 is characterised by the accumulation of huge deficits in the trade and financial balances, which means Spain is constantly dependent on external funding.
Partly because of the large influx of immigrants, over 80 percent of Spanish growth has been targeted towards domestic consumption, a higher proportion than in France (70 percent), the United Kingdom (50 percent) or Germany, which has grown only in production targeted towards exports (Exhibit 9).
Exhibit 9Increase of hours worked based on end consumer
Billions of hours worked
Source: EU KLEMS, INE (National Statistics Institute), team analysis
One factor within the labour equation is that Spain saw an influx of immigrants in recent years, who took jobs in sectors where the domestic labour force was insufficient, such as construction. During this period, Spanish workers migrated to more skilled jobs.
Another factor contributing to the imbalance is that Spain’s imports grew 10.1 percent annually during 1995–2008, while exports grew only 8.5 percent over the same period. Cumulatively, this correlation significantly eroded the current account balance and created very high deficit levels (-6.9 percentage points of GDP). Despite a recent partial correction of this deficit, the accumulated imbalance is very significant. As a result of these huge sustained deficits, the need for external funding has been great, amounting to EUR 520 billion, 2000 to 2009 (Exhibit 10).

23Spain’s present growth model is unsustainable
Exhibit 10Spain’s Needs for external funding
Billions of euros
Source: Banco de España (Bank of Spain)
This growth pattern must come to its end. Spain needs to develop a new growth model based on substantial productivity and competitiveness improvements, which enable long-lasting sustainable growth in wealth and employment (Exhibit 11).
Exhibit 11Evolution of the growth model of the USA, Europe and Spain
Per capita GDP, EUR SPA 2009
Source: The Conference Board, MGI

2

A possible future

26 A Growth Agenda for Spain
2. A possible futureWe believe Spain has the potential to create millions of jobs in the next decade. One million jobs could be created by achieving average European productivity and activity levels; up to 3 million jobs would be created were Spain to approach US levels1. However, reaching this target requires a radical change in the country’s economic model. Throughout this effort we analyse the key foundations of this new economic model and introduce some of the policies that could act as drivers for change.
“Spain has the potential of creating 1 million jobs by reaching Europe’s average levels of productivity and activity, and up to 3 million by approaching US levels”
Superior worldwide infrastructures to enhance natural assets Spain’s growth journey will be built upon the nation’s strengths. Throughout the past 20 years there has been a huge investment in infrastructure, in particular for passenger transportation. With 276 km of highways per million inhabitants, Spain has the most extensive highway network in Europe (Exhibit 12).
1. Based on a methodology that assumes a sustainable and productive sectorial profile for Spain, by benchmarking with international examples or with our own recent past.

27A possible future
Exhibit 12Comparison by country of the infrastructure that exists in Europe
Kilometres of highway per million inhabitants, 2006
Source: Eurostat, Adif, team analysis
At the end of 2010, Spain will be ranked world leader in kilometres in operation of high-speed railway, ahead of countries with strong traditions in this technology, like Japan and France. Spain is also a top-five nation in terms of goods that transit its ports, and great effort has been expended in modernising the main airports and ports over the last 20 years. These investments complement the key topological assets of Spain – its geographic position and its climate – and help make Spain a very desirable place to live or visit. These assets have made Spain a place where wealthy Europeans keep a second home; it could also and more profitably allow Spain to become a place where researchers and entrepreneurs choose to envisage their ideas and put them into practice.
Abundant competitive human capitalSpain has suffered from an unusually high level of “academic abandonment”: students dropping out of our institutions of higher education before completing their degrees. Our systems of higher, secondary, and vocational education, furthermore, suffer from a significant number of shortcomings. We have a large proportion of workers with low educational levels and limited access to remedial secondary or vocational education; the education system, furthermore, puts insufficient focus on entrepreneurial skills. Despite the shortcomings, however, young Spain has a healthy and improving proportion of educated people: 38.2 percent of the Spanish population between 25 and 34 hold a university degree, versus the European average of 33.5 percent. For employers, these graduates come cheaper than many of their European counterparts: recruiting a Spanish graduate of between 25 and 34 entails an average cost of EUR 38,000, while the German graduate costs 66,000 and the British one 70,000 (Exhibit 13).

28 A Growth Agenda for Spain
Exhibit 13Labour cost of European graduates between 25 and 34
Thousands of Euros. 2006
Source: OECD, Eurostat, CPS, ILO
We know that many of these young graduates are unemployed: about 12 percent (high, but lower than at other levels of education), a more troubling issue is that 44 percent of them are employed in jobs for which they are over-qualified. The energy and knowledge that are currently being wasted also represent an opportunity for the future.
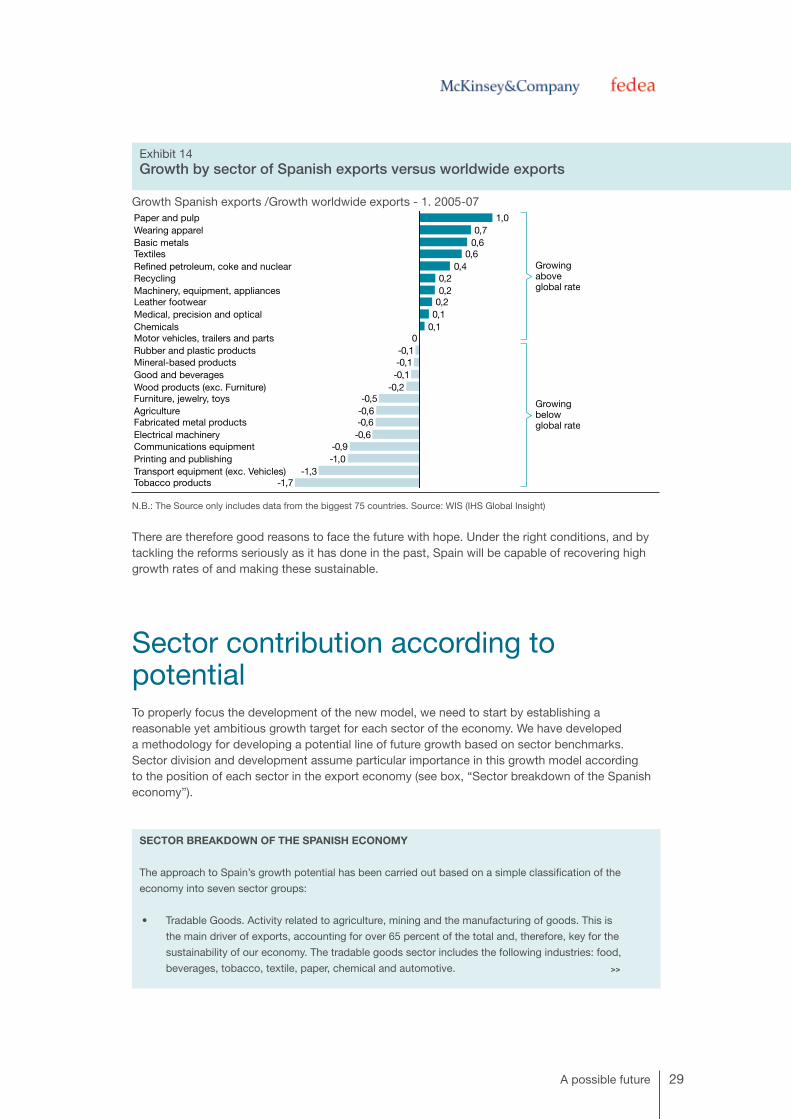
A globally competitive business fabricIn recent years Spain has generated a leading business fabric worldwide. From the finance sector to the textile industry, from infrastructures to renewable energies, Spanish companies compete successfully in the key global economic sectors. Fifteen years ago scarcely a single Spanish company was operating globally. Nowadays, Spanish companies compete in 12 of the 38 sectors into which Forbes magazine classifies economic activities. One indication of Spain’s global competitiveness is that while other modern economies are losing their share of exports, Spain has managed to maintain its levels for the past 5 years. In sectors that represent almost half of our manufacturing production, Spanish exports have grown more swiftly than global exports, thus gaining market share (Exhibit 14).
1 Data from 2008, except for Spain and Finland, where the data are from 2007 (latest available in a Uniform source)
2 Data from 2007
29A possible future
Exhibit 14Growth by sector of Spanish exports versus worldwide exports
Growth Spanish exports /Growth worldwide exports - 1. 2005-07
N.B.: The Source only includes data from the biggest 75 countries. Source: WIS (IHS Global Insight)
There are therefore good reasons to face the future with hope. Under the right conditions, and by tackling the reforms seriously as it has done in the past, Spain will be capable of recovering high growth rates of and making these sustainable.
Sector contribution according to potentialTo properly focus the development of the new model, we need to start by establishing a reasonable yet ambitious growth target for each sector of the economy. We have developed a methodology for developing a potential line of future growth based on sector benchmarks. Sector division and development assume particular importance in this growth model according to the position of each sector in the export economy (see box, “Sector breakdown of the Spanish economy”).
SECTOR BREAKDOWN OF THE SPANISH ECONOMY
The approach to Spain’s growth potential has been carried out based on a simple classification of the
economy into seven sector groups:
• Tradable Goods. Activity related to agriculture, mining and the manufacturing of goods. This is
the main driver of exports, accounting for over 65 percent of the total and, therefore, key for the
sustainability of our economy. The tradable goods sector includes the following industries: food,
beverages, tobacco, textile, paper, chemical and automotive. >>

30 A Growth Agenda for Spain
• Tourism. Foreign consumers contribute mightily to the Spanish hotels and restaurant industry. The
sector does not include transportation or local services, though tourism generates significant demand
for them.
• Business Services. Mainly services provided by companies to other companies and businesses.
These include IT, legal, and advertising services.
• Local Services. Comprises services with a mainly domestic driver; includes retail, wholesale, financial,
domestic, personal and social services.
• Construction. Activity related to construction and refurbishment of buildings and civil engineering.
• Real estate activities. Activity associated with the commercial development and sales of real estate.
• Public Sector. Public administration, defence, health and education services; although some of the latter
areas have a large private component, they are also included in this category for their public foundation.
We divided the sectors of the Spanish economy into two large groups according to the very different roles they play in the growth model: 1) sectors that promise to become the engines of sustainable growth in Spain, producing its tradable goods and services in general; and 2) sectors that will support and catalyze the growth of the Group 1 sectors (Exhibit 15).
Exhibit 15Sector division of the Spanish economy
Millions of average jobs, GVA. 2008
Source: EU KLEMS, INE
It is important to point out that we have excluded the public sector from this classification, and have not considered its evolutionary potential on jobs and productivity in the content of this effort, because to do this correctly would require a completely different methodology. However, we would like to state that in many interviews conducted for this work, almost unanimous emphasis has been placed on the great need to make sweeping improvements in the productivity and efficiency of public services to allow the public sector to become a key piece in economic growth (see box, “Productivity in health, education and public services”)
1 Its set of problems will be analysed together with the Construction sector 2 Gross Value Added

31A possible future
PRODUCTIVITY IN HEALTH, EDUCATION, AND PUBLIC SERVICES
Public sector productivity is inherently difficult to measure because most public services do not charge
customers. Moreover, the output of services such as defence or education is difficult to define. Most
national accounts therefore assume a value of output equal to the total cost of the inputs. This results in
public sector productivity growing in line with wage increases beyond inflation.
The United Kingdom’s National Statistics Bureau has started using direct indicators of output, such as the
number of medical consultations or the number of children taught since 1998, and extended this initiative
more recently to measuring quality. The effort is still partially experimental, but there are indications that
public sector productivity may actually have fallen in the decade from 1997 to 2007, in strong contrast to an
annual 2.3 per cent productivity gain for the overall economy.
Measuring and finding ways to improve upon public sector productivity is high on McKinsey’s agenda for
future research.
Exhibit 16 displays the overall potential of employment creation and increase in value-added, based on the proposed sector breakdown. Overall, we estimate that Spain can create between 1 million jobs – when using European averages as benchmark – and 3 million jobs – when using US references. Additionally, a productivity increase of between 10 and 30 percent is possible, which would lead to GDP growth of EUR 125 billion–450 billion. The required time frame for achieving this potential depends not only on the speed with which the policies recommended below are put in place, but also on the reaction of Spain’s business fabric.
Exhibit 16Growth potential of the Spanish economy
Millions of jobs at the end of the year
Source: INE, team analysis
1. GVA
Percentage of GDP

32 A Growth Agenda for Spain
In order to quantify this potential we have assumed different sets of hypotheses, according to the nature of each sector (see appendix for further detail).
• Tradable Goods and Tourism. We have estimated the growth potential of our exports by assuming that Spain can recuperate its highest market share of global trade of goods, while maintaining the current quota of international tourism. To achieve this goal we have assumed productivity increases that will allow serve increases in domestic demand.
• Services. Since services are of a predominantly domestic nature, we compare the activity in these sectors with the average of service activity in the EU-15 and the US. We have analysed, sector by sector, whether or not Spain is more productive than the reference. If Spain’s productivity is below the benchmark, we have assumed the potential to reach it while at the same time, stimulating demand (in terms of hours per capita) up to EU-15 or US levels.
A. Growth sectorsGrowth is concentrated in the aggregate of Tradable Goods, Tourism, and Local and Business Services sectors. All together, the total growth potential is between 1 million and 3 million jobs (equivalent to an occupation rate between 15 and 6 percent). The resulting growth profile is for Spain, as for most developed economies, focused in Services (between 70 and 80 percent of growth), and in particular in Business Services, where Spain has a long way to go when compared to Europe and the United States. Although the job contribution of Tradable Goods and Tourism is expected to be less than that of Services, they must play a pivotal role by sustaining the new growth model.

33
B. Reinforcing sectorsAccording to the methodology used, Infrastructure and Construction will not be the engines that drive new job creation. Their contribution to growth in terms of wealth should stem mainly from increases in productivity and from the empowerment of job creating sectors.
In recent years, there has been significant investment and development in the Infrastructure sector in Spain, and productivity levels are comparable (superior for a few specific subsectors) to those in Europe. Future success involves removing specific bottlenecks and, above all, ensuring competitiveness as a key enabler for the remaining sectors, especially Tradable Goods and Services.
The Construction sector, on the other hand, is in the process of adapting to a significant decline in demand and will require proper management of the effects on the labour and financial markets to prevent it from hampering development of the sectors that do have growth potential.
As mentioned previously, we believe that many of the requirements to carry out the transformation and achieve the potential are in the hands of the private sector. For the sectors to develop, however, it is important to understand the barriers to private initiative and to define the policies needed to remove them. The policy recommendations should be prioritized by the administration. The following chapter delves further into these issues, giving a more detailed review of each sector and propose a list of possible policies.
A possible future

3

Maximizing the potential in each sector


3.1Secure Spain’s trade balance with a more sustainable Tradable Goods sector

38 A Growth Agenda for Spain
3.1 Secure Spain’s trade balance with a more sustainable Tradable Goods sectorThe Tradable Goods sector comprises essentially manufacturing subsectors, although it also includes extractive activities such as agriculture, fishing and mining. It represents roughly 19 percent of jobs and 17 percent of Spanish value-added. Productivity in this sector varies strongly between subsectors, but is in general significantly less than in Europe and 40 percent below US figures.
Recent evolution in these sectors (between 2000 and 2008) was conditioned by limited productivity growth and a 10 percent employment reduction. This decrease has been concentrated in manufacturing activities, where from 2007 until mid-2010 more jobs were destroyed than had been created in the previous period (1995–2007).
The relevance of the Tradable Goods sector in the future, beyond its relatively moderate contribution to overall job creation, comes from the effect it has on other sectors. This sector accounts for over 65 percent of our exports and is vital to reduce our dependence on foreign financing. It furthermore generates demand for the remaining sectors of the economy. Additionally, much production within this sector is over-performing global evolution and will therefore play a significant role on growth. In fact, 43 percent of all Tradable Goods production in Spain is growing faster than the global average, and 59 percent of production comes from sectors with high growth potential.
To achieve the levels commensurate with Europe or the US, however, Spain must make four fundamental large-scale improvements (Exhibit 17):
Exhibit 17Four priorities for defining the policies of the Exportable Goods sector
Challenge Priority Specific actions
Insufficient penetration in high growth markets
Increase exports focus onhigh-growthmarkets
•Develop a new model of economic diplomacy•Deploy incentives that favour reorienting production to exports • Facilitate availability of resources with cross-border skills • Re-focus immigration policies towards highly qualified workers
Under developed differentiated sectors
Reinforce the differentiation of Spanishindustry
• Improve the effectiveness of public investment in innovation through a results-oriented culture
• Encourage universities’ sensitivity to society’s innovation needs• Facilitate research mobility from universities to companies• Launch a plan to capture R&D intense multinational companies
High cost pressure in a significant part of the Tradable Goods sector
Increase cost competitiveness for highlyexposed sectors
•De-centralize negotiation of collective agreements• Launch schemes for SME import consolidation •Develop training and certification programmes targeted to attract of best-
in-class management and operational practices•Develop infrastructures to enhance competitiveness
Excessive fragmentation of industrial tissue
Foster the development of bigger andstronger companies
• Promote SME consolidation through simplification of administrative procedures, education and awareness
• Porgress in reforms of the labour market to simplify recruitment • Foster the creation of venture capital funds targeted at SMEs • Refocus the education system to ensure availability of properly trained
professionals
39
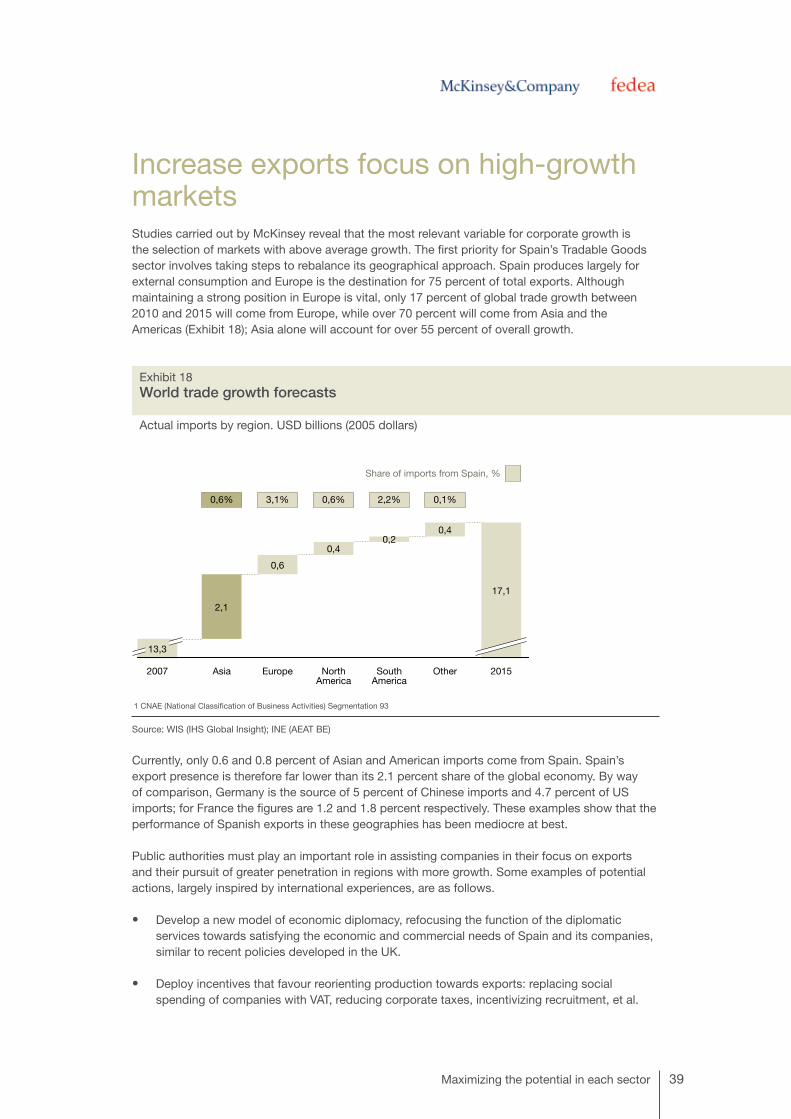
Increase exports focus on high-growth markets Studies carried out by McKinsey reveal that the most relevant variable for corporate growth is the selection of markets with above average growth. The first priority for Spain’s Tradable Goods sector involves taking steps to rebalance its geographical approach. Spain produces largely for external consumption and Europe is the destination for 75 percent of total exports. Although maintaining a strong position in Europe is vital, only 17 percent of global trade growth between 2010 and 2015 will come from Europe, while over 70 percent will come from Asia and the Americas (Exhibit 18); Asia alone will account for over 55 percent of overall growth.
Exhibit 18World trade growth forecasts
Actual imports by region. USD billions (2005 dollars)
Source: WIS (IHS Global Insight); INE (AEAT BE)
Currently, only 0.6 and 0.8 percent of Asian and American imports come from Spain. Spain’s export presence is therefore far lower than its 2.1 percent share of the global economy. By way of comparison, Germany is the source of 5 percent of Chinese imports and 4.7 percent of US imports; for France the figures are 1.2 and 1.8 percent respectively. These examples show that the performance of Spanish exports in these geographies has been mediocre at best.
Public authorities must play an important role in assisting companies in their focus on exports and their pursuit of greater penetration in regions with more growth. Some examples of potential actions, largely inspired by international experiences, are as follows.
• Develop a new model of economic diplomacy, refocusing the function of the diplomatic services towards satisfying the economic and commercial needs of Spain and its companies, similar to recent policies developed in the UK.
• Deploy incentives that favour reorienting production towards exports: replacing social spending of companies with VAT, reducing corporate taxes, incentivizing recruitment, et al.
Maximizing the potential in each sector
1 CNAE (National Classification of Business Activities) Segmentation 93

40 A Growth Agenda for Spain
• Facilitate, particularly through training, the availability of human resources with suitable international skills, including language learning, cultural knowledge, and an international orientation.
• Refocus immigration policies towards highly qualified workers, in part by reducing the barriers in procedures so that these workers can bring their families with them and have their legal residence renewed indefinitely.
Reinforce the differentiation of Spanish industry Commoditised sectors are those in which products are favoured based mainly on price, while differentiated sectors are those in which products are favoured according to other factors such as quality or uniqueness. Differentiated sectors are those whose products are characterized by innovation, branding, or complementary value-added services. Vendors of differentiated products are thus able to distinguish their products from those of the competition, and have a lesser need to compete on price (e.g., wines or photographic lenses). For more information see the box, “Classification methodology for Tradable Goods sectors.”
CLASSIFICATION METHODOLOGY FOR TRADABLE GOODS SECTORS
Challenges in competitiveness, as well as threats and opportunities derived from the increase in
globalisation vary greatly from one industrial sector to another. We have analyzed every activity included
in Tradable Goods (up to 230 subsectors classified according to their CNAE code), in order to develop a
framework in which to organize the complete Spanish industrial landscape. This classification has been
made according to three groups based on the nature of competition within the sector and, therefore, the
problems they face in global competition (Exhibit 19).
• Differentiated: sectors whose competitive nature is based on innovation, and those whose biggest
strength lies in their brand image. This group includes precision and optical medical instruments,
aeronautical and spacecraft equipment, jewellery, etc.
• Location-based: those sectors that can be identified by their strong dependence on location. For
logistical or other reasons they need to be near fixed resources required to carry out their activity,
or to their target market. Some examples include perishables, products made from wood, rubber,
agriculture, fishing, hunting, or oil refining.
• Exposed: sectors where the competitive advantage lies mainly in price, and where transport cost
is not a fundamental barrier. These sectors are facing a growing threat from emerging countries.
Examples include most of the textile industry, car manufacturing, and communications equipment.

Description Key sectors1
Differentiated • Sectors at the cutting edge of technology• R&D – long cycles and large budgets.
Competition based on product innovation and intellectual property
• Transport equipment (excluding motor vehicles). In particular railway, aircraft and spacecraft
• Chemicals (in particular Pharmaceuticals: drugs and medicines)
• Medical, precision and optical
• Sectors in which the brand is paramount, supported by innovation in design and development
• Proximity to key markets to understand and determine trends
• Food and beverages - branded• Chemicals. In particular soap, cleaning and
cosmetics. • Jewelery and musical
Location
• Sectors with strong need for production close to market (prohibitive cost of transport or highly complex logistics)
• Competition based mainly on price
• Food and beverages – not branded• Agriculture, forestry and fishing• Refined petroleum, coke and nuclear• Mineral-based products (non-metallic)• Wood products• Rubber and plastic products• Printing and publishing
Exposed • Sectors facing competition on product innovation and quality, but also on price
• Need for market proximity (R&D and production) varying by sector and becoming less and less critical
• Motor vehicles, trailers and parts• Machinery, equipment, appliances• Manufacture of basic metals (non-ferrous)• Rubber and plastics products• Chemicals. In particular, paints and
varnishes, explosives, industrial gases
• Sectors competing mainly on price • Structural disadvantages of Spain• Market proximity is no longer imperative, at
least for production
• Furniture, toys and other goods • Electrical machinery • Textiles. In particular wearing apparel and
leather footwear• Basic chemicals and fertilizers
Innovation driven
Uncertainly exposed
Strongly branded
Highly exposed
Competitionon innovation
Competitionon cost
1 CNAE (National Classification of Business Activities Segmentation 93
41
Exhibit 19Classification of exportable goods based on their competitive nature
Source: McKinsey Global Institute, team analysis
The segmentation of the Spanish Tradable Goods sector reveals that the weight of subsectors with a high level of differentiation is significantly lower than it is in other developed economies. While in Spain these represent 4 percent of overall value-added, in France or Italy they reach the 11 and 9 percent respectively (Exhibit 20).
Exhibit 20Competitive nature of exportable goods
Gross value-added. USD billions (2007)
N.B.: The agriculture sector is excluded from the analysis Source: Eurostat
Maximizing the potential in each sector

42 A Growth Agenda for Spain
Spanish companies must refocus their efforts on activities in which they can achieve strong differentiation based on dimensions other than price – mainly innovation and brand. In the case of subsectors already exposed to strong price competition, companies should strategically move towards higher value-added phases of the productive process value chain (i.e., design, marketing and specialized production). This will be best achieved by increased efforts and efficiency of investments in innovation, as proven by the success of some Spanish and foreign companies that have managed to add greater value to their products (See box, “Differentiation through innovation”).
DIFFERENTIATION THROUGH INNOVATION
The Cosentino group was incorporated in 1979, as a company of 17 workers engaged in the mining and
transformation of Blanco Macael marble, named for the town in Almeria where the quarry is located. The
Martínez-Cosentino Brothers chose not to concentrate on the least value-added portion of the value chain,
but rather took up a diversification strategy. They sought international expansion, extended their trade
activity to different parts of Spain and Europe during the 1980s, and launched R&D projects.
As part of its heavy investment in innovation, Cosentino undertook an ambitious project to construct a
revolutionary industrial plant. This plant began to manufacture Silestone® in 1990; since then the company
has experienced brilliant economic growth within Spain and internationally. These product innovation efforts
have been accompanied by development of a new distribution model, enabling further significant business
growth.
The group is currently the worldwide leader in the production of quartz surfaces, as well as one of the
leading Spanish companies in the marble, travertine and limestone sector. Almost 70 percent of its sales
comes from international markets. According to the North American magazine Time, Silestone® is one of
the seven technological products that will improve living quality in the 21st century.
Even though a large part of the effort must take place in the private sector, government economic policies play a vital role. Important initiatives for consideration are as follows.
• Improve the effectiveness of public investment in innovation, with greater participation by companies, creating a results-oriented culture in the public agencies; foster prioritization and concentration of government efforts to create a few innovation centres focused on well defined goals.
• Encourage universities to be more sensitive to society’s innovation needs: radically change the governance model of universities, to ensure budgetary autonomy; change the process by which deans are elected, so that it is by the academy as a whole rather than by internal pressure groups; reduce civil-service mind-set within the academy; introduce systems to assess research within universities by independent authorities such as in the U.K. system (Research Assessment Exercise); give the university real autonomy in recruiting and salary-setting of employees. These changes are possible and have been carried out recently in other countries such as Finland.
• Facilitate mobility of researchers between universities and business. Human capital is the key mechanism for the transfer of innovation, and increasing its mobility is essential. One mechanism in this field could be giving researchers the option of receiving temporary leave of absence to technology-based companies.

43
• Launch a plan to capture R&D and multinational companies. The existence of large technological companies in one region generates a halo effect that draws innovative companies around it. An example can be seen in Dresden, where companies like Infineon and AMD based their European headquarters in the 1990s: within 3 years, the number of companies in the area doubled, and patents submitted grew at an annual average of 41 percent (versus 12 percent during the previous years). A further example can be seen in Singapore: see box, “Singapore, leader in investment, attracting foreign multinationals”).
SINGAPORE, LEADER IN INVESTMENT, ATTRACTING FOREIGN MULTINATIONALS
Since 1965, Singapore has deployed a systematic plan to attract foreign direct investment (FDI) in high value-
added sectors. Actions are listed below.
• Creation of the Economic Development Board to attract FDI, with highly trained officers and a strong
results-oriented culture.
• Special 3-day programmes for potential investors organised by the EDB, including contact with
suppliers, agencies and other investors.
• The creation of a specific agency (International Enterprise) to support the export of products made in
Singapore.
• Emphasis on the leverage of non-monetary incentives: ease of in-country settlement, talent pool, etc.
• Strong incentives tied to long term positions in the country.
• Great flexibility when it comes to adapting the ‘incentives package’ to the needs of each multinational.
These measures helped Singapore attract foreign direct investment to a point where it became 17 percent of
GDP in 2007, ranked fourth globally, and second in Asia, only behind Hong Kong.
Foster the development of bigger and stronger companies Productivity levels in Spain’s manufacturing sector are 15 percent below those in the EU-15 and 40 percent below the United States. Some business practices are directly accountable for this gap: Spanish companies invest less in IT; they are less likely to subcontract activities to third parties, and even less likely to offshore to other countries; they also often ignore best practices within their industries regarding process optimization.
Many of these “bad practices” arise from the significant fragmentation of our business fabric (Exhibit 21).
Maximizing the potential in each sector

44 A Growth Agenda for Spain
Exhibit 21Fragmentation in Spanish business compared to Europe
Distribution of employees by size of company, millions of employees. 2007
N.B.: Data include a representative sample of mining and manufacturing companies. Source: Eurostat
It is noteworthy that large Spanish companies are equally productive as, or even more productive than, European companies of like size (Exhibit 22).
Exhibit 22Productivity levels based on size of manufacturing companies
GVA per employee. 2005
Source: Eurostat Structural Business Statistics; team analysis
N.B.: Data for Germany, Spain and the UK do not include all sectors. In particular, for Spain we have not included the furrier, coke gas, oil refinery and nuclear or chemical product sectors

45
Small Spanish companies likewise have productivity levels that are only slightly lower than those of small foreign companies. Spanish small companies, like small companies everywhere, are far less productive than large ones. The key difference for Spain is that its business fabric is constituted to a much greater degree of smaller rather than larger companies. This imbalance explains much of the productivity gap between Spain and the rest of Europe. If Spain maintained current productivity levels for each company size, but had a business-size fabric akin to Germany’s, Spain would outstrip its current productivity by 30 percent.
“With Germany’s company mix, Spain’s productivity would outstrip
its current levels by 30 percent”
Many of the previously proposed initiatives would have an indirect positive effect on business consolidation. Additional measures are described below.
• Promote SME consolidation: through drastic simplification of administrative procedures that hamper business growth; through education and increase of awareness of entrepreneurs of advantages of consolidation; and, given current challenges faced by the financial system, by promoting ICO (Official Credit Institution) credit lines targeted to M&A funding, with enough coverage of capital costs.
• Advance labour market reforms to simplify employee recruitment and facilitate risk-taking by expanding companies.
• Foster the creation of venture capital funds targeted at SMEs (see box, “Creation of venture capital funds in Israel”).
• Refocus the education system: to ensure availability of properly trained professionals to meet the industry needs; foster short-term degrees and enhance vocational training (in which Spain lags behind the U.S. and Europe; increase graduation rates).
CREATION OF VENTURE CAPITAL FUNDS IN ISRAEL
In 1996, Israel launched the YOZMA funds, targeting an overall investment of USB 100 million: USD 80
million to be distributed among 10 investment funds (USD 8 million each) focused on high-tech sectors, and
the remaining USD 20 million for additional investments. By limiting the number of funds to 10, interested
parties were forced to speed up procedures.
Setting up a YOZMA fund required compliance with a series of requirements: contribution of at least USD
12 million, investment in high-technology sectors and involvement of a foreign partner with experience and
knowledge. They were all managed through private initiative and had the right to purchase the State’s stake
at cost, thus motivating growth.
As a result, the Israeli government managed to generate a huge venture capital industry in Israel, which
grew at 55 percent per year between 1996 and 2002 (viz, multiplied by a factor of 14 during 6 years). Israel
is currently ranked second in the world with the most companies listed on the NASDAQ.
Maximizing the potential in each sector
46 A Growth Agenda for Spain
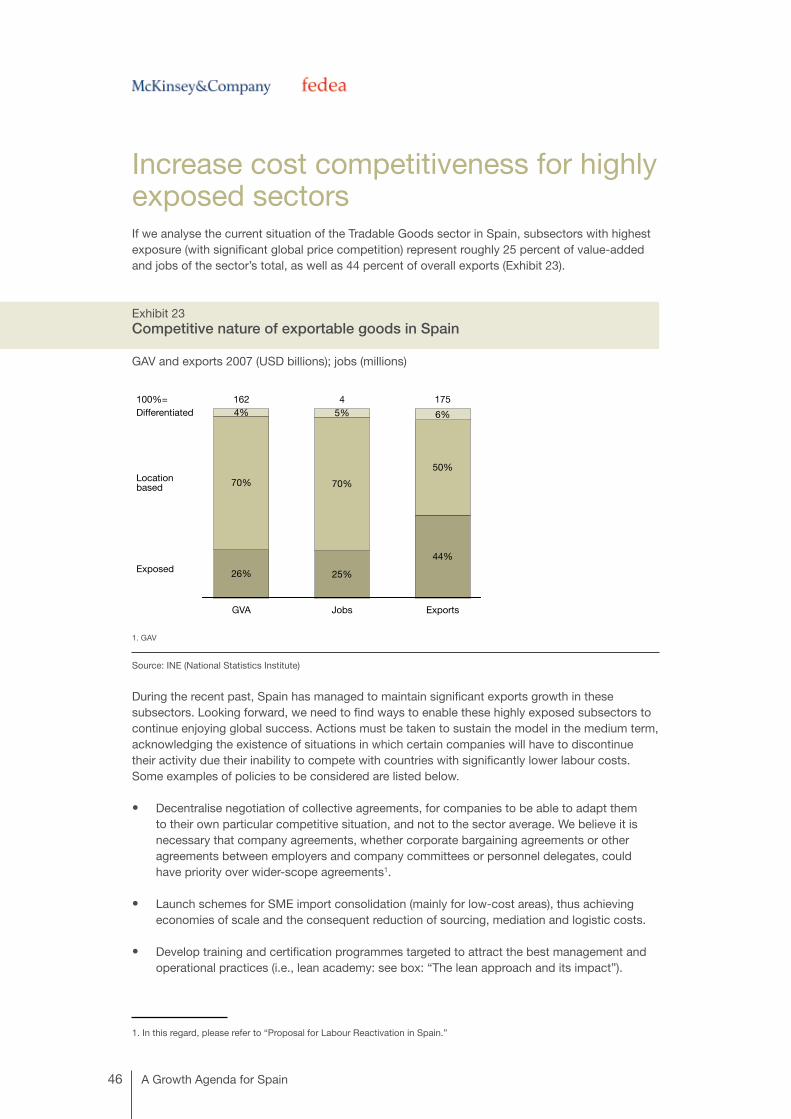
Increase cost competitiveness for highly exposed sectors If we analyse the current situation of the Tradable Goods sector in Spain, subsectors with highest exposure (with significant global price competition) represent roughly 25 percent of value-added and jobs of the sector’s total, as well as 44 percent of overall exports (Exhibit 23).
Exhibit 23Competitive nature of exportable goods in Spain
GAV and exports 2007 (USD billions); jobs (millions)
Source: INE (National Statistics Institute)
During the recent past, Spain has managed to maintain significant exports growth in these subsectors. Looking forward, we need to find ways to enable these highly exposed subsectors to continue enjoying global success. Actions must be taken to sustain the model in the medium term, acknowledging the existence of situations in which certain companies will have to discontinue their activity due their inability to compete with countries with significantly lower labour costs. Some examples of policies to be considered are listed below.
• Decentralise negotiation of collective agreements, for companies to be able to adapt them to their own particular competitive situation, and not to the sector average. We believe it is necessary that company agreements, whether corporate bargaining agreements or other agreements between employers and company committees or personnel delegates, could have priority over wider-scope agreements1.
• Launch schemes for SME import consolidation (mainly for low-cost areas), thus achieving economies of scale and the consequent reduction of sourcing, mediation and logistic costs.
• Develop training and certification programmes targeted to attract the best management and operational practices (i.e., lean academy: see box: “The lean approach and its impact”).
1. In this regard, please refer to “Proposal for Labour Reactivation in Spain.”
1. GAV

47
• Implement infrastructure plans focused on company competitiveness and specifically consider needs in goods transportation and implications of the evolution of energy costs.
THE LEAN APPROACH AND ITS IMPACT
The lean method was first developed by Toyota. Its principles have been adopted, developed and adapted
to be applied to a variety of activities – from logistics or R&D to manufacturing – and of sectors, whether
industry or services. It encompasses a series of techniques and tools to remove parts of processes which
add limited value, prevent variability, and improve flexibility of work methodology. It also drives radical
transformation in the way processes are organised, encouraging operators and managers to take the
initiative to drive ongoing improvement.
Lean deployment most often has a very significant impact on company productivity. In the aluminium
industry, for example, competitiveness is heavily based on efficiency of production. In one plant with
500 employees, a wide range of products and, therefore, of machinery and processes were deployed.
The resistance to change was high, but a lean process and organisation review, based on the proposed
methodology, led to a 37 percent increase in smelted tonnage per hour and a 34 percent increase in
the grinding process output. There was an additional 42 percent reduction in the volume of necessary
warehouse stock.
Potential improvement in productivity levels through the lean methodology is often sufficient to achieve a
substantial turnaround of global competitiveness of companies that adopt it.
Maximizing the potential in each sector


3.2Redefine Spain’s value proposition to maintain global Tourism leadership

50 A Growth Agenda for Spain
3.2 Redefine Spain’s value proposition to maintain global Tourism leadershipTourism is a strategic sector of the Spanish economy. Spain is a global leader in the tourist sector, behind only the United States and France in the number of tourists, and ahead of even France in terms of overall expenditure. Tourism directly generates 7-8 percent of total GDP and 6 percent of total jobs; it is indirectly responsible for many more jobs and added value. Tourism has twice or three times the impact on the Spanish economy as it does on the economies of other developed countries.
In recent decades, Spain has become especially attractive to foreign visitors. The World Economic Forum Travel and Competitiveness Index ranks Spain first in the quality of its cultural resources and tourist infrastructures – a reflection of the considerable public and private efforts made in recent years to support this sector. Spanish gastronomy has experienced an international renaissance and Spain’s restaurants are better than ever – some are even world renowned. Tens of millions of visitors each year choose from an unparalleled variety of cultural events, beaches, and magnificent heritage sites. There is no doubt that tourism has been a great success story of the Spanish economy in past decades.
Certain recent indicators within the Tourism sector are, however, worrying. While the overall number of tourists coming to Spain continues to increase, its share of international tourists during 2003-09 has fallen 1.5 percentage points, from 7.4 to 5.9 percent (Exhibit 24).
Exhibit 24Spanish share of all international tourists
Percentage
Source: World Tourism Organization, INE (National Statistics Institute)

51
The effects of this loss of share have been heightened by a decrease of 35 percent in actual tourist expenditure between 1995 and 2005. Figures for the sector’s productivity are also concerning, having fallen by 15 percent over the same period.
According to the World Economic Forum Travel and Competitiveness Index, Spain ranks low – 74th out of 133 – in the policy and regulatory climate in which the tourism sector operates. That is, Spain tends to have more regulations than many other tourist destinations. While some of the restrictions are mandated by the EU (e.g., visa regulation), others are particular to Spain, including the cost and time to open new businesses, the impact of FDI restrictions on businesses, and government transparency in putting policies into place. Other European countries such as France and Portugal highly over-perform Spain in these areas (Exhibit 25).
Exhibit 25Valuation of the tourist sector in some European powers
Position in the Travel & Tourism Competitiveness ranking out of 133 countries 2008
Source: World Economic Forum
Maximizing the potential in each sector
Dimension
A. T&T regulatory framework Spain France Italy Portugal Croatia
Policy rules and regulations 74 25 71 29 80
Environmental sustainability 31 4 51 18 39
Safety and security 66 55 82 22 42
Health and hygiene 35 9 27 32 33
Prioritization of Travel & Tourism 4 21 51 26 64
B. T&T Business environment
Air transport infrastructure 10 5 27 38 69
Ground transport infrastructure 20 3 40 26 54
Tourism infrastructure 1 14 3 11 6
ICT infrastructure 31 19 25 34 38
Price competitiveness in the T&T industry and infrastructure 96 132 130 99 103
C. T&T human, cultural, and natural resources
Human resources 31 23 41 34 53
Affinity for Travel & Tourism 48 55 71 39 9
Natural resources 30 39 90 86 69
Cultural resources 1 7 5 12 41

52 A Growth Agenda for Spain
Develope a new value proposition for high-end tourism in Spain For Spain to regain its share of international tourism, a turnaround is needed in which the government plays a very strong role in overcoming the challenges (Exhibit 26).
Exhibit 26Two levers with which to develop the tourist sector
Challenge Priorities Specific actions
Evolution of needs and preferences of tourists coming from traditional markets
Develop a new value proposition for high-end tourism in Spain
•Develop a coordinated vision and leadership in the definition of a new integral value proposition
• Articulate the deployment of a more powerfull marketing and distribution model
• Foster the use of new technologies for distribution•Coordinate the deployment of key infrastructure that ensures the new
proposal•Guarantee procedures that enable the quick incorporation and evolution of
companies
Under-penetration of certain high growth markets
Increase penetration in growth markets
•Develop coordinated campaigns for the promotion of Spanish tourism and its value proposition
• Ease visas, rules and regulations, ensuring processes comparable to the other European countries
• Launch proactive connections with some key countries with strong growth potential

53
A large part of the decline experienced by Spain in international tourists since 2003 has been caused by changes in the behaviour of European tourists, who represent the base of our sector. Visitors from countries like the UK and Germany, which jointly source almost half of all tourists that visit Spain, are increasing their range of destinations, to the detriment of their former ones.
In order to remain a priority destination for European tourists, Spain needs to adapt to their emerging needs. The European population is ageing, for example. In the coming decades over half of this population will be over the age of 55, the age group that travels the most. To help reposition itself to serve this burgeoning group, the Tourism sector could offer a tailored value proposition coordinated with other sectors (such as Health). Other segments of the European population should also be considered for special appeals, such as sports-minded or “green” tourists. Those interested in culture and history, furthermore, can be attracted by campaigns giving greater prominence to our cultural heritage and the creation of tourist circuits that focus more on the treasures of inland Spain. The national and local governments should act to align incentives between different sector agents, such as municipalities or private players from the hostelry sector.
The business community will be responsible for taking on this new value proposition. New businesses will need to cover emerging needs currently not addressed by existing players. Companies will also have to be more flexible in evolving towards this new proposal. It will require consolidation by sector companies, currently extremely fragmented: the size of the average company in the Spanish Tourism sector is relatively small, barely reaching one-third of the European average in terms of employees.
Administrations must therefore make additional efforts to promote initiatives that enable coordination of the different players, for example:
• Develop a coordinated vision and leadership to motivate sector agents in the definition of a new integral value proposition towards greater-value Tourism.
• Articulate the deployment of a more powerful marketing and distribution model for Spain’s Tourism sector, and encourage wholesalers to participate in our new value proposition. Leading travel agents and tour operators in each country can be encouraged to include the Spanish tourism offer with the appropriate message and tone of the new proposal (thus preventing each distributor from promoting a different Spain).
• Encourage the use of new technologies for the distribution of tourist services, such as reservation switchboards for rural tourism.
• Coordinate the deployment of key infrastructure that ensures the new proposal. For example, stimulating demand for the older-aged tourist group:
– Endorse an agreement with the European Union that guarantees a suitable price for the provision of social services to tourists.
– Establish agreements between public and private sectors to develop areas targeted at the older-aged tourist group, in which services they need are guaranteed (e.g., rapid and convenient access to healthcare and private services).
– Ensure the availability of skilled professionals to serve the new demand with the required services (e.g., language ability). In particular, health care services should be one of the sectors that most benefits from and contributes to this tourism model; the study ‘Driving a possible change in the health system’, published in 2009 by Fedea-McKinsey, reveals that within 10 years there could be a shortfall of between 10,000 and 20,000 physicians in Spain.
Maximizing the potential in each sector

54 A Growth Agenda for Spain
• Guarantee procedures that enable the quick incorporation and evolution of companies in the sector, promoting the development of entrepreneurship that enriches the new value proposition (see box, “A tourism development plan for Bali”).
A TOURISM DEVELOPMENT PLAN FOR BALI
In the 1970s, Bali experienced enormous growth in high-value Tourism, supported by strong development
of national infrastructures and a master plan funded by the UNDP (United Nations Development Program),
executed by the World Bank. This growth was ratified during the 1980s, promoted by government
deregulation of air traffic.
By the end of the decade, however, problems related to this growth began to emerge. Not only did the
expenditure per tourist gradually begin to fall, due to the arrival of younger tourists more inclined to saving,
but also the island inhabitants began to resent encroachments on the natural habitat made by masses of
arriving tourists and most evident in the form of pollution and beach erosion.
To solve these problems, the government intervened with a new sector strategy, comprising initiatives
to control excessive tourist growth, and prevent environmental destruction, diversify tourist destinations
by providing new zones with a better tourist infrastructure, and stimulate investment by offering property
for private businesses properties to lease. Information on tourists was gathered through the National Bali
Tourism agency, to develop and promote the most interesting tourist itineraries; the Indonesian Association
of Tourist Resorts was founded to ensure the quality of Bali’s resorts.
These interventions, taken in the period 1991-96, reduced the adverse environmental impact of tourism
while actually increasing the rate of tourist arrivals by 3 percent between 1996 and 2006. Furthermore, the
great majority of the new arrivals were served by four- and five-star hotels, so the gains were mostly of very
high value.

55
Increase penetration in growth markets An important part of global tourism growth will come from people who have not traditionally chosen Spain as their preferred destination, and therefore Spain is at risk of losing market share. The World Tourism Organization forecasts that 65 percent of worldwide tourism growth will come from Asia-Pacific and the Americas (Exhibit 27). Spain now attracts barely 1 percent of these tourists. Moreover, a large part of the growth in European growth will be come from Eastern countries, where Spain also has a limited share.
Exhibit 27Origin of international tourists
Billions of tourists
Source: World Tourism Organization, INE (National Statistics Institute)
“For every Asian tourist that travels to Spain, 15 go to France
and 8 go to Germany”
A difficult aspiration for Spain will be to attract tourists from Asia in the numbers seen by neighbouring countries: for each Asian tourist that travels to Spain, 15 travel to France and 8 to Germany (Exhibit 28).
Maximizing the potential in each sector

56 A Growth Agenda for Spain
Exhibit 28 Arrival of tourists from Asia and United States to the main European destinations
Millions of tourists per destination
Source: World Tourism Organization, INE (National Statistics Institute)
US tourists also visit France, Germany or Italy in greater numbers – more than twice as often they visit Spain. In fact, EU visa requirements to some countries make European travel more difficult: Turkey, for example, receives many times more Russian tourists than European countries like Spain, Italy, and the UK. Spain needs therefore to pursue the huge development potential in attracting tourists from areas outside Western Europe. Initiatives that would help achieve this goal are described below.
• Develop coordinated campaigns to promote Spanish tourism and its value proposition.
• Ease visas, rules and regulations, ensuring processes comparable to other European countries with the same EU restrictions, simplifying visa forms and speeding up processes.
• Launch proactive connections with some key countries with strong growth potential, making sure that successful tour operators include Spain as a preferential destination (see box: “Attracting tourists from Asia: the success of a German tour operator”).

57
ATTRACTING TOURISTS FROM ASIA: THE SUCCESS OF A GERMAN TOUR OPERATOR
In 1993 Mang Chen, a student of Chinese nationality at Hamburg University in Germany, founded Caissa
Touristic, which he developed into a company offering a wide variety of individual or group tours to
Germany.
Ten years out, Caissa Touristic had 300 employees and drew 50,000 Chinese tourists every year to
Germany, a number equal to one-fifth all tourists from Asia that come to Spain each year. A large part of
the company’s success lies in its ability to create products adapted to the interests and needs of Chinese
tourists.
Maximizing the potential in each sector


3.3Increase productivity of Local Services

60 A Growth Agenda for Spain
3.3 Increase productivity of Local Services The Local Services sector, comprising services with a large domestic component, includes retail and wholesale distribution financial services, and domestic, personal, and social services. It represents one of the most heterogeneous sector groupings in composition, and has major relevance in all modern economies. In Spain the sector accounts for almost one-quarter of total value added and one-third of all jobs. Productivity, however, is almost 20 percent lower than the European average and 35 percent below North American levels.
As revealed in a recent report by the McKinsey Global Institute, Local Services are the main cause of the growing productivity difference between the US and Europe. This difference becomes obvious when taking a deeper look at the dynamics of the sector: both regions have incorporated productive factors (work and capital) at similar rates, but other variables such as smaller economies of scale, a wide range of regulatory barriers and a limited entrepreneurial spirit have increased the gap in value added and, therefore, prevents demand stimulation. For this reason not only Spain but the whole of Europe face a huge challenge in Local Services.
“Not only Spain but the whole of Europe face a huge challenge in Local Services.”
In spite of the wide range of services included in the Local Services sector, the strong orientation towards domestic demand and end-consumers (as opposed to companies) have led us to review it as an aggregate. To achieve the set of aspirations laid out in previous chapters, it will be necessary to address problems inherent to each service in depth. Europe for example, lags behind the US in wholesale services’ productivity, due to the presence in the US of greater process automation, a concentration on higher-value products, the optimization of processes, and the promotion of consolidation. Yet these wholesale services advantages do not align with or carry over to financial services, where Spain is more productive than the US. Nevertheless a significant number of problems are common to all these services that must be overcome to proceed with the consolidation and modernisation of the sector.
To illustrate the potential type of policies required in this sector we have used retail trade, the largest subsector and of huge relevance for the Spanish economy. The relevance of retail trade comes from its size: it creates 5 percent of the overall value added and 10 percent of all jobs; any productivity improvement in retail, furthermore, has an obvious effect on the rest of the economy. Because of the intensity of competition, a productivity improvement usually leads to lower prices for consumers. The surplus in discretionary spending thereby created is usually applied to further consumption of other services or products. More productive retail trade drives growth of other key sectors, such as the manufacturing industry and logistic services, as well as increases in productivity and therefore competitiveness within these services. Last, greater retail trade productivity enables retail trade companies to grow and evolve, stimulating demand for Business Services like IT.

61
Spain has lower productivity in retail trade than do other developed economies – the gap with Italy, France, the UK, Germany, and the US is between 10 and 40 percent. As observed in other sectors, however, averages hide significant differences in performance between companies. Exhibit 29 shows that in 2008 (i.e., before the recent crisis) almost 30 percent of store area targeted to groceries belonged to companies with profitability levels below 1 percent. In more efficient markets, pressure from really profitable companies forces less profitable ones to take measures to improve their situation or exit the market and thus improve overall sector productivity.
Exhibit 29Distribution of the sales area in the foodstuffs sector in Spain based on profitability
Margin of EBTI 2008
Source: Sabi, Alimarket
Maximizing the potential in each sector
62 A Growth Agenda for Spain
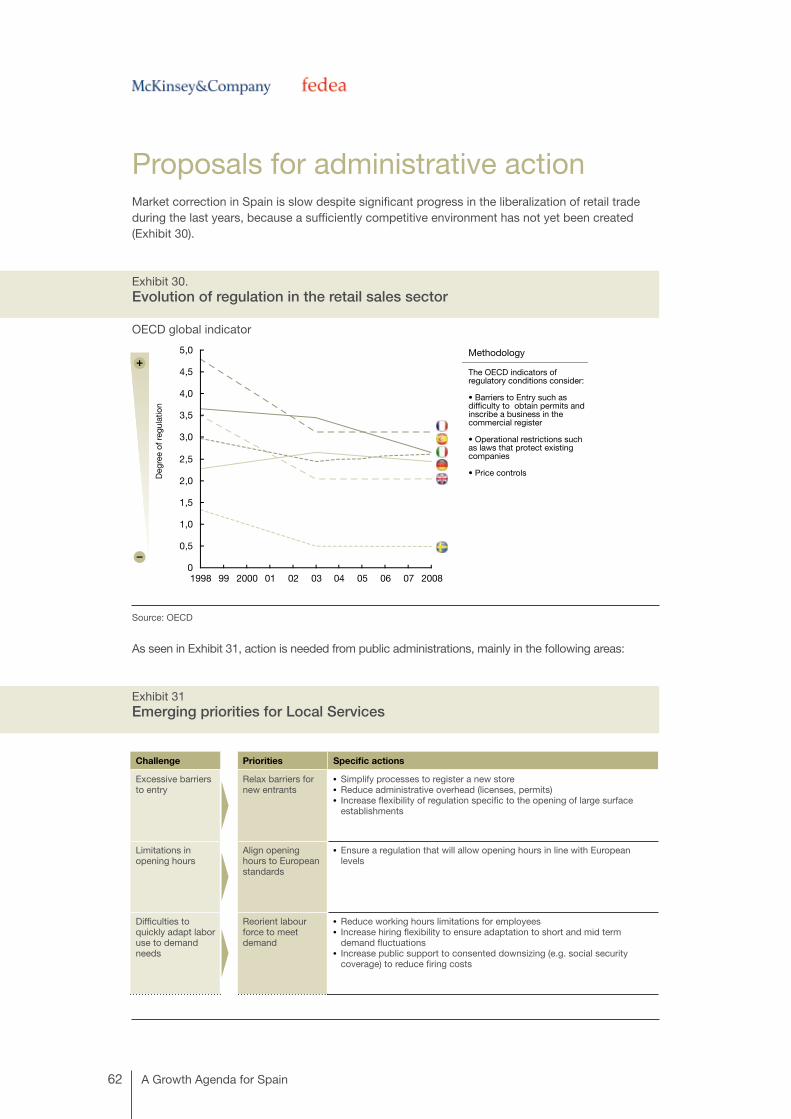
Proposals for administrative actionMarket correction in Spain is slow despite significant progress in the liberalization of retail trade during the last years, because a sufficiently competitive environment has not yet been created (Exhibit 30).
Exhibit 30.Evolution of regulation in the retail sales sector
OECD global indicator
Source: OECD
As seen in Exhibit 31, action is needed from public administrations, mainly in the following areas:
Exhibit 31Emerging priorities for Local Services
Challenge Priorities Specific actions
Excessive barriers to entry
Relax barriers for new entrants
• Simplify processes to register a new store• Reduce administrative overhead (licenses, permits)• Increase flexibility of regulation specific to the opening of large surface
establishments
Limitations in opening hours
Align opening hours to European standards
• Ensure a regulation that will allow opening hours in line with European levels
Difficulties to quickly adapt labor use to demand needs
Reorient labour force to meet demand
• Reduce working hours limitations for employees• Increase hiring flexibility to ensure adaptation to short and mid term
demand fluctuations• Increase public support to consented downsizing (e.g. social security
coverage) to reduce firing costs

63
Relax barriers for new entrants
According to the OECD, Spain is one of the most restrictive of the modern economies, when considering factors such as registration requirements for new business premises, licences or permits, and specific regulations for large establishments. In Sweden, the UK, Holland, France, Finland or United States, a new establishment need not be entered in a trade registry; in other countries it may be obligatory, but the registry response times are significantly better: in Hungary and Poland an answer is mandatory within 30 days of the registry, while in Spain official response might take up to 90 days.
Align opening hours to European standards
Further regulations restrict demand in this sector, such as limitations on opening hours. While countries like the USA, Sweden, UK, France, and Germany have removed most limits, Spain remains at the bottom of the curve, with a maximum of 72 hours per week allowed in most Autonomous Communities (Exhibit 32). Easing this restriction would also stimulate the use of part-time contracts, currently underused in Spain when compared to European standards.
Exhibit 32Limit on opening times for retail sales
Hours per week
Source: Planet retail
Maximizing the potential in each sector
1 Spain has a minimum limit of 72 hours per week. There is, however, certain flexibility in some regions (specifically in five Autonomous Communities) where this limit has been extended to 90 hours per week

64 A Growth Agenda for Spain
Reorient labour force to meet demand
The retail trade sector presents significant variations in demand and workload, not only through the year, but also on a monthly, weekly, and even daily basis.
“According to the World Bank, Spain ranks 157th out of 183 in flexibility to recruit and let go employees”
According to the World Bank, Spain currently ranks 157th out of 183 in the flexibility to recruit and let go employees, far from the UK’s rank (35), Ireland’s (27), or the USA’s (4). Labour flexibility and employment are strongly correlated in the main European countries and the United States. Countries with greater labour flexibility (USA, Ireland and the UK), create more jobs than countries with strong regulatory limitations. Strict Spanish labour regulation is an obstacle for companies, which might have recruited more employees in a more flexible market (See box, “Development of retail trade in Sweden”).
DEVELOPMENT OF RETAIL TRADE IN SWEDEN
Retail trade in Sweden had the highest growth rate in Europe between 1995 and 2005, with productivity 15
percent higher than US levels. The transformative growth began in the 1990s with an increase of regulatory
flexibility, especially as it affected the opening of new business premises. Regional differences in the power
of local councils were also reduced at this time.
As a result, store size doubled between 1990 and 2000. Swedish stores became larger and more numerous,
and business developed very quickly. Through consolidation large chains like IKEA and H&M were created,
which exploited significant advantages in scale of sourcing, logistics, business premises management, and
marketing. Discounting formats and new sales channels, such as the Internet, appeared and competition
intensified. The growing trend of proprietary brands increased the profitability of some companies, which
have vertically integrated part of the supply chain, removing fairly unproductive processes such as the sales
forces in manufacturing companies. Last, better use of ICTs in Sweden significantly increased the efficiency
of logistics and inventory management.

65
As emphasised above, the characteristics of each subsector (retail, wholesale, personal services, etc.) are different. Nevertheless, the levers we have illustrated using the example of the retail sector – the reduction of barriers to entry, the deregulation of opening hours, and the increase of labour flexibility – are broadly applicable to all Local Services and should become the basis of policies for all of the sector. Additionally, different subsectors may require specific policies to cover distinct specific needs. In particular, as describer later, the financial sub-sector will require a differentiated approach.
Maximizing the potential in each sector


3.4Encourage growth in Business Services

68 A Growth Agenda for Spain
3.4 Encourage growth in Business ServicesBusiness Services comprise the different services targeted mainly to cover needs of companies in all sectors. They are sometimes called “B2B” or “Business to Business” Services. They are activities that usually require a certain degree of specialisation that falls outside the main productive processes of these sectors and are therefore, likely targets for outsourcing. While not constituting the core capabilities of the companies that rely on them, Business Services is a key factor in the proper performance and development of all sectors. They include technology and computer services, which account for roughly 25 percent of the total (European average), as well as professional services (Exhibit 33).
Exhibit 33Distribution of activities included in Business Services
Per capita GVA, thousands of euros. 2007
Source: Eurostat
The professional services subsector accounts for the other 75 percent of Business Services and can be broken into four large groups: 1) legal, auditing, consulting, and accounting, representing the largest share of Business Services (40 percent); 2) architecture and engineering (15 percent); 3) advertising (5 percent); and 4) human resources (15 percent).
According to our estimates, Business Services likely has the largest development potential in Spanish economy, both in terms of jobs and wealth. Of all Spain’s sectors (except Construction, which is a special case), Business Services lags furthest behind in a comparison with Europe or the US (in terms of the contribution each sector made to the generation of value-added during the 1995-2005 period) (Exhibit 34). The contribution of Business Services to the economy accounts for almost half the overall value-added gap with Europe or the US. In the United States, the contribution of services to the total GDP (including public services) has increased 20 percentage points since 1947 and has accounted for 81 percent of the total growth. This growth has been largely the result of proportional increases in the weight of the financial and real estate subsectors (9.6 percentage points) and Business Services (8.9 points, mainly in legal, accounting, engineering, advertising, IT and administrative management services).
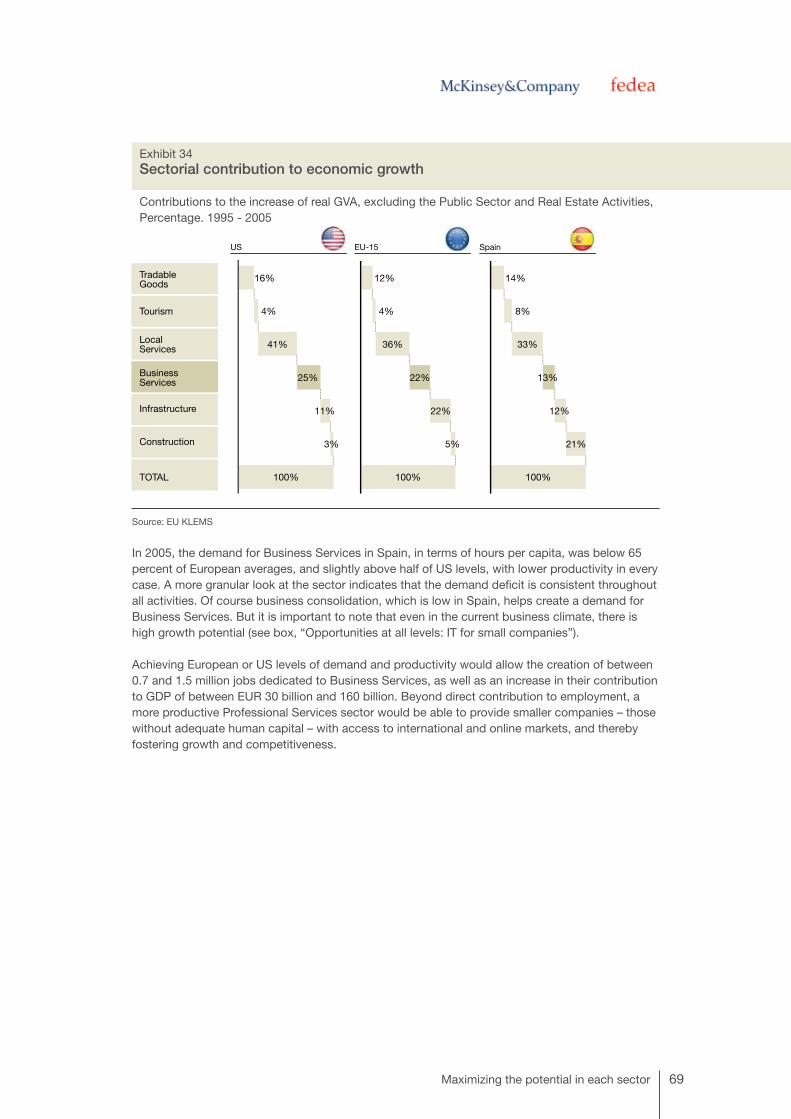
69
Exhibit 34Sectorial contribution to economic growth
Contributions to the increase of real GVA, excluding the Public Sector and Real Estate Activities, Percentage. 1995 - 2005
Source: EU KLEMS
In 2005, the demand for Business Services in Spain, in terms of hours per capita, was below 65 percent of European averages, and slightly above half of US levels, with lower productivity in every case. A more granular look at the sector indicates that the demand deficit is consistent throughout all activities. Of course business consolidation, which is low in Spain, helps create a demand for Business Services. But it is important to note that even in the current business climate, there is high growth potential (see box, “Opportunities at all levels: IT for small companies”).
Achieving European or US levels of demand and productivity would allow the creation of between 0.7 and 1.5 million jobs dedicated to Business Services, as well as an increase in their contribution to GDP of between EUR 30 billion and 160 billion. Beyond direct contribution to employment, a more productive Professional Services sector would be able to provide smaller companies – those without adequate human capital – with access to international and online markets, and thereby fostering growth and competitiveness.
Maximizing the potential in each sector

70 A Growth Agenda for Spain
OPPORTUNITIES AT ALL LEVELS: IT FOR SMALL COMPANIES
A company considering deployment of online trading capabilities must consider a series of IT
developments: design and implementation of a web page, online launch through search engines,
aggregators, etc. Should the company want also to receive online orders, the complexity of the project
increases: forms, payment gateways, connection to a back-office platform, etc. New online communication
and distribution models also require a large set of new capabilities in data mining and measurement, which
very often require in turn the participation of highly skilled specialists. Online marketing, in other words,
requires capabilities beyond those possessed by the average Spanish company – especially smaller ones.
In developed countries, a web presence is a sine qua non of doing business, even for very small companies
(companies with less than 10 employees), which are so abundant in Spain.
According to sector sources, only 11 percent of small Spanish companies have a web page, while the
European average is three times that. Should our small companies reach European levels of web page
demand, up to 50,000 new jobs might be created – skilled jobs that would contribute to the ambitious
opportunity identified in B2B.
The outlook for Spanish Business Services is extremely bright. In addition to their huge potential for growth, they are also inherently exportable, a factor which points to highly sustainable future growth. In the past decade in Spain a very positive trend has been observed: global market share has gone up by one-half of a percentage point, from 2.8 percent in 2000 to 3.3 percent in 2007 (Exhibit 35).
Exhibit 35The evolution of worldwide exports of Business Services
Nominal exports, billions of euros
Source: World Trade Organization, OECD

71
Half of this growth has come from IT (for which foreign customers account for 22 percent of total sales) and one-quarter from architecture and engineering. These technical services have been the strongest contributors to the growth of Spanish exportsduring recent years: nominal sales to foreign customers have grown 38 percent year-on-year between 2004 and 2007, which contrasts with the 18 percent growth of domestic sales. International revenue already accounts for 11 percent of the total. Other subsectors, such as legal services, have also performed well in recent years. They still have little international presence compared with other countries, however. In Spain, 4 percent of legal services revenue comes from foreign customers, while in countries like Germany, the UK, and Finland, between 12 and 25 percent of their legal sales are for export. In summary, despite Spain’s healthy exports trend, large opportunities remain for international growth in the short-term. To a great extent, productivity improvements and sector development will contribute to further increases in exports (Exhibit 36).
Exhibit 36Correlation between exports and productivity in Business Services
Source: EU KLEMS, OECD
Achieving appropriate development in the remaining sectors is vital in order to capture the exports opportunity. Here too a key barrier to the achievement of demand levels commensurate with an economy the size of Spain’s is the highly fragmented Spanish business fabric. Since Spain has a higher proportion of smaller companies than has the rest of Europe, relatively infrequent use is made of Business Services, given scale requirements.
In light of these considerations, the Spanish government needs to identify specific initiatives to accelerate the development of the sector in the short term (Exhibit 37).
Maximizing the potential in each sector

72 A Growth Agenda for Spain
Exhibit 37Three priorities to develop Business Services
Reform regulation to facilitate business dynamics and competition
Adequate regulation will promote competition and be a key driver for productivity improvement (Exhibit 38)1.
Exhibit 38Correlation between regulations and productivity in Business Services
Source: EU KLEMS, Eurostat
1. There are already national and regional initiatives such as the “one stop” window; the Regional Government of Extremadura offers empresa24h.com.
1 Calculated as the average index for 2003 and 2008
Challenge Priorities Specific actions
Excessive regulation and high degree of unawareness on the demand side
Reform regulation to facilitate business dynamics and competition
• Simplify existing regulation, by simultaneously simplifying processes to access these services and establishing quality standards
• Reduce barriers to entry by developing mid/ long term goals to reduce hurdles to launch new commercial activities
Fragmented tissue and excessive bureaucracy
Catalyze the development of an efficient market
• Promote the existence of standards or certifications• Foster the existence of trade agreements• Support and even promote the use of Business Services • Stimulate the consolidation of SMEs •Create a SME support agency to concentrate key support activities
Well trained talent but with a lack of entrepreneurial mindset
Encourage more entrepreneurial talent
• Promote an entrepreneurial mindset and business training from basic education to university
• Ensure global talent sourcing for strategic capabilities

73
Spain has made great progress regarding regulatory flexibility for Business Services, but we still have a long way to go to reach the levels of the United States, United Kingdom, Sweden, Finland, Holland, or Denmark2. The impact of the barriers can be seen when we look at specific activities in more detail. For example, in Spain notary services represent almost 40 percent of total sales of legal services, while in other countries like Germany the share barely reaches 15 percent. In the UK, Sweden, or Finland, notary services account for only 1 percent or so. In these countries most legal services sales involve legal representation or consulting and intellectual property protection. Another area where regulation reform is needed is in lifting bureaucratic barriers for the creation and administration of new companies. In Spain these barriers are much more formidable than in other countries. According to the World Bank, Spain ranks 147th out of 183 countries around the world in process complexity to set up a business. This means that, together with Greece (149), Spain is at the bottom of the OECD and far from the level of developed economies such as Canada (3), the United States (9), the United Kingdom (17), or France (26). There is room for improvement in current regulation, and specific initiatives can contribute to improve sector productivity in the short term:
• Simplify Spanish regulation for Business Services, by simultaneously simplifying processes for gaining access to these services and establishing quality standards.
• Develop short- and medium-term targets for barrier reduction for commercial activities, in particular for launching new businesses. It would help, for example, to reduce the number, cost, and timelines of procedures all by half. (See box, “Comparison of launching a business in New Zealand and Spain”).
COMPARISON OF LAUNCHING A BUSINESS IN NEW ZEALAND AND IN SPAIN
The bureaucratic and administrative hurdles to launch a company in Spain (a limited liability partnership
based in Madrid) are formidable. The process averages no less than 47 days, assuming it is followed correctly
at every step and execution is optimised; it costs an average of EUR 3,365 and requires 10 procedures.
Conversely, in New Zealand, a country conforming to global best practice in this area, a comparable company
can be launched in a single day and costs less than EUR 100: one single procedure and one single day.
Meanwhile back in Madrid we have only begun our effort. The procedure will require: obtaining authorisation
of the company name at the Trade Registry, presenting a certificate that demonstrates the deposit of the
share capital in the bank, obtaining public documentation with detailed information on the company under
the supervision of a notary, submitting the census declaration of business commencement and obtaining
the tax ID number from the Provincial Delegation of the Tax Authorities, paying taxes on Property Transfer
and Stamp of Duty to the local tax authority (EUR 2,223), presenting the public write-up at the Business
Register, authenticating the company books (15 days), obtaining the municipal opening license from the Town
Planning Department of the Local Council (38 days and EUR 406), registering all workers in the Social Security
Department and finally notifying the Provincial Delegation of the Regional Ministry of Work and Business.
In New Zealand the whole thing can be done online by visiting the New Zealand Companies Office web
page (www.companies.govt.nz). That same day, and after paying less than 160 New Zealand dollars
with a credit card or bank transfer, it is possible to launch the new company without having to visit any
government agency...
2. According to the OECD index that measures regulatory rigidity; the index varies from 0 to 6, with the highest score for the most flexible regulations.
Maximizing the potential in each sector

74 A Growth Agenda for Spain
Catalyze the development of an efficient market
Creating an appropriate environment for the development of demand for Business Services cannot be reduced to making regulation more flexible. Spanish companies are not sufficiently aware of Business Services, partly because these are scarce in Spain, or very new. This translates in potential customers being unaware of the kind of services available, how to gain access to them and the value they provide.
Companies offering Business Services need to inform and convince customers of the benefits of such activities. The government must also act, especially by launching specific initiatives to create a healthier ecosystem for Business Services. Some of these would be:
• Promote the existence of standards or certifications, generating confidence in clients and users, favouring business dynamics, and ensuring service quality.
• Foster the existence of trade agreements, for example promoting online business-to-business services between companies, especially small and medium-sized enterprises (SMEs).
• Support and even promote the use of these services, making administrations active consumers of these services, particularly when early demand is needed to get things going.
• Stimulate the consolidation of SMEs, defining tax incentives for mergers and capital increases for SMEs, reducing integration costs (and avoiding perverse tax incentives for small companies such as tax fraud impunity), etc.
• Create a support agency for small and medium-sized enterprises, based on Britain’s Small Business Services agency or Luxembourg’s central SME bank. This will concentrate key SME support activities for critical phases, invigorating and increasing demand through easing company creation, managing tax allowances, etc.

75
Encourage more entrepreneurial talent
Among Spain’s strengths are its university graduates. It has more among its active population than the European average, and they furthermore cost less to employ. Spain must build on this strength in order to develop the Business Services sector.
The level of technical proficiency among specialist graduates in Spain is high, but they have been prevented from becoming a real source of innovation and entrepreneurship because of insufficient preparation in business. Only 53 percent of Spanish entrepreneurs have a university degree, for example, a level far below that of the United States (72 percent).
The problem of lack of business preparation redounds through many sectors of our economy, but its effect in the Business Services sector is all the greater, since this sector has such a high potential for growth in Spain. Some specific initiatives to drive the increase of an entrepreneurial mindset in the Spanish talent pool could include:
• Promote an entrepreneurial mindset and business training from basic to higher education. Many developed countries have launched programmes to develop both business attitude and aptitude at all education levels. In Spain legislation needs to be modified to facilitate the creation of connections between the academic world and the private implementation of ideas.
• Ensure global talent sourcing for strategic capabilities. Given the existing deficit of key profiles that combine technical skills and entrepreneurial mentality, selectively capturing international talent may be an important lever to boost quality and quantity of innovative projects launched and developed in Spain. The preeminent model is the Silicon Valley, a world-class technological cluster that prides itself on its ability to attract international talent, as demonstrated by the fact that 60 percent of its population is not American (versus 10 percent foreign population in the US overall).
Maximizing the potential in each sector


3.5Ensure Spain’s infrastructure supports growth

78 A Growth Agenda for Spain
3.5 Ensure Spain’s infrastructure supports growth Competitive and productive infrastructures are essential for achieving appropriate productivity levels throughout the economy. The quality of infrastructures has a significant impact on the performance and competitiveness of other sectors, in terms of both cost and quality. In the petrochemical industry, logistical costs account for 16 percent of overall costs, and they account for 5 percent in the car manufacturing sector, which is very important to the Spanish economy (Exhibit 39).
Exhibit 39 Weight of logistical costs on some exportable sectors
Average percentage of sales. 2007
Source: Transportation Excellence Team
1 All additional costs related to planning the supply chain and administration 2 Cost of transporting goods both for sending as well as receiving 3 Fixed and variable warehousing cost 4. Fast Moving Consumer Goods
4

79
Energy costs affect all sectors (Exhibit 40), accounting, for example, for 20 percent of all costs in the chemical industry and 8 percent in the iron and steel industry.
Exhibit 40Energy as a share of overall costs in manufacturing
Manufacturing excluding coke gas and refineries, percentage. 2005
Source: EU KLEMS
The Infrastructure sector can be counted as a source of strength for Spain. The sector has become much more competitive in recent years, through the lowering of regulatory barriers (Exhibit 41).
Exhibit 41Evolution of regulation in the infrastructure sector
OECD global indicator (Range between 0 and 6, a higher score represents the stricter degree of regulation)
Source: OECD
Maximizing the potential in each sector

80 A Growth Agenda for Spain
Strong investment in recent years has put Infrastructure in Spain at levels commensurate with other advanced European countries. In specific subsectors, including telecommunications, electricity production and distribution, and gas and water processing and distribution, Spain is a leader in productivity and demand.
Spain needs to guarantee that Infrastructure continues to be productive and supportive of business competitiveness. There are remaining challenges in the Infrastructure sector, which must be addressed as priorities to ensure that the sectors it supports are not hindered and sustainable growth is achieved. Imbalances in the electricity sector need to be corrected along with deficits in logistics, particularly in freight rail transport. Improved infrastructure could also help improve the Spanish balance of payments, through the development of strategic harbours and airports as international hubs connecting Europe, Asia, the Americas, and Africa.
Reform the electricity sector
Spain has levels above European averages in the production and distribution of electricity, gas and water; productivity levels are almost 30 percent higher. In some subsectors, such as renewable energy, Spain has become a global leader, both through the development of these energies in our economy and through the preeminent role of Spanish companies worldwide.
Given its pre-existing forward position, the Spanish energy sector presents limited capacity for additional growth. Its contribution to the new model will be in sustaining its efficient and reliable coverage of the nation’s energy needs at a competitive cost, while reaching European environmental targets.
While Spain has become a pioneer in developing renewable energy, large deficits have been incurred in the process. Spanish consumers receive electricity at prices comparable to those of other European countries (Exhibit 42); behind these price levels, however, is a considerable gap between the system’s revenues and costs. This “tariff deficit” was already EUR 20 billion at the end of 2009 (Exhibit 43). Additionally, the current fuel mix may not be sustainable from a supply perspective: current thermal plants – critical for renewables backup– are not be economically viable at current utilization rates..

81
Exhibit 42Price of electricity based on consumer
Indexed price of industrial consumer, 100 = 2001 Price of Kwhr for industrial consumers (including taxes) based on the level of demand, EUR/ Kwhr, 2010-S1s
Source: Eurostat
Exhibit 43Revenue and costs of the Spanish electricity system
Millions of Euros
Source: CNE (National Energy Council); team analysis
Maximizing the potential in each sector
Includes the deficit prior to 2005

82 A Growth Agenda for Spain
Significant reform of the electric system, with a medium term outlook, is therefore needed to correct these imbalances. Action should be taken on the following fronts:
• Reduce system costs by promoting energy efficiency.
• Optimize the fuel mix, creating a rationalization plan for the further development of renewables. This means that future targets must be adjusted and the renewables mix revised to limit the weight of the most expensive alternatives; furthermore, utilization of existing assets should be maximized, including the life extension of nuclear power plants.
• Increase the weight of capacity payments to ensure incentives for the deployment of firm capacity (mainly thermal), taking into account the high volatility of renewables in the fuel mix.
Strengthen freight rail transport
Freight rail transport presents great opportunities for expansion and enhancement in Spain. Rail freight volumes have remained virtually constant over the last 20 years, and currently correspond to around 4 percent of total freight transported in Spain, while the European average is around 18 percent, with Germany a little ahead (22 percent) and France a bit behind (15 percent). This kind of transport is usually more efficient than other alternatives. While rail freight transport has been deregulated, competition has not yet sparked the development of the subsector, and will require further investments to achieve the adequate development and efficiencies.
Encourage infrastructure companies to adopt an outward orientation
Spain’s a geographical and political position should ensure its continuing role as the natural connection point between Europe and other continents, mainly the Americas and Africa. Transport services have become an important source of ‘exports’ for the Spanish economy (Exhibit 44).

83
Exhibit 44.Spanish exports excluding Exportable Goods and Tourism
Billions of euros
Source: EU KLEMS, INE (National Statistics Institution)
Madrid Barajas airport ranks 11th worldwide and 4th in Europe in terms of passenger traffic, and is a key hub for air connections between America and Europe. Spanish ports are among the busiest in the world: Algeciras, Valencia, and Barcelona are all among the top 50 world ports in terms of volume of handled goods. Our ports are now strong candidates to become pivotal European logistics centres, given their strategic position and the forthcoming enlargement of the Panama Canal. An increase of global consumption of Spanish logistics services could contribute significantly on the positive side to the Spanish balance of trade. Its promotion should be a priority, and as such it is necessary to improve price competitiveness. Port costs are now above those of France, UK, the USA, and Germany, and must be brought into line to prevent this factor from becoming an obstacle for exports.
Maximizing the potential in each sector
1 Represented by Construction and Financial Services in the main


3.6Accelerate the restructuring of the Construction sector

86 A Growth Agenda for Spain
3.6 Accelerate the restructuring of the Construction sector As is well known, the Spanish Construction sector has grown at an unsustainable rate in recent years. Construction has become a much larger part of the economy here than it is in the rest of Europe or the US, at similar productivity levels. Demand levels in Spain reached over 100 hours per capita between 2000 and 2008, while in the US and Europe this figure was 60 hours. For a very long period of time, Construction grew powerfully in terms of employment, and it created enormous capital accumulation in the real estate sector.
The crisis dramatically altered this picture, as the Construction sector experienced significant losses in jobs and capital invested. Because of its outsized growth before the crisis, Construction was hardest hit when the crisis came. Now Spain must see as top economic priorities the managed restructuring of the Construction sector and the re-absorption of the consequences of the Construction bubble. Putting the Construction sector on a sound footing is a vital step in the development of a new sustainable growth model for the country. A realistic view must be taken first of all. Immediate pre-crisis levels of demand, job growth, and investment were unsustainable and will not return any time soon. The priority for the sector must be to rectify the imbalance of recent years. They can be separated between those related to the direct restructuring of the sector (direct priorities) and those addressing the absorption of the effects of this restructuring in the labour markets and the financial sector (indirect priorities). The distribution of these priorities in three broad action areas is illustrated in Exhibit 45.
Exhibit 45Three key areas to speed up the restructuring of the Construction sector and absorb its consequences
Priorities Specific actions
Promote the development of productivity in the sector
• Foster innovation by systematically applying “Lean Construction” methodologies• Strengthen base of subcontractor companies• Stimulate innovation by opening the sector to competition from international companies • Simplify administrative and regulatory procedures• Support internationalization of companies in the Construction sector• Reinforce the rental market through the deregulation of contract, the increase of legal protection
for owners and the reduction of obstacles for tenants• Ensure economic rationalization of design
Accelerate recycling of construction labour and reduce unemployment
• Extensively reform active policies at all levels, including:- national stakeholders- Regional Communities - role of social agents
Reabsorb the effects of overinvestment and release capital required forgrowth
•Continue to accelerate loss recognition in banks and savings banks to drive price adjustment in the Real Estate market
• Advance in the enforcement of all existing mechanisms ) to assist the required recapitalisation of the financial sector
• Accelerate the restructuring and consolidation of Savings Banks

87
Promote the development of productivity in the sector
Productivity growth in Construction has been far lower than in other sectors, both in Spain and at a global level. In terms of productivity per hours worked in 2005, however, Spain at EUR 22.7 was only slightly below Europe (24.0) and the US (24.6).
Spanish construction companies have significant global reach so the sector has the potential to grow, in terms of services as well as technology and know-how. To achieve international success, the sector will need to assume the position of global leader in innovation and productivity. Numerous initiatives can be considered with this end in mind: • Foster processes innovation with lean; systematically apply lean Construction methodologies
focused on measuring and improving productivity on site, and pursue simplifying organisational changes to capture these productivity improvements (see box, ‘Rethinking construction in the United Kingdom’).
• Strengthen the base of subcontractor companies; in general Spain’s subcontractors are very fragmented and more poorly managed compared to large construction companies. Certain consolidation efforts would be appropriate.
• Stimulate innovation by opening the sector to competition from international companies in Spanish territory, including contractors and providers.
• Simplify construction administrative and regulatory procedures.
• Support internationalization of companies in the Construction sector
• Reinforce the rental market by deregulating contracts, increasing legal protection for owners, and reducing obstacles for tenants.
• Ensure economical rationality in design, through educational institutes.
RETHINKING CONSTRUCTION IN THE UNITED KINGDOM
Through the “Rethinking Construction” initiative, the UK government developed pilot projects to define best
practices for the construction process. Among the practices defined were the selection of proposals that
minimise costs along the complete life-cycle (as opposed merely to lower initial offers), and the adoption
cost efficiency metrics such as material utilization rates and productivity.
Every project required an integrated team for the complete duration of its deployment, along each
phase of the value chain, to ensure cost control and better calculation of time frames. Modelling options
were reviewed on computers, along with standard and prefabricated components. The government set
improvement targets using pilot projects, for example 10 percent reductions in timelines and 10 percent
increase in productivity. The government also emphasised the improvement of educational levels and
skills. Some universities came up with specific building development courses as a reaction to the growing
demand for multidisciplinary thinking in construction projects.
These measures have had significant success. In 2009, productivity for pilot projects was twice that of the
industry, with improved accuracy in determining timelines and costs. From 1995 to 2005, productivity grew
more in the UK than in any other all European country, at 1.7 percent per year (although Spain’s productivity
growth reached 2 percent in the 2005–2008 period, during 2000–2005 it was -0.4 percent).
Maximizing the potential in each sector

88 A Growth Agenda for Spain
Accelerate recycling of construction labour and reduce unemployment
The Construction sector has suffered over 50 percent of total job destruction experienced by Spain overall during the crisis. Hours worked per capita have dropped to European and US levels. Most workers who have lost their jobs have not completed the mandatory education cycle, which makes it difficult for them to find new jobs in other sectors. Among the unemployed, over 850,000 are under 30 years old and have not completed their secondary education. The employment outlook in Construction continues to be depressed and retraining and placement policies for the unemployed are inefficient and ineffective. Should we continue on the present course, Spain will see increased levels of long-term unemployment in this segment. This could lead to an irreversible loss of human capital. Getting these young people back to work as soon as possible by developing new capabilities through retraining must be one of the urgent priorities for our economic policy. This will require sweeping changes to our present policies at a national level, as well as reforms in policies derived from our regional commitments, and a reformulation of the roles that social agents play in these policies. Our new economic model must address very sensitive aspects of business, organization, and worker funding.
This task is enormous, even in the event of a vigorous application of modern and successful policies. Top priority should be the turnaround of the mistakes of the education policies implemented over the past decades, which have led to a dropout rate in our secondary schools of over 30 percent. The most vital employment policies needed are:
• Assistance in job search
• Career guidance
• Training, both for the unemployed and employed
• Recruitment incentives (subsidies or allowances).
• Vocational training centres and employment shops, with an initial training stage followed by a contract
• Aid in the creation of companies
• Aid for company continuity and growth
• Labour insertion programmes
The complete employment project need to be undertaken collectively, with the full participation of the public and private sectors, and as soon as possible. Attempting a programme of this magnitude using only public sector resources would delay the process, and could even make returning to work impossible for many of these workers.

89
Reabsorb the effects of overinvestment and release capital required for growth
The Construction and Real Estate sectors in Spain saw a tremendous influx of capital, from companies and consumers, in the years leading up to the crisis.
• The annual credit given by banks to the Construction and Real Estate sectors totalled 49 percent of the total amount given to companies in 2006, compared with levels of 22 percent in 1995 (Exhibit 46). The level of borrowing of Spanish construction companies has been close to 80 percent, versus 50 percent in other European countries such as Germany.
• Annual credit given for housing represented 80 percent of total loans given to families in 2010.
Exhibit 46The annual credit given to the Construction and Real Estate sector by banks has doubled since 1995
Source: Banco de España (Bank of Spain)
Spain has one of the highest levels of borrowing in Europe (Exhibit 47), mainly because of private sector activity on the part of both consumers and companies. As a result of the crisis a large part of this credit has become delinquent, especially in Construction and Real Estate. Furthermore, the guarantees for these credits are not liquid, because of the lack of liquidity in the Real Estate market. Problems have arisen in solvency, liquidity and access to capital; banks are struggling to extend credit to the economy. The situation is that credit has become less available for other sectors of the economy, hampering progress towards the new growth model.
Maximizing the potential in each sector

90 A Growth Agenda for Spain
Exhibit 47Comparison of borrowing level by country
Debt as a percentage of GDP. 2009
Source: Haver Analytics, McKinsey Global Institute

91Maximizing the potential in each sector
In this context, measures already launched by the Bank of Spain to restructure the financial sector are extremely relevant and must be accelerated to the extent possible. The following measures should be taken:
• Continue to accelerate loss recognition in banks and savings banks to drive price adjustments in the real estate market and provide transparency of real exposure of the financial sector.
• Utilise all existing mechanisms to recapitalise the financial sector, specifically the FROB and the new possibilities for capitalisation of savings banks included in the LORCA.
• Build on both previous actions to accelerate the restructuring and consolidation of savings banks. Utilise all existing mechanisms to recapitalise the financial sector, specifically the FROB and the new possibilities for capitalisation of savings banks included in the LORCA.
• Build on both previous actions to accelerate the restructuring and consolidation of savings banks.

4

Setting up the new model

94 A Growth Agenda for Spain
4. Setting up the new model
Seven transformation themesSo far we have developed a perspective on the growth potential of the Spanish economy using a sector approach. We have also identified the action areas to accelerate the capture of this potential. The first draft of a potential programme of sustainable growth for Spain contains nearly 20 priority action areas (Exhibit 48). From the sector discussions and these action areas, seven themes for transforming Spain can be seen as emerging (Exhibit 49).
1. Outward-oriented companies. Support companies in their outward orientation, including a) promote the increase in exports, mainly in regions of high growth with limited penetration of Spanish goods and services; b) attract foreign direct investment for national initiatives and opportunities; c) attract best practices and innovations observed in other countries and promote their implementation in local companies; c) support cost reductions in sourcing through aggregator agencies, mainly for SMEs
2. Larger companies. Promote the creation of larger companies, capable of tackling changes and investment requirements to improve productivity and competitiveness. Some specific measures would include: 1) simplification of consolidation procedures; 2) incentivize growth and outward orientation, and 3) promote productivity in SMEs (i.e. through the development of training plans and implementation of lean approach at smaller companies).
3. A more flexible and competitive labour market, in which 1) labour capacity adapts more easily to fluctuations in demand and economic dynamics, 2) collective bargaining is decentralised, and 3) salaries are increased only through productivity increases.
4. Talent available and adaptable according to market needs. According to economic demands, the right levels of preparation must be available (in terms of secondary vs. higher education); the variety of specialisations offered at the university level and the numbers of graduates within each must also be suited and continually adapted to the needs of the economy. Furthermore, access to international talent must be improved, and active labour market policies reformed as needed.
5. Ease of starting a business. Simplify regulations to ease business initiative and the entry and exit of players; simplify administrative processes and improve effectiveness in interactions with entrepreneurs (e.g.. one-stop shops for company creation).
6. Innovation should be promoted, especially in subsectors where it is the key to competitiveness and growth (i.e., Tradable Goods and Business Services).
7. Capital availability can be improved by releasing capital currently “trapped” in the Real Estate and Construction sectors and ensuring alternate financing methods: venture capital funds, disintermediated financing, low capitalisation market, etc.

95Setting up the new model
Exhibit 48Sectorial action areas
Exhibit 49Crossover and sector programmes of change

96 A Growth Agenda for Spain
Spain’s growth agenda could be structured around a set of initiatives on a macro-sectorial basis. It would require full participation of both the public and private sectors in order to be achieved. The private sector would undoubtedly be the main engine of the desired change, supported by the public sector. From our point of view, the government should focus on removing barriers to growth by introducing policies that are eminently in line with the transformation themes identified above. These will have to be adapted from sector to sector, according to each sector’s specific needs. The government should also play a preeminent role in supporting and accelerating the development and implementation of corrective measures at a sector level.
The complexity of this effort should not be underestimated. Many measures of different kinds are to be deployed, but even before implementation begins, the measures themselves must be precisely formulated, according to the widest consensus achievable. The programme must proceed from Spain’s actual situation – especially in terms of the specific states of each sector.
How can a project of this size be tackled? Fortunately, it is not necessary to start from a blank page. Spain’s challenge is not unique and there are external examples that provide clues on how to mobilise all stakeholders in the country around an effort of this importance, and how to maximise the chances of a successful implementation. Based on these experiences, we illustrate below a set of elements that will be key, using specific examples from other countries (Exhibit 50):
Exhibit 50Key factors for the successful implantation of a growth agenda

97
The joint mobilisation of the private and public dimensions of Spanish society is of utmost importance, in defining the ambition levels, priorities, and critical initiatives to revamp economic growth in key sectors of the economy. Malaysia succeeded in implementing a sector-based transformation programme for its economy. The programme was led by the central government, with ministries, regional, and local governments all taking part, along with major decision-makers from the private sector and relevant players from the academic world (Exhibit 51).
Exhibit 51Malaysia has developed a transformation model targeted at ensuring success around three stages
The participants in the programme, whether from the public or private sectors, all acted as change agents. They agreed on the priorities for Malaysia’s growth, defined the roles they should play in the process, and reached specific objectives. This approach has also been used in Europe: in France a set of programmes was developed to address sector-specific challenges during the crisis. The sectors were represented by private companies, unions, opinion leaders, and publications; they were brought together in sector-specific groups, to establish a collective and thorough understanding of each sector’s starting point and to define the objectives for sector development. These teams have achieved significant consensus levels, and have created a common overall goal, constituted of specific initiatives for the transformation and improvement of each sector.
A CHANGE AGREEMENT IN MALAYSIA
The Malaysian programme is called the Economic Transformation Program (ETP). It aims to help the country
become a high-income nation by 2020, with annual GDP growth above 6 percent.
The programme began with workshops to establish the guidelines for transforming the Malaysian economy;
key decision makers participated, including leaders from businesses, industry, NGOs and statutory bodies,
as well as public service leaders. The workshops defined 12 “national key economy areas” (NKEAs), as
the sectors or national areas of growth on which the action plan would be focused (Exhibit 52). There was
general agreement on the objectives and commitment to achieving them, including to employ the best
people from private organisations and public bodies in “NKEA labs” for priority development.
Setting up the new model
(en PIB)
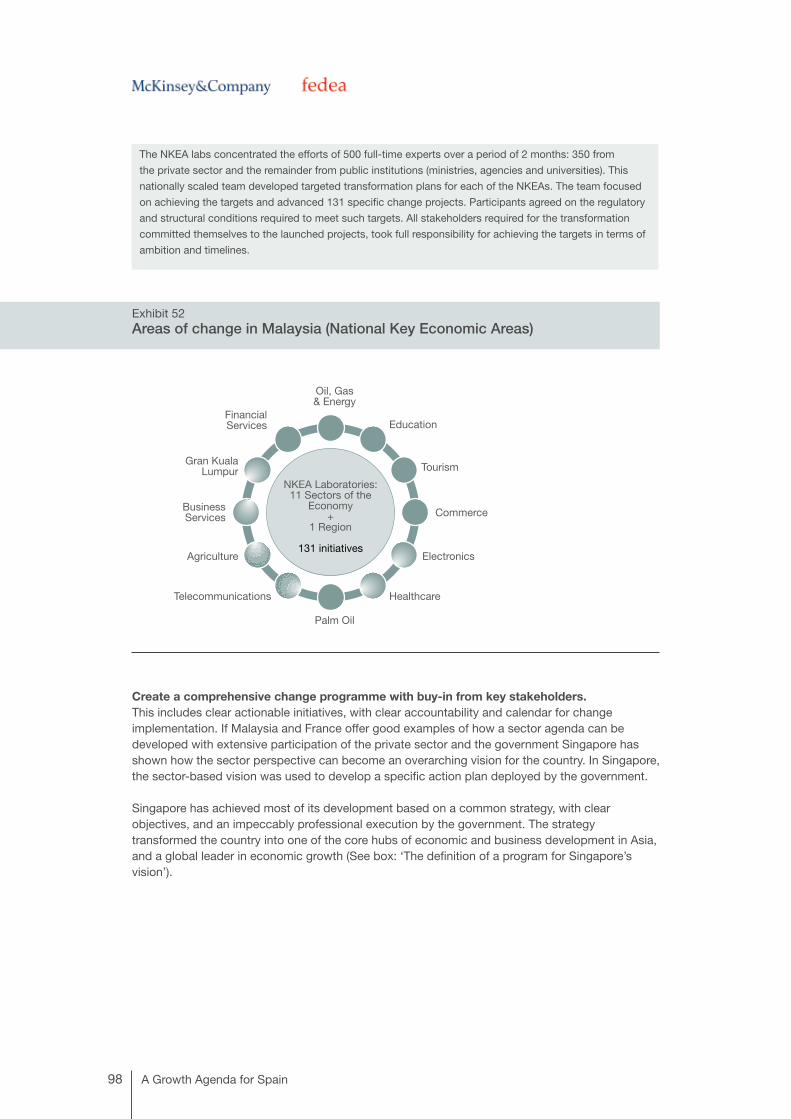
98 A Growth Agenda for Spain
The NKEA labs concentrated the efforts of 500 full-time experts over a period of 2 months: 350 from
the private sector and the remainder from public institutions (ministries, agencies and universities). This
nationally scaled team developed targeted transformation plans for each of the NKEAs. The team focused
on achieving the targets and advanced 131 specific change projects. Participants agreed on the regulatory
and structural conditions required to meet such targets. All stakeholders required for the transformation
committed themselves to the launched projects, took full responsibility for achieving the targets in terms of
ambition and timelines.
Exhibit 52Areas of change in Malaysia (National Key Economic Areas)
Create a comprehensive change programme with buy-in from key stakeholders.This includes clear actionable initiatives, with clear accountability and calendar for change implementation. If Malaysia and France offer good examples of how a sector agenda can be developed with extensive participation of the private sector and the government Singapore has shown how the sector perspective can become an overarching vision for the country. In Singapore, the sector-based vision was used to develop a specific action plan deployed by the government.
Singapore has achieved most of its development based on a common strategy, with clear objectives, and an impeccably professional execution by the government. The strategy transformed the country into one of the core hubs of economic and business development in Asia, and a global leader in economic growth (See box: ‘The definition of a program for Singapore’s vision’).
Oil, Gas& Energy
Education
Tourism
Commerce
Electronics
Healthcare
Palm Oil
Telecommunications
Agriculture
Business Services
Gran Kuala Lumpur
Financial Services
NKEA Laboratories: 11 Sectors of the
Economy+
1 Region
131 initiatives

99
DEFINING A PROGRAMME FOR SINGAPORE’S VISION
The Government of Singapore created a team to define the country’s objectives and strategies. The
Economics Strategy Committee (ESC), comprises 25 leaders from the public and private sector. They
have defined a vision of the country’s economic development during the next 10 years, with specific
development programmes to achieve this (Figure 53).
The ‘Sectorial priorities development workshops’ combined the full-time efforts of 500 experts over a period
of 2 months: 350 from the private sector and the remainder from public institutions (ministries, agencies and
universities). They came up with a transformation plan for each NKEA that would guarantee reaching the
established targets, through the deployment of 131 specific projects. They also agreed on the regulatory
and structural conditions required to meet the targets, which the administration agreed to deliver. Every key
stakeholder required for the transformation committed to the projects and took full responsibility for the
targets in terms of ambition and timelines. The principal overarching goals were:
• Sustainable growth for Singapore of 3 to 5 percent over the following 10 years, with 2 to 3 percent of
this growth derived from productivity gains and 1 to 2 percent by increases in labour participation.
• A renewed and innovative economy sustained through a highly skilled labour force, supporting
Singapore as a global differentiated city.
• Seven development strategies to achieve these goals. Each was a net contributor to the overall
objectives, and entailed a set of specific actionable initiatives, many of which were launched with
little need for preparation. One of the initiatives, ‘Developing a more skilled labour force’, is illustrated
in Exhibit 54. Its achievement depended on the implementation of a number of policies: continuing
education and training (CET), skills programmes for professionals in generalist areas, simplification
and transparency of skills associated to different levels or degrees (Figure 54).
Exhibit 53Singapore’s programme of change
Setting up the new model
GOAL
3-5% GDP annual growth for the next 10 years:
•2-3% Productivity
•1-2% Labor participation
STRATEGY
7 development strategies for the next 10 years
•Increased capabilities of labor force
•Global hub for high added value sectors
•Diversified business ecosystem
•Innovation embedded into economy
•Modernized energetic system
•Land productivity
•Global city
VISION
•High added value labor force
•Innovative economy
•Global City

100 A Growth Agenda for Spain
Exhibit 54Singapore’s change programme initiatives
Ensuring delivery and rigour in execution. Best practice in delivery and execution involves clear, agreed-upon targets, a high level of transparency on progress against those targets, and deployment of rigorous follow-up mechanisms. In the UK, Prime Minister Tony Blair established the ‘Prime Minister’s Delivery Unit’ (PMDU), a performance unit dedicated to speeding up implementation of key change programs. The PMDU was in charge of monitoring these programs and checking the performance level based on schedules and execution targets, called ‘public service agreements’ (PSAs) that had been adopted beforehand. The PMDU also collaborated with the setup teams to ensure alignment of agents and success in performance (See box: ‘Ensuring delivery in UK change programmes’).
Increased capabilities of labor force Priorities Initiatives
Increase capabilities of labor force
•Offer increasing opportunities and capacity development in multiple functions
•Create a solid CET system (Continuing Education and Training) adapted to market needs
•Develop higher transparency of capabilities associated to each degree• Launch programs to develop generalist professional capacities for
managers, executives and technicians
Support lower salary workers
•Develop schemes to foster employment continuity (WIS: Wokforce Income Supplements)
• Support training of lower salary workers
Manage dependency of foreign labor force
• Increase restriction to entry of foreign workers, promote local employment
• Ensure higher education attainment of foreign workers
Global hub for high added value sectors
Diversified business ecosystem
Innovation embedded into economy
Modernized energetic system
Land productivity
Global city
Strategy
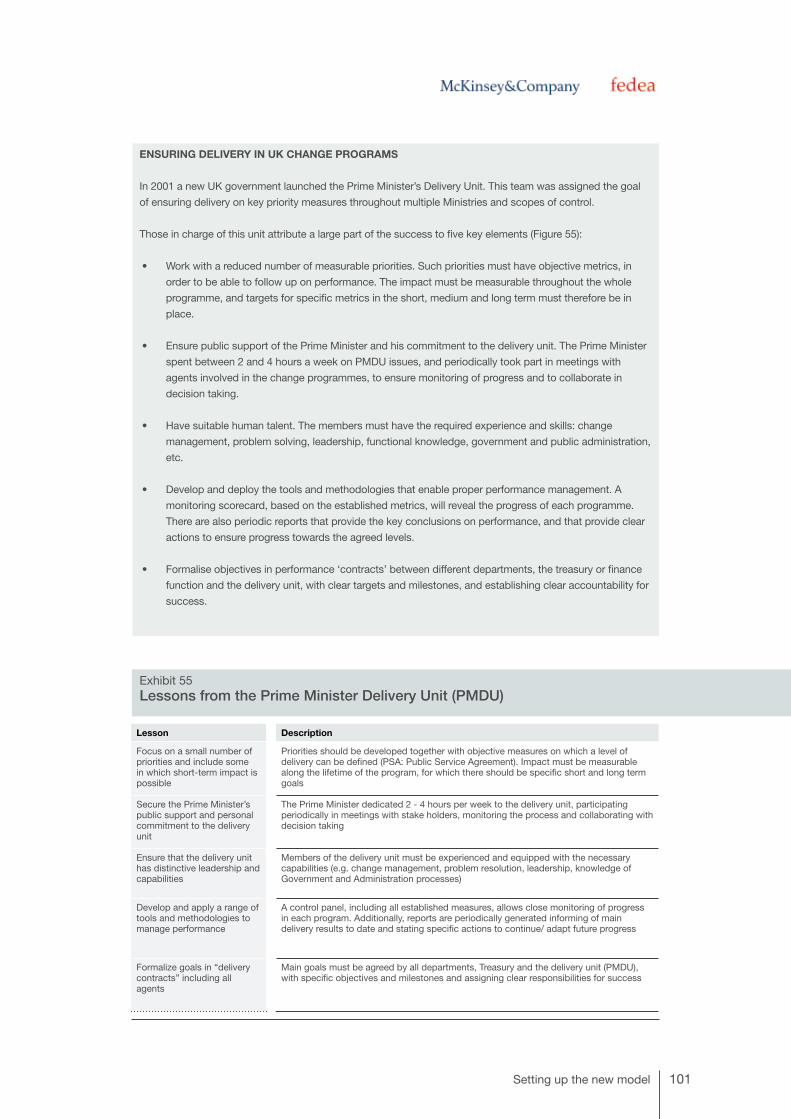
101
ENSURING DELIVERY IN UK CHANGE PROGRAMS
In 2001 a new UK government launched the Prime Minister’s Delivery Unit. This team was assigned the goal
of ensuring delivery on key priority measures throughout multiple Ministries and scopes of control.
Those in charge of this unit attribute a large part of the success to five key elements (Figure 55):
• Work with a reduced number of measurable priorities. Such priorities must have objective metrics, in
order to be able to follow up on performance. The impact must be measurable throughout the whole
programme, and targets for specific metrics in the short, medium and long term must therefore be in
place.
• Ensure public support of the Prime Minister and his commitment to the delivery unit. The Prime Minister
spent between 2 and 4 hours a week on PMDU issues, and periodically took part in meetings with
agents involved in the change programmes, to ensure monitoring of progress and to collaborate in
decision taking.
• Have suitable human talent. The members must have the required experience and skills: change
management, problem solving, leadership, functional knowledge, government and public administration,
etc.
• Develop and deploy the tools and methodologies that enable proper performance management. A
monitoring scorecard, based on the established metrics, will reveal the progress of each programme.
There are also periodic reports that provide the key conclusions on performance, and that provide clear
actions to ensure progress towards the agreed levels.
• Formalise objectives in performance ‘contracts’ between different departments, the treasury or finance
function and the delivery unit, with clear targets and milestones, and establishing clear accountability for
success.
Exhibit 55Lessons from the Prime Minister Delivery Unit (PMDU)
Setting up the new model
Lesson Description
Focus on a small number of priorities and include some in which short-term impact is possible
Priorities should be developed together with objective measures on which a level of delivery can be defined (PSA: Public Service Agreement). Impact must be measurable along the lifetime of the program, for which there should be specific short and long term goals
Secure the Prime Minister’s public support and personal commitment to the delivery unit
The Prime Minister dedicated 2 - 4 hours per week to the delivery unit, participating periodically in meetings with stake holders, monitoring the process and collaborating with decision taking
Ensure that the delivery unit has distinctive leadership and capabilities
Members of the delivery unit must be experienced and equipped with the necessary capabilities (e.g. change management, problem resolution, leadership, knowledge of Government and Administration processes)
Develop and apply a range of tools and methodologies to manage performance
A control panel, including all established measures, allows close monitoring of progress in each program. Additionally, reports are periodically generated informing of main delivery results to date and stating specific actions to continue/ adapt future progress
Formalize goals in “delivery contracts” including all agents
Main goals must be agreed by all departments, Treasury and the delivery unit (PMDU), with specific objectives and milestones and assigning clear responsibilities for success

102 A Growth Agenda for Spain
A model adapted to Spain A transformative process for Spain can draw upon the international experiences we have supplied, but the process will above all incorporate, address, and account for the particularities and complexities of our country. Its purpose will be nothing less than the development and implementation of a change programme on a national scale for Spain. The specific formula that should be followed to achieve this transformation is outside the scope of this study. It must be noted, however, that certain elements must be present in the model chosen for Spain:
• An agreed-upon starting point. Widespread agreement must be obtained on the diagnosis of the problem, our common starting point, and the key levers that will be incorporated into the new model. Relevant stakeholders from both the public and private sectors must take part, and jointly agree on the timeline to reach ambitious yet realistic targets.
• A universal vision of where we need to go. The programme must be accompanied by a universal vision: an exciting and optimistic change message, as well as realistic assessments of the challenges and the efforts that will be required to surmount them. The vision must be accompanied by detailed planning, with specific initiatives that lend credibility to the country’s ability to achieve the established targets.
• A performance unit in the lead. There needs to be a unit in charge, and an agreed-upon methodology for monitoring and supporting the programme. The performance unit must have access to the very highest level of decision-making authority and the ability to take action to ensure on-time delivery according to the established level of ambition. Performance monitoring will be based on a series of objective metrics, obtained using uniform and transparent methodology accepted by all agents..
POTENTIAL METRICS FOR SPAIN
The indicators used to monitor progress of the change programmes will be key elements in the
successful setup of a growth agenda. These metrics need to be closely tied to the final agreed-upon
change objectives, the nature of initiatives, and the implementation phase. They should be objective and
transparent in how they measure and how the results are communicated. They should furthermore provide
comparisons with past performance and against benchmarks where these are available. Finally, the metrics
should be clearly aligned with the final objectives of the project.
The metrics can be based on the following seven indicators:
• Export quotas (over total global exports) as an indicator of progress in initiatives targeted at
supporting the outward orientation of Spanish companies.
• Number of medium-size companies (i.e., with over 50 employees), as an indicator of progress in
promoting the development of larger companies.
• Assessment of competitiveness on international indicators (i.e., Competitive Index of the World Bank)
to move towards a more flexible and competitive labour model.
• Average waiting time required for a new graduate to find a job to ensure availability and/or access to
appropriate human capital.

103
• International ranking in administration and regulation (for example, Doing Business by the World
Bank), as an indicator of progress in simplifying regulation to facilitate business activity.
• Assessment of innovation by the European Innovation Scoreboard to guarantee progress and
improvement in innovative activity.
• Volume of credit extended to SMEs to assess availability of capital for business creation and growth..
We hope that this report serves as a contribution for the launch of Spain’s economic transformation programme. We are completely convinced that Spain has all the elements it needs to return to the path of sustainable growth. The fundamental ingredients of this growth will be increased productivity, external demand, and services growth. Its success will depend on superior execution. We further believe that the removal of regulatory barriers and the application of specific policies such as the ones suggested above will be needed to create early successes and, above all, national consensus on these priorities. For it will be Spain’s people who will sow the changes and reap the rewards.
Madrid, December 1st 2010
Setting up the new model

Appendix Methodology to estimate Spain’s growth potential

105Methodology to estimate Spain’s growth potential
Methodology to estimate Spain’s growth potential The used methodology has the goal of establishing growth potential based on simple criteria, mainly based on historical data of Spain and international benchmarks. Our target has never been to develop a comprehensive macro or microeconomic model of Spain or any other country in the benchmark. As already mentioned throughout the report, the presented targets require a radical turnaround of current tendencies of the Spanish economy.
In order to be able to estimate the potential of each sector under study, we have used different methodologies for the Tradable Goods, Tourism and Services (including Business Services, Local Services, Infrastructure and Construction). The logic used for Tradable Goods and Tourism, that have a significant international component, is based on a series of hypotheses on production and productivity, acknowledging differences between domestic and international consumption. For Services, on the other hand, estimates are based on benchmarking with key countries of reference.
Tradable Goods
As mentioned previously, the contribution to growth of the Tradable Goods sector will not come from its capacity of increasing jobs, but rather from their relevance as a key lever to achieve sustainability in the new economic model.
• For production targeted to consumption abroad, we believe that by significantly increasing productivity and competitiveness Spain should aspire to recover its maximum levels of global trade market share during the last 15 years: 2.1% (2003). This is also the relevance of Spain in the global economy. Achieving such market share, and considering an annual growth rate of global trade of 4.3% (HIS Global Insight forecasts until 2015), would translate in an annual increase of real exports by 10%, comparable although higher than the 8% Spain’s exports grew during 2000 - 2007.
• To estimate production for domestic consumption, we have assumed an annual increase of Spanish demand for national Tradable Goods of 2.1% (equivalent to the lower range of potential GDP growth in the model). It also limits the volume of imports required to satisfy domestic consumption, leading Spain to achieve a positive net trade balance of 1.5% and ensure sustainability of the Spanish economy.
• As far as productivity is concerned, we assume 3% annual growth, half a percentage point above European growth from 2000 - 2005, which would enable us to achieve European productivity levels during the next decade.
If Spain is able to achieve this ambition it will create 365,000 jobs, significantly the percentage of resources dedicated to produce for consumption abroad (Exhibit 1):

106 A Growth Agenda for Spain
Exhibit 1Outoput and job potential of Tradable Goods sectors
Real Euros and thousands of jobs. Indexed, 1995 = 100
Source: WIS (IHS Global Insight)
Tourism
Similarly to Tradable Goods, the Tourist sector is a key factor of sustainability of the Spanish economy, as well as a key vehicle for international promotion. A first impression might be that the assumptions used are less ambitious than those for the remaining sectors; however, we must take into consideration that maintaining our current share, Spain would continue to be a global leader..
• To estimate production targeted to international consumption (international tourists arriving in Spain), we assume that Spain will be able to maintain its quota of global international tourists at 6% (in GVA terms, this could be comparable to an increase in the average expenditure per client and a proportional decrease in the number of clients, that could be expected as a consequence of the change in the value proposal of the sector).
• To achieve the ambition levels presented it is not enough to maintain our current position on each market. The concentration of growth, according to the World Trade Organization, in regions in which Spain has very low penetration will require either to increase penetration in new zones or to increase of average expenditure per client. In our exercise we have assumed that Spain is able to reach the quota of Asian and US tourists that visit Germany or Italy (though still below the levels of France or the United Kingdom) and maintain its quota of tourists from other origins, mainly Europe. The change in the tourist origin mix (derived from increase in penetration of Asia and US), would increase the average spend per tourist (tourists coming from Asia and the US spend more than those from countries in which Spain has high penetration).
• Regarding productivity, we assume that Spain will move away from its negative trend of the last decade, and will achieve year-to-year increases of 2.3% to get back to 1995 levels and recover its global leadership position.

107
• Last, regarding domestic demand, the increase in productivity would be sufficient to satisfy an annual demand increase of 2.1% - analogous to domestic demand increases used for Tradable Goods.
In conclusion, Spain could create over 100.000 jobs to satisfy demand increase by foreign tourists, using the huge potential of market growth and maintaining its position as global leader (Exhibit 2)::
Exhibit 2Number of tourists and expense of the Spanish Tourist sector
Source: World Tourism Organization, Euromonitor reports
Services
The methodology used in Services, given it includes activities targeted mainly at domestic consumption, is based on international benchmarks. The potential is determined by considering that an increase of productivity would cause a strong development of the sector, increasing demand for new goods and services, and it would finally end up generating a demand increase and therefore creation of new jobs.
The model shows that Spain could aspire to be as productive and to generate the same demand (measured in hours worked per capita) as in the US or EU-15 average. To size the opportunity, we used data on productivity, jobs and the per capita worked hours of Spain up to 2008, and from EU-15 (aggregated, as if it was one country) and the United States up to 2005 (see box: Use the EU KLEMS database to compare productivity of different countries). An analysis is performed at sub-sector level (i.e. ICT, banking, retail trade, etc.) following the same logic (Exhibit 3):
Methodology to estimate Spain’s growth potential

108 A Growth Agenda for Spain
Exhibit 3Logic pursued for each subsector
USE THE EU KLEMS DATABASE TO COMPARE PRODUCTIVITY OF DIFFERENT COUNTRIES.
Comparing productivity levels across countries requires the use of purchasing power parity ratios to take
exchange rate fluctuations out of the equation and to account for differences in price and quality levels
among countries. For instance, agricultural produce is significantly more expensive in Switzerland than in
Germany, so the purchasing power parities adjust value added in nominal terms to derive a measure of
real output quantities. Similarly, comparing productivity levels in a specific country over time requires use
of deflators to cancel out inflation and take account of quality improvements. For instance, comparing a
computer today with a computer 10 years ago, it becomes obvious that the real output of the industry
increased even beyond nominal value-added growth.
The EU KLEMS project provides such purchasing power parities and deflators at the sector level across
all European member states as well as selected other countries. It also created a database of measures of
economic growth, productivity, employment creation, capital formation, and technological change at the
industry level from 1970. It was run by a consortium of research centres and universities until 2008 and was
funded by the European Commission; successor projects like World KLEMS are underway. This database
is one of the most comprehensive available today at the sector level and is used in various sections of this
report, and is a highly valuable resource for policy makers and researchers.
However, it is important to be aware that output is not always easy to define or measure, particularly in
service sectors (e.g., how to measure the quality adjusted output of a law firm). Sector-specific value-added
and productivity data hence remain indicative only, and we use insight into industry structure and conduct
and the external factors shaping it to analyse country differences in more depth. This particular tax/benefits
system makes Germany one of the few OECD countries that doesn’t provide incentives for the equal
sharing of paid work and helps explain why so many women work part time even after their child rearing
responsibilities have eased or ceased. Even in the 40 to 54 age group, part-time working among women is
high at around 42 per cent. A balance needs to be struck between retaining flexibility for women to juggle
family and work life and the loss to women arising from prolonged periods of part-time work that limits their
career options and results in pensions that are lower than average.

109
• If Spain is more productive, we consider that the subsector is mature and will have no contribution job creation.
• If Spain is less productive we estimate the potential following two steps:
– Productivity in Spain achieves benchmark levels (EU-15 or United State), maintaining value added constant (i.e. jobs are destroyed).
– Next, if the Spanish per capita hours are less than those of the benchmark, we consider that the productivity increase would stimulate demand until this difference no longer exists, therefore creating jobs.
• Finally, in order to understand the potential starting on the end of 2009, we include the jobs lost per sector during the 2008 – 2009 period.
This analysis shows that Spain has opportunity to generate between 1 and 3 million jobs (Exhibit 4), especially concentrated in Business Services and Local Services (Exhibit 5).
Exhibit 4Workforce employed in Services in Spain, Europe and United States
Source: EU KLEMS, INE (National Statistics Institution)
Methodology to estimate Spain’s growth potential

110 A Growth Agenda for Spain
Exhibit 5Breakdown of hours worked in Local and Business Services
Hours worked per inhabitant
Source: EU KLEMS, INE (National Statistics Institution)
Specifically, the sector with the highest potential would be Business Services. In fact, if we look at the breakdown of demand and productivity per country of the EU-15, Spain would generate jobs by achieving per-country levels for every case except Greece and Portugal (Exhibit 6).
Exhibit 6Productivity and demand of Business Services for key countries
Source: EU KLEMS, OECD, INE (National Statistics Institute), The Conference Board

111
FEDEA-McKinsey chair
McKinsey & Company, incorporated in 1926, is a global firm that offers senior management consultancy services. McKinsey & Company is established in 50 countries with 89 offices and over 8000 consultants who serve over 90% of leading companies worldwide. McKinsey & Co. is present in Spain in 1977, and currently has offices in Madrid and Barcelona and boasts a team of over 200 people who serve the leading companies and institutions of this country. The macroeconomic vision of the firm is consolidated in the McKinsey Global Institute, whose mission involves helping global leaders, independently of their belonging to the public, private or social sectors, to develop a better understanding of the global economy trends, and using a fact-based methodology to contribute to decision making on critical problems of management or regulation. McKinsey & Company has collaborated on several procedures for the development of policies that aid economic growth.
Fundación de Estudios De Economía Aplicada (FEDEA) was founded in 1985, with the purpose of generating quality economic analyses with an independent point of view and to promote effective economic and social proposals. Over these years, the foundation has published over 1000 work documents and has taken part in important debates on the future of pensions or regulation of the jobs market. FEDEA’s research is organized around Chairs, 5-year research programmes that seek to make relevant contributions in a chosen area. Under the guidance of a researcher of renowned prestige, the aim of the FEDEA Research Chairs is to make relevant contributions on issues of interest for Spanish society as a whole. Some of the current study areas of the FEDEA Chairs are to deepen in the understanding of the impact of immigration in Spain, analyse the impact of climate change on our country, and identification of policies to mitigate such impact, or propose a potential content for the labour reform based on advanced academic literature. In the case of the FEDEA-McKinsey Chair, the research programme focuses on the design of proposals for economic reform that can improve the welfare of citizens. The chair is led by Luis Garicano, professor at the London School of Economics. Last year the content of the analysis was Health, analysing the ways to achieve sustainability in the health system (http://www.cambioposible.es/sanidad/)
The result this effort summarizes the Chair’s vision on the key challenges the Spanish economic model is facing, and puts forward an independent proposal on how to move forward to solve them.

112 A Growth Agenda for Spain
Bibliographic references
Aghion, P., Dewatripont M., Hoxby C., Mas-Colell and Sapir, A., The Governance and Performance of Research Universities: Evidence from Europe and the U.S, 2009
Amuedo-Dorantes, C. and De la Rica, S., Complements or Substitutes? Immigrant and Native Task
Specialization in Spain, 2009
Barber, M., Instruction to deliver, February 2007
Bagues, M., Fernández Villaverde, J. and Garicano, L., La Ley de Economía Sostenible and las Reformas Estructurales: 25 Propuestas, 2010
BBVA – Servicio de Estudios económicos, Situación Inmobiliaria, 2009
Bentolia, S., Boldrin, M., Díaz-Giménez, J. and Dolado, J.J., La Crisis de la Economía Española. Análisis económico de la gran recesión. Monografías FEDEA, 2010
De la Rica, S., Inmigración, en La Ley de Economía Sostenible and las Reformas Estructurales: 25 Propuestas. Editado por Bagues, M.,Fernández Villaverde, J. and Garicano, L., FEDEA, 2010
De la Vega García-Pastor, I., Informe Ejecutivo GEM España, 2008
EUKLEMS, Growth and Productivity Accounts, 2008
European Commission, Report on Competition in Professional Services, February 2004
Eurostat-OECD, Methodological Manual on Purchasing Power Parities, June 2005
FEDEA, La Crisis de la Economía Española. Análisis Económico de la Gran Recesión, 2010
FEDEA and McKinsey & Company, Impulsar un cambio posible en el sistema sanitario, November 2009
Fundación José Manuel Entrecanales and Mckinsey & Company, Innovación and empresa: Una oportunidad para España, November 2010
García-Milà, T., FEDEA, Transferencia de resultados en la actividad investigadora, en La Ley de Economía Sostenible and las Reformas Estructurales: 25 Propuestas. Published by Bagues, M.,Fernández Villaverde, J. and Garicano, L., FEDEA, 2010
Garicano, L. and Rossi-Hansberg, E. Organizing Growth, 2008
Instituto de Estudios Turísticos, Encuesta de gasto turístico a los turistas no residentes, Enero 2009
Jonung, L., The Swedish model for resolving the banking crisis of 1991-93. Seven reasons why it was successful, 2009. Edited by the European Commission – Economic and Financial Affairs
Keller, S. and Price, C., Performance and Health. Published by McKinsey & Company, 2010
Krugman, P., Competitiveness: A Dangerous Obsession, 1994
McKinsey & Company, 10 Fuerzas Globales: Claves para fortalecer la empresa española, December 2007
McKinsey & Company, Reinvigorating industry in France, October 2006
McKinsey & Company, Workforce restructuring: A comparative analysis of European Collective Redundancy Processes, 2006
McKinsey Global Institute, Beyond austerity: A path to economic growth and renewal in Europe, October 2010
McKinsey Global Institute, How to compete and grow: A sector guide to policy, March 2010
McKinsey Global Institute, Sweden’s economic performance: Recent development, current priorities, May 2006

113
McKinsey Global Institute, Competitiveness and Growth in the Automotive Sector - Sector Characteristics, Growth, Country Competitiveness, and Government Policy, January 2010
McKinsey Global Institute, Competitiveness and Growth in the Semiconductor Sector: Sector Characteristics, Growth, Country Competitiveness, and Government Policy, December 2009
McKinsey Global Institute, Competitiveness and Growth in the Steel Sector: Characteristics, Growth, Country Competitiveness, and Government Policy, December 2009
McKinsey Global Institute, Competitiveness and Growth in the Tourism Sector: Sector Characteristics, Growth, Country Competitiveness, and Government Policy, December 2009
McKinsey Global Institute, Competitiveness and Growth in the Software Sector - Sector Characteristics, Growth, Country Competitiveness, and Government Policy, December 2009
McKinsey Global Institute, Growth and Competitiveness in the United States: The Role of its Multinational Companies, December 2009
OECD, Developing highly skilled workers: review of Denmark, 2004
O’Mahony, M. and Timmer, M.P., Output, Input and productivity measures at the industry level: The EU-KLEMS database, 2009
PEMANDU, Economic transformation programme: A roadmap for Malaysia, 2010
Sánchez, M.P. and Salazar, J.C., El papel de la innovación en el nuevo modelo económico español, 2010. Published by UAM- Accenture
Singapore Government, Report of the Economic Strategies Committee, 2009
Subdirección general de fomento empresarial, Retrato de las PYME 2009, 2009
Tesoro Público, Secretaría de Estado de Economía, Economic Policy and 2010 Funding Strategy, February 2010
Tesoro Público, Accelerating fiscal adjustment and structural rebalancing in Spain, June 2010
The Economist, Special report: How to grow, 2010
Timmer, Marcel P., O’Mahony, M. and Van Ark, B., EU-KLEMS Growth and Productivity Accounts: Overview November 2007 Release, November 2007
World Economic Forum, The Global Competitiveness Report, 2010
World Economic Forum, Travel & Tourism Competitiveness Report 2009: Managing in a time of turbulence, March 2009
World Economic Forum, Travel & Tourism in Spain, September 2009
World Tourism Organization, Tourism Highlights, 2009
100 economistas españoles, Propuesta para la Reactivación Laboral en España, 2009
Acknowledgements José Campello, José Gaztelu, Julia González, Francisco Gracia, Elena Méndez Jan Mischke, Baudouin Regout, Pablo I. Roa and Richard Bucci

COPYRIGHT © 2010
www.crisis09.es/agenda