a global strategic financial analysis of the luxury retail
TRANSCRIPT

University of Central Florida University of Central Florida
STARS STARS
HIM 1990-2015
2013
A global strategic financial analysis of the luxury retail industry A global strategic financial analysis of the luxury retail industry
Lauren LaVan University of Central Florida
Part of the Finance Commons
Find similar works at: https://stars.library.ucf.edu/honorstheses1990-2015
University of Central Florida Libraries http://library.ucf.edu
This Open Access is brought to you for free and open access by STARS. It has been accepted for inclusion in HIM
1990-2015 by an authorized administrator of STARS. For more information, please contact [email protected].
Recommended Citation Recommended Citation LaVan, Lauren, "A global strategic financial analysis of the luxury retail industry" (2013). HIM 1990-2015. 1422. https://stars.library.ucf.edu/honorstheses1990-2015/1422

A GLOBAL STRATEGIC FINANCIAL ANALYSIS OF THE LUXURY RETAIL INDUSTRY
by
LAUREN A. LAVAN
A thesis submitted in partial fulfillment of the requirements for the Honors in the Major Program in Finance in the College of Business and Administration
and in The Burnett Honors College at the University of Central Florida
Orlando, Florida
Spring Term 2013
Thesis Chair: Dr. Richard Curcio

ii
©2013 Lauren A. LaVan

iii
ABSTRACT
A global strategic financial analysis of the luxury retail industry was conducted. The
research entailed comprehensive analyses and forecasts of the global economy, the luxury retail
industry and four of the most prominent, multi-national luxury goods firms in the world. These
companies included: Coach, Michael Kors, Tiffany & Co., and LVMH Moet Hennessy, whom
market among the world’s finest personal luxury goods from handbags, clothing and accessories
to diamonds, jewelry, watches, fragrances, cosmetics and wines.
The macroeconomic analysis focused on factors pertinent to the luxury goods industry
such as: (1) the lasting effects of the global financial crisis, our gradual emergence from the
Great Recession and the impact these conditions have had on consumer spending and
confidence; (2) the generational shift of consumers from the retiring baby boomers to the
technologically savvy Generation Z and their unique demands for products as well as
experiences; and (3) the growth and demand from emerging economies, especially China which
is the globe’s top luxury nationality accounting for 25% of all luxury purchases worldwide.
Comprehensive financial ratio analyses, SWOT assessments, technical trends and
forecasts of revenues, earnings and share prices for the four companies, resulted in
recommendations to investors and advice to top management of the four firms.
Luxury retail is a fascinating, recession resilient industry and it is expected to reach €1
trillion within the next 5 years. However, regardless of how successful firms in this industry have
been in the past, to survive and continue to succeed, it is imperative that they remain flexible and
adaptable in this ever-changing world.

iv
DEDICATION
For my mentor, Dr. Richard Curcio: for all of your advice, knowledge, support, and
motivation during this process.
For my best friends and roommates especially Kristen, Ron, Jourdan, Christie, Shamira,
and Danika: thank you all for listening to me vent about my thesis this past year and always
telling me that I’m crazy but if anyone can do it, it’s me.
But most of all, for my family: Dad, Mom, Jennifer, Richard, and Elise: thank you for
providing me with all the motivation and opportunities in the world but mostly for believing in
me and supporting me no matter what endeavors I decide to pursue.

v
ACKNOWLEDGEMENTS I would like to express my deepest appreciation for my committee chair, Dr. Richard
Curcio, who encouraged me to not only write this thesis but to follow my dreams within the
retail and fashion industry. Without his guidance, advice, and reassuring words, this thesis would
not have been possible and I am grateful for all the time and dedication he gave to me.
I would also like to thank my other committee members: Dr. Carolyn Massiah and Dr.
Richard Ajayi. Dr. Massiah’s passion has always inspired me and I couldn’t have been any
luckier to have such an amazing professor as a part of my committee. Dr. Ajayi’s excitement for
international business and teaching is something that is invaluable and kept me intrigued to
always learn more.
Lastly, a big thank you goes to Denise Crisafi, Kelly Astro, and the UCF Honors College
for this wonderful opportunity.

vi
TABLE OF CONTENTS CHAPTER I: INTRODUCTION .................................................................................................. 12
CHAPTER II: THE MACROECONOMIC AND FINANCIAL WORLD .................................. 16
Macroeconomic Factors and Projections by Region ................................................................. 17
United States .......................................................................................................................... 17
Euro Area ............................................................................................................................... 18
Japan ...................................................................................................................................... 18
China & Other Emerging Markets......................................................................................... 19
CHAPTER III: ANALYSIS OF THE LUXURYRETAIL INDUSTRY ..................................... 20
By market segment: ................................................................................................................... 20
Apparel .................................................................................................................................. 20
Accessories & Leather Goods ............................................................................................... 21
Perfume & Cosmetics ............................................................................................................ 21
Hard Luxury .......................................................................................................................... 21
Cars ........................................................................................................................................ 22
Wines & Spirits ..................................................................................................................... 22
Hospitality ............................................................................................................................. 22
Food ....................................................................................................................................... 23
Design & Furniture ................................................................................................................ 23
Yachts .................................................................................................................................... 23
Important Factors and Considerations in the Luxury Retail Industry ....................................... 24
Input Prices ............................................................................................................................ 24
China ...................................................................................................................................... 24
Emerging Economies ............................................................................................................. 25
Current Industry Trends......................................................................................................... 26
CHAPTER IV: INDIVIDUAL COMPANY ANALYSIS ........................................................... 27
Coach Company Profile: ........................................................................................................... 29
Strategic Growth Plans and Initiatives .................................................................................. 29

vii
SWOT Analysis--COH .......................................................................................................... 30
Company Performance .......................................................................................................... 30
Stock Performance ................................................................................................................. 31
Ratio Analysis........................................................................................................................ 33
Technical Analysis ................................................................................................................ 40
Michael Kors Company Profile................................................................................................. 41
SWOT Analysis ..................................................................................................................... 41
Strategic Growth Plans and Initiatives .................................................................................. 42
Company Performance .......................................................................................................... 42
Stock Performance ................................................................................................................. 42
Ratio Analysis........................................................................................................................ 44
Tiffany & Co. Company Profile ................................................................................................ 52
SWOT Analysis ..................................................................................................................... 53
Strategic Growth Plans and Initiatives .................................................................................. 53
Company Performance .......................................................................................................... 53
Stock Performance ................................................................................................................. 54
Ratio Analysis........................................................................................................................ 56
Technical Analysis ................................................................................................................ 63
LVMH Moet Hennessy Company Profile ................................................................................. 64
SWOT Analysis ..................................................................................................................... 64
Strategic Growth Plans and Initiatives .................................................................................. 65
Company Performance .......................................................................................................... 65
Stock Performance ................................................................................................................. 66
Ratio Analysis........................................................................................................................ 67
Technical Analysis ................................................................................................................ 75
Projections ................................................................................................................................. 76
COH ....................................................................................................................................... 76
KORS..................................................................................................................................... 77
TIF ......................................................................................................................................... 78

viii
LVMUY................................................................................................................................. 79
CHAPTER V: RECOMMENDATIONS ...................................................................................... 80
COH .......................................................................................................................................... 80
Investors................................................................................................................................. 80
Management .......................................................................................................................... 80
KORS ........................................................................................................................................ 81
Investors................................................................................................................................. 81
Management .......................................................................................................................... 81
TIF ............................................................................................................................................. 81
Investors................................................................................................................................. 81
Management .......................................................................................................................... 81
LVMUY .................................................................................................................................... 82
Investors................................................................................................................................. 82
Management .......................................................................................................................... 82
CHAPTER VI: CONCULSIONS ................................................................................................. 83
APPENDIX A: GENERAL RATIO DESCRIPTIONS ................................................................ 84
General Ratio Descriptions ....................................................................................................... 85
Short Term Liquidity ............................................................................................................. 85
Asset Management ................................................................................................................ 85
Debt Management .................................................................................................................. 86
Profitability Ratios ................................................................................................................. 86
Market Value Ratios .............................................................................................................. 87
Efficiency Ratios ................................................................................................................... 88
Works Cited .................................................................................................................................. 89

ix
LIST OF FIGURES Figure 1: Stock Price 5 years--COH: Yahoo Finance ................................................................... 31 Figure 2: YTD Stock Price Comparison: Bigcharts.com.............................................................. 32 Figure 3: Current Ratio--COH ...................................................................................................... 33 Figure 4: Asset Management--COH ............................................................................................. 34 Figure 5: D/E ratio--COH ............................................................................................................. 34 Figure 6: D/E--Comparative ......................................................................................................... 35 Figure 7: Profit Margin—Comparative ........................................................................................ 35 Figure 8: Return on Assets & Return on Equity--COH ................................................................ 36 Figure 9: P/E Ratio--COH ............................................................................................................ 37 Figure 10: P/E Ratio--Comparative .............................................................................................. 37 Figure 11: P/CF Ratio-COH ......................................................................................................... 38 Figure 12: P/CF Ratio--Comparative ............................................................................................ 38 Figure 13: Inventory Turnover-- COH ......................................................................................... 39 Figure 14: Days Sales Outstanding--COH .................................................................................... 39 Figure 15: Technical Analysis—COH: Bigcharts.com ................................................................ 40 Figure 16: Stock Price 5 years--KORS: Yahoo Finance .............................................................. 43 Figure 17: YTD Stock Price Comparison: Bigcharts.com............................................................ 43 Figure 18: Current Ratio--KORS: Morningstar.com .................................................................... 44 Figure 19:Asset Turnover--KORS: Morningstar.com .................................................................. 45 Figure 20: D/E Ratio--KORS: Morningstar.com .......................................................................... 45 Figure 21: D/E Comparative ......................................................................................................... 46 Figure 22: Profit Margin—Comparative: Value Line & Net Advantage ..................................... 46 Figure 23: Return on Assets & Return on Equity--KORS: Morningstar ...................................... 47 Figure 24:P/E--KORS: Morningstar ............................................................................................. 48 Figure 25:P/E--Comparative: Morningstar ................................................................................... 48 Figure 26: P/CF--KORS: Morningstar.......................................................................................... 49 Figure 27: P/CF--Comparative: Morningstar................................................................................ 49 Figure 28: Inventory Turnover--KORS: Morningstar .................................................................. 50 Figure 29: Days Sales Outstanding--KORS: Morningstar............................................................ 50 Figure 30: Technical Analysis--KORS: Bigcharts.com ................................................................ 51 Figure 31: Stock Price 5 years--TIF: Yahoo Finance ................................................................... 54 Figure 32: YTD Stock Price Comparison: Bigcharts.com............................................................ 55 Figure 33: Current Ratio--TIF: Morningstar................................................................................. 56 Figure 34: Asset Turnover--TIF: Morningstar .............................................................................. 57 Figure 35: D/E--TIF: Morningstar ................................................................................................ 57 Figure 36: D/E Comparative--Morningstar .................................................................................. 58 Figure 37: Profit Margin--Comparative ........................................................................................ 58 Figure 38: Return on Assets & Return on Equity--TIF: Morningstar .......................................... 59 Figure 39: P/E--TIF: Morningstar ................................................................................................. 60 Figure 40: P/E Ratio—Comparative: Morningstar ....................................................................... 60 Figure 41: P/CF--TIF: Morningstar .............................................................................................. 61

x
Figure 42: P/CF--Comparative ..................................................................................................... 61 Figure 43: Inventory Turnover--TIF: Morningstar ....................................................................... 62 Figure 44: Days Sales Outstanding--TIF: Morningstar ................................................................ 62 Figure 45: Technical Analysis-- TIF: Bigcharts.com ................................................................... 63 Figure 46: Stock Price 5 years--LVMUY: Yahoo Finance .......................................................... 66 Figure 47: YTD Stock Price Comparison: Bigcharts.com............................................................ 66 Figure 48: Current Ratio--LVMUY: Morningstar ........................................................................ 67 Figure 49: Asset Management Ratios--LVMUY: Morningstar .................................................... 68 Figure 50: D/E Ratio--LVMUY: Morningstar .............................................................................. 69 Figure 51: D/E Comparison .......................................................................................................... 69 Figure 52: Profit Margin--Comparative ........................................................................................ 70 Figure 53: Return on Assets & Return on Equity- LVMUY ........................................................ 71 Figure 55: P/E--LVMUY: Morningstar ........................................................................................ 72 Figure 56: P/E Comparative: Morningstar .................................................................................... 72 Figure 57: P/CF--LVMUY: Morningstar...................................................................................... 73 Figure 58: P/CF--Comparison: Morningstar ................................................................................. 73 Figure 59: Inventory Turnover—LVMUY: Morningstar ............................................................. 74 Figure 60: Days Sales Outstanding--LVMUY: Morningstar ....................................................... 74 Figure 61: Technical Analysis--LVMUY: Bigcharts.com ............................................................ 75

xi
LIST OF TABLES Table 1: SWOT Analysis--COH ................................................................................................... 30 Table 2: SWOT Analysis--KORS ................................................................................................. 41 Table 3: SWOT Analysis--TIF ..................................................................................................... 53 Table 4: SWOT Analysis--LVMUY ............................................................................................. 64 Table 5: Forecasted Scenarios- EPS & Stock Price--COH: MSN Money.................................... 76 Table 6: Forecasted Scenarios- EPS & Stock Price--KORS: MSN Money ................................. 77 Table 7: Forecasted Scenarios- EPS & Stock Price--TIF: MSN Money ...................................... 78 Table 8: Forecasted Scenarios- EPS & Stock Price--LVMUY: MSN Money ............................. 79

12
CHAPTER I: INTRODUCTION
The purpose of this thesis is to conduct a comprehensive, global strategic financial
analysis of the luxury retail industry. Personal luxury products include handbags, watches,
jewelry, fragrances, cosmetics, clothing, and footwear. A more encompassing description of the
total luxury goods market includes, in addition to personal luxury products: luxury cars, hotels,
wines, foods, home furnishings, and yachts.
Bain consulting company projects that the global personal luxury goods industry will
generate revenues of €212 billion in 2012, up 10% over 2011. If achieved, this would mark the
third straight year of double digit growth for this industry, following the “great recession”.
Further, in real terms, Bain forecasts that the industry will grow to between €240 and €250
billion by the end of 2015. For the broader, total worldwide luxury goods category, Bain
forecasts €750 billion of affluent spending just for 2012 alone. (2012 Luxury Goods Worldwide)
The strength of the emerging markets, especially in BRIC (Brazil, Russia, India, and
China) countries, must also be taken into account, considering these markets have been the fuel
to the recovery of the global economy. “...BRIC will contribute approximately 36 per cent of the
global luxury market by 2015 and is predicted to have the largest base of luxury customers”
(Som 75).
Some believe that the industry is recession proof and thus, adds stability to the global
economy in these economically uncertain times. Others, like Bain and Co., argue that in our
current worldwide, highly volatile business environment, the performance of the industry or at
least some segments of the industry may, to some degree, be subject to the ebbs and flows of the

13
global economy. The strong performance of the luxury goods industry following the Great
Recession seems to bode well for the recession proof argument. However, in 2009, following the
financial crisis which began in 2008, the luxurious goods industry did suffer it worst decline
since its consolidation in the 1990s. So, recession resilient might be more appropriate than
recession proof. (Passariello) Nevertheless, the global economy is facing some daunting head
winds as numerous countries struggle to reduce enormous, burdensome sovereign debt while
simultaneously attempting to implement monetary and fiscal policies which will get them back
on a path to strong sustainable economic growth. What will be the impact of the trend in the
United States towards reduction of corporate executive pay and bonuses, especially in the
financial industry? Can such executives continue to afford to buy their friends, spouses or
significant others, expensive jewelry at Tiffany’s? Will the movement to increase taxes on the
wealthy which has already taken place in France and California, and is being vigorously pursued
by the recently reelected President of the United States, impact the sales of luxury goods? What
if the United States goes off the widely feared “Fiscal Cliff”? (Boles)
These issues and others will be addressed in this research because it is critical to consider
the rapidly changing market and consumer base for luxury goods. Just because a company has
been successful in the past does not mean that it will continue to prosper in the future. Overall,
the global, strategic analysis of the luxury retail industry in this thesis will be structured as a top-
down analysis.
First, in Chapter II, the global macroeconomic and financial market environments will be
analyzed. Prospects on future economic growth and financial market performance across major

14
sectors of the world will be analyzed and two years of forward predictions from reputable
economic forecasters and stock market analysts will be discerned and summarized.
In Chapter III, a thorough analysis of the luxury goods industry was conducted. A
detailed breakdown of revenue and growth rate forecasts for each individual luxury good
category will be discussed and analyzed. Revenue and growth projections for the total luxury
goods industry will be separated out by major market segments and geographic areas of the
world.
Chapter IV will entail a comprehensive fundamental analysis of four major luxury goods
companies which include: Coach (COH), Michael Kors Holdings Ltd. (KORS), Tiffany & Co.
(TIF), and LVMH Moet Hennessy (LVMUY). These companies will serve as a basis and a good
predictor of how the rest of the luxury retail market will perform because they encompass a
variety of characteristics from old and established firms to new and trendy firms, industry
leaders, and those firms planning rapid expansion into the world’s emerging economies.
This process includes a comparative and/or trend analysis of six categories of ratios: (1)
liquidity; (2) asset management; (3) debt management; (4) profitability; (5) market value and 6)
efficiency for each of the four companies. The analysis will extend over the most recent 5 year
period. A strengths, weaknesses, opportunities and threats (SWOT) matrix will also be composed
for each of the companies. Third, revenue, earnings, and share price is forecasted on a most
likely, optimistic, and pessimistic basis for two years for each of the companies. Fourth,
technical analyses using moving averages, support and resistance, relative strength index and
moving average convergence/divergence (MACD) indicators to discern pricing patterns will be
employed.

15
Chapter V will include the results of the analysis that will be summarized and used to
formulate investment recommendations to investors and portfolio managers. The results of the
analysis will also be used to provide advice and recommendations to the CEOs and other top
management of these four firms, on how to improve future performance.
Chapter VI will include the summary and conclusions of this financial analysis and how
these findings can be generalized for the overall luxury retail industry.

16
CHAPTER II: THE MACROECONOMIC AND FINANCIAL WORLD
As the global economy recovers from the Great Recession, there is still much uncertainty
lingering over future expectations. According to the International Monetary Fund world output in
2012 was recorded as a 3.2 percent increase and is forecasted to reach 3.5 percent in 2013 and
then 4.1 percent by 2014. Output has been revised down since the October World Economic
Update due to the high amount of uncertainty. (“Gradual Upturn in Global Growth”) Growth in
emerging economies as well as the positive outlook for growth in the United States is fueling this
projected global growth. Growth will depend on the US and Euro area’s short term outlook and
policy actions. Most of the lag on global recovery stems from the possibility of another crisis or
lingering stagnation in Europe.
In addition to the financial crisis, many other factors will affect the macro economy. Bain
believes that the most dominate macroeconomic factor will be the generational shift of
consumers. Meaning that, the techniques and strategies that have worked in the past are unlikely
to return the same results in the future. The framework and character of the consumer has
changed drastically from the retiring baby boomers to the entitled and technological savvy
Generation Z who is looking for different characteristics of products than their parents or
grandparents. Generation Y and Z are the up and coming shoppers so it is important that
companies alter their strategies to incorporate aspects that these generations are demanding
including instant gratification through multiple channels, a customer centric environment, and
unique products as well as experience. (2012 Luxury Goods Worldwide 44)

17
Macroeconomic Factors and Projections by Region
United States
In the United States, growth is projected at 2 percent for 2013 and should gradually pass
that threshold into the second part of the year as long as there are no major changes to the
market. (Gradual Upturn in Global Growth) This growth is supported by the positive outlook and
rise in prices in the housing market. Mortgage rates are being kept low and prices are increasing:
the housing market has an upward sloping yield curve which is a positive signal for recovery. As
of November 2012, property values in the United States have increased the most since August
2006. (“Consumer Confidence in US”). Although the housing market is on the rise and the stock
markets are trending upwards, consumer confidence index and comfort in the US has dropped.
The consumer confidence level in the US has fallen to the lowest level since 2011 on January 29,
2013. Due to the two percentage increase in payroll tax, many Americans are seeing less money
in their paychecks. The confidence level fell to 58.6, which was even less than the most
pessimistic level that was forecasted according to a Bloomberg survey. The consumer comfort
index also dropped at the end of January to -36.4, which is the lowest level since October.
(“Consumer Comfort Falls”) Furthermore, the growth of not only US, but globally as well, is
extremely sensitive to the debt ceiling that the US is currently facing. The house voted to
suspend the current debt ceiling until March 29, 2013; it was a crucial decision to aid in global
recovery but the suspension is only a temporary solution. Spending is what will fuel the recovery
process in the United States. “The priority is to avoid excessive fiscal consolidation in the short
term” (“World Economic Outlook October”).

18
Euro Area The Euro area is the biggest downside risk to growth and the financial sector that the
global economy is currently presented with. Even with some strengthening policies enacted,
projected growth for the Euro area has been lowered since the International Monetary Fund’s last
October’s Economic Update. Activity in this area is now projected to decrease by 0.2 percent in
2013 as opposed to last October when it was predicted that it would grow by 0.2 percent.
(“Gradual Upturn in Global Growth”)This contraction is due to the high uncertainty and
financial linkage between the countries in this area. Many doubt the feasibility of the Economic
and Monetary Union (EMU) and its plans to fix the current account imbalances. Although
investment levels in Europe are weak, unlike many other economies, the capital that is being
invested has been sent to safe zones such as Germany, Switzerland, and other Scandinavian
countries, which aids in stimulating lending by decreasing bond yields. (“World Economic
Outlook October”) The Euro area has and will be the deciding factor other whether or not global
growth will be accelerated.
Japan Reconstruction effects in Japan from previous natural disasters like the earthquake,
tsunami and floods in 2011 were short lived as Japan fell into a recession in 2012. But now, with
the current stimulus package in place, growth should be boosted in the near future and Japan’s
projections remained unchanged of 1.2 percent growth for 2013. They have enacted several
temporary aids to help Japan recover quicker by planning to weaken the Yen slightly. Japan has
loosened their monetary policy as of September 2012 in hopes of growth and decreasing the
amount of inflation. (“Gradual Upturn in Global Growth”)
19
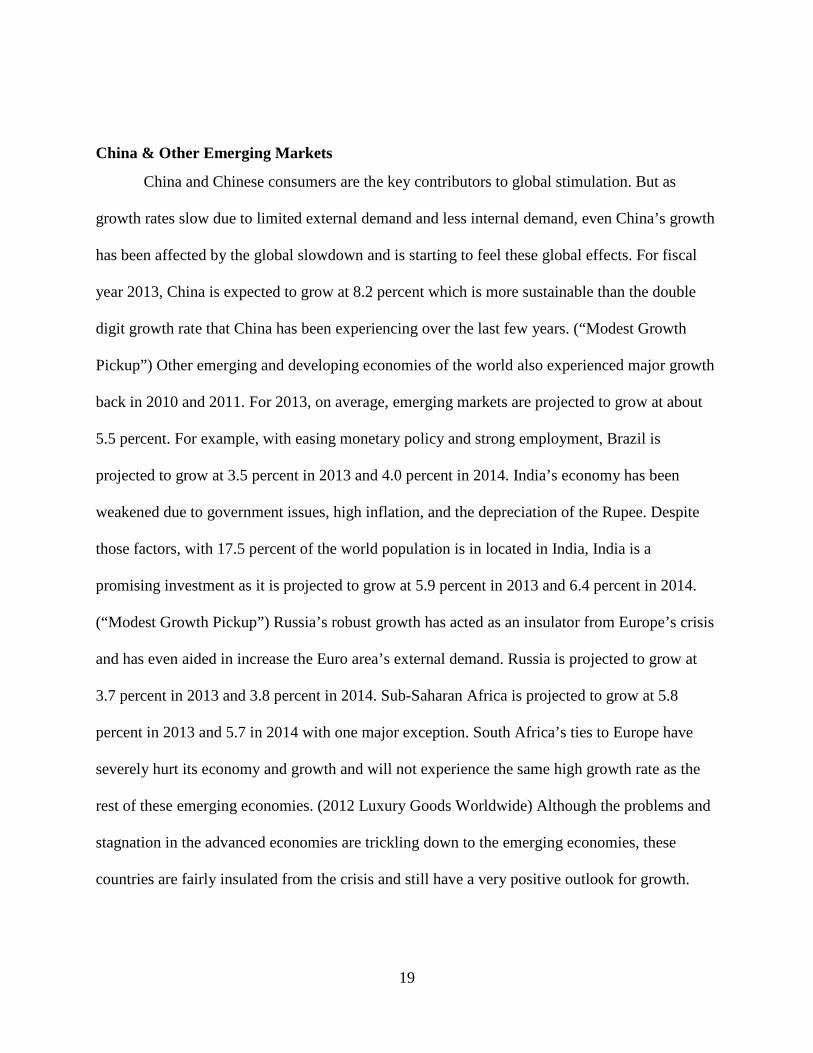
China & Other Emerging Markets
China and Chinese consumers are the key contributors to global stimulation. But as
growth rates slow due to limited external demand and less internal demand, even China’s growth
has been affected by the global slowdown and is starting to feel these global effects. For fiscal
year 2013, China is expected to grow at 8.2 percent which is more sustainable than the double
digit growth rate that China has been experiencing over the last few years. (“Modest Growth
Pickup”) Other emerging and developing economies of the world also experienced major growth
back in 2010 and 2011. For 2013, on average, emerging markets are projected to grow at about
5.5 percent. For example, with easing monetary policy and strong employment, Brazil is
projected to grow at 3.5 percent in 2013 and 4.0 percent in 2014. India’s economy has been
weakened due to government issues, high inflation, and the depreciation of the Rupee. Despite
those factors, with 17.5 percent of the world population is in located in India, India is a
promising investment as it is projected to grow at 5.9 percent in 2013 and 6.4 percent in 2014.
(“Modest Growth Pickup”) Russia’s robust growth has acted as an insulator from Europe’s crisis
and has even aided in increase the Euro area’s external demand. Russia is projected to grow at
3.7 percent in 2013 and 3.8 percent in 2014. Sub-Saharan Africa is projected to grow at 5.8
percent in 2013 and 5.7 in 2014 with one major exception. South Africa’s ties to Europe have
severely hurt its economy and growth and will not experience the same high growth rate as the
rest of these emerging economies. (2012 Luxury Goods Worldwide) Although the problems and
stagnation in the advanced economies are trickling down to the emerging economies, these
countries are fairly insulated from the crisis and still have a very positive outlook for growth.

20
CHAPTER III: ANALYSIS OF THE LUXURYRETAIL INDUSTRY
The luxury goods industry is a most important and fascinating industry. This industry has
seen steady growth for the past 15 years and has turned out to be one of the most attractive and
profitable industries. (Kim) 2012 marks the third year of double digit growth post-recession.
Bain forecasts that the total worldwide luxury good category will reach €750 billion in 2012, a 9
percent increase from 2011 and estimates that this figure will approach €1 trillion within the next
five years. (2012 Global Luxury Goods Worldwide) Even so, with the recently enacted 2 percent
payroll tax increase, consumers may spend less on luxury items, perhaps specifically on luxury
apparel. (Aseada) Similar to the recession, this tax increase will affect a few of the segments in
the industry more than others. Others will continue to outperform the industry and the rest of the
market as well, for example leather goods and accessories have become the dominating category
of luxury consumption for 2012 with leather goods and shoes revenues increasing by 14 percent.
On the other hand, high ticket categories like cars, yachts, and design are struggling to grow or
even stabilized. (2012 Luxury Goods Worldwide 43)
By market segment:
Apparel
Although an established and mature category, luxury apparel is seeing a slight
consolidation due to the high pressures from competition, but still offers stable growth year over
year. Men’s apparel is expected to increase by 10 percent in 2012 and women’s apparel is
forecasted at 9 percent growth. Bain states “modernization of tradition is the foundation of
apparel good performance” (2012 Luxury Goods Worldwide 23). Many retailers, like Coach, are

21
focusing more attention and opening new stores in response to an increased demand for men’s
business accessories.
Accessories & Leather Goods
Outperforming the market and also all other luxury segments, accessories and leather
goods claim the title as the champion category experiencing 16 percent growth. (“Bain projects
global luxury goods”) Jason Asaeda, an analyst at S&P Net Advantage, believes that the 2
percent payroll tax increase caused consumers to cut back on their apparel purchases but not
necessarily on accessories because accessories are viewed as a better investment. (Aseada)
Personal luxury goods, especially the accessories segment, will continue to thrive if consumers
continue with this current mindset.
Perfume & Cosmetics
Along with apparel, perfume and cosmetics are the historic giants of personal luxury
goods. The cosmetics segment is projected to grow slightly faster at 5 percent in 2012 than
perfumes, at 4 percent, due to new and increased product innovation and a specific focus on the
emerging economies. (“Bain projects global luxury goods”)
Hard Luxury
The hard luxury segment includes jewelry and watches and has been outperforming the
market as well. Forecasted at 13 percent for 2013 and 14 percent growth for 2014, this segment
will continue to thrive as long as consumer demand stays high. (2012 Luxury Goods Market
Worldwide 25)

22
Cars
After reaching double digit growth in 2010 and 2011, the market growth for luxury cars
has slowed to an estimated 4 percent for 2012. Mature markets in Europe, especially those in
Italy, are seeing the largest decrease in consumption. In addition, Asia is also experiencing a
slight decline in growth from years prior. Many luxury car dealers need to focus on
environmental issues such as sustainability and green initiatives. Hybrid and electric vehicles are
going to become more prominent, even in the luxury industry. (2012 Luxury Goods Market
Worldwide 34)
Wines & Spirits
At 12 percent growth for 2012, wines and spirits are incrementally gaining market share.
Champagne accounts for 30 percent of all total luxury wine sales while China is about to become
the biggest importer in the next 5 to 10 years of these beverages. For spirits, Vodka is the
category leader with household consumption increasing in all geographical segments. (2012
Luxury Goods Market Worldwide 35)
Hospitality
After a record year in 2011, growth is even higher in the hospitality market which is
seemingly gaining relative importance to the luxury consumer. As with any product, the services
provided must offer consumers a unique experience and differentiation and customization
opportunities for the customer. If the hospitality industry can meet those needs, there is a good
chance that the positive trend will continue with double digit growth. (2012 Luxury Goods
Market Worldwide 36)

23
Food
Consumers are starting to prefer quality local products in home as opposed to restaurants.
Out of home fine restaurants sales have declines but companies are still able to maintain their
loyal client base. Beverages, including bottled water sales are still best sellers in the US and
Asia. Luxury food overall was forecasted to increase by 8 percent for 2012. (2012 Luxury Goods
Market Worldwide 37)
Design & Furniture
Even with slower recovery, the design and furniture sector is slightly growing. With
added stability and recovery of the housing market, consumers are beginning to feel comfortable
with spending money on design and furniture. “Design luxurization”, is a new trend in
developing countries while advanced economies are seeing slower growth only about 3 percent
for 2012. (2012 Luxury Goods Market Worldwide 38)
Yachts
The Yacht segment is projected for 2012 to have the slowest growth of any of the luxury
goods segments at 2 percent growth. That is a 3 percent decrease from 2010 to 2011. With the
lingering effects of the financial world, high investment purchases have significantly been
slowed. Opportunities lay within the emerging markets but these markets would require major
infrastructure construction. (2012 Luxury Goods Market Worldwide 40)

24
Important Factors and Considerations in the Luxury Retail Industry
Input Prices
Many retail companies were affected by the severe price inflation of cotton in 2011.
Gross margin and net sales for many companies dropped from these higher prices. As cotton
prices are expected to fall and as companies are working to improve their supply chain, these
factors should reverse the previous negative impact on gross margin and help companies expand
in 2013. (Asaeda)The diamond industry has also been extremely volatile over the past few years.
Looking forward, it is expected to stabilize but many jewelry companies are still fighting to
control the supply in order to achieve pricing power.
China Referred to as “the luxury sweet spot”, China will continue to hold that title even after
slowing to single digit growth. China has recently replaced Japan as the world’s second largest
market for luxury consumption. The Chinese also hold the title as top luxury nationality: they
represent about 25 percent of all luxury purchases worldwide. With a weaker Euro and many
other depreciating currencies, Chinese consumers make 60 percent of their luxury purchases
abroad, a 37 percent increase in 2012. (“Chinese Shoppers”) It is becoming increasingly
important that luxury retailers consider the rapidly changing Chinese preferences knowing the
large impact they have on this industry. Visible logos, in the past, were the key selling points of
luxury products for Chinese consumers but now their tastes are shifting to unique and high
quality items. The demographics of luxury consumers are also changing in China. Many luxury
products in the past were purchased as business gifts and now less than 25 percent are because
the custom is slowing disappearing but allows the possibility of new consumption patterns to
younger shopper sand those power women who wish to assert their own spending power and are

25
attracted to edgier fashion. (“Chinese Shoppers”) China’s demand for luxury products is crucial
to luxury companies, especially since many of which have expansion plans that consist of
expanding internationally with a specific focus on China and the rest of Asia.
Emerging Economies
Even with China as the dominant powerhouse economy, there are also many other
emerging economies that offer high growth opportunities as well. Increasing growth rates of the
wealthy class in countries like BRIC, offer large untapped markets for the luxury industry.
BRIC today account for approximately 18-22 per cent of the world’s luxury
market. The luxury market is growing at 20-30 per cent in these countries and it is
estimated that BRIC will contribute approximately 36 per cent of the global
luxury market by 2015 and is predicted to have the largest base of luxury
consumers. (Som 75)
Within the past few years, industry leaders like Louis Vuitton Moet Hennessey (LVMH) have
opened more operations overseas in these emerging economies in order to reap the benefits.
Furthermore, other than BRIC, countries like South Africa, Colombia, Indonesia, Vietnam,
Egypt, and Turkey need to be recognized and carefully monitored as they are likely to offer
extreme growth opportunities in the near future. (Kapferer) Although the backbone of the global
economic recovery process, emerging economies do not come without their own set of unique
hurdles and challenges, such as education and knowledge level, the overwhelming population in
these countries, and distribution challenges. There is also the possibility that too much expansion
may dilute the brand name because it is more accessible and lessens the exclusivity of the
products.

26
Current Industry Trends
Long term growth and sustainability for companies in this industry will be determined by
their ability to detect and adapt to the rapid changes in the market and the consumer: “Luxury
2.0” as Bain calls it. (2012 Luxury Goods Market Worldwide 45)Just because a company has
been successful in the past does not mean that it will continue to find that same level of success
unless it quickly adapts to these changes. In order to be profitable in the next 10-15 years in the
luxury goods industry, the company must offer competitive pricing while using creative
marketing to ensure an appealing customer experience whether online or in the store using omni-
channel strategies, and lastly focusing on entertaining the consumer by having a retail culture
and an experience that will impress Generation Z. Bain also cites major structural shifts which
are occurring in the global personal luxury goods market such as: (1) after having bypassed
Japan, Greater China is now the sector’s second largest market, behind the United States; (2)
expectations are that sales at off-price (discount) outlets and ecommerce will experience 30%
and 25% growth per year, respectively; (3) an emerging generational shift, in which young
consumers are seeking significantly different experiences from luxury consumption, opting for
uniqueness over heritage, 24/7 access over exclusivity and with a greater penchant for
entertainment over mere shopping; (4) the core category is now accessories, with leather goods
and shoes at 27% of sales, becoming, for the first time, the largest piece of the market; (5)
tourism and luxury spending have become more tightly intertwined with tourists now accounting
for 40% of total luxury spending. (“Brain projects global”)

27
CHAPTER IV: INDIVIDUAL COMPANY ANALYSIS
An in-depth company and financial analysis was conducted on each of these four specific
firms in the luxury retail industry: Coach, Inc. (COH), Michael Kors Holdings Ltd. (KORS),
Tiffany & Co. (TIF), and LVMH Moet Hennessy Louis Vuitton (LVMUY). After analyzing
these companies, judgments and suggestions can be inferred to the general luxury retail industry
as a whole due to the varying characteristics of each company which serve as an acceptable
representation.
Please note that the luxury retail index is not easily accessible and therefore the data that
is compared to the industry is based on which particular index the reporting company used to
compare the data and often times was not specified. Also take notice LVMH Moet Hennessy
Louis Vuitton (LVMH) is traded on the Paris exchange and quoted in Euros so we are using
LVMH Moet Hennessy Louis Vuitton SA (LVMUY) which is listed on the equity in the United
States and is listed in dollars. The ratios and financials are equivalent to that of LVMH except
that the share price and Earnings per Share (EPS) are a divisor of 4 meaning that 1 share of
LVMH is equivalent to 4 shares of LVMUY and that ratio was used throughout for my analysis.
The financials from LVMH were listed in Euros so to keep numbers consistent, the exchange
rate from March 19th, 2013 was used of $1.29 =1.00€.
A 5 year time horizon was used for this analysis, as the past 5 years have impacted luxury
retail companies significantly which have led to important decisions for these companies that
will affect their future success.

28
For a general description and explanation of each of the ratios that were used in the ratio
analysis section for each company please refer to Appendix A.

29
Coach Company Profile:
Founded in 1941 and headquartered in New York, New York, COH has been a strong
competitor in the luxury goods industry. Throughout the past decade, COH became known as
America’s leading designer, marketer, and retailer of high quality accessories including
handbags, wallets, footwear, watches, jewelry, and wearables. COH has maintained its market
leadership in North America despite strong competition from other U.S. brands like Michael
Kors and Kate Spade. Currently COH operates over 500 stores between the U.S. and Canada
and in 2013, is planning to expand its square footage domestically by 10 percent. (“Coach Inc.-
Stock Report”) Approximately, 1/3 of stores in North America are factory outlets which has
allowed COH the ability to reach a different demographic of luxury consumers. (Swinand) In
addition to North America, COH directly operates 300 locations in Asia, specifically Japan,
China, Singapore, and Taiwan as well as recently expanding operations to Malaysia and South
Korea.. Through a multi-channel distribution strategy including boutiques in department stores,
specialty shops, and also distributor-operated location in Asia, Europe, and Latin America COH
is able to maintain these different locations. (“Coach Company Profile”)
Strategic Growth Plans and Initiatives
COH plans on expanding its addressable market through a new focus on men’s business
accessories. COH is expecting a 10 percent square footage increase in North America driven by
the opening of 10 men’s factory stores and expansion of existing stores. As for international
expansion, COH plans to increase their present in markets by introducing 30 dual gender stores
in China and 13 stores in Japan. This increases COH’s footprint in these markets by 35 percent
and 10 percent respectively. The main focus for male stores will be in Asia due to the general

30
belief that Asian men are more fashion conscious. Overall, COH projects a $12 billion market
for the men’s market and of that, China is responsible for about $3.2 billion. (“Coach Inc.-Stock
Report”)
SWOT Analysis--COH
Strengths • Strong management team • Diverse channels of retail
distribution (full price, outlet, internet, catalog)
• Leading position in the men’s market
• High operating margins make COH attractive to investors
Weaknesses • Known only for handbags not rest
of product line • Dilution of brand due to increasing
numbers of factory outlets • Due to lower price point, customers
are more aspirational and sensitive to the current economic state
Opportunities • Macro trend of consumer
preferences from logo handbags to leather
• Major expansion in China • Wealth and demand from emerging
economies • Due to economic hardship,
consumers are purchasing more accessories as opposed to apparel
Threats • Decline in global consumer
spending • Increasing competition • Changing consumer preferences
Table 1: SWOT Analysis--COH
Company Performance COH is a stable company that has taken some hard hits recently but overall maintains an
extremely sound foundation and strong overall performance. Revenue has increased yearly even
during the Great Recession. In 2012, revenue grew by 14.53 percent and between the two most
recent quarters of 2013 it grew by more than double that, reaching 29.54 percent.. Net income
took a hit in 2009 and fell by 20.3 percent but has been back in the high double digits ever since

31
and in 2012, it grew by 17.93 percent. Having extremely little debt and ample cash of $917
million, leaves opportunity for growth and expansion. (“Coach Inc.-Stock Report”)
Stock Performance
As of March 11th, 2013, COH, at close, was trading at $49.50 with a 52 week high of
$79.70 and a low of $45.87. COH also paid a recently higher dividend of $1.20 with a yield of
2.40 percent. The company has 280.78 million shares outstanding with institutions holding 91.90
percent and insiders only retaining 0.94 percent ownership. (“COH-Key Statistics”) S&P Net
Advantage gives COH a quality ranking of B+. (“Coach Inc.-Stock Report”) Since 2008, the
stock has been quite volatile mostly in turn from the economic downturn which triggered more
conservative spending especially from the large base of aspirational consumers that Coach
attracts.
Figure 1: Stock Price 5 years--COH: Yahoo Finance

32
Looking at year to date stock price comparison back in February, COH has performed the
worst with almost consistently staying beneath all other stocks and the index as well. COH’s
stock price has been increasing throughout March and should be more attractive now and in the
future.
Figure 2: YTD Stock Price Comparison: Bigcharts.com

33
Ratio Analysis
Short Term Liquidity
COH had a current ratio in 2012 of 2.51. If need be, COH could have paid off all of its
short term liabilities with short term assets two and a half times. In 2011, 2.45 was the lowest
that the current ratio has ever been and even then, COH could have paid off over twice its
amount of debt. (“COH-Key Ratios”)
Figure 3: Current Ratio--COH
Asset Management
Coach has a fixed asset turnover of 7.77 for 2012.The upward trend signals COH has
been increasingly becoming more effective at using its fixed assets at generating greater levels of
revenue.
At 1.66, COH has a total asset turnover that has been steadily increasing since 2007 with
only a .01 drop in 2009. This trend may have to do with pricing strategy and factory outlets so
COH’s total assets are generating more revenue. (“COH-Key Ratios”)
0
1
2
3
4
2008 2009 2010 2011 2012 TTM
Current Ratio-COH

34
Figure 4: Asset Management--COH
Debt Management COH has held very little debt with its highest debt to equity ratio of 0.02 in 2010. In
2012, COH had a D/E equal to 0; therefore had the ability to pay for all of its assets with equity
as opposed to debt. A strong credit rating and holding little debt are key factors when trying to
finance new projects.
Comparatively, COH and KORS are in the strongest positions with financing their assets
with the lowest amount of debt, none. (“COH-Key Ratios”)
Figure 5: D/E ratio--COH
0
5
10
2008 2009 2010 2011 2012 TTM
Asset Management-COH
Total Asset Turnover Fixed Asset Turnover
0
0.005
0.01
0.015
0.02
0.025
2008 2009 2010 2011 2012
D/E --COH

35
Figure 6: D/E--Comparative
Profitability Ratios
In 2012, COH had a profit margin of 21.8% meaning it earned 21.8% on every dollar in sales. Although slightly lower than years prior, COH still maintains the strongest profit margin by far relative to the industry and its competitors. (Constanza)
Figure 7: Profit Margin—Comparative
“Copyright © (2013) Value Line, Inc. All Rights Reserved Worldwide. “Value Line” is a registered trademark of Value Line, Inc.”
0 0
0.3 0.2
0.8
0
0.2
0.4
0.6
0.8
1
COH KORS TIF LVMUY IndustryAverage
D/E--comparative
10.70
21.80
15.70 12.11 10.90
20.80
15.30 12.69
0.00
5.00
10.00
15.00
20.00
25.00
TIF COH KORS LVMUY
Profit Margin--comparative
2012 2013E

36
After Return on Assets (ROA) fell to 25.77% from 2008 to 2009, ROA for COH is at
36.2% in 2012. If this trend continues, Coach could prove to be earning higher return for the
level of assets it has.
With 57.63% Return on Equity (ROE), Coach is an extremely attractive investment for
investors with such a high percentage of return for their investment. ROE hasn’t dropped below
38.82% (2009). (“COH-Key Ratios”)
Figure 8: Return on Assets & Return on Equity--COH
010203040506070
2008 2009 2010 2011 2012 TTM
Return on Assets & Return on Equity--COH
ROA ROE

37
Market Value Ratios
Current Price to Earnings (P/E) ratio is 13.7. The P/E multiple for COH has been steadily
declining since 2009 which is a signal that investors are pessimistic about the future earnings of
COH, especially relative to other competitors in the industry. Investors, over time, are willing to
pay less for $1 of current earnings. (“COH-Key Ratios”)
Figure 9: P/E Ratio--COH
Figure 10: P/E Ratio--Comparative
0
5
10
15
20
25
2008 2009 2010 2011 2012 TTM
P/E Ratio--COH
0
20
40
60
80
100
2008 2009 2010 2011 2012 TTM
P/E Ratio--comparative
COH KORS TIF LVMUY

38
The current Price to Cash Flow (P/CF) for COH is 11.8. COH is a financially stable
company so it is strange to see a downward trend in price to cash flow especially with the
expansive expansion plans. The market doesn’t believe that COH will be as financially healthy
as compared to in the past or to other companies. (“COH-Key Ratios”)
Figure 11: P/CF Ratio-COH
Figure 12: P/CF Ratio--Comparative
02468
101214161820
2008 2009 2010 2011 2012 TTM
P/CF--COH
0
20
40
60
80
2008 2009 2010 2011 2012 TTM
P/CF--comparative
COH KORS TIF LVMUY

39
Efficiency Ratios
Inventory turnover has been increasing since 2007 and for the past 4 years has stayed
around the 2-3 mark. Turnover was at 2.80 in 2012 but has increased to 2.91 for the trailing
twelve months (TTM). As the global economy recovers we should see a faster turnover in
inventory due to an increase in demand. (“COH-Key Ratios”)
Figure 13: Inventory Turnover-- COH
Days Sales Outstanding (DSO) declined until 2010 and then started to trend back up. The
TTM is at 16.11 which is a large difference from 2012 of 12.16. This continuous upward trend is
somewhat concerning because it’s taking COH longer to collect its receivables. Even though
COH has ample liquidity, DSO is important for cash flows. (“COH-Key Ratios”)
Figure 14: Days Sales Outstanding--COH
22.22.42.62.8
3
2008 2009 2010 2011 2012 TTM
Inventory Turnover--COH
0
5
10
15
20
2008 2009 2010 2011 2012 TTM
Days Sales Outstanding-COH
40
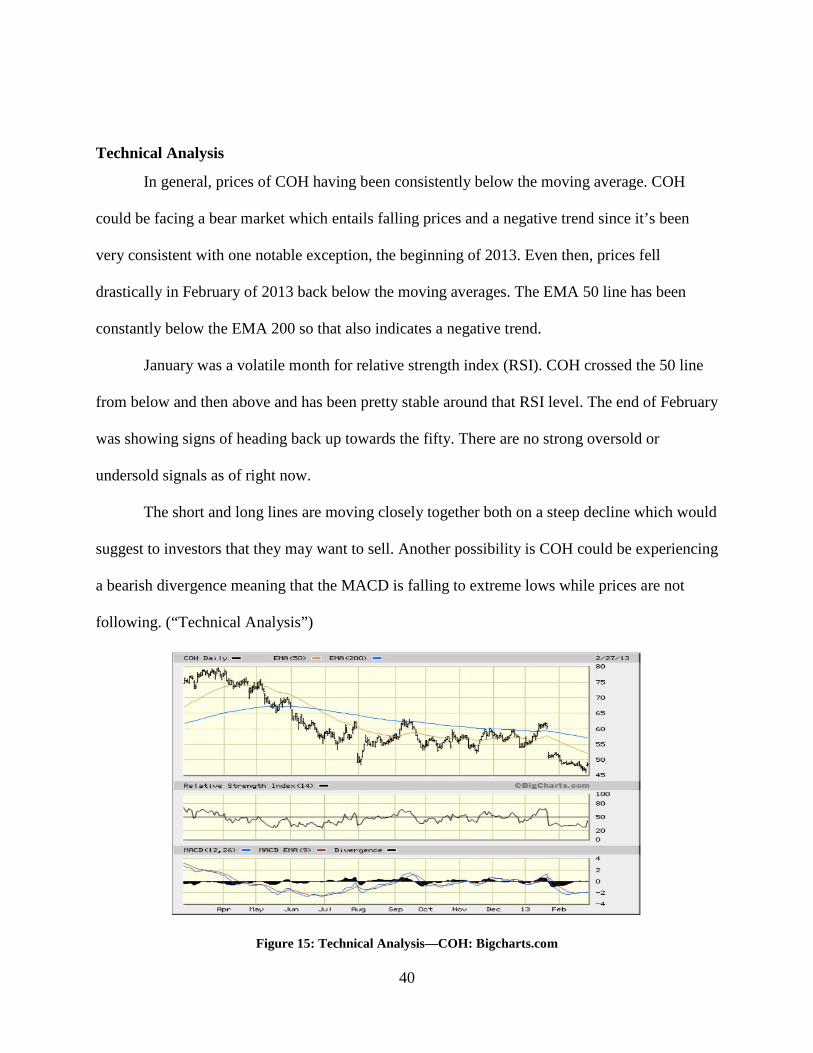
Technical Analysis
In general, prices of COH having been consistently below the moving average. COH
could be facing a bear market which entails falling prices and a negative trend since it’s been
very consistent with one notable exception, the beginning of 2013. Even then, prices fell
drastically in February of 2013 back below the moving averages. The EMA 50 line has been
constantly below the EMA 200 so that also indicates a negative trend.
January was a volatile month for relative strength index (RSI). COH crossed the 50 line
from below and then above and has been pretty stable around that RSI level. The end of February
was showing signs of heading back up towards the fifty. There are no strong oversold or
undersold signals as of right now.
The short and long lines are moving closely together both on a steep decline which would
suggest to investors that they may want to sell. Another possibility is COH could be experiencing
a bearish divergence meaning that the MACD is falling to extreme lows while prices are not
following. (“Technical Analysis”)
Figure 15: Technical Analysis—COH: Bigcharts.com
41
Michael Kors Company Profile
A hot new ticker item—KORS, just as recently as December 2011, became a publically
traded company. Since 1981 KORS has been focused on the design, marketing, distribution, and
retail and wholesale of women’s and men’s apparel along with women’s accessories including
handbags, wallets, footwear, watches, and fragrances. Even though based in Hong Kong, KORS
has an international footprint in 74 different countries and maintains a reputation of being a
lifestyle, jet-setter brand. This lifestyle brand appeals to different target markets through two
primary collections, the Michael Kors luxury collection and the MICHAEL Michael Kors
accessible luxury collection. Since founding, the Michael Kors collection has been focused on
the combination of elegance and a sporty attitude to create that jet setter image. In 2004, KORS
noticed an increase in demand for more accessible luxury goods. In turn, MICHAEL Michael
Kors was created in order to fill that void with its main focus on accessories and a lower price
point to appeal to a younger generation. (“KORS Corporate Profile”)
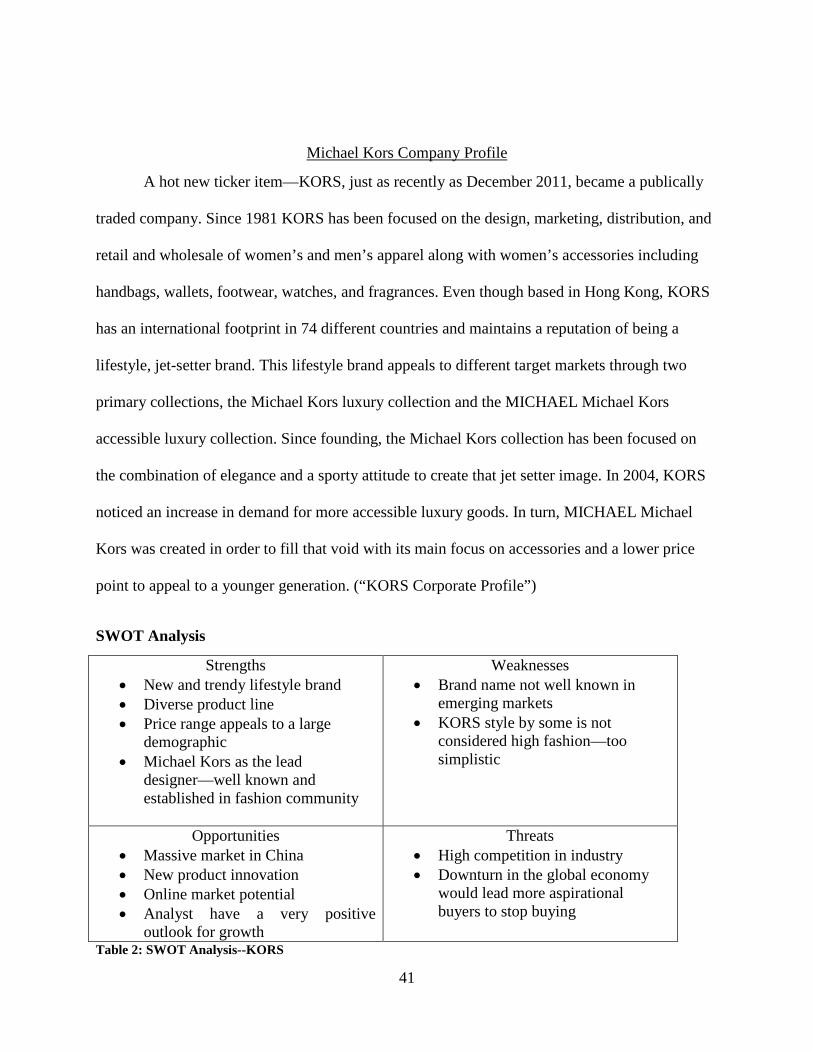
SWOT Analysis
Strengths • New and trendy lifestyle brand • Diverse product line • Price range appeals to a large
demographic • Michael Kors as the lead
designer—well known and established in fashion community
Weaknesses • Brand name not well known in
emerging markets • KORS style by some is not
considered high fashion—too simplistic
Opportunities • Massive market in China • New product innovation • Online market potential • Analyst have a very positive
outlook for growth
Threats • High competition in industry • Downturn in the global economy
would lead more aspirational buyers to stop buying
Table 2: SWOT Analysis--KORS

42
Strategic Growth Plans and Initiatives
As of March 2012, KORS maintains 191 retail stores, 46 of which are throughout Europe
and Japan and also operates through its wholesale chain in 2,027 department stores in North
America and 650 internationally. KORS has a large geographical presence but international
expansion will continue to focus on Europe, China, and other underpenetrated markets. KORS is
also focus on growing its product lines to put more emphasis on other items such as fragrances,
shoes, and watches. (Smith)
Company Performance
Growth for KORS since its IPO has been explosive. From 2011 to 2012, revenue grew by
62.14 percent and the year prior by 58.07 percent net income increased this past year by about
101 percent and is projected to hold that type of growth for this upcoming year. KORS is a
financially healthy company with extremely low amounts of debt and large amounts of cash with
$406 million as of December 2012. (“Michael Kors Holdings Ltd KORS”)
Stock Performance
On March 12th, 2013, KORS was trading at $56.28 at close. KORS has a 52-week high of
$65.10 and a low of $35.50. (“Michael Kors Holdings Ltd KORS) 199.59 million shares are
outstanding and KORS is owned 73.60% by institutions and 21.74% by insiders. The beta of
KORS is 2.866 and being a high growth stock, KORS does not pay a dividend, rather investing
their earnings back into the company in order to fuel future growth. (“KORS-Key Statistics.”)

43
Looking at year to date stock price comparison back in February, KORS has seen the
most growth in its stock and it spiking to new rates much higher than the rest but has come
down to an average level near Tiffany & Co. but still significantly higher than the rest.
Figure 16: Stock Price 5 years--KORS: Yahoo Finance
Figure 17: YTD Stock Price Comparison: Bigcharts.com

44
Ratio Analysis
Short Term Liquidity
Last quarter, KORS had a current ratio of 4.81 which is more than a 1.5 increase from
2012 and has been increasing since its Initial Public Offering. In 2012 the ratio was 2.81
meaning that if needed, KORS could have paid off all of its short term liabilities with short term
assets almost three times. (“KORS-Key Ratios”)
Figure 18: Current Ratio--KORS: Morningstar.com
Asset Management
As each year passes, KORS is able to generate a higher fixed asset turnover signaling that
it is able to earn more revenue with its fixed assets. In 2012 the fixed asset turnover was 8.98 and
increased for the TTM to 9.03. If this trend continues into the future, KORS should expect higher
sales for fixed assets.
Total asset turnover increased from prior years from 1.80 in 2010 to 2.43 in 2012 KORS
is showing the ability to turn assets into cash. (“KORS-Key Ratios”)
0
2
4
6
2010 2011 2012 Last Quarter
Current Ratio--KORS

45
Figure 19:Asset Turnover--KORS: Morningstar.com
Debt Management
KORS has a debt to equity ratio of 0 as of 2012. This implies that all debt will be paid off
and will not be financing any of its assets with debt but rather, with equity.
Figure 20: D/E Ratio--KORS: Morningstar.com
Even though most companies in this industry have extremely low debt to equity ratios,
0
2
4
6
8
10
2010 2011 2012 TTM
Asset Turnover--KORS
fixed asset turnover total asset turnover
0
0.5
1
1.5
2
2.5
2010 2011 2012 12-Dec
D/E Ratio-KORS

46
KORS and COH comparatively are putting themselves in an even stronger and more financially
attractive position to investors by holding no debt. (“KORS-Key Ratios”)
Figure 21: D/E Comparative
Profitability Ratios In 2012, KORS earned a 15.7 percent profit margin. Comparatively, KORS has a greater
profit margin that TIF and LVMUY but still about 5 percent less than COH. KORS earned
$15.70 for every $1.00 in sales in 2012. (Patrikis)
Figure 22: Profit Margin—Comparative: Value Line & Net Advantage
“Copyright © (2013) Value Line, Inc. All Rights Reserved Worldwide. “Value Line” is a registered trademark of Value Line, Inc.”
0 0
0.3 0.2
0.8
00.20.40.60.8
1
COH KORS TIF LVMUY IndustryAverage
D/E--comparative
10.70
21.80 15.70
12.11 10.90
20.80
15.30 12.69
0.005.00
10.0015.0020.0025.00
TIF COH KORS LVMUY
Profit Margin--comparative
2012 2013E

47
Return on Assets has been steadily increasing since 2010 from 10.92% to 23.49% in 2012
and 28.64% as the TTM. COH is steadily earning more money on less investment in assets.
Initially increasing from 2010 to 2011, Return on Equity has been dropping for KORS
from 65.25% in 2011 to 43.38% in 2012 and 36.80% as TTM. Normally a decreasing trend
would be worrisome but ROE is still above the industry average. (“KORS-Key Ratios”)
Figure 23: Return on Assets & Return on Equity--KORS: Morningstar
010203040506070
2010 2011 2012 LastQuarter
Current
Return on Assets & Return on Equity--KORS
ROA ROE
48
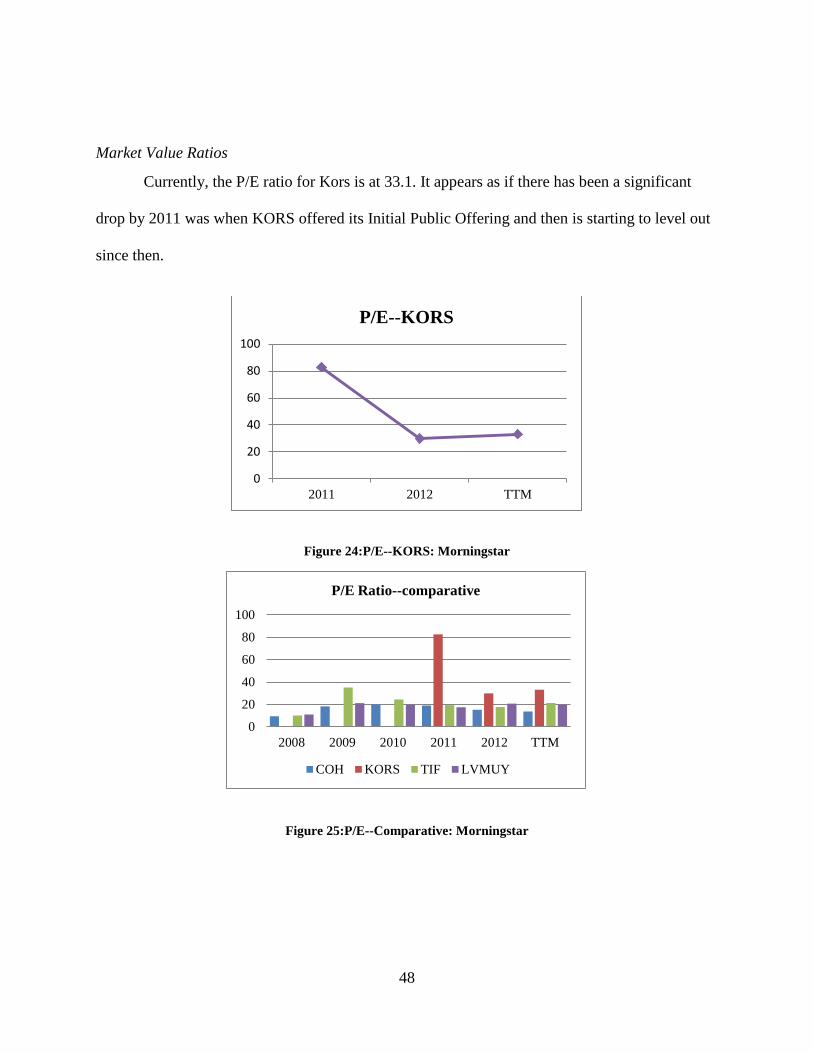
Market Value Ratios
Currently, the P/E ratio for Kors is at 33.1. It appears as if there has been a significant
drop by 2011 was when KORS offered its Initial Public Offering and then is starting to level out
since then.
Figure 24:P/E--KORS: Morningstar
Figure 25:P/E--Comparative: Morningstar
0
20
40
60
80
100
2011 2012 TTM
P/E--KORS
0
20
40
60
80
100
2008 2009 2010 2011 2012 TTM
P/E Ratio--comparative
COH KORS TIF LVMUY
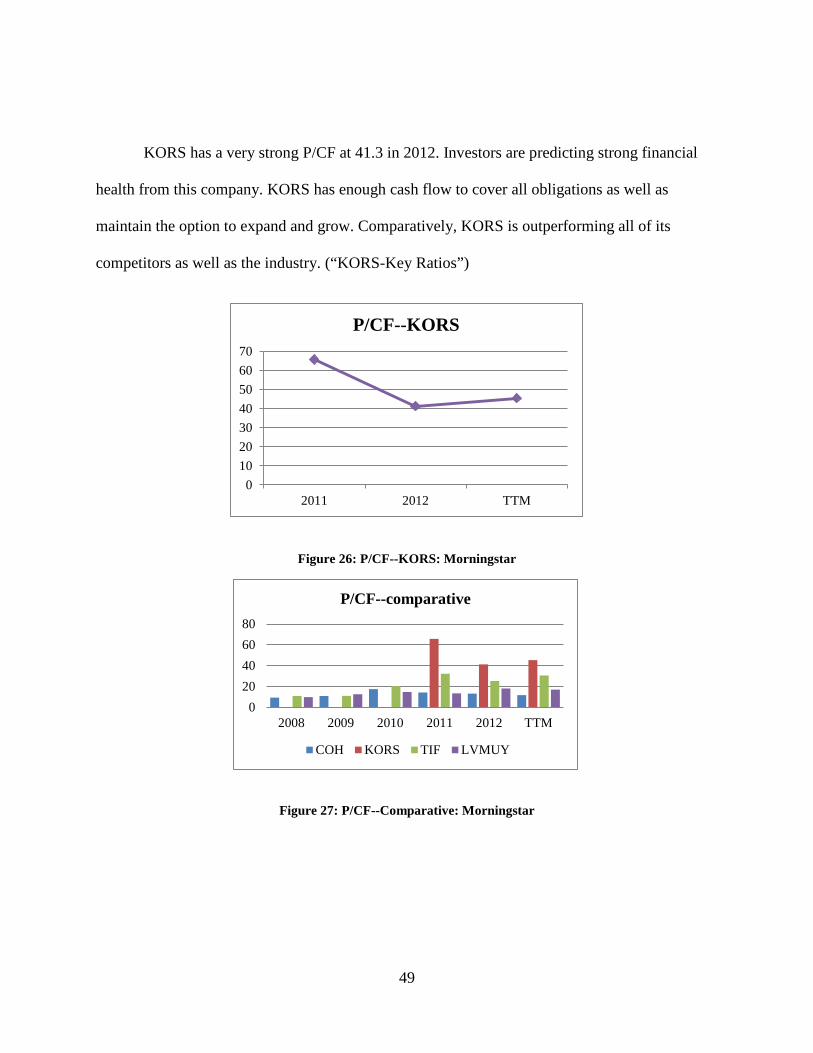
49
KORS has a very strong P/CF at 41.3 in 2012. Investors are predicting strong financial
health from this company. KORS has enough cash flow to cover all obligations as well as
maintain the option to expand and grow. Comparatively, KORS is outperforming all of its
competitors as well as the industry. (“KORS-Key Ratios”)
Figure 26: P/CF--KORS: Morningstar
Figure 27: P/CF--Comparative: Morningstar
010203040506070
2011 2012 TTM
P/CF--KORS
020406080
2008 2009 2010 2011 2012 TTM
P/CF--comparative
COH KORS TIF LVMUY

50
Efficiency Ratios
The inventory turnover rate for KORS has also slowed. In 2011 inventory turnover was at
3.92 and 2012 decreased to 3.61 and TTM is at 2.74. But relative to the industry, KORS is
turning its inventory over more frequently than the industry which is at 1.6. (“KORS-Key
Ratios”)
Figure 28: Inventory Turnover--KORS: Morningstar
Days sales outstanding is back on the rise and shows that, now, KORS is able to collect
its money faster now than 3 years ago. In 2012, it took 35.86 days to collect and TTM is at
32.08. The faster that KORS can collect its money the sooner it can be reinvested for future
endeavors. (“KORS-Key Ratios”)
Figure 29: Days Sales Outstanding--KORS: Morningstar
012345
2010 2011 2012 TTM
Inventory Turnover--KORS
0
20
40
60
80
2010 2011 2012 TTM
Days Sales Outstanding--KORS

51
Technical Analysis
The EMA 50 for KORS is above EMA 200 and both are trending upwards showing
strong upward momentum for this stock. Price of KORS is once again back above it EMA 50 so
that could signal a buy. The RSI hit just about 80 mid-February and therefore signaling that
KORS may be being overbought and then sharply decrease back down to near 50 where it
maintains its average currently. With the returns and projected growth for KORS many investors
see the growth potential but may be paying too much relative to what it’s worth. It is rising at a
more subtle pace which could prove to be more sustainable than any sharp increases which many
believe would just return to normal level soon after. Currently the MACD (12,26) line is below
the MACD (9) but any cross of these lines could be a signal to buy. (“Technical Analysis”)
Figure 30: Technical Analysis--KORS: Bigcharts.com

52
Tiffany & Co. Company Profile
Tiffany and Co. (TIF) just celebrated its 175th anniversary and still maintains a strong
image of being a top designer, manufacturer, and retailer of fine jewelry and other specialty
items like timepieces, sterling silver, crystal, and leather accessories. Although diversified within
product lines, 91 percent of its net sales in 2012 can be attributed to jewelry. (“Tiffany & Co—
Stock Report”) Although based in New York, TIF maintains four reportable segments including
the Americas, Asia-Pacific, Japan, and Europe. In 2012, the Americas accounted for 50 percent
of net sales, Asia Pacific at 21 percent, Japan at 17 percent, and Europe with 12 percent. These
sales revenues are not only attributed to stores but also business to business transactions, Internet
and catalogue sales, and also wholesale operations. (“Tiffany & Co—Stock Report”) After
recently becoming more vertically integrated, TIF retains more control over its supply and
sourcing issues of diamonds. This allows TIF to be more flexible with supply and demand as
well as changing consumer preferences which is becoming ever more important.

53
SWOT Analysis
Strengths • Strong identifiable brand –175th
anniversary • Vertical integration leads to greater
control over supply chain • Internally produced 60% of what
was sold • High capital budget for expansion • Use of e-commerce: operating
website in 13 countries • Pricing power in the industry
Weaknesses • Majority of sales comes from only
US and Japan • Negative same-store sales growth in
the Americas • Custom of diamond engagement
ring could decline and diamonds are the main sale for TIF
• Exclusive designer, Elsa Peretti, accounts for 10% of TIFs sales
Opportunities • TIF is underpenetrated in emerging
economies • International expansion in Europe • New product development
Threats • Higher taxes for wealthy may
decrease spending • High end jewelry is more
aspirational than other categories • High competition in the domestic
diamond industry • Volatility in diamond and financial
markets decrease tourist sales Table 3: SWOT Analysis--TIF
Strategic Growth Plans and Initiatives
In the beginning of 2013, TIF opened a store in Prague, Czech Republic and will in the
near future open and develop stores in other emerging economies like Russia and India. Analysts
believe that TIF still has more room for expansion within Europe and China. Also testing a new
demographic, TIF is opening up smaller locations in rural and suburban areas as opposed to the
norm of mainstream locations in big cities. TIF is also attempting to expand its product line into
more non-jewelry areas such as fine gifts and accessories. (“Tiffany & Co TIF”)
Company Performance
Although TIF saw negative revenue growth from 2008-2010, TIF recovered fairly
quickly for the depths of the recession where fine jewelry and gifts are more aspirational than

54
ever. In 2011, as the economy recovered, revenue grew by 13 percent and in 2012 it grew by
18.09 percent. On the other hand, net income only took a fall in 2009. Net income has generally
averaged about 20 percent-30 percent except for, notably, in 2011 when net income grew by
38.35 percent. (“Tiffany & Co-Stock Report”) TIFs cash availability is strong for how much it
fluctuates; this fluctuation in cash can most likely to be attributed to TIFs expansion initiatives.
Stock Performance
Although the stock has been volatile in the past year, as of March 11th, 2013, TIF closed
at $69.11 which was near its 52-week high of $74.20 (low of $49.72). (“Tiffany & Co. TIF”) TIF
is owned 87.40 percent by institutions and 11.98 percent by insiders with 126.77 million shares
outstanding offering a dividend of $1.28 and yield of 1.82 percent. There has also been an
increase in insider buying which is a positive signal for TIF investors. S&P gives TIF a quality
ranking of an A-. Given a beta of 1.78, a positive trend for the market would mean even better
news for TIF. (“Tiffany & Co-Stock Report”)
Figure 31: Stock Price 5 years--TIF: Yahoo Finance

55
Comparatively, over the past year TIF has remained a competitor as far as stock price
beating out other companies and the industry except for Michael Kors.
Figure 32: YTD Stock Price Comparison: Bigcharts.com

56
Ratio Analysis
Short Term Liquidity
Starting at a current ratio of 3.15 in 2008, TIF increased its current ratio to 4.61 in 2012
and a TTM of 5.46. TIF is an extremely strong position to pay for its current liabilities: if
needed, TIF could pay them off almost five times. This signals strength and plenty of cash on
hand which can be used for other endeavors, like expansion. (“TIF-Key Ratios”)
Figure 33: Current Ratio--TIF: Morningstar
Asset Management As of 2012, fixed asset turnover increased to 5.09 for TIF. This indicates that Tiffany is
increasing their efficiency of using its fixed assets to generate more revenue.
On the other hand, Tiffany is staying right around its average for total asset turnover. TIF
saw a slight decline and a total asset turnover of .92 in 2012. This may be due to their high
pricing strategy. (“TIF-Key Ratios”)
0
2
4
6
2008 2009 2010 2011 2012 TTM
Current Ratio--TIF

57
Figure 34: Asset Turnover--TIF: Morningstar
Debt Management As of 2012, TIF had a D/E ratio of .23 which is a normal ratio for this industry. Only 23
percent of assets are financed with debt and that can be attributed to strong cash availability.
Comparatively, TIF is right around the average of these companies and is lower than the
industry’s average. (“TIF-Key Ratios”)
Figure 35: D/E--TIF: Morningstar
0
2
4
6
2008 2009 2010 2011 2012 TTM
Asset Turnover--TIF
Asset Turnover Fixed Asset Turnover
00.05
0.10.15
0.20.25
0.30.35
2008 2009 2010 2011 2012 LastQuarter
D/E--TIF

58
Figure 36: D/E Comparative--Morningstar
Profitability Ratios TIF has seen a decrease in profit margin from 2011 to 2012 to 10.7 percent but is
forecasted to increase slightly in 2013 to 10.9 percent. Comparatively, TIF has the lowest profit
margin and therefore makes only 10.7 percent on each $1.00 in sales. (Hellman)
Figure 37: Profit Margin--Comparative
“Copyright © (2013) Value Line, Inc. All Rights Reserved Worldwide. “Value Line” is a registered trademark of Value Line, Inc.”
0 0
0.3 0.2
0.8
00.10.20.30.40.50.60.70.80.9
COH KORS TIF LVMUY IndustryAverage
D/E--comparative
10.70
21.80 15.70
12.11 10.90
20.80
15.30 12.69
0.005.00
10.0015.0020.0025.00
TIF COH KORS LVMUY
Profit Margin--comparative
2012 2013E

59
Return on Assets took a hit with the recession and was at the lowest in 2009 but since
then has been rising and is at 11.13 percent for 2012.
Similar to ROA, Return on Equity fell to 13.64 percent in 2009 but has been steadily
increasing over the past few years. For 2012, ROE was at 19.41 percent meaning that investors
received almost a 20 percent return on their investment. (“TIF-Key Ratios”)
Figure 38: Return on Assets & Return on Equity--TIF: Morningstar
0
10
20
30
2008 2009 2010 2011 2012 TTM
Return on Assets & Return on Equity--TIF
ROA ROE

60
Market Value Ratios
With a P/E ratio at 21.20, investors are willing to pay $21.20 for $1.00 of TIF’s current
earnings.
Figure 39: P/E--TIF: Morningstar
Although less than the industry’s, TIF has a relatively high P/E compared to the other
companies analyzed, meaning that investors are expecting to receive higher earnings in the future
from TIF. (“TIF-Key Ratios”)
Figure 40: P/E Ratio—Comparative: Morningstar
010203040
2008 2009 2010 2011 2012 TTM
P/E--TIF
020406080
100
2008 2009 2010 2011 2012 TTM
P/E Ratio--comparative
COH KORS TIF LVMUY

61
At 30.6, TIF has a strong Price to Cash Flows which is about twice strong as the
Industry’s ratio. The ratio shows that TIF is a financially sound and stable company with cash to
allocate to new product development as well as expansion into global markets. (“TIF-Key
Ratios”)
Figure 41: P/CF--TIF: Morningstar
Figure 42: P/CF--Comparative
05
101520253035
2008 2009 2010 2011 2012 TTM
P/CF--TIF
0
20
40
60
80
2008 2009 2010 2011 2012 TTM
P/CF--comparative
COH KORS TIF LVMUY

62
Efficiency Ratios
Inventory turnover is quite low at .81 in 2012 and an even lower turnover ratio for the
TTM of .73. Due to the decline in purchasing power, fewer consumers have been making
expensive gift or purchases for themselves, but as recovery continues and mature markets
recover, inventory should increase as well. (“TIF-Key Ratios”)
Figure 43: Inventory Turnover--TIF: Morningstar
With credit tightening, days sales outstanding is improving and Tiffany is receiving their
accounts receivable sooner from 22.54 days in 2008 to 18.54 days in 2012 and 16.12 days for the
TTM. Shortening the number of days is crucial so TIF can reinvest and grow the company.
(“TIF-Key Ratios”)
Figure 44: Days Sales Outstanding--TIF: Morningstar
0
0.5
1
1.5
2008 2009 2010 2011 2012 TTM
Inventory Turnover--TIF
0
10
20
30
2008 2009 2010 2011 2012 TTM
Days Sales Outstanding--TIF

63
Technical Analysis
At the end of February, the short term EMA 50, crossed back up over the EMA 200
which with time could signal a positive trend for TIF. Previously, the EMA 50 had been below
the 200 but prices were still above the trend line, indicating a bullish market, with one notable
exception during November and December of 2012. TIF released an unimpressed earnings report
and didn’t meet many of their targets this past holiday season. A dip in RSI concurrent with the
low earnings released in November and December but went back up to about 60 where it has
maintained its average since. The MACD line is indicating a buy signal because it is above the
signal line consistently and appears to be fairly stable at that level. (“Technical Analysis”)
Figure 45: Technical Analysis-- TIF: Bigcharts.com

64
LVMH Moet Hennessy Company Profile
The global luxury goods leading conglomerate of companies, Louis Vuitton Moet
Hennessy (LVMH), maintains a portfolio of over sixty different brands and all of which are able
to achieve leadership and pricing power within their respective product groups. Founded in 1854
in Paris, LVMUY is facing the maturity stage in the lifecycle but also is in the acquisition stage
for luxury goods investments. There are five main segments of LVMUY including 1) fashion
and leather goods; 2) wines and spirits; 3) perfumes and cosmetics; 4) watches and jewelry; and
5) selective retailing. Operating over 3,400 stores worldwide, there are six main areas that
produce a significant amount of revenue for LVMUY in 2012: 28 percent of revenues from Asia
(excluding Japan), 23 percent from the United States, 20 percent from Europe (excluding
France), 11 percent from France, 10 percent from other markets, and 8 percent from Japan.
(Arnault)
SWOT Analysis
Strengths • Present in every sector of luxury
goods industry: diversified product lines
• Good geographical balance of revenue
• World’s leading luxury goods conglomerate
• Pricing power due to the well established brands
Weaknesses • Facing mature growth stage • Perfume and cosmetics are the
largest of the mix and those categories offer the lowest amount of future growth
• Bulk of production in Europe
Opportunities • Increased consumption by power
females • New product development • Focused retailing on emerging
markets
Threats • Geo-political events could impact
travel • Chinese preferences changing • Hard exposure to foreign exchange
risk
Table 4: SWOT Analysis--LVMUY
65
Strategic Growth Plans and Initiatives
LVMUY has been planning and expanding since its founding but over a longer time
frame than most other luxury companies. Although quite diversified as to geographic locations
already, there is still room for expansion within the emerging markets. LVMUY is mainly
focused on its expansion of product lines and brands. The brands in the portfolio are what allow
LVMUY brands to enjoy premium pricing power and the ability to maintain its competitive
advantage. (“LVMH-Stock Report”)
Company Performance
Despite barely negative growth in 2009, LVMUY has been growing each year but at a
decreasing rate. LVMH offers attractive returns: in 2011 of 16.34 percent and a TTM of 11.30
percent. Net income has been volatile from year to year. After losing 14.88 percent in 2009,
LVMUY grew by 68.20 percent in 2010 and then only by 4.40 percent the following year and is
about 12.38 percent for TTM. (“LVMH”) Cash and liquidity for this company are quite high as
well. As of June 2012, LVMUY had $3,355.29 million of cash on hand which allows for the
large acquisitions, like Bulgari.
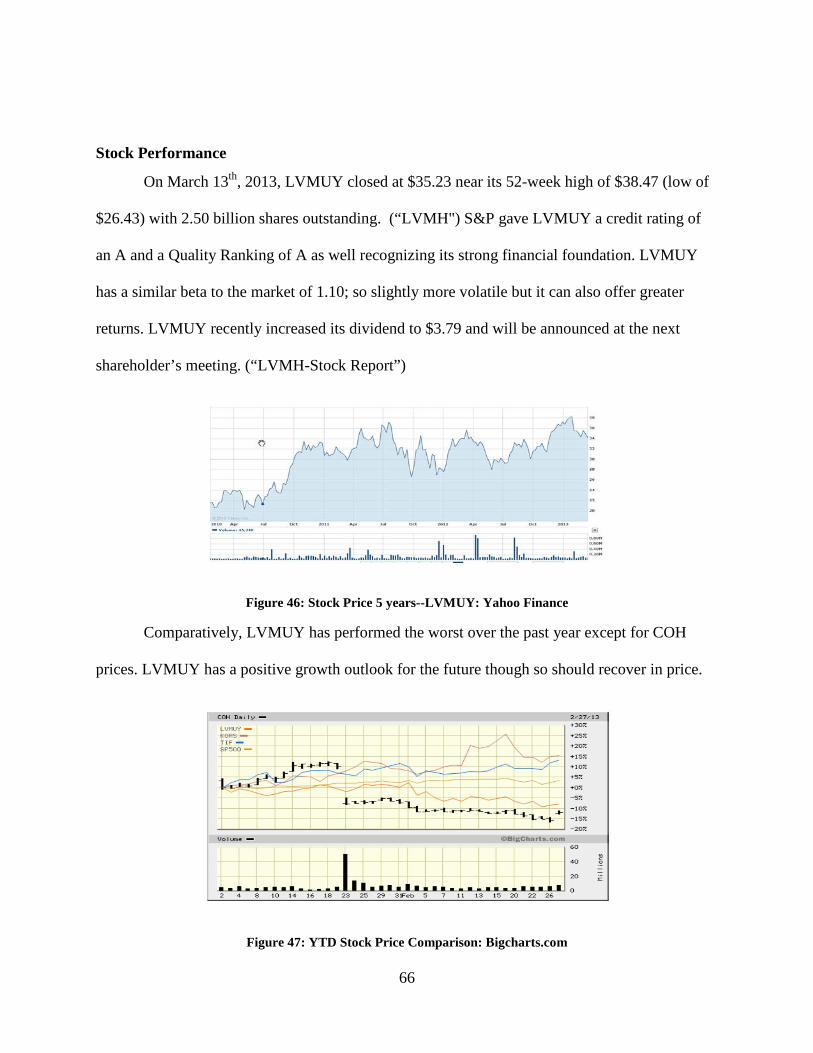
66
Stock Performance
On March 13th, 2013, LVMUY closed at $35.23 near its 52-week high of $38.47 (low of
$26.43) with 2.50 billion shares outstanding. (“LVMH") S&P gave LVMUY a credit rating of
an A and a Quality Ranking of A as well recognizing its strong financial foundation. LVMUY
has a similar beta to the market of 1.10; so slightly more volatile but it can also offer greater
returns. LVMUY recently increased its dividend to $3.79 and will be announced at the next
shareholder’s meeting. (“LVMH-Stock Report”)
Figure 46: Stock Price 5 years--LVMUY: Yahoo Finance
Comparatively, LVMUY has performed the worst over the past year except for COH
prices. LVMUY has a positive growth outlook for the future though so should recover in price.
Figure 47: YTD Stock Price Comparison: Bigcharts.com

67
Ratio Analysis
Short Term Liquidity
Current Ratio for LVMUY at TTM is at 1.4. Current liabilities could be paid 1.4 times by
current assets. The current ratio has been on a slight decline since 2008 but is still at a safe level
for this industry. (“LVMUY-Key Ratios”)
Figure 48: Current Ratio--LVMUY: Morningstar
0
0.5
1
1.5
2
2008 2009 2010 2011 TTM
Current Ratio--LVMUY

68
Asset Management
The fixed asset turnover for TTM is 3.46 and has been increasing from 2.99 in 2008.
Although LVMUY has a large number of fixed assets, it is consistently generating more revenue
from those assets.
Total asset turnover for the TTM was .56 without much volatility over the years meaning
that LVMUY isn’t really improving their revenue from increasing total assets. (“LVMUY-Key
Ratios”) This is especially important when it comes to LVMUY and its acquisition purchases.
Management needs to be focused on the value added to the overall portfolio.
Figure 49: Asset Management Ratios--LVMUY: Morningstar
0
1
2
3
4
2008 2009 2010 2011 TTM
Asset Management Ratios--LVMUY
Fixed Asset Turnover Total Asset Turnover

69
Debt Management
The debt to equity ratio for LVMUY has dropped to .17 for the TTM. LVMUY is
financing less of its assets with debt than in previous years. This helps LVMUY to add stability
to its earnings. (“LVMUY-Key Ratios")
Figure 50: D/E Ratio--LVMUY: Morningstar
Comparatively speaking, LVMUY has a lower debt to equity ratio than only TIF and the
industry as a whole but at 0.2 still maintains a healthy ratio with enough debt to leverage projects
but also a low enough amount to receive an A credit rating.
Figure 51: D/E Comparison
0
0.1
0.2
0.3
0.4
2008 2009 2010 2011 TTM
Debt/Equity --LVMUY
0 0
0.3 0.2
0.8
0
0.2
0.4
0.6
0.8
1
COH KORS TIF LVMUY IndustryAverage
D/E--comparative
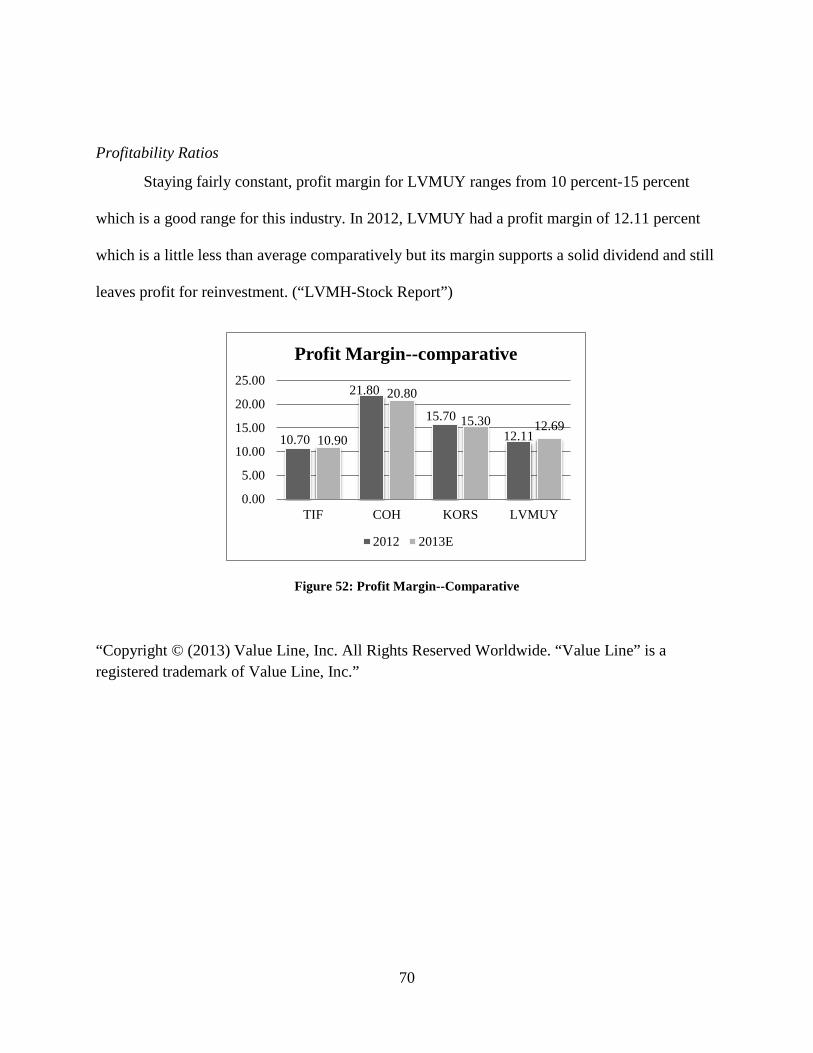
70
Profitability Ratios
Staying fairly constant, profit margin for LVMUY ranges from 10 percent-15 percent
which is a good range for this industry. In 2012, LVMUY had a profit margin of 12.11 percent
which is a little less than average comparatively but its margin supports a solid dividend and still
leaves profit for reinvestment. (“LVMH-Stock Report”)
Figure 52: Profit Margin--Comparative
“Copyright © (2013) Value Line, Inc. All Rights Reserved Worldwide. “Value Line” is a registered trademark of Value Line, Inc.”
10.70
21.80
15.70 12.11 10.90
20.80
15.30 12.69
0.00
5.00
10.00
15.00
20.00
25.00
TIF COH KORS LVMUY
Profit Margin--comparative
2012 2013E

71
Return on Assets for LVMUY has been slightly volatile over the past 5 years increasing
and then decreasing and then repeating. The TTM is 7.33 percent for ROA. (“LVMUY-Key
Ratios”)
Following a similar pattern to ROA, ROE is also fluctuating up and down. Investors, for
the TTM, earned 14.97 percent on their investment in LVMUY. (“LVMUY-Key Ratios”)
Figure 53: Return on Assets & Return on Equity- LVMUY
05
101520
2008 2009 2010 2011 TTM
Return on Assets & Return on Equity--LVMUY
ROA ROE

72
Market Value Ratios Currently LVMUY has a P/E multiple of 19.7. This implies that investors are willing to
pay $19.70 for $1.00 of current earnings. Comparatively, which is most important for the P/E
ratio, LVMUY is not the highest so investors believe that KORS, TIF, and the industry itself will
have a stronger earnings growth. (“LVMUY-Key Ratios”)
Figure 54: P/E--LVMUY: Morningstar
Figure 55: P/E Comparative: Morningstar
0
5
10
15
20
25
2008 2009 2010 2011 2012 TTM
P/E--LVMUY
0
20
40
60
80
100
2008 2009 2010 2011 2012 TTM
P/E Ratio--comparative
COH KORS TIF LVMUY
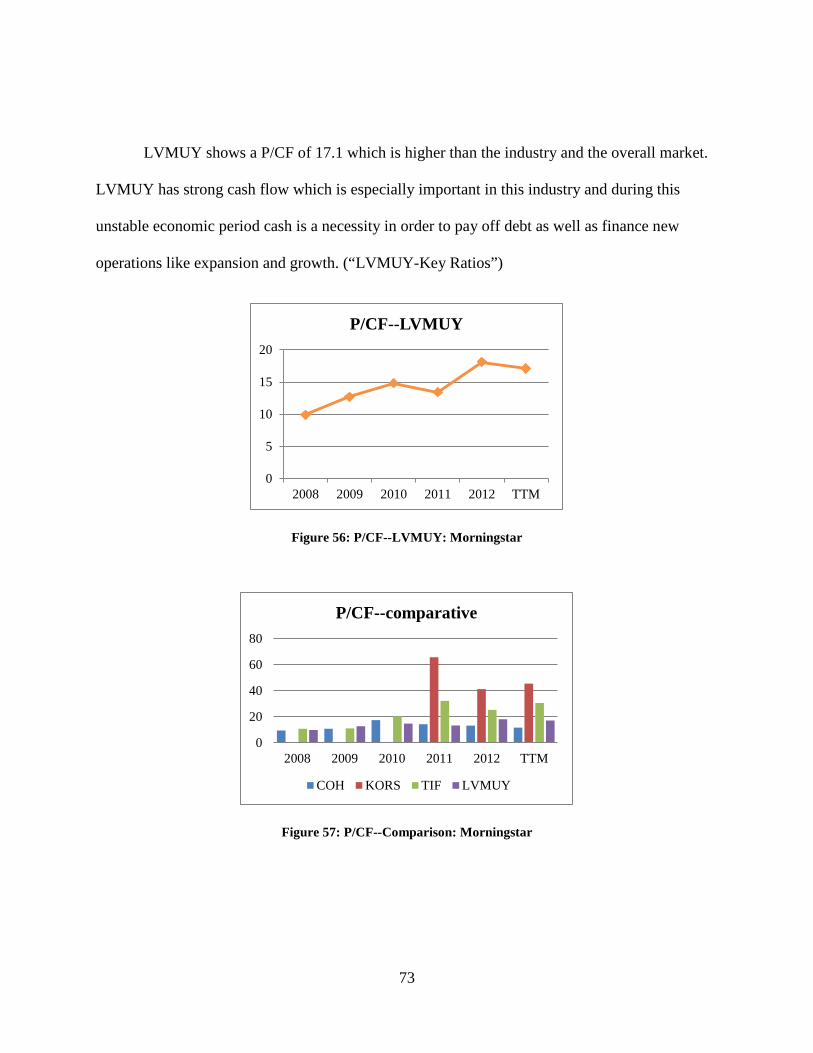
73
LVMUY shows a P/CF of 17.1 which is higher than the industry and the overall market.
LVMUY has strong cash flow which is especially important in this industry and during this
unstable economic period cash is a necessity in order to pay off debt as well as finance new
operations like expansion and growth. (“LVMUY-Key Ratios”)
Figure 56: P/CF--LVMUY: Morningstar
Figure 57: P/CF--Comparison: Morningstar
0
5
10
15
20
2008 2009 2010 2011 2012 TTM
P/CF--LVMUY
0
20
40
60
80
2008 2009 2010 2011 2012 TTM
P/CF--comparative
COH KORS TIF LVMUY

74
Efficiency Ratios
Inventory turnover has slightly slowed for LVMH from 1.23 in 2010 to 1.19 for TTM
probably due to the 2 percent increase in payroll tax leaving consumers with less disposable
income. (“LVMUY-Key Ratios”)
Figure 58: Inventory Turnover—LVMUY: Morningstar
The days sales outstanding, on the other hand, is decreasing every year which means
LVMUY is shortening the amount of time to receive payment from their customers so they are
able to reinvest that money back into the company sooner and increase profitability. TTM for
Days Sales Outstanding is at 20.65 days which is significantly faster than the 34.45 days to
collect back in 2008. (“LVMUY-Key Ratios”)
Figure 59: Days Sales Outstanding--LVMUY: Morningstar
11.05
1.11.15
1.21.25
2008 2009 2010 2011 TTM
Inventory Turnover-LVMUY
0
10
20
30
40
2008 2009 2010 2011 TTM
Days Sales Outstanding-LVMUY

75
Technical Analysis
Prices of LVMUY seem to be fairly volatile, not completely nor consistently trending
above or below the EMA50 or EMA 200. Prices are now below the EMA 50 but still above the
EMA 200 signaling that in the short term, LVMUY may see some decreases but is too soon to
tell if LVMUY is entering a bearish market. Although the EMA 50 is above the EMA 200, it
looks as if they are converging so there could possibly be some upward movement but not likely.
The RSI almost reached 80 which would signal a strong buy back in the end of December but
now has fallen below the 50 which would indicate a sell. Any upturn in the RSI could be an
indication that it is time to buy again. The MACD lines also do not indicate a buy or sell signal
currently but because the MACD (12, 26) line is currently below the MACD (9) line, but any
crossing of lines could be a potential sign to buy. (“Technical Analysis”)
Figure 60: Technical Analysis--LVMUY: Bigcharts.com

76
Projections
Projections for COH, KORS, TIF, and LVMUY are forecasted for 2013 and 2014 for the
following: 1) Earnings Per Share 2) Stock Price 3) Sales/Revenue. All projections and earnings
estimates are based on data gather from MSN Money as of March 11th, 2013 with one exception.
LVMUY Earnings Per Share was taken from S&P Net Advantage and P/E from Value Line.
Pessimistic and optimistic numbers were calculated as 10% below and above the most likely case
for P/E because no projected data was available.
COH
According to MSN Money, EPS for 2013 is forecasted as $3.60 worst case, $3.72 most
likely, and $3.90 best case scenario. In 2014 EPS is forecasted at $3.90 worst case, $4.14 most
likely, and at $4.42 best case. EPS is projected to grow at 5.40% and 11.40% in 2013 and 2014
respectively, which is lower growth than the overall industry and lower than the S&P Index as
well. As of March 11th, 2013, the current P/E multiple for COH was 13.5. Using the current P/E
and projected EPS, projected stock price for the next two years including best case, most likely
case, and worse case scenarios have been forecasted below. (“COH-Earnings”)
Value Line projects COH to have sales in 2013 of $5,050 million and from 2015-2017 sales should reach $6,750 million. (Constanza)
2013 Pessimistic Most Likely Optimistic EPS $ 3.60 $ 3.72 $ 3.90 Stock Price $ 48.60 $ 50.22 $ 52.65
2014 Pessimistic Most Likely Optimistic EPS $ 3.90 $ 4.14 $ 4.42 Stock Price $ 52.65 $ 55.89 $ 59.67
Table 5: Forecasted Scenarios- EPS & Stock Price--COH: MSN Money
“Copyright © (2013) Value Line, Inc. All Rights Reserved Worldwide. “Value Line” is a registered trademark of Value Line, Inc.”

77
KORS
EPS was forecasted for 2013 and 2014 for pessimistic scenario at $1.81 and $1.95, most
likely at $1.84 and $2.30, and optimistic scenarios at $1.88 and $2.60. (Morningstar) The growth
rate of KORS for the short term is what makes it to be such an attractive investment. For 2013,
KORS is expected to have explosive growth of 130.42% but then slow in 2014 to 26.82% which
is still strong growth. Explosive numbers like 130% are not sustainable long term. The current
P/E multiple of 33.2 was used to project estimated stock prices for the next two years below.
(“KORS-Earnings”)
Sales are projected for 2013 to reach $2,450 million and by 2015-2017 sales growth will
still be explosive and are projected to be at $4,235 million. (Patrikis)
2013 Pessimistic Most Likely Optimistic EPS $ 1.81 $ 1.84 $ 1.88 Stock Price $ 60.09 $ 61.09 $ 62.42
2014 Pessimistic Most Likely Optimistic EPS $ 1.95 $ 2.30 $ 2.60 Stock Price $ 64.74 $ 76.36 $ 86.32
Table 6: Forecasted Scenarios- EPS & Stock Price--KORS: MSN Money
“Copyright © (2013) Value Line, Inc. All Rights Reserved Worldwide. “Value Line” is a registered trademark of Value Line, Inc.”

78
TIF
EPS for 2013 and 2014 estimates are as follows: pessimistic is $3.20 and $3.37; most
likely is $3.21 and $3.50; and optimistic cases are $3.22 and $3.84. Earnings are projected to
grow at 6.29% for 2013 and then more rapidly in 2014 at 18.04%. Using a current P/E multiple
of 21.7, stock price was projected for the next two years below. (“TIF-Earnings”)
Sales for 2013 is projected to be at $4,070 million and from 2015-2017, sales will
increase slightly to $5,500 million. TIF’s sales in the short term are going to be slower than
average but there is still optimism for longer term growth. (Hellman) “Copyright © (2013)
Value Line, Inc. All Rights Reserved Worldwide. “Value Line” is a registered trademark of
Value Line, Inc.”
2013 Pessimistic Most Likely Optimistic EPS $ 3.20 $ 3.21 $ 3.22 Stock Price $ 69.44 $ 69.66 $ 69.87
2014 Pessimistic Most Likely Optimistic EPS $ 3.37 $ 3.50 $ 3.84 Stock Price $ 73.13 $ 75.95 $ 83.33
Table 7: Forecasted Scenarios- EPS & Stock Price--TIF: MSN Money
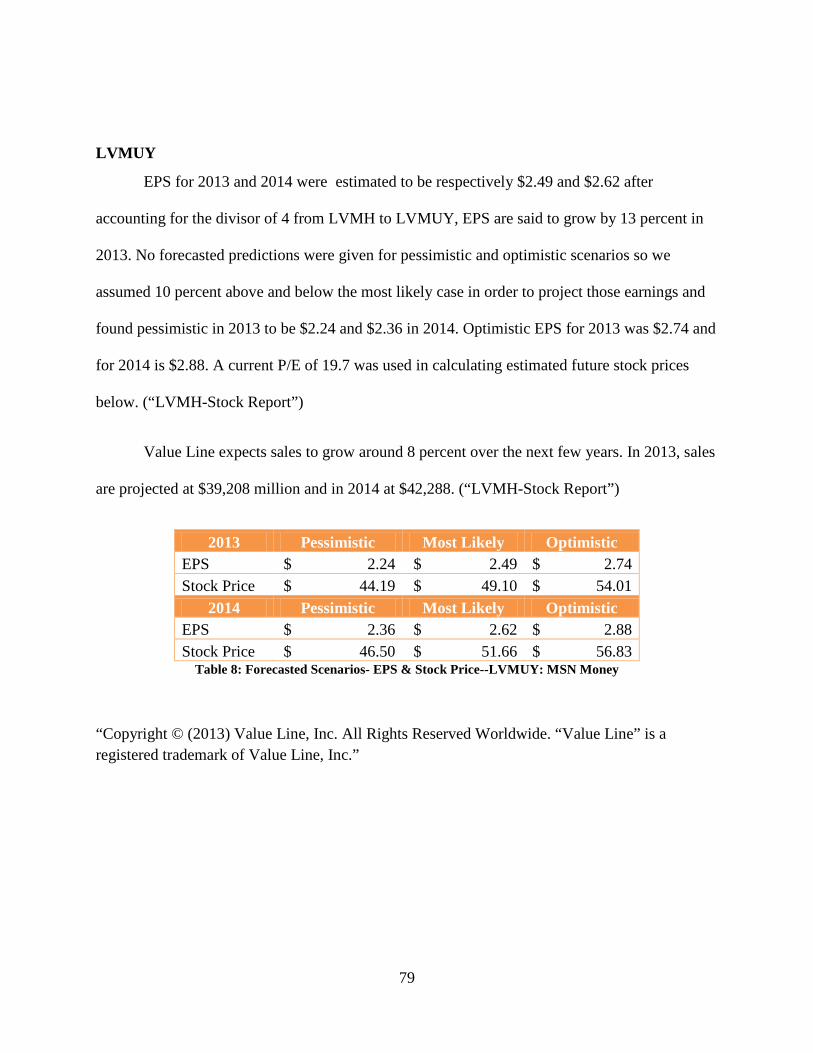
79
LVMUY
EPS for 2013 and 2014 were estimated to be respectively $2.49 and $2.62 after
accounting for the divisor of 4 from LVMH to LVMUY, EPS are said to grow by 13 percent in
2013. No forecasted predictions were given for pessimistic and optimistic scenarios so we
assumed 10 percent above and below the most likely case in order to project those earnings and
found pessimistic in 2013 to be $2.24 and $2.36 in 2014. Optimistic EPS for 2013 was $2.74 and
for 2014 is $2.88. A current P/E of 19.7 was used in calculating estimated future stock prices
below. (“LVMH-Stock Report”)
Value Line expects sales to grow around 8 percent over the next few years. In 2013, sales
are projected at $39,208 million and in 2014 at $42,288. (“LVMH-Stock Report”)
2013 Pessimistic Most Likely Optimistic EPS $ 2.24 $ 2.49 $ 2.74 Stock Price $ 44.19 $ 49.10 $ 54.01
2014 Pessimistic Most Likely Optimistic EPS $ 2.36 $ 2.62 $ 2.88 Stock Price $ 46.50 $ 51.66 $ 56.83
Table 8: Forecasted Scenarios- EPS & Stock Price--LVMUY: MSN Money
“Copyright © (2013) Value Line, Inc. All Rights Reserved Worldwide. “Value Line” is a registered trademark of Value Line, Inc.”
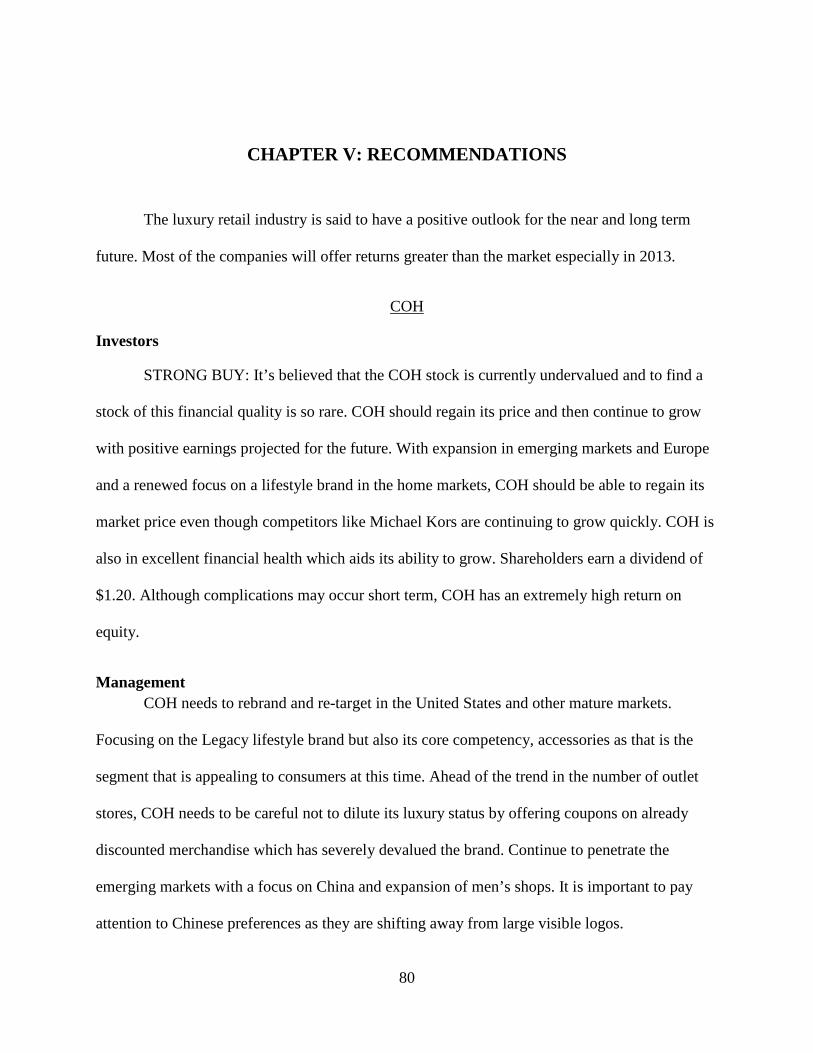
80
CHAPTER V: RECOMMENDATIONS
The luxury retail industry is said to have a positive outlook for the near and long term
future. Most of the companies will offer returns greater than the market especially in 2013.
COH
Investors
STRONG BUY: It’s believed that the COH stock is currently undervalued and to find a
stock of this financial quality is so rare. COH should regain its price and then continue to grow
with positive earnings projected for the future. With expansion in emerging markets and Europe
and a renewed focus on a lifestyle brand in the home markets, COH should be able to regain its
market price even though competitors like Michael Kors are continuing to grow quickly. COH is
also in excellent financial health which aids its ability to grow. Shareholders earn a dividend of
$1.20. Although complications may occur short term, COH has an extremely high return on
equity.
Management COH needs to rebrand and re-target in the United States and other mature markets.
Focusing on the Legacy lifestyle brand but also its core competency, accessories as that is the
segment that is appealing to consumers at this time. Ahead of the trend in the number of outlet
stores, COH needs to be careful not to dilute its luxury status by offering coupons on already
discounted merchandise which has severely devalued the brand. Continue to penetrate the
emerging markets with a focus on China and expansion of men’s shops. It is important to pay
attention to Chinese preferences as they are shifting away from large visible logos.

81
KORS
Investors BUY: If looking for a high growth company to invest in or if 130 percent return for 2013
sounds appealing, KORS is a solid investment. KORS should be able to maintain a moderate
growth rate in the long term due to its financially sound foundation and availability of liquidity.
Management Although, KORS exists in over 70 countries already, the emerging economies present
untapped potential for a luxury lifestyle brand. That being said, diversification within the product
lines will aid in the acceptance of KORS. Expanding the product mix is important but don’t lose
sight of what gives KORS the competitive advantage.
TIF
Investors HOLD: With the volatility in the financial market as well as the diamond supply, it
makes it difficult for TIF stock not to be sensitive and volatile as well. At least for the near term,
growth is going to be slow and the forecasted stock price has a most likely scenario of a lower
price than the current price. For the long run, the stock will do fine continuing to generate strong
returns.
Management The most critical factors that TIF management needs to consider are the importance of
same-store sales growth in the Americas, e-commerce and international expansion, and new
product development. Stores abroad offset the lack of sales in the Americas and Europe but it is
critical not to forget about TIF’s main market, the one in which that little blue box is engraved in
the public’s mind. With expansion in e-commerce as well as in emerging economies, new

82
product development will be essential due to the diversity of the demands around the globe.
Lastly, keep control of TIF’s supply chain through the vertical integration in order to have more
control over the diamond supply.
LVMUY
Investors Buy/Hold. LVMUY is a financially strong company that is a safe investment that also
pays a large dividend of $3.90. With such a broad geographical span, LVMUY limits its
exposure and dependence on the demand and development of emerging markets. LVMUY also is
extremely diversified within its product lines which lead to greater stability within the market as
a whole.
Management It is crucial that LVMUY management focuses on its competitive advantage: the brands.
These brands need to be protected and continually improved. Such a diverse product mix makes
it difficult to keep with the fast paced environment of the fashion industry. Acquiring additional
high quality brands that add to the portfolio is essential as time passes, but it is also important to
focus on the return that will be added from the acquisition. International expansion will be
imperative in the future, especially within the emerging economies.

83
CHAPTER VI: CONCULSIONS The luxury retail industry has remained quite healthy and attractive despite the
macroeconomic and financial headwinds the world is currently facing. Although some sectors
will grow slower than others, the luxury retail industry as a whole, is projected to grow in the
future, short term and especially long term. Fashion is an industry that is constantly changing and
that requires strong cash flows, extremely low levels of debt, and high profit margins.
Companies in the luxury retail industry generally will make for an attractive investment even in
times of recession or recovery.

84
APPENDIX A: GENERAL RATIO DESCRIPTIONS

85
General Ratio Descriptions
Short Term Liquidity
The current ratio measures a company’s ability to meet its short term financial obligations by
using short term assets. It is calculated by dividing current assets by current liabilities. A higher
ratio shows a strong ability to meet short term debt obligations. A ratio less than 1 signals that
the company would be unable to pay off its liabilities with its short term assets if they were now
due. This could imply issues with receivables or long inventory turnover which can lead to
liquidity problems.
Asset Management
Assets produce revenue but also cost the company money as well. Therefore, assets may be
thought of as a percentage of sales. The correct mix of assets must be found in order to avoid
wasting money by having too many assets or limiting profitability by having too few assets.
Fixed Asset Turnover measures the company’s ability to generate sales from its investments
in fixed assets such as plant, property, and equipment. The higher the ratio the better, meaning
the company is being more effective in using their fixed assets to generate sales.
Total Asset Turnover focuses on all assets and how much $1 worth of assets generates in
sales. A high total asset turnover could signal efficiency at using assets to generate revenue or
indicates a strong pricing strategy. Companies with low profit margins tend to have high asset
turnover.

86
Debt Management
Financing projects and assets with debt can provide leverage to a company and can, increase
the value and rate of return, but if not carefully monitored debt can increasingly become a
problem which would affect credit availability and also would result in less liquidity.
The debt to equity ratio shows the company’s financial leverage and is calculated by dividing
total liabilities by total shareholder’s equity. This ratio indicated the proportion of debt and
equity that the company is using in order to finance its assets. A high debt to equity ratio means
that a company is financing most of its assets with debt which could lead to volatile earnings.
D/E ratios are extremely dependent on the particular industry. In the luxury goods industry,
because it is so volatile, it is crucial that companies in this industry maintain extremely low
levels of debt.
Profitability Ratios
Profitability ratios are crucial to a company’s success and appeal to stockholders. They show
how well management is doing in order to earn profits. These ratios are not only important to the
company internally but externally as well. Investors won’t invest in a stock that does not offer
competitive returns. Profit can be looked at as a percentage of sales, total assets, and total equity.
Profit Margin measures how much a company actually earns from every dollar acquired
in sales. This margin is the amount that is left over for re-investment, how much in dividends
that can be allocated to investors, or both. Profit Margin is found by dividing net income by
sales. A higher profit margin relative to competitors signals a more profitable company that has
greater control over its costs.

87
Return on assets looks at profit as a percentage of assets showing how efficient a
company is at using its assets to generate profit and earnings. This is found by dividing net
income by total assets. The higher the ratio the better because that would mean that they are
earning more money with less investment in assets.
Return on equity measures the profitability of a company by showing how much profit a
company makes from the amount of money that shareholders have invested. ROE is calculated
by dividing net income by shareholder’s equity and represents how much of a return
shareholders are receiving on their investment in that stock. ROE is extremely important for
investors so managers often focus on this return in order to make the stock seem more attractive.
Market Value Ratios
Market value ratios are used by a company in order to assess investor’s opinions about the
company’s past performance and are also an easy way to identify areas of weakness. If all of the
company’s market value ratios are strong, it would be reflected in a strong and upward trending
stock price.
Price to earnings ratio shows how much investors are willing to pay per dollar of current
earnings. Anticipation of strong growth from investors will lead to a higher P/E multiple because
they are expecting to receiving higher earnings in the future relative to other companies.
Price to Cash Flows provides a measure of the market’s expectations for a firm’s future
financial health. Cash flows need to be strong in order to pay obligations, expand operations, and
more. It is calculated by dividing share price by cash flow per share price. Like the P/E ratio,
P/CF is a relative measure meaning that it is relative to other companies, an index, or historical
measures.

88
Efficiency Ratios
For certain industries, specifically the retail industry, inventory is the key factor in the
success of the company. Having the proper amount of merchandise and the right moment is a
critical factor. Inventory is what generates sales for retailers so therefore inventory is a retailers’
most valuable asset.
Inventory turnover shows how many times a company must replace its inventory, because
it’s sold, over a certain period of time. It is found by dividing sales by inventory. A low turnover
signals poor sales which leads to excessive inventory or could signal too much inventory and
capital is wasted because unused inventory has a return of 0. A high inventory turnover ratio
could signal either strong sales or also ineffective buying procedures in which not enough
inventory is bought.
Days sales outstanding is another ratio that is important in the luxury goods industry. It
measures the amount of time it takes a company to collect its payment after a sale. Due to the
importance of liquidity and cash within a business, it is necessary and important to collect
outstanding payments as fast as possible so it will be reinvested in the company and produce
additional profits. DSO is found by dividing accounts receivable by the total number of credit
sales and then multiplying that by the number of days. A low DSO implies that it takes the
company fewer days to collect its accounts receivable. A high DSO means that the company is
selling more of its products to the customer on credit and is taking longer to collect the money
which has an impact on liquidity.

89
Works Cited “2012 Luxury Goods Worldwide Market Study 11th Edition. Milan. Bain & Co with Fondazoine
Altagamma. Web. 15 Oct. 2012. PDF file.
Arnault, Bernard and Jean Jacques Guiony. “2012 Annual Results.” LVMH. 31 Jan. 2013. Web.
11 Mar. 2013.
Aseada, Jason. “KORS Industry Info.” Net Advantage. 1 Feb. 2013. Web. 14 Feb. 2013.
“Bain projects global luxury goods market will grow overall by 10% in 2012.” Bain Web. 15
Oct. 2012. Web. 15 Oct. 2012.
Boles, Corey. “CBO: Fiscal Cliff Could Trigger Recession. Wall Street Journal. 8 Nov. 2012. 15
Nov. 2012.
“Chinese Shoppers world’s top luxury goods spenders.” Bain Web. 12 Dec. 2012. Web. 15 Oct.
2012.
“Coach Company Profile.” Coach, Inc. 2013 n.d. Web. 11 Mar. 2013.
“Coach Inc-Stock Report.” Net Advantage. 9 Mar. 2013. Web. 11 Mar. 2013.
“COH--Earnings.” MSN Money. 10 Mar. 2013. Web. 11 Mar. 2013.
“COH--Interactive Graph.” Yahoo Finance. 22 Mar. 2013. Web. 22 Mar. 2013
“COH--Key Ratios.” Morningstar.com n.d. Web. 2 Feb. 2013.

90
“COH-Key Statistics.” Yahoo Finance. 11 Mar 2013. Web. 11 Mar. 2013.
Constanza, Andre J. “Coach, Inc.-Research Report.” Value Line. 1 Feb. 2013. Web. 3 Mar. 2013.
“Gradual Upturn in Global Growth During 2013: World Economic Outlook Update”
International Monetary Fund. Web. Jan. 2013. Web. 2 Feb. 2013.
Hellman, Justin. “Tiffany & Co.-Research Report.” Value Line. 1 Feb. 2013. Web. 3 Mar. 2013.
Kapferen, Jean-Noel. “Abundant Rarity: The Key to Luxury Growth.” Business Horizons. 55.5
(2101): 453-462. Business Source Premier. Web. 19 Sep. 2012.
Kim, Kyung Hoon, et al. “Increasing Customer Equity of Luxury Fashion Brands through
Nurturing Consumer Attitude. Journal of Business Research. 65.10 (2012):14495.
ABI/INFORM Complete. Web. 15 Oct. 2012.
“KORS—Earnings.” MSN Money. 10 Mar. 2013 Web. 11 Mar. 2013.
“KORS-Interactive Graph.” Yahoo Finance. 22 Mar. 2013. Web. 22 Mar. 2013
(“KORS-Key Ratios.”) Morningstar.com n.d. Web. 2 Feb. 2013.
“KORS-Key Statistics.” Yahoo Finance. 11 Mar 2013. Web. 11 Mar. 2013.
“KORS: Michael Kors Holdings Ltd Top Competitors and Peers.” Morningstar Web.
Morningstar. n.d. Web. 13 Mar. 2013.
“LVMH Moet Hennessy Louis Vuitton SA ADR LVMUY.” Morningstar. Morningstar, Inc.
2013. 12 Mar. 2013. Web. PDF file.
91
“LVMH—Stock Report.” Net Advantage. 23 Feb. 2013. Web. 11 Mar. 2013.
“LVMUY-Interactive Graph.” Yahoo Finance. 22 Mar. 2013. Web. 22 Mar. 2013
“LVMUY-Key Ratios.” Morningstar.com n.d. Web. 2 Feb. 2013.
“Michael Kors Holdings Ltd KORS.”) Morningstar. Morningstar, Inc. 2013. 12 Mar. 2013. PDF
file.
“Modest Growth Pickup in 2013, Projects IMF.” International Monetary Fund Web. Jan. 2013.
Web. 3 Feb. 2013.
Passariello, Christina. “Gleam Returns to Luxury-Goods Sales.” Wall Street Journal. 18 Oct.
2012. 20 Nov. 2012.
Patrikis, Nicholas. “Michael Kors—Research Report.” Value Line. 1 Feb. 2013. Web. 3 Mar.
2013.
Smialek, Jeanna. “Consumer Comfort Falls Amid Mounting Concern Over U.S. Economy.”
Bloomberg. 24 Jan. 2013. Web. 4 Feb. 2013
Smialek, Jeanna. “Consumer Confidence in US Falls to Lowest Level Since 2011.” Bloomberg.
29 Jan. 2013. Web. 4 Feb. 2013.
Smith, Ray A. “Protect His Way: KORS Expands.” Wall Street Journal. 16 Feb. 2011. Web. 13
Mar. 2013.
Som, Ashok. “Logic of Luxury in Emerging Markets.” Vikalpa: The Journal for Decision
Makers 36.1 (2011):75-77. Business Source Premier. Web. 19 Sep. 2012.

92
Swinand, Paul. “Coach, Inc. COH.” Morningstar. Morningstar, Inc. 2013. 11 Mar. 2013. Web.
PDF file.
Swinand, Paul. “Tiffany & Co. TIF” Morningstar. Morningstar, Inc. 2013. 11 Mar. 2013. Web.
PDF file.
“Technical Analysis.” Bigcharts.com. 27 Feb. 2013. Web. 27 Feb. 2013.
“TIF—Earnings.” MSN Money. 10 Mar. 2013. Web. 11 Mar. 2013.
“TIF-Interactive Graph.” Yahoo Finance. 22 Mar. 2013. Web. 22 Mar. 2013
“TIF-Key Ratios.” Morningstar.com n.d. Web. 2 Feb. 2013.
“TIF-Key Statistics.” Yahoo Finance. 11 Mar 2013. Web. 11 Mar. 2013.
“Tiffany & Co—Stock Report.” Net Advantage. 9 Mar. 2013. Web. .11 Mar. 2013.
“World Economic Outlook October 2012: Coping with High Debt and Sluggish Growth.”
International Monetary Fund. n.d. Web. 1 Jan. 2013. PDF file.