a global perspective on african climate - international research
TRANSCRIPT

A global perspective on African climate
Alessandra GianniniCorresponding author - International Research Institute for Climate and Society, Earth Institute at Columbia University, 61Rt 9W, Palisades NY 10964, U.S.A. phone/fax: +1 845 680-4473/4864. email: [email protected]
Michela BiasuttiLamont-Doherty Earth Observatory, Earth Institute at Columbia University, Palisades NY 10964, U.S.A.
Isaac M. HeldGeophysical Fluid Dynamics Laboratory/NOAA, Princeton NJ 08542, U.S.A.
Adam H. SobelDepartments of Applied Physics and Applied Math, and Earth and Environmental Sciences, Columbia University, New YorkNY 10025, U.S.A.
October 31, 2007
Abstract.We describe the global climate system context in which to interpret African environmental change to support planning
and implementation of policymaking action at national, regional and continental scales, and to inform the debate betweenproponents of mitigation v. adaptation strategies in the face of climate change.
We review recent advances and current challenges in African climate research and exploit our physical understandingof variability and trends to shape our outlook on future climate change. We classify the various mechanisms that have beenproposed as relevant for understanding variations in African rainfall, emphasizing a “tropospheric stabilization” mechanismthat is of importance on interannual time scales as well as for the future response to warming oceans.
Two patterns stand out in our analysis of 20thcentury rainfall variability: a drying of the monsoon regions, related to
warming of the tropical oceans, and variability related to the El Nino-Southern Oscillation. The latest generation of climatemodels partly captures this recent continent-wide drying trend, attributing it to the combination of anthropogenic emissionsof aerosols and greenhouse gases, the relative contribution of which is difficult to quantify with the existing model archive.The same climate models fail to reach a robust agreement regarding the 21
stcentury outlook for African rainfall, in a futurewith increasing greenhouse gases and decreasing aerosol loadings. Such uncertainty underscores current limitations in ourunderstanding of the global climate system that it is necessary to overcome if science is to support Africa in meeting itsdevelopment goals.
Keywords: Africa, climate and environmental change
c© 2007 Kluwer Academic Publishers. Printed in the Netherlands.
rev-africa_Oct2007_final.tex; 31/10/2007; 11:57; p.1

2 Giannini, Biasutti, Held and Sobel
1. Introduction
This paper discusses the global-scale mechanisms that affect African rainfall. The goal is to place
African environmental change in the context of the global climate change debate, so that climate science
can play an appropriate role in discussions of African development. Motivation comes from recent
advances that point to global climate as a primary agent of African environmental change—in particular,
research confirming the dominant role of the global tropical oceans in effecting late 20thcentury drought
in the Sahel. These advances openly challenge the historical focus on the local nature of causes of
environmental degradation and their remedies. They point to the need to create a synergy across scales,
between global and local knowledge, to fully explain past environmental change and to guide in the
definition of future management strategies (Reynolds et al., 2007).
Advances in the physical understanding of African environmental change that point to global climate
as an important agent include: (i) remotely sensed observations of vegetation cover; (ii) modeling of land
cover response to land use and to precipitation, and (iii) climate modeling of the response of African
rainfall to the observed distribution of sea surface temperature (SST). Continuous remotely sensed
observations of land cover started in the late 1970s. They exposed the ability of vegetation to recover
from drought at both seasonal and interannual time-scales (Tucker et al. 1991; Hellden 1991; Anyamba
and Eastman 1996; Prince et al. 1998; Nicholson et al. 1998; Eklundh and Olsson 2003; Herrmann et
al. 2005). Modeling of land cover and climatic responses to land use have begun to converge towards
the view that land use/land cover changes are of secondary importance for African rainfall variability
(Taylor et al. 2002; Hickler et al. 2005). In sharp contrast, climate models forced only by the observed
long-term history of SST have reproduced the historical record of Sahel rainfall (Giannini et al. 2003; Lu
and Delworth 2005), confirming the role of the global oceans in pacing drought in this region (Folland
et al. 1986; Palmer 1986; Rowell et al. 1995), as well as more generally over tropical Africa (Hoerling
et al. 2006).
Equally relevant are studies of local interpretation and adaptation to climate variability and change.
In regards to the recent “greening” of the Sahel—the observation that the state of vegetation cover in
much of the region has considerably improved since the very dry mid-1980s (Herrmann et al. 2005)—
the remote sensing work must be reconciled with evidence from local surveys. In recent years local
rev-africa_Oct2007_final.tex; 31/10/2007; 11:57; p.2

A global perspective on African climate 3
practitioners and farmers have not observed a return to pre-drought conditions in the characteristic
development of the rainy season (L’Hote et al. 2002; West et al. 2007). However, when financially
feasible, communities have enthusiastically adopted soil water conservation strategies that have locally
improved cereal yields (e.g. Reij et al. 2005) and vegetation cover (Polgreen 2007). So, as scientific
understanding comes to the conclusion that it was not mismanagement of land resources that caused the
persistence of drought, it could very well be that investment in land management practices, not a return
of rainfall to pre-drought levels, are found to have most significantly contributed to the greening.
This study focuses on one external cause of environmental change—climate. We focus on the re-
cent observational record of continental-scale tropical African climate variability and on simulations
of future change to address the following questions: Are there current trends? Is it wise to linearly
extrapolate them into the future? The tropical African focus means that this paper excludes the northern
and southern extremities of the continent, whose Mediterranean climates are strongly influenced by
extratropical atmospheric circulations. The focus on seasonal-to-interannual and longer-term climate
variability derives from our ultimate goal of projecting future African climate change. Complementing
the recent investment in regional climate modeling at African institutions—an investment undertaken
with a view to its applicability to adaptation to climate variability and change (e.g. Jenkins et al. 2005a,
2005b; Tadross et al. 2005; Afiesimana et al. 2006; Pal et al. 2007; http://www.aiaccproject.org/)—the
focus here remains on the large scales, from continental to global. Given the gaps in our understanding
of the large-scale dynamics of climate that are manifest in our inability to explain the uncertainty in
projections of future change, a detailed, downscaled analysis is premature. However, we anticipate that
projections on regional, rather than continental, scale, and of other characteristics of rainfall besides
the seasonal total (such as its intraseasonal variability, distribution of frequency and intensity of events,
and monsoon onset date) will become more useful as our outlook on the future becomes less uncertain.
Translating a climate outlook on the continental scale—say, for example, a continent-wide drying—into
information useful at the regional scale—say, for example, a postponement of the West African monsoon
onset, or a change in duration or frequency of dry spells within the southern African wet season (e.g.
Usman and Reason 2004)—remains a challenge that will be met when scientific capacity is integrated
with stakeholders’ demand for climate information (Washington et al. 2004, 2006; IRI 2006).
rev-africa_Oct2007_final.tex; 31/10/2007; 11:57; p.3

4 Giannini, Biasutti, Held and Sobel
In Section 2 we review the climatological seasonal cycle over Africa and introduce relevant gov-
erning mechanisms. Section 3 is about climate variability and change during the 20thcentury, with
emphasis on recent decades, as observed, and as simulated in state-of-the-art coupled ocean-atmosphere
models. The emphasis is on continental-scale patterns, such as a multi-decadal drying or the impact
of the El Nino-Southern Oscillation (ENSO). Section 4 describes the uncertainties in projections of
African climate change and discusses the large-scale mechanisms that we see to be potentially involved.
Section 5 offers conclusions and recommendations.
2. Dynamics of tropical rainfall and seasonality of African climate
Deep convection is the physical process which brings about most precipitation in the tropics. It is the
result of a hydrodynamic instability in which fluid rises through the depth of the troposphere1 due to
its being lighter than the fluid surrounding it, while heavier fluid sinks, much like water in a pot heated
from below. In the atmosphere, the heating from below is due originally to solar (short-wave) radiation,
much of which passes through the atmosphere to heat the surface (whether ocean or land). The surface
returns that energy to the atmosphere partly by terrestrial (long-wave, infrared) radiation, but also by
turbulent fluxes of sensible heat (that which directly influences temperature) and, more quantitatively
important in most tropical regions, latent heat in the form of water vapor. The fact that this vapor can be
transported for large distances before releasing its latent heat gives tropical climate dynamics much of
its distinctive flavor and complexity.
Deep convection can be thought of as a two-step process: first, surface air is warmed or moistened.
The warming itself is never large enough to create the low densities needed to convect, i.e. lift the
air parcel, through the depth of the troposphere. Rather, the water vapor in the air must be sufficient
so that when lifted and cooled, by small-scale turbulence or a large-scale weather disturbance, enough
condensation will occur, and enough latent heat will be released to render the parcel sufficiently buoyant
to ascend through the depth of the troposphere. In the process the parcel will return most of its original
water vapor to the surface in the form of precipitation. The key step is the initial warming and moistening1 The lowest 15-20 kilometers of the Earth’s atmosphere, containing 90% of the atmosphere’s mass.
rev-africa_Oct2007_final.tex; 31/10/2007; 11:57; p.4

A global perspective on African climate 5
of the surface air, a transformation which renders it potentially light enough to ascend through the
troposphere. Note also that a warmer (and thus lighter) troposphere above the surface will suppress
deep convection since the near-surface air must then become lighter still in order to become buoyant.
Since tropical precipitation is a response to instability, one way to perturb the system is to change
its stability, either by changing the temperature and humidity of near-surface air, or by changing the
temperature of the atmosphere at higher levels. It is a fundamental feature of the tropical atmosphere
that it cannot sustain large horizontal temperature gradients above the planetary boundary layer (that
is, more than 1-2 kilometers above the surface). Warming generated by heating of one part of the
tropical atmosphere is efficiently distributed horizontally throughout the tropics. A warming of the air
above the planetary boundary layer over the Indian Ocean for example, once communicated to Africa
by atmospheric dynamics, would reduce the instability of a boundary layer parcel, and thus inhibit
precipitation (Chiang and Sobel 2002). We refer to this mechanism as stabilization.
Another way to perturb the system is to change the supply of moisture flowing into the region of
interest. Arguments to this effect tend not to directly address the stability properties of the atmospheric
column, but instead treat the moisture budget as central. The idea is that other factors, such as gradients
in sea surface temperature (Lindzen and Nigam 1987), or the temperature contrast between land and
sea (Webster 1994; Hastenrath 1991), induce changes in the pressure field, and thus in the large-scale
flow field, so as to alter the low-level convergence of moisture into the region. Since precipitation in
rainy regions is largely fed by this moisture convergence rather than by local evaporation, this leads to
changes in rainfall. We label this mechanism moisture supply.
We will refer to these mechanisms, stabilization and moisture supply, in our discussion of African
climate variability and change in the sections to follow.
[Figure 1 here]
Seasons over Africa, as elsewhere, result from interactions between atmosphere, land and ocean as
they respond to the annual cycle of insolation—the ultimate driving force behind the alternation of wet
and dry, warm and cold seasons. The seasonal climatology of African precipitation is shown in figure 1;
heavy rain occurs in a zonally symmetric2, meridionally confined band, or rainbelt, which straddles the
2 Zonal refers to the longitudinal, or east-west direction, while meridional refers to the latitudinal, or north-south direction.
Likewise, zonally or meridionally symmetric refers to a feature that characterizes all longitudes or latitudes in a given domain.
rev-africa_Oct2007_final.tex; 31/10/2007; 11:57; p.5

6 Giannini, Biasutti, Held and Sobel
equator near the equinoxes, in April and October, and moves off into the summer hemisphere otherwise,
to northern Africa in July and to southern Africa in January. Deep convection and precipitation are
spatially confined. In regions of strong precipitation near-surface convergence brings in moisture from
surrounding regions, allowing the rainfall to greatly exceed evaporation from the local surface. For this
reason, some regions of deep convection are also referred to as Inter-Tropical Convergence Zones, or
ITCZs.
Continental surfaces respond immediately to the seasonal cycle of insolation, because of the neg-
ligible thermal capacity of land. Hence land surface temperatures peak right after the passing of the
sun overhead, or after the local summer solstice at tropical latitudes. Ocean surfaces respond with a
delay, due to the large thermal capacity of the layer of water through which this heat is immediately
mixed, hence they are typically warmest close to the fall equinox. As the rainbelt progresses poleward
in its annual migration following the sun, near-surface winds supply moisture to it, mostly from its
equatorward side. As the rainbelt retreats, dry winds, e.g. the Harmattan winds of the Sahara/Sahel,
establish themselves on its poleward side. A large-scale circulation connects near-surface convergence
and ascent localized in the rainbelt, to upper-level divergence and generalized descent elsewhere. This
meridional migration of the rainbelt produces a single-peaked rainy season at the poleward edges of the
tropical region. Due to the additional, non-negligible influence of the ocean, peak rainfall occurs with a
delay compared to peak temperature (Biasutti et al. 2003), i.e. sometime between summer solstice and
fall equinox—in August in the northern hemisphere, and in February in the southern hemisphere. At
latitudes closer to the equator, the rainy season is double-peaked, with a dry season in winter, maxima in
spring and fall, and a mid-summer break in between. Comparing the July and January panels in figure 1,
one also notes the seasonal reversal of the prevalent near-surface wind direction typical of monsoon
climates, i.e. those climates characterized by a single rainy season and a prolonged dry season.
The role of insolation as a fundamental driver of African climate has been highlighted by paleo-
climate studies. The paleo-climatic record unquestionably shows a “green Sahara” in past periods,
so much wetter than today that it could sustain a savanna ecosystem in the Tassili-n’Ajjer mountain
range of Algeria, located at 25◦N, as recently as 6,000 years ago (see Brooks 2004 for a review, and
references therein; Petit-Maire 2002). This is explained by an increase in summer insolation due to
periodic variations in the Earth’s orbit. Due to the increase in summer insolation, monsoonal rains
rev-africa_Oct2007_final.tex; 31/10/2007; 11:57; p.6

A global perspective on African climate 7
are driven northwards further into subtropical latitudes. These paleoclimates provide valuable tests of
African climate’s sensitivity to changes in insolation. Their simulation by climate models has shown the
importance of feedbacks in the oceans and in terrestrial vegetation (e.g. Braconnot et al. 1999).
The potential for changes in insolation to alter African climate also inspired early attempts to explain
African rainfall variability in terms of “desertification” (Charney 1975). A key element in this picture is
that human activity reduces vegetation cover, which increases the albedo (i.e. reflectivity) of the surface,
resulting in less absorbed solar radiation. In analogy with theories of the green Sahara, this reduction
in absorbed energy in turn results in a reduction in precipitation. This paradigm for African climate
change emerged shortly after inception of the Sahel drought, in the early 1970s, and has remained
in the popular imagination since. In the climate science community the desertification paradigm has
in fact been supplanted by an alternative that is in many respects its exact opposite—that African
rainfall variability is primarily driven by changes in remote sea surface temperatures, rather than in
local properties of the land surface itself. Changes in terrestrial vegetation act mainly as amplifiers of
the variability forced by the oceans.
3. African climate of the 20th century
In this section we first describe temporal (section 3.1) and spatio-temporal (section 3.2) patterns of ob-
served annual mean African rainfall variability, and sketch their relation to relevant literature on regional
climate. We then compare these patterns with those simulated by many coupled ocean-atmosphere
models forced by the 20thcentury trajectory of anthropogenic aerosol and greenhouse gas emissions
(section 3.3).
We base our observational analyses3 on the gridded precipitation dataset produced by the Climatic
Research Unit of the University of East Anglia (CRU; Hulme 1992). Our baseline analyses cover the
period 1930-1995, though in Section 3.1 we extend temporal coverage to the present, using Global
Precipitation Climatology Project (GPCP; Huffman et al. 1997) data, a blended satellite-rain gauge3 All observational datasets mentioned in this paragraph—CRU, GHCN and GPCP by their acronyms—are available via
the International Research Institute for Climate and Society (IRI)’s Data Library http://iridl.ldeo.columbia.edu/index.html.
rev-africa_Oct2007_final.tex; 31/10/2007; 11:57; p.7

8 Giannini, Biasutti, Held and Sobel
product with global, i.e. land and ocean, coverage, available starting in 1979. The period from the 1930s
to the mid-1990s affords an appropriate observational coverage over Africa. Coverage as measured by
the number of stations recording monthly in the archives of the Global Historical Climate Network
(GHCN; Vose et al. 1992), stored at the U.S. National Oceanic and Atmospheric Administration’s
National Climate Data Center, is best in mid-century, and declines towards the beginning and end (not
shown).
3.1. REGIONAL VARIABILITY IN TIME (1930-2005)
Based on considerations of seasonality—which distinguishes monsoonal from equatorial climates (see
previous section)—and of regional political entities, we define three sub-regions; western (0◦to 20◦N,
20◦W to 20◦E), eastern equatorial (10◦S to 10◦N, 20◦E to 50◦E), and southern Africa (25◦S to 10◦S,
20◦E to 40◦E). These regions are broadly consistent with those chosen by Hulme et al. (2001), who also
presented the “state-of-the-art” in understanding of African climate as background to consideration of
climate change scenarios. The history of annual-mean (July to June) rainfall anomalies averaged over
these regions is displayed in figure 2.
[Figure 2 here]
Comparison of the three panels in figure 2 highlights the qualitative difference between the West
African time series on one side, and its eastern equatorial and southern African counterparts on the
other. West African rainfall is characterized by a high degree of persistence, of anomalously wet (e.g. in
the 1930s, 1950s and 1960s) and dry (e.g. in the 1970s and 1980s) years—arguably, the shift in Sahel
rainfall is unparalleled globally, in magnitude, spatial extent and duration (Lamb 1982; Katz and Glantz
1986; Hulme 1996; Nicholson et al. 1998; Trenberth et al. 2007). In eastern equatorial and southern
Africa interannual variability is more conspicuous. As will become apparent in the next subsection, this
has to do with the time scales favored by the oceanic forcings effecting these changes.
A “recovery of the rains” in the West African Sahel is debated in recent literature (e.g. L’Hote et
al. 2002; Nicholson 2005), in relation to a “greening trend” apparent in remotely sensed vegetation
since the early 1980s (Herrmann et al. 2005). Simultaneously, eastern equatorial and southern Africa
seem to have suffered from more frequent anomalously dry events. The trend towards dry conditions
rev-africa_Oct2007_final.tex; 31/10/2007; 11:57; p.8
A global perspective on African climate 9
is made even more apparent with the GPCP extension of the time series—the continuous red line in
figure 2—particularly for eastern equatorial Africa.
3.2. SPATIO-TEMPORAL PATTERNS OF AFRICAN CLIMATE VARIABILITY
To identify patterns of African climate variability at the continental scale, and to connect these patterns
to common, global-scale forcings, we use Principal Component Analysis (PCA; von Storch and Zwiers
1999), a statistical technique widely used in the Earth and social sciences, and linear regression. In our
analysis, PCA objectively identifies spatial patterns that express co-variability in time across all tropical
African grid points in the CRU dataset. By maximizing the variance captured in the first such pattern,
and in subsequent orthogonal, or independent, patterns, PCA identifies broad spatial features, allowing
one to summarize a large fraction of the information with a small number of time series. We apply PCA
to annual-mean (July-June) precipitation anomalies, with respect to the long-term mean, in the domain
between 35◦S and 30◦N, 20◦W and 60◦E4. We apply linear regression to relate the temporal variability
associated with the spatial patterns identified by PCA to other aspects of the global ocean-atmosphere
system.
[Figure 3 here]
Statistical analysis of African rainfall variability has a long history. In one of the first continental-
scale studies Nicholson (1986) identified two recurrent spatial patterns over Africa. One was char-
acterized by continent-wide anomalies of the same sign, the other by anomalies of opposite sign at
equatorial latitudes and at the poleward margins of monsoon regions. Nicholson’s findings are echoed
in our analysis (figure 3). Three patterns stand out; one exemplifies a continent-wide drying most sig-
nificant at the poleward edges of the monsoons, and the other two the influence of ENSO5, dominant on
eastern equatorial and southern Africa. The three patterns combined capture 37% of the total variance in
precipitation over the tropical African domain considered. Our discussion in the following subsections
will focus on these patterns. That they are actually representative of regional anomalies is demonstrated4 This analysis was repeated on GHCN station data on a shorter period (1950-1995; not shown), yielding consistent results.5 A coupled ocean-atmosphere phenomenon which originates in the tropical Pacific, and has world-wide impacts (see
Wallace et al. 1998, and accompanying articles in the same issue of J. Geophys. Res.). ENSO-related variability can be
identified by its preferred interannual time scale, given that an ENSO event usually recurs every 2 to 7 years.
rev-africa_Oct2007_final.tex; 31/10/2007; 11:57; p.9
10 Giannini, Biasutti, Held and Sobel
by the significant correlation of their associated time series (figures 3d,e,f) with the regional averages
described in the previous subsection (over 1930-1995); the West African average is unequivocally cor-
related with the “continental drying” pattern (correlation is 0.97), while eastern equatorial and southern
African averages are correlated with both “drying” and “ENSO” patterns (with correlations of the order
of 0.5).
3.2.1. A continental precipitation pattern and its relation to global ocean temperature
The leading pattern of annual-mean variability in precipitation over 1930-1995 is displayed in figure
3, left column. The spatial pattern (figure 3a) is continental in scale. It takes on stronger values in
the northern hemisphere, including in the Sahel and along coastal Gulf of Guinea, and weaker, but
significant values at tropical latitudes over southern Africa. In fact, this pattern resembles that of the
linear trend computed over the same period (not shown)—an overall drying trend. However, the linear
trend does not capture all the important features of the time series associated with the pattern shown
in figure 3. Fluctuations with a multidecadal time scale superimposed on year-to-year variations are
evident in figure 3d: the 1950s and 1960s were clearly wetter than the long-term average, but so were
the 1930s. The wetter-than-average central decades of the 20thcentury certainly contribute to making
the contrast with the drier decades that followed, in the 1970s and 1980s, even starker. This pattern is
statistically related to global SSTs, with the sign such that drying over Africa is associated with warmer
tropical Pacific, Indian and South Atlantic Oceans, and a cooler North Atlantic basin (figure 3g; Folland
et al. 1986; Giannini et al. 2003).
In the northern hemisphere this drying pattern combines features expressed seasonally in spring
and summer respectively along coastal Gulf of Guinea and across the Sahel (not shown; Wagner and
DaSilva 1994; Nicholson 1981; Lamb and Peppler 1992; Janicot et al. 1996). Possibly because it is
based on annual mean rainfall, our analysis does not isolate the well studied “rainfall dipole pattern”
between Sahel and Gulf of Guinea (Fontaine and Janicot 1996; Nicholson et al. 2000; Vizy and Cook
2001, 2002; Cook and Vizy 2006, Reason and Rouault 2006). Previous studies have proposed two
explanations for the influence of oceanic temperatures on West African rainfall. The first one is a
moisture supply argument, articulated by Lamb (1978) and Folland et al. (1986), and more recently
by Rotstayn and Lohmann (2002) and Hoerling et al. (2006). It emphasizes the role of the north/south
rev-africa_Oct2007_final.tex; 31/10/2007; 11:57; p.10

A global perspective on African climate 11
SST gradient, which is particularly evident in the Atlantic basin (figure 3g). This explanation relates
the recent, persistent drying of the Sahel to an equatorward shift of the mean location of the Atlantic
ITCZ, connecting reduced oceanic precipitation with a weaker West African monsoonal flow. A com-
plementary explanation, consistent with the modeling results of Giannini et al. (2003), Bader and Latif
(2003), Lu and Delworth (2005) and Herceg et al. (2007), and with the idealized study of Chiang and
Sobel (2002), is a stabilization argument in which warmer Indo-Pacific SST causes a warming of the
entire tropical troposphere, stabilizing the tropical troposphere from above in the Atlantic sector and
over Africa. The key to this mechanism is that the continental boundary layer is unable to increase
its energy content and buoyancy to keep up with the energy content over the surrounding oceans. The
issue of whether West African rainfall is affected not only by ocean temperature gradients, but also by
spatially uniform increases in oceanic temperatures, is central to projections of climate change in the
21stcentury.
In the southern hemisphere the indication for a recent, persistent drying is significant, but not as
strong as in the northern hemisphere. When southern Africa is considered in isolation, a significant
drying trend is seen since the 1970s (Nicholson 1993; Mason and Tyson 2000), but not on longer,
centennial timescales (Fauchereau et al. 2003). As we will show in the next subsection, ENSO is the
dominant influence on the predictable component of interannual rainfall variability in eastern equatorial
and southern Africa. Nevertheless, anthropogenic influences cannot be ruled out (e.g. Mason 2001).
One possibility is that the drying signal in southeastern Africa is due in part to the warming trend in
the Indian Ocean (Hoerling et al. 2006), which is understood to enhance the drying impact of warm
ENSO events on this region (Richard et al. 2000). Another possibility is that global warming has caused
the recent trend towards more frequent and persistent warm ENSO events (Timmermann et al. 1999,
Trenberth and Hoar 1997), thus affecting southern African rainfall indirectly. Despite improvements
in the simulation of ENSO dynamics in the current generation of coupled ocean-atmosphere models,
however, projections of change in either amplitude or frequency of future ENSO events are not robust
(Meehl et al. 2007).
rev-africa_Oct2007_final.tex; 31/10/2007; 11:57; p.11

12 Giannini, Biasutti, Held and Sobel
3.2.2. Interannual variability related to ENSO
ENSO is the dominant phenomenon in the two remaining patterns (figure 3, center and right columns).
Its signature in SST—anomalies of one sign centered on the equator in the central and eastern tropical
Pacific basin surrounded by anomalies of the opposite sign at subtropical latitudes, in the characteristic
“horseshoe” pattern (Rasmusson and Carpenter 1982)—is clear in figures 3h,i. ENSO has a well-known
impact on rainfall in eastern equatorial and southern Africa (Ropelewski and Halpert 1987; Ogallo 1989;
Nicholson and Kim 1997; Goddard and Graham 1999; Schreck and Semazzi 2004; Cane et al. 1994;
Unganai 1996; Mason 2001; Mulenga et al. 2003; Reason and Jagadheesha 2005), as depicted in figures
3b,c. However, it is also understood to have a non-negligible effect north of the equator (Seleshi and
Demaree 1995; Janicot et al. 1996; Ward 1998; Rowell 2001; Giannini et al. 2003; Korecha and Barnston
2007), especially when care is taken to separate the year-to-year from the multi-decadal variability
described in the previous subsection.
ENSO impacts Africa directly via an atmospheric teleconnection (Glantz et al. 1991; Wallace et
al. 1998) and indirectly, via the response of the Indian and Atlantic basins to it (Klein et al. 1999;
Alexander et al. 2002). The direct influence of ENSO over Africa follows the path outlined above for the
influence of the Indo-Pacific warming trend under the stabilization mechanism. During a warm ENSO,
or El Nino event6 the entire tropical troposphere warms as a response to the warming of the central and
eastern equatorial Pacific (Yulaeva and Wallace 1994, Soden 2000, Sobel et al. 2002). Outside the central
and eastern equatorial Pacific, stabilization of the atmospheric column initially leads to below-average
precipitation in remote regions (Chiang and Sobel 2002), as is observed during the growth phase of
warm ENSO events, which coincides with the northern hemisphere monsoon season in South and East
Asia, Africa and Central America (Ropelewski and Halpert 1987; Kiladis and Diaz 1989; Lyon 2004).
The third pattern captures this purely atmospheric influence—note how the tropical Pacific SST
anomalies in figure 3i dwarf any signal in the ocean basins around Africa. The atmospheric signal is
indeed a drying in the case of a warm ENSO event, as discussed by Goddard and Graham (1999) in
the context of comprehensive climate model simulations, and explained by Chiang and Sobel (2002)
6 To the extent that the system is linear, all features described for a warm ENSO, or El Nino event, are reversed in sign for
a cold ENSO, or La Nina event.
rev-africa_Oct2007_final.tex; 31/10/2007; 11:57; p.12

A global perspective on African climate 13
and Neelin et al. (2003) in more idealized frameworks. In our analysis this signal is strongest in eastern
Africa between the equator and 20◦S.
The second pattern represents the “canonical” ENSO influence, one that combines the effects of
remote, or tropical Pacific, and local, especially Indian Ocean, surface temperatures (figure 3h). It
captures the wetter than average conditions over eastern equatorial Africa known to be a maximum
during the October-December short rains, which coincide with mature warm ENSO conditions, as well
as the drier than average conditions over southern Africa known to be most prominent in the January-
March season immediately subsequent to the mature phase (figure 3b). The Indian Ocean SST anomalies
associated with the dipolar rainfall pattern between eastern equatorial and southern Africa are related in
part to ENSO7. Due to their thermal inertia, the remote tropical oceans warm in response to the ENSO-
induced changes in the tropospheric temperature with a lag of a few months (see, e.g. Klein et al. 1999;
Chiang and Sobel 2002; Sobel et al. 2002; Su et al. 2005; Chiang and Lintner 2005). In some remote
oceanic regions, ENSO-induced changes in surface wind stress drive an additional SST increase via
ocean dynamics (e.g. Bracco et al. 2005; Song et al. 2006 in the case of the Indian Ocean), reversing
the initial direct atmospheric stabilization and leading to destabilization of the tropical troposphere from
the bottom up. This effect, together with an increased moisture transport associated with enhanced
evaporation over the warmer than average Indian Ocean, can lead to positive precipitation anomalies for
eastern equatorial Africa (Goddard and Graham 1999). Hence in this region a warm ENSO can induce
below-average precipitation when the atmospheric bridge dominates, as depicted in the third pattern,
or it can result in above-average precipitation, when the dynamically-induced Indian Ocean response
overwhelms the remote atmospheric effect, as in the second pattern. Song et al. (2006) have recently
argued that the timing of ENSO with respect to the seasonal cycle of upwelling in the eastern Indian
Ocean helps determine whether the dynamic Indian Ocean component visible in figure 3b becomes
dominant.
To summarize, when observations of precipitation over Africa are analyzed with a view to their
global linkages, two continental-scale patterns, related to variability in the oceans, appear to dominate
7 The controversy relating to the existence of an Indian Ocean dipole mode in SST independent of ENSO (Saji et al. 1999;
Webster et al. 1999), captured in the references to Hastenrath (2002), is beyond the scope of this study.
rev-africa_Oct2007_final.tex; 31/10/2007; 11:57; p.13

14 Giannini, Biasutti, Held and Sobel
African climate variability: (1) a continental-scale drying pattern related to enhanced warming of the
southern compared to the northern tropics and to a warming of the tropical oceans, (2) the impact of
ENSO on the tropical atmosphere and oceans around Africa.
While beyond the scope of this paper, it should be noted that seasonal climate prediction hinges
on the exploitation of these relationships: the slow evolution of SST anomalies provides the memory
that makes the forecast of rainfall anomalies possible from weeks to a few months out. The potential for
practical usefulness has been widely acknowledged. Washington et al. (2006) argue that the development
of strategies to cope with climate variability at the interannual time scale should be a primary goal for
African climate science. Building adaptive capacity at the faster climate variability time scales, on one
hand, can provide a roadmap to adaptation to aspects of climate change (such as in the increase of
extreme events) and, on the other hand, can foster the necessary links at the climate-society interface.
The necessity for the production, dissemination, and use of climate information has led to the organi-
zation of regional seasonal climate outlook forums—an effort that has been on-going for 10 years now
in western, eastern equatorial and southern Africa, uniting climate forecasters, stakeholders and media
in one venue. Tarhule and Lamb (2003) and Patt et al. (2007) and references therein provide excellent
overviews of lessons learned.
3.3. LATE 20TH CENTURY CLIMATE CHANGE IN RECENT SIMULATIONS
In early 2005, simulations with state-of-the-art climate models from 16 research centers were made
available to the scientific community by the World Climate Research Program through the 3rd Coupled
Model Intercomparison Project (WCRP/CMIP3), hosted at the Program for Climate Modeling Diag-
nosis and Intercomparison (PCMDI; http://www-pcmdi.llnl.gov/ ipcc/about ipcc.php) in preparation for
the 4th Assessment Report of the Intergovernmental Panel on Climate Change (IPCC 4AR), published in
2007. In this subsection and the next section we discuss our analysis of 20thand 21
stcentury simulations
of African climate change with 19 models taken from the WCRP/CMIP3 archive (Biasutti and Giannini
2006). Lau et al. (2006a) and Cook and Vizy (2006) provide other valuable analyses of African rainfall
using the same archive of simulations. The consensus view is summarized in Christensen et al. (2007).
rev-africa_Oct2007_final.tex; 31/10/2007; 11:57; p.14

A global perspective on African climate 15
In this subsection we discuss the comparison between simulations obtained with the same climate
models integrated under two different protocols. In one case—the control, or pre-industrial (PI) simulations—
aerosol and greenhouse gas emissions are set to constant values representative of conditions before
anthropogenic contributions to these climate forcings became significant. In the other—the forced, or
20thcentury (XX) simulations—the historical progression of emissions associated with industrialization,
which constitute the anthropogenic forcing8 , is introduced, and influences the evolution of the climate
system from the second half of the 19th century to the present.
While the historical concentrations of anthropogenic greenhouse gases are fairly accurately inferred
from fossil fuel extraction records, the historical concentration, type, and spatial distribution of aerosols
remain uncertain (Forster et al. 2007). The response of the climate system can vary greatly depending
on whether the forcing includes only predominantly reflecting aerosols, e.g. sulfate aerosols, or both
reflecting and absorbing aerosols, e.g. black carbon, (e.g. Menon et al. 2002; Lau et al. 2006b). Further-
more, only a few models include parameterizations of the indirect effects of aerosols, i.e. those occurring
via the aerosols’ interaction with cloud microphysics and precipitation efficiency (Lohmann et al. 2000).
However, as disparate as the diagnosis or prognosis of the aerosols’ impact may be, when the forced, or
20thcentury (XX) simulations, are compared to the control, or pre-industrial (PI) simulations, features
that are consistent across models can be identified in the surface temperature and precipitation fields.
Multi-model ensemble averages of annual-mean surface temperature and precipitation are presented
in the subsections that follow. Multi-model ensemble averaging (see e.g. Krishnamurti et al. 1999; Barn-
ston et al. 2003; Hagedorn et al. 2005 in the context of seasonal climate prediction) is one way to deal
with uncertainties related to parameterizations, i.e. those components of the models that represent pro-
cesses that cannot be simulated from first principles, whether because of finite computational resources
or incomplete knowledge of the governing physics. The hope is that differences among models that are
not physical will cancel, while common robust responses will be retained. Figure 4 shows the changes
in annual-mean surface temperature and precipitation between the last 25 years of the 20thcentury
(XX) and a 25-year period in the pre-industrial (PI) simulations, i.e. the XX-PI difference (Biasutti
8 Certain models also include natural variability associated with changes in insolation, and volcanic aerosols, as well as
land use/land cover change, in their 20thcentury simulations.
rev-africa_Oct2007_final.tex; 31/10/2007; 11:57; p.15

16 Giannini, Biasutti, Held and Sobel
and Giannini 2006). The top panels show the average of all models, the bottom panels a measure of
inter-model agreement (see caption for details).
[Figure 4 here]
3.3.1. XX-PI changes in surface temperature
Compared to pre-industrial times, late 20thcentury annual-mean surface temperature increases less in
the mid-latitude extratropics than in the deep tropics and in high latitudes (figure 4a), with many models
cooling the mid-latitude northern hemisphere oceans. This modeled response is very similar to the
linear trend pattern in observed surface temperature computed over 1950-2000 (Hansen et al. 1999;
http://data.giss.nasa.gov/gistemp/maps/), in both spatial signature and amplitude. This pattern has been
the subject of intensive investigation (see, in past IPCC reports, Santer et. al. 1996 and Mitchell et al.
2001, and, more recently, Stott et al. 2006) and we do not discuss it further here except to note that
in model simulations reflecting sulfate aerosols contribute to minimizing the warming in the northern
hemisphere.
3.3.2. XX-PI changes in precipitation
The XX - PI difference in SST discussed above bears a striking resemblance to that identified by Folland
et al. (1986) and Giannini et al. (2003) to have been associated with drought in the Sahel (also see
figure 3g here). Consistently, the response pattern in the annual mean (and, more prominently, in the
June-August average) of precipitation shows a decrease across the tropical Atlantic ITCZ and into the
Sahel in the late 20thcentury compared to the pre-industrial control. This is echoed in all models, except
two which show negligible anomalies (figure 4d; also see figure 2 in Biasutti and Giannini 2006). We
conclude that anthropogenic forcings played a non negligible role in the late 20thcentury drying of
the Sahel (Held et al.2005; Biasutti and Giannini 2006; Rotstayn and Lohmann 2002), although there
is little doubt that a large fraction of the observed variations in Sahel rainfall was generated by natural
SST variability. A rough estimate suggests that the anthropogenic contribution is about 30% of the recent
long-term drying trend. The current model archive is not suited to separating the effects of aerosols from
those of increasing greenhouse gases. The fact that this 20thcentury drying trend in the Sahel does not
continue into the 21stcentury in a majority of models (see below) nonetheless strongly suggests that
rev-africa_Oct2007_final.tex; 31/10/2007; 11:57; p.16

A global perspective on African climate 17
models may be more consistently representing a change in the moisture supply mechanism, in this case
expressed in the North-South gradient in SST forced by aerosols and attendant displacement of the
Atlantic ITCZ, rather than in the stabilization mechanism associated with the more uniform tropical
SST warming forced by greenhouse gases (Biasutti and Giannini 2006). However, in one model, that
developed at NOAA’s Geophysical Fluid Dynamics Laboratory, Held et al. (2005) find a clear signature
of drying due to greenhouse gases.
The drying of the Sahel is accompanied, in the annual mean picture, by anomalies in eastern equato-
rial and southern Africa reminiscent of the response to ENSO, i.e. wet anomalies in eastern equatorial
and dry anomalies in southern Africa, but these anomalies are weak and inconsistent across models,
even more so during the December-February season (not shown), when the ENSO-related signal should
be most prominent. This lack of agreement seems surprising, given that models forced with the historic
global SST consistently show a drying trend in southern Africa (Hoerling et al. 2006). It is possible that
the observed drying trend was a consequence of the prevalence of warm ENSO events at the end of the
20thcentury, and that coupled models do not simulate such prevalence, either because it is not a forced
behavior or because the models’ simulation of ENSO is not sufficiently accurate.
4. The uncertain future: a global warming scenario simulation
Climate science has made impressive inroads in understanding climate variability and change. A future,
further warming of the planet is predicted with certainty. Yet, the regional patterns of climate change,
especially potential future shifts in the spatial distribution of tropical rainfall, remain uncertain. In
figure 5 we compare the climate of the late 20thcentury to that of the late 21
stcentury as simulated
in the A1B climate change scenario by the same 19 models introduced in the previous section—we plot
the difference between the last 25 years in the A1B and 20thcentury simulations. In the A1B scenario a
growing world economy and the adoption of cleaner technologies combine to give growing greenhouse
gas concentrations and declining sulfate aerosol loadings.
[Figure 5 here]
rev-africa_Oct2007_final.tex; 31/10/2007; 11:57; p.17

18 Giannini, Biasutti, Held and Sobel
The global warming signature emerges clearly in the annual-mean temperature difference (figure 5a).
The models show (i) a more equatorially symmetric warming of the tropical oceans, (ii) a more consis-
tent ENSO signal in the 21stcompared to the 20
thcentury, with a pronounced, El Nino-like warming of
the central and eastern equatorial Pacific9, and (iii) a more pronounced land-sea temperature contrast,
with warming of the continents that surpasses the warming of the tropical oceans. In Africa, the sur-
face warming is largest in desert regions, and relatively more modest in equatorial regions, where the
increased radiative forcing is partly used to evaporate soil moisture.
The precipitation signal is less clear. Over Africa, the multi-model mean in precipitation (figure
5b) suggests more intense rainfall in equatorial regions and drier conditions elsewhere (Christensen
et al. 2007), but this prediction is not unanimous across models (figure 5d): it is more robust in eastern
equatorial Africa, where a majority of models agree on a trend towards wetter conditions, but less certain
in southern Africa, where there is some indication of a drying trend (Hoerling et al. 2006), but much
scatter in the model solutions. There is no agreement on whether the Sahel will be drier or wetter in
the future (Held et al. 2005; Biasutti and Giannini 2006; Hoerling et al. 2006; Cook and Vizy 2006).
Averages for the same three regions defined in Section 3.1—western, eastern equatorial and southern
Africa—in the last 50 years of the 20thcentury simulations and in the 21
stcentury simulations are plotted
in figure 6, for each model, and for the multi-model mean. The scatter among models, which has not
changed significantly since Hulme et al. (2001; see their figure 13), is the most visible feature.
[Figure 6 here]
These results are based on a uniform weighting of all models in the WCRP/CMIP3 archive. But
some of the models clearly have better simulations of African rainfall than others (Cook and Vizy 2006;
Kamga et al. 2000). The question of how best to weigh the different projections in such an ensemble of
models remains open. There are many possible metrics, some focusing on regional climate simulations
and others evaluating the models more globally, some on the behavior of the atmospheric model when
run over observed SSTs, and others on the behavior of the coupled system. What is lacking at present
is an accepted strategy for determining which metrics are most relevant to evaluate a model’s projection
of African rainfall.
9 But see Collins et al. (2003), Guilyardi (2006) on the El Nino response to global warming.
rev-africa_Oct2007_final.tex; 31/10/2007; 11:57; p.18
A global perspective on African climate 19
Partly based on inspection of this model archive we can generate hypotheses that may help clarify
why models differ in their 21stcentury responses (also see Biasutti et al., recently revised for Journal
of Climate). A uniform warming is confidently expected to lead to an increase in specific humidity
(Allen and Ingram 2002; Held and Soden 2006). The hypothesis that regional precipitation changes
are determined by this humidity change, rather than by changes to the circulation (e.g. Trenberth et al.
2003), leads to a prediction of an increase in rainfall in currently rain-rich regions, and a decrease in
currently semi-arid regions, a prediction that is borne out in climate simulations in a zonally averaged
sense, but not throughout Africa (although it may help in interpreting the projected increase in rainfall in
eastern equatorial Africa). A related response, in which the rainiest regions become rainier, and drying
occurs at the margins of those regions, is predicted by a climate model of intermediate complexity, in
association with circulation as well as humidity changes (Neelin et al. 2003). (iii) El-Nino-like climate
change could lead to teleconnections similar to those seen at interannual time scales, which would tend
to dry much of the African continent. (iv) An enhanced land-sea temperature contrast, whereby oceans
warm less than continents due to land surface or cloud feedbacks, could lead to an intensification of
monsoonal circulations, hence an increase in moisture supply and thus rainfall in the Sahel (Haarsma
et al. 2005). The current challenge is to determine the relative importance of these various mechanisms
over Africa, and to design metrics that tell us whether the model simulations are adequate to provide a
meaningful prediction of future change in African rainfall.
5. Conclusions: a climate perspective on African environmental change
African environmental change is often interpreted as a regional phenomenon with local anthropogenic
causes and potentially global effects. On the one hand, the local causes are commonly ascribed to the
mismanagement of limited natural resources under the ever-increasing pressure of a growing, vulnerable
population, while external causes of degradation such as remotely-forced drought are underplayed.
A perverse feedback loop in which the poorest of the poor deprive themselves by impoverishing the
environment they depend on for their livelihoods is often simplistically invoked, despite much literature
that expands on the complexity of the environmental degradation-poverty nexus (e.g. Broad 1994; Du-
rev-africa_Oct2007_final.tex; 31/10/2007; 11:57; p.19
20 Giannini, Biasutti, Held and Sobel
raiappah 1998). On the other hand, the global threat posed by African environmental change is often
exaggerated. The notion that human-induced change in land use or land cover plays a significant role
in altering African rainfall, and from there the global atmospheric circulation, has not been proven
(see Nicholson 2000, and references therein for a review). Rather, the evidence summarized in the
Introduction, based on remote sensing of vegetation cover and on climate modeling, falsifies the claim
that these local processes are quantitatively important compared to the imprint of large-scale patterns of
climate variability and change on regional scales.
In this paper we explored a climate perspective on African environmental change by focusing on
how global climate can cause large-scale changes in rainfall patterns over Africa. We identified two
mechanisms relevant to changes in African rainfall of the recent past and future—a moisture supply
mechanism, and a stabilization mechanism—and indicated that competition between them in a warming
world may explain the uncertainties in projections of African rainfall into the next century.
Our analysis of annual-mean, continental-scale variability of African precipitation, as observed over
the better part of the 20thcentury and modeled in the WCRP/CMIP3 simulations, supports the link
between a trend towards drier conditions for the monsoon regions of Africa over the second half of
the 20thcentury and a pattern of tropical ocean warming (see Sections 3.1 and 3.2). The persistence
of drying in the Sahel is confirmed locally (L’Hote et al. 2002; West et al. 2007). We highlight the
skill of the WCRP/CMIP3 models in reproducing certain large-scale features (see Section 3.3), and
discuss evidence in support of partial attribution of drought in the Sahel to anthropogenic forcings,
specifically to the combined effects of aerosols and greenhouse gases (Held et al. 2005, Biasutti and
Giannini 2006; Rotstayn and Lohmann 2002). Similarly, we relate a drying trend in tropical southern
Africa, consistently found in very recent observations and in projections, to the warming of the Indian
Ocean, while agreeing that its potential anthropogenic origin may have been confounded by the more
frequent occurrence of warm ENSO events since the mid-1970s compared to the mid-20thcentury.
However, the broad agreement across models on the relationship between global tropical sea surface
temperature and African rainfall does not continue to hold in model projections of West African climate
(Hoerling et al 2006; Christensen 2007). The very recent multi-year dry spell observed in eastern equa-
torial Africa is at odds with projections of wetter equatorial climates. These discrepancies obviously
rev-africa_Oct2007_final.tex; 31/10/2007; 11:57; p.20

A global perspective on African climate 21
point to work that needs to be done to fully understand the complex interplay between oceanic and
continental, local and remote influences of variability and change.
In conclusion, recent advances in climate research confirm the need for a global climate system per-
spective to interpret the causes of change in African rainfall and their consequences on the environment—
a shift in focus from regional land use and land cover and the actions of Africans, to the global distribu-
tion of oceanic temperatures, both naturally varying and as influenced by anthropogenic emissions from
the industrial north. It is hoped that the global community’s “mainstreaming of climate in development”,
i.e. the inclusion of a global climate change perspective in discussions of African development, will
result in renewed consideration of issues of environmental justice and the morality of mitigation vs.
adaptation strategies.
Acknowledgements
Jeffrey Sachs, David Battisti, Polly Ericksen, Tsegay Wolde-Georgis, Jian Lu and Tom Delworth for
their encouragement, and for sharing their knowledge. Naomi Naik for her technical support, espe-
cially for her patience in downloading model output. The Intergovermental Panel on Climate Change
(IPCC) and the Program for Climate Modeling Diagnosis and Intercomparison (PCMDI) for making
the model output available in preparation of the IPCC’s 4th Assessment Report. The Earth Institute
at Columbia University’s Cross-Cutting Initiative on Climate and Society (led by Mark Cane, Cynthia
Rosenzweig and Steve Zebiak), NOAA (AG: Office of Global Programs grant NA07GP0213, MB: grant
NAO30AR4320179), and the David and Lucile Packard Foundation Fellowship (MB, AHS) for their
financial support.
rev-africa_Oct2007_final.tex; 31/10/2007; 11:57; p.21

22 Giannini, Biasutti, Held and Sobel
References
Afiesimana, E. A., Pal, J. S., Abiodun, B. J., Gutowski Jr., W. J. and Adedoyin, A. 2006: Simulation of West African monsoon
using the RegCM3. Part I: model validation and interannual variability. Theor. Appl. Clim., 86, 23–37. 10.1007/s00704-
005-0202-8.
Alexander, M. A., Blade, I., Newman, M., Lanzante, J. R., Lau, N.-C. and Scott, J. D. 2002: The atmospheric bridge: the
influence of ENSO teleconnections on air-sea interaction over the global oceans. J. Climate, 15, 2205–2231.
Allen, M. and Ingram, W. 2002: Constraints on future changes in climate and the hydrological cycle. Nature, 419, 224–232.
Anyamba, A. and Eastman, J. 1996: Interannual variability of NDVI over Africa and its relation to El Nino/Southern
Oscillation. Int. J. Remote Sensing, 17, 2533–2548.
Bader, J. and Latif, M. 2003: The impact of decadal-scale Indian Ocean sea surface temperature anomalies on Sahelian rainfall
and the North Atlantic Oscillation. Geophys. Res. Lett. doi:10.1029/2003GL018426.
Barnston, A. G., Mason, S. J., Goddard, L., DeWitt, D. G. and Zebiak, S. E. 2003: Multimodel ensembling in seasonal climate
forecasting at IRI. Bull. Amer. Meteor. Soc., 84, 1783–1796.
Biasutti, M. and Giannini, A. 2006: Robust Sahel drying in response to late 20th century forcings. Geophys. Res.
Lett., 11, L11706. doi:10.1029/2006GL026067.
Biasutti, M., Battisti, D. S. and Sarachik, E. S. 2003: The annual cycle over the tropical Atlantic, South America, and Africa.
J. Climate, 16, 2491–2508.
Biasutti, M., Held, I. M., Sobel, A. H. and Giannini, A. 2007: SST forcings and Sahel rainfall variability in simulations of
20th and 21st centuries. Revised for publication in J. Climate.
Bracco, A., Kucharski, F., Molteni, F., Hazeleger, W. and Severijns, C. 2005: Internal and forced modes of variability in the
Indian Ocean. Geophys. Res. Lett., 32, L12707. doi:10.1029/2005GL023154.
Braconnot, P., Joussaume, S., Marti, O. and deNoblet, N. 1999: Synergistic feedbacks from the ocean and vegetation on the
African monsoon response to mid-Holocene insolation. Geophys. Res. Lett., 26(16), 2481–2484.
Broad, R. 1994: The poor and the environment: friends or foes?. World Development, 22, 811–822.
Brooks, N. 2004: Drought in the African Sahel: long term perspectives and future prospects. Tyndall Centre for Climate
Change Research, Working paper 61.
Cane, M. A., Eshel, G. and Buckland, R. W. 1994: Forecasting Zimbabwean maize yield using eastern equatorial Pacific sea
surface temperature. Nature, 370, 204–205.
Charney, J. 1975: Dynamics of deserts and drought in the Sahel. Q. J. Roy. Meteor. Soc., 101, 193–202.
Chiang, J. C. H. and Lintner, B. R. 2005: Mechanisms of remote tropical surface warming during El Nino. J. Cli-
mate, 18, 4130–4149. DOI: 10.1175/JCLI3529.1.
Chiang, J. C. H. and Sobel, A. H. 2002: Tropical tropospheric temperature variations caused by ENSO and their influence on
the remote tropical climate. J. Climate, 15, 2616–2631.
rev-africa_Oct2007_final.tex; 31/10/2007; 11:57; p.22
A global perspective on African climate 23
Christensen, J. H., Hewitson, B., Busuioc, A., Chen, A., Gao, X., Held, I., Jones, R., Kolli, R. K., Kwon, W.-T., Laprise, R.,
Magaa Rueda, V., Mearns, L., Menndez, C. G., Risnen, J., Rinke, A., Sarr, A. and Whetton, P. 2007: Regional climate
projections. Climate Change 2007: The physical science basis. Contribution of Working Group I to the Fourth Assessment
Report of the Intergovernmental Panel on Climate Changepp. 847–940. Solomon, S., D. Qin, M. Manning, Z. Chen, M.
Marquis, K.B. Averyt, M. Tignor and H.L. Miller (eds.).
Collins, M. and the CMIP Modelling Groups 2003: El Nino or La Nina-like climate change?. Clim. Dyn., 24, 89–104. doi:
10.1007/s00382-004-0478-x.
Cook, K. H. and Vizy, E. K. 2006: Coupled model simulations of the West African monsoon system: 20th century simulations
and 21st century predictions. J. Climate, 19, 3681–3703.
Duraiappah, A. 1998: Poverty and environmental degradation: a review and analysis of the nexus. World Develop-
ment, 26, 2169–2179.
Eklundh, L. and Olsson, L. 2003: Vegetation index trends for the African Sahel 1982-1999. Geophys. Res. Lett. Apr 2003.
Fauchereau, N., Trzaska, S., Rouault, M. and Richard, Y. 2003: Rainfall Variability and Changes in Southern Africa during
the 20th Century in the Global Warming Context. Natural Hazards, 29, 139–154. DOI 10.1023/A:1023630924100.
Folland, C. K., Palmer, T. N. and Parker, D. E. 1986: Sahel rainfall and worldwide sea temperatures, 1901-85. Na-
ture, 320, 602–607.
Fontaine, B. and Janicot, S. 1996: Sea surface temperature fields associated with West African rainfall anomaly types. J.
Climate, 9, 2935–2940.
Forster, P., Ramaswamy, V., Artaxo, P., Berntsen, T., Betts, R., Fahey, D. W., Haywood, J., Lean, J., Lowe, D. C., Myhre,
G., Nganga, J., Prinn, R., RAga, G., Schulz, M. and Van Dorland, R. 2007: Changes in atmospheric constituents and
in radiative forcing. Climate Change 2007: The physical science basis. Contribution of Working Group I to the Fourth
Assessment Report of the Intergovernmental Panel on Climate Changepp. 129–234. Solomon, S., D. Qin, M. Manning, Z.
Chen, M. Marquis, K.B. Averyt, M. Tignor and H.L. Miller (eds.).
Giannini, A., Saravanan, R. and Chang, P. 2003: Oceanic forcing of Sahel rainfall on interannual to interdecadal time scales.
Science, 302, 1027–1030. Published online 9 October 2003. 10.1126/science.1089357.
Glantz, M. H., Katz, R. W. and Nicholls, N. 1991: Teleconnections linking worldwide climate anomalies. Cambridge
University Press, 535 pp.
Goddard, L. and Graham, N. E. 1999: Importance of the Indian Ocean for simulating rainfall anomalies over eastern and
southern Africa. J. Geophys. Res., 104, 19099–19116.
Guilyardi, E. 2006: El Nino-mean state-seasonal cycle interactions in a multi-model ensemble. 2006, 26, 329–348.
doi:10.1007/s00382-005-0084-6.
Haarsma, R. J., Selten, F., Weber, N. and Kliphuis, M. 2005: Sahel rainfall variability and response to greenhouse warming.
Geophys. Res. Lett. doi:10.1029/2005GL023232.
rev-africa_Oct2007_final.tex; 31/10/2007; 11:57; p.23

24 Giannini, Biasutti, Held and Sobel
Hagedorn, R., Doblas-Reyes, F. and Palmer, T. 2005: The rationale behind the success of multi-model ensembles in seasonal
forecasting - I. Basic concept. Tellus A, 57, 219–233. doi:10.1111/j.1600-0870.2005.00103.x.
Hansen, J., Ruedy, R., Glascoe, J. and Sato, M. 1999: GISS analysis of surface temperature change. J. Geophys. Res. -
Atmos., 104, 30997–31022. doi:10.1029/1999JD900835.
Hastenrath, S. 1991: Climate dynamics of the tropics. Kluwer Academic Publishers, Dordrecht, The Netherlands.
Hastenrath, S. 2002: Dipoles, temperature gradients and tropical climate anomalies. Bull. Amer. Meteor. Soc., 83, 735–738.
Held, I. and Soden, B. 2006: Robust responses of the hydrological cycle to global warming. J. Climate, 19, 5686–5699.
Hellden, U. 1991: Desertification - time for an assessment?. Ambio, 20, 372–383.
Herceg, D., Sobel, A. H. and Sun, L. 2007: Regional modeling of decadal rainfall variability over the Sahel. Clim. Dyn., 29, 89–
99.
Herrmann, S. M., Anyamba, A. and Tucker, C. J. 2005: Recent trends in vegetation dynamics in the African Sahel and their
relationship to climate. Global Environ. Change, 15, 394–404.
Hickler, T., Eklundh, L., Seaquist, J. W., Smith, B., Ardo, J., Olsson, L., Sykes, M. and Sjostrom, M. 2005: Precipitation
controls Sahel greening trend. Geophys. Res. Lett. doi:10.1029/2005GL024370, L21415.
Hoerling, M. P., Hurrell, J. W., Eischeid, J. and Phillips, A. S. 2006: Detection and attribution of 20th century northern and
southern African monsoon change. J. Climate, 19, 3989–4008.
Huffman, G. J., Adler, R. F., Arkin, P., Chang, A., Ferraro, R., Gruber, A., Janowiak, J., McNab, A., Rudolf, B. and Schnei-
der, U. 1997: The global precipitation climatology project (GPCP) combined precipitation dataset. Bull. Amer. Meteor.
Soc., 78, 5–20.
Hulme, M. 1992: A 1951-80 global land precipitation climatology for the evaluation of general circulation models. Climate
Dyn., 7, 57–72.
Hulme, M. 1996: Recent climatic change in the world’s drylands. Geophys. Res. Lett., 23, 61–64.
Hulme, M., Doherty, R., Ngara, T., New, M. and Lister, D. 2001: African climate change: 1900-2100. Clim. Res., 17, 145–168.
IRI 2006: A gap analysis for the implementation of the Global Climate Observing System programme in Africa. The
International Research Institute for Climate and Society (IRI), in collaboration with Global Climate Observing System
(GCOS), United Kingdom’s Department for International Development (DfID), and UN Economic Commission for Africa
(ECA).
Janicot, S., Moron, V. and Fontaine, B. 1996: Sahel droughts and ENSO dynamics. Geophys. Res. Lett., 23, 515–518.
Jenkins, G. S., Gaye, A. T. and Sylla, B. 2005: Late 20th century attribution of drying trends in the Sahel from the Regional
Climate Model (RegCM3). Geophys. Res. Lett., 32, L22705. doi:10.1029/2005GL024225.
Jenkins, G. S., Kamga, A., Garba, A., Diedhiou, A., Morris, V. and Joseph, E. 2002: Investigating the African climate system
using global/regional climate models. Bull. Amer. Meteor. Soc., 83, 583–595.
Kalnay, E. and Coauthors 1996: The NCEP-NCAR 40-year reanalysis project. Bull. Amer. Meteor. Soc., 77, 437–471.
rev-africa_Oct2007_final.tex; 31/10/2007; 11:57; p.24

A global perspective on African climate 25
Kamga, A. F., Fongang, S. and Viltard, A. 2000: Systematic errors of the ECMWF operational model over tropical Africa.
Mon. Wea. Rev., 128, 1949–1959.
Kaplan, A., Cane, M. A., Kushnir, Y., Clement, A. C., Blumenthal, M. B. and Rajagopalan, B. 1998: Analyses of global sea
surface temperature 1856-1991. J. Geophys. Res., 103, 18,567–18,589.
Katz, R. W. and Glantz, M. H. 1986: Anatomy of a rainfall index. Mon. Wea. Rev., 114, 764–771.
Kiladis, G. N. and Diaz, H. F. 1989: Global climatic anomalies associated with extremes in the Southern Oscillation. J.
Climate, 2, 1069–1090.
Klein, S. A., Soden, B. and Lau, N.-C. 1999: Remote sea surface temperature variations during ENSO: evidence for a tropical
atmospheric bridge. J. Climate, 12, 917–932.
Korecha, D. and Barston, A. G. 2007: Predictability of June-September rainfall in Ethiopia. Mon. Wea. Rev., 135, 628–650.
doi:10.1175/MWR3304.1.
Krishnamurti, T., Kishtawal, C., LaRow, T., Bachiochi, D., Zhang, Z., Williford, E., Gadgil, S. and Surendran, S.
1999: Improved weather and seasonal climate forecasts from multimodel superensemble. Science, 285, 1548–1550.
Lamb, P. J. 1978: Case studies of tropical Atlantic surface circulation patterns during recent sub-Saharan weather anomalies:
1967 and 1968. Mon. Wea. Rev., 106, 482–491.
Lamb, P. J. 1982: Persistence of Subsaharan drought. Nature, 299, 46–48.
Lamb, P. J. and Peppler, R. A. 1992: Further case studies of tropical Atlantic surface atmospheric and oceanic patterns
associated with sub-Saharan drought. J. Climate, 5, 476–488.
Lau, K. M., Kim, M. K. and Kim, K. M. 2006a: Asian summer monsoon anomalies induced by aerosol direct forcing: the role
of the Tibetan Plateau. Clim. Dyn., 26, 855–864. 10.1007/s00382-006-0114-z.
Lau, K. M., Shen, S. S. P., Kim, K.-M. and Wang, H. 2006b: A multimodel study of the twentieth-century simulations of
Sahel drought from the 1970s to 1990s. J. Geophys. Res. doi:10.1029/2005JD006281.
L’Hote, Y., Mahe, G., Some, B. and Triboulet, J. P. 2002: Analysis of a Sahelian annual rainfall index from 1896 to 2000; the
drought continues. Hydrol. Sci. J./J. Sci. Hydrol., 47, 563–572.
Lindzen, R. S. and Nigam, S. 1987: On the role of sea surface temperature gradients in forcing low-level winds and
convergence in the Tropics. J. Atmos. Sci., 44, 2418–2436.
Lohmann, U., Feichter, J., Penner, J. and Leaitch, R. 2000: Indirect effect of sulfate and carbonaceous aerosols: a mechanistic
treatment. J. Geophys. Res., 105, 12193–12206.
Lu, J. and Delworth, T. L. 2005: Oceanic forcing of late 20th century Sahel drought. Geophys. Res. Lett., 32, L22706.
doi:10.1029/2005GL023316.
Lyon, B. 2004: The strength of El Nino and the spatial extent of tropical drought. Geophys. Res. Lett., 31, L21204.
doi:10.1029/2004GL020901.
Mason, S. J. 2001: El Nino, climate change, and southern African climate. Environmetrics, 12, 327–345.
rev-africa_Oct2007_final.tex; 31/10/2007; 11:57; p.25
26 Giannini, Biasutti, Held and Sobel
Mason, S. J. and Tyson, P. D. 2000: The occurrence and predictability of droughts over southern Africa. pp. 113–134. in
”Drought - A global assessment”, edited by D. A. Wilhite.
Meehl, G. A., Stocker, T. F., Collins, W. D., Friedlingstein, P., Gaye, A. T., Gregory, J. M., Kitoh, A., Knutti, R., Murphy, J. M.,
Noda, A., Raper, S. C. B., Watterson, I. G., Weaver, A. J. and Zhao, Z.-C. 2007: Global Climate Projections. pp. 747–846.
In: Climate Change 2007: The Physical Science Basis. Contribution of Working Group I to the Fourth Assessment Report
of the Intergovernmental Panel on Climate Change [Solomon, S., D. Qin, M. Manning, Z. Chen, M. Marquis, K.B. Averyt,
M. Tignor and H.L. Miller (eds.)]. Cambridge University Press, Cambridge, United Kingdom and New York, NY, USA.
Menon, S., Hansen, J., Nazarenko, L. and Luo, Y. 2002: Climate effects of black carbon aerosols in China and India.
Science, 297, 2250–2253.
Mitchell, J. F. B., Karoly, D. J., Hegerl, G. C., Zwiers, F. W., Allen, M. R. and Marengo, J. (2001). Detection of climate change
and attribution of causes. pp. 525–582.
Mulenga, H. M., Rouault, M. and Reason, C. J. C. 2003: Dry summers over northeastern South Africa and associated
circulation anomalies. Clim. Res., 25, 29–41.
Neelin, J. D., Chou, C. and Su, H. 2003: Tropical drought regions in global warming and El Nino teleconnections. Geophys.
Res. Lett., 30(24), 2275. doi:10.1029/2003GL0018625.
Nicholson, S. E. 1981: Rainfall and atmospheric circulation during drought periods and wetter years in West Africa. Mon.
Wea. Rev., 109, 2191–2208.
Nicholson, S. E. 1986: The spatial coherence of African rainfall anomalies: interhemispheric teleconnections. J. Cli. and Appl.
Met., 25, 1365–1381.
Nicholson, S. E. 1993: An overview of African rainfall fluctuations of the last decade. J. Climate, 6, 1463–1466.
Nicholson, S. E. 2000: Land surface processes and Sahel climate. Rev. Geophys., 38, 117–139.
Nicholson, S. E. 2005: On the question of the ”recovery” of the rains in the West African Sahel. J. Arid Environ., 63, 615–641.
Nicholson, S. E. and Kim, J. 1997: The relationship of the El Nino-Southern Oscillation to African rainfall. Int. J.
Climatology, 17, 117–135.
Nicholson, S. E., Some, B. and Kone, B. 2000: An analysis of recent rainfall conditions in West Africa, including the rainy
seasons of the 1997 El Nino and the 1998 La Nina years. J. Climate, 13, 2628–2640.
Nicholson, S. E., Tucker, C. J. and Ba, M. B. 1998: Desertification, drought, and surface vegetation: an example from the
West African Sahel. Bull. Amer. Meteor. Soc., 79, 815–829.
Ogallo, L. J. 1989: The spatial and temporal patterns of the East African seasonal rainfall derived from principal component
analysis. Int. J. Climatology, 9, 145–167.
Pal, J. S., Giorgi, F., Bi, X., Elguindi, N., Solmon, F., Gao, X., Rauscher, S. A., Francisco, R., Zakey, A., Winter, J., Ashfaq,
M., Syed, F. S., Bell, J. L., Diffenbaugh, N. S., Karmacharya, J., Konar, A., Martinez, D., da Rocha, R. P., Sloan, L. C. and
Steiner, A. L. 2007: Regional climate modeling for the developing world. The ICTP RegCM3 and RegCNET. Bull. Amer.
Meteor. Soc., 88, 1395–1409.
rev-africa_Oct2007_final.tex; 31/10/2007; 11:57; p.26

A global perspective on African climate 27
Palmer, T. N. 1986: Influence of the Atlantic, Pacific and Indian Oceans on Sahel rainfall. Nature, 322, 251–253.
Patt, A. G., Ogallo, L. and Hellmuth, M. 2007: Learning from 10 years of Climate Outlook Forums in Africa. Science, 318, 49–
50. doi:10.1126/science.1147909.
Petit-Maire, N. 2002: Sous le sable ... des lacs. Un voyage dans le temps. CNRS Editions, Paris.
Polgreen, L. 2007: In Niger, trees and crops turn back the desert. New York Times. 11 February 2007.
Prince, S. D., Brown De Coulston, E. and Kravitz, L. L. 1998: Evidence from rain-use efficiencies does not indicate extensive
Sahelian desertification. Global Change Biology, 4, 359–374.
Rasmusson, E. M. and Carpenter, T. H. 1982: Variations in tropical sea surface temperature and surface wind fields associated
with the Southern Oscillation/El Nino. Mon. Wea. Rev., 110, 354–384.
Reason, C. J. C. and Jagadheesha, D. 2005: A model investigation of recent ENSO impacts over southern Africa. Meteorol.
Atmos. Phys., 89, 181–205.
Reason, C. J. C. and Rouault, M. 2006: Sea surface temperature variability in the tropical southeast Atlantic Ocean and West
African rainfall. Geophys. Res. Lett., 33, L21705. doi:10.1029/2006GL027145.
Reij, C., Tappan, G. and Belemvire, A. 2005: Changing land management practices and vegetation on the Central Plateau of
Burkina Faso (1968-2002). J. Arid Environ., 63, 642–659.
Reynolds, J. F., Stafford Smith, D. M., Lambin, E. F., Turner II, B. L., Mortimore, M., Batterbury, S. P., Downing, T. E.,
Dowlatabadi, H., Fernandez, R. J., Herrick, J. E., Huber-Sannwald, E., Jiang, H., Leemans, R., Lynam, T., Maestre, F. T.,
Ayarza, M. and Walker, B. 2007: Global desertification: building a science for dryland development. Science, 316, 847–
851.
Richard, Y., Trzaska, S., Roucou, P. and Rouault, M. 2000: Modification of the southern African rainfall variability/ENSO
relationship since the late 1960s. Clim. Dyn., 16, 883–895.
Ropelewski, C. F. and Halpert, M. S. 1987: Global and regional precipitation patterns associated with the El Nino/Southern
Oscillation. Mon. Wea. Rev., 115, 1606–1626.
Rotstayn, L. and Lohmann, U. 2002: Tropical rainfall trends and the indirect aerosol effect. J. Climate, 15, 2103–2116.
Rowell, D. P. 2001: Teleconnections between the tropical Pacific and the Sahel. Q. J. R. Meteorol. Soc., 127, 1683–1706.
Rowell, D. P., Folland, C. K., Maskell, K. and Ward, M. N. 1995: Variability of summer rainfall over tropical North Africa
(1906-92): observations and modeling. Q. J. R. Meteorol. Soc., 121, 669–704.
Saji, N. H., Goswami, B. N., Vinayachandran, P. N. and Yamagata, T. 1999: A dipole mode in the tropical Indian Ocean..
Nature, 401, 360–363.
Santer, B. D., Wigley, T. M. L., Barnett, T. and Anyamba, E. (1996). Detection of Climate Change and Attribution of Causes.
Cambridge University Press, Cambridge. pp. 407–444.
Schreck, C. J. and Semazzi, F. H. M. 2004: Variability of the recent climate of eastern Africa. Int. J. Climatol., 24, 681–701.
Seleshi, Y. and Demaree, G. 1995: Rainfall variability in the Ethiopian and Eritrean highlands and its links with the Southern
Oscillation Index. J. Biogeogr., 22, 945–952.
rev-africa_Oct2007_final.tex; 31/10/2007; 11:57; p.27

28 Giannini, Biasutti, Held and Sobel
Sobel, A. H., Held, I. M. and Bretherton, C. S. 2002: The ENSO signal in tropical tropospheric temperature. J.
Climate, 15, 2702–2706.
Soden, B. J. 2000: The sensitivity of the tropical hydrological cycle to ENSO. J. Climate, 13, 538–549.
Song, Q., Vecchi, G. A. and Rosati, A. J. 2006: Indian Ocean variability in the GFDL coupled climate model. J. Climate. in
press.
Stott, P. A., Mitchell, J. F. B., Allen, M. R., Delworth, T. L., Gregory, J. M., Meehl, G. A. and Santer, B. D. 2006: Observational
Constraints on Past Attributable Warming and Predictions of Future Global Warming. Journal of Climate, 19, 3055–3069.
Su, H., Neelin, J. D. and Meyerson, J. E. 2005: Mechanisms for lagged atmospheric response to ENSO SST forcing. J.
Climate, 18, 4195–4215.
Tadross, M., Jack, C. and Hewitson, B. 2005: On RCM-based projections of change in Southern African summer climate.
Geophys. Res. Lett., 32, L23713. doi:10.1029/2005GL024460.
Tarhule, A. and Lamb, P. J. 2003: Climate research and seasonal forecasting for West Africans: perceptions, dissemination,
and use?. Bull. Amer. Meteor. Soc., 84, 1741–1759.
Taylor, C. M., Lambin, E. F., Stephenne, N., Harding, R. J. and Essery, R. L. H. 2002: The influence of land use change on
climate in the Sahel. J. Climate, 15, 3615–3629.
Timmermann, A., Oberhuber, J., Bacher, A., Esch, M., Latif, M. and Roeckner, E. 1999: Increased El Nino frequency in a
climate model forced by future greenhouse warming. Nature, 398, 694–697.
Trenberth, K. E. and Hoar, T. J. 1997: El Nino and climate change. Geophysical Research Letters, 23, 3057–3060.
Trenberth, K. E., Dai, A., Rasmussen, R. M. and Parsons, D. B. 2003: The changing character of precipitation. Bull. Amer.
Meteor. Soc., 84, 1205–1217.
Trenberth, K., Jones, P. D., Ambenje, P., Bojariu, R., Easterling, D., Klein Tank, A., Parker, D., Rahimzadeh, F., Renwick, J. A.,
Rusticucci, M., B., S. and Zhai, P. 2007: Observations: Surface and Atmospheric Climate Change. Climate Change 2007:
The Physical Science Basis. Contribution of Working Group I to the Fourth Assessment Report of the Intergovernmental
Panel on Climate Changepp. 235–336. Solomon, S., D. Qin, M. Manning, Z. Chen, M. Marquis, K.B. Averyt, M. Tignor
and H.L. Miller (eds.). Cambridge University Press, Cambridge, United Kingdom and New York, NY, USA.
Tucker, C. J., Dregne, H. E. and Newcomb, W. W. 1991: Expansion and contraction of the Sahara desert from 1980 to 1990.
Science, 253, 299–301.
Unganai, L. 1996: Historic and future climatic change in Zimbabwe. Clim. Res., 6, 137–145.
Usman, M. T. and Reason, C. J. C. 2004: Dry spell frequencies and their variability over southern Africa. Clim. Res., 26, 199–
211. doi:10.3354/cr026199.
Vizy, E. K. and Cook, K. H. 2001: Mechanisms by which Gulf of Guinea and eastern North Atlantic sea surface temperature
anomalies can influence African rainfall. J. Climate, 14, 795–821.
rev-africa_Oct2007_final.tex; 31/10/2007; 11:57; p.28

A global perspective on African climate 29
Vizy, E. K. and Cook, K. H. 2002: Development and application of a mesoscale climate model for the
tropics: Influence of sea surface temperature anomalies on the West African monsoon. J. Geophys. Res.-
Atmospheres, 107(D3), 10.1029/2001JD000686.
von Storch, H. and Zwiers, F. W. 1999: Statistical analysis in climate research. 484 pp. Cambridge University Press.
Vose, R. S., Schmoyer, R. L., Steurer, P. M., Peterson, T. C., Heim, R., Karl, T. R. and Eischeid, J. 1992: The Global
Historical Climatology Network: long-term monthly temperature, precipitation, sea level pressure, and station pressure
data. ORNL/CDIAC-53, NDP-041. Carbon Dioxide Information Analysis Center, Oak Ridge National Laboratory, Oak
Ridge, Tennessee. 300 pp.
Wagner, R. and DaSilva, A. 1994: Surface conditions associated with anomalous rainfall in the Guinea coastal region. Int. J.
Climatology, 14, 179–199.
Wallace, J. M., Rasmusson, E. M., Mitchell, T. P., Kousky, V. E., Sarachik, E. S. and von Storch, H. 1998: On the
structure and evolution of ENSO-related climate variability in the tropical Pacific: lessons from TOGA. J. Geophys.
Res., 103(C7), 14241–14259.
Ward, M. N. 1998: Diagnosis and short-lead time prediction of summer rainfall in tropical North Africa at interannual and
multidecadal timescales. J. Climate, 11, 3167–3191.
Washington, R., Harrison, M. and Conway, D. 2004: African climate report. UK Department
of Environment Food and Rural Affairs, and UK Department for International Development.
http://www.defra.gov.uk/environment/climatechange/ccafrica-study/.
Washington, R., Harrison, M., Conway, D., Black, E., Challinor, A., Grimes, D., Jones, R., Morse, A., Kay, G. and Todd, M.
2006: African climate change: taking the shorter route. Bull. Amer. Meteor. Soc., 87, 1355–1366. doi:10.1175/BAMS-87-
10-1355.
Webster, P. J. 1994: The role of hydrological processes in ocean-atmosphere interaction. Rev. Geophys., 32, 427–476.
Webster, P. J., Moore, A. M., Loschnigg, J. P. and Leben, R. R. 1999: Coupled ocean-atmosphere dynamics in the Indian
Ocean during 1997-98. Nature, 401, 356–360.
West, C. T., Roncoli, C. and Ouattara, F. 2007: Local perceptions and regional climate trends of the Central Plateau of Burkina
Faso. Land Degradation and Development. in press.
Yulaeva, E. and Wallace, J. M. 1994: The signature of ENSO in global temperature and precipitation fields derived from the
microwave sounding unit. J. Climate, 7, 1719–1736.
rev-africa_Oct2007_final.tex; 31/10/2007; 11:57; p.29

30 Giannini, Biasutti, Held and Sobel
Figure captions
1. Climatologies of precipitation and near-surface winds for a domain centered on tropical Africa.
Precipitation was produced by the Global Precipitation Climatology Project (Huffman et al. 1997)
combining satellite estimates and rain-gauge measurements (contours are drawn every 4 mm/day).
Winds at the 850hPa pressure level - approximately 3000m above sea level - are from the NCEP-
NCAR Reanalysis Project (Kalnay et al. 1996). Panels are for April, July, October and January
averages over 1979-2004.
2. Regional averages of annual mean (July-June) precipitation over 1930-2005; the three regions are
western (0◦N to 20◦N, 20◦W to 20◦E), eastern equatorial (10◦S to 10◦N, 20◦E to 50◦E), and
southern Africa (25◦S to 10◦S, 20◦E to 40◦E). CRU data is depicted in black bars, GPCP in the
solid red line. The CRU climatology over 1930-1995 is depicted in the green horizontal line, that of
GPCP, over 1979-2005, is depicted in the brown horizontal line.
3. The three leading patterns of a Principal Component Analysis performed on annual mean (July-
June) precipitation over Africa during 1930-1995. a, b, c: The spatial patterns, obtained by linear
regression of the time series in d,e,f onto precipitation - anomalies are in color, in mm/month, while
the contours delimit regions where regression is statistically significant at the 5% level. d, e, f: The
associated time series (in units of standard deviation). Note that the upward trend in (d) indicates
increasingly stronger values of the negative anomalies in the pattern in (a), i.e. a drying trend. g, h,
i: Regression patterns of the time series in d,e,f with sea surface temperature (Kaplan et al. 1998).
Anomalies are in contour, spaced every 0.05◦C, and dashed in the case of negative values; the
presence of color represents their statistical significance at a level of 5% or higher.
4. The difference (XX-PI) between late 20th century (1975-1999) climate in the XX simulations and
pre-industrial climate, as estimated from a 25-year mean from the PI simulations. The left panels
refer to annual mean surface temperature, the right panels to annual mean precipitation. Warm colors
indicate positive and cool colors negative anomalies. The top panels are the mean across all 19
models (the shading interval is 0.1◦C for temperature and 0.03mm day−1 for precipitation), the
solid black line in the right panel is the 4mm day−1 contour in the XX simulations and indicates the
rev-africa_Oct2007_final.tex; 31/10/2007; 11:57; p.30

A global perspective on African climate 31
location of mean maximum rainfall . The bottom panels are a measure of inter-model agreement:
a value of 1 (-1) was assigned at every gridpoint and for every model if the XX-PI difference was
positive (negative) and larger than a threshold (0.4◦ C or 0.05 mm day−1) value; the panels show the
sum over all models as percentages (shading interval is every 10%, contour interval is every 20%).
5. As for figure 4, but for the A1B-XX difference. In the top panels, the shading (contour) interval is
0.6◦C (0.3◦C) for temperature and 0.15 mm day−1 (0.2 mm day−1) for rainfall. In the bottom left
panel the threshold is 2◦C, while in the bottom right panel it is 0.1 mm day−1.
6. Regional averages of precipitation in the IPCC 4AR model simulations; 20th century simulations
from 1950 to 2000, and A1B scenario simulations from 2000 to 2100. Regions are defined as in
figure 2. Each grey line represents one model, and the thicker black line is the multi-model mean.
rev-africa_Oct2007_final.tex; 31/10/2007; 11:57; p.31
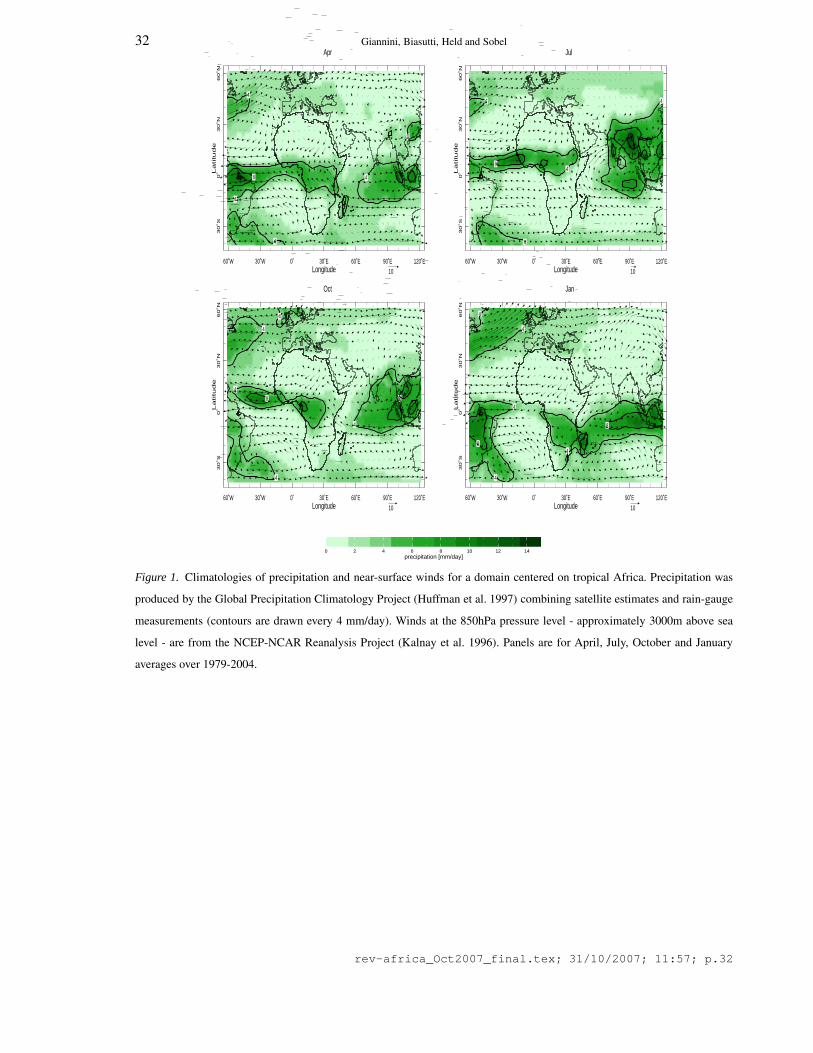
32 Giannini, Biasutti, Held and SobelApr
60˚W 30˚W 0˚ 30˚E 60˚E 90˚E 120˚ELongitude
30˚S
0˚
30˚N
60˚N
Latitu
de
4
4
4
4
4
8
10
Jul
60˚W 30˚W 0˚ 30˚E 60˚E 90˚E 120˚ELongitude
30˚S
0˚
30˚N
60˚N
Latitu
de
4
4
4
4
8
10
Oct
60˚W 30˚W 0˚ 30˚E 60˚E 90˚E 120˚ELongitude
30˚S
0˚
30˚N
60˚N
Latitu
de
4
4
4
4
4
8 8
10
Jan
60˚W 30˚W 0˚ 30˚E 60˚E 90˚E 120˚ELongitude
30˚S
0˚
30˚N
60˚N
Latitu
de
4
4
4
4
48
8
10
0 2 4 6 8 10 12 14precipitation [mm/day]
Figure 1. Climatologies of precipitation and near-surface winds for a domain centered on tropical Africa. Precipitation was
produced by the Global Precipitation Climatology Project (Huffman et al. 1997) combining satellite estimates and rain-gauge
measurements (contours are drawn every 4 mm/day). Winds at the 850hPa pressure level - approximately 3000m above sea
level - are from the NCEP-NCAR Reanalysis Project (Kalnay et al. 1996). Panels are for April, July, October and January
averages over 1979-2004.
rev-africa_Oct2007_final.tex; 31/10/2007; 11:57; p.32

A global perspective on African climate 33
Figure 2. Regional averages of annual mean (July-June) precipitation over 1930-2005; the three regions are western (0◦N to
20◦N, 20◦W to 20◦E), eastern equatorial (10◦S to 10◦N, 20◦E to 50◦E), and southern Africa (25◦S to 10◦S, 20◦E to 40◦E).
CRU data is depicted in black bars, GPCP in the solid red line. The CRU climatology over 1930-1995 is depicted in the green
horizontal line, that of GPCP, over 1979-2005, is depicted in the brown horizontal line.
rev-africa_Oct2007_final.tex; 31/10/2007; 11:57; p.33

34 Giannini, Biasutti, Held and Sobel
a.
30˚W 20˚W 10˚W 0˚ 10˚E 20˚E 30˚E 40˚E 50˚E 60˚Elongitude
40˚S
30˚S
20˚S
10˚S
0˚
10˚N
20˚N
30˚N
40˚N
latit
ud
e
-2.02
-2.02
-2.02
-2.02
b.
30˚W 20˚W 10˚W 0˚ 10˚E 20˚E 30˚E 40˚E 50˚E 60˚Elongitude
40˚S
30˚S
20˚S
10˚S
0˚
10˚N
20˚N
30˚N
40˚N
latit
ud
e
-2.02
-2.02
c.
30˚W 20˚W 10˚W 0˚ 10˚E 20˚E 30˚E 40˚E 50˚E 60˚Elongitude
40˚S
30˚S
20˚S
10˚S
0˚
10˚N
20˚N
30˚N
40˚N
latit
ud
e
-2.02
-2.02
-15 -10 -5 0 5 10 15precipitation anomaly [mm/month]
d.
Jan Jan Jan Jan Jan Jan1940 1950 1960 1970 1980 1990
Time
-2-1
01
2tim
e s
erie
s
e.
Jan Jan Jan Jan Jan Jan1940 1950 1960 1970 1980 1990
Time
-2-1
01
2tim
e s
erie
s
f.
Jan Jan Jan Jan Jan Jan1940 1950 1960 1970 1980 1990
Time
-2-1
01
2tim
e s
erie
s
g.
180˚W 150˚W 120˚W 90˚W 60˚W 30˚W 0˚ 30˚E 60˚E 90˚E 120˚E 150˚E 180˚lon
30
˚S0
˚3
0˚N
60
˚Nla
t
-0.2-0.15
-0.1
-0.1 -0.1
-0.05
-0.05
-0.05
-0.05
-0.05
0.05
0.05
0.05
0.05
0.05
0.05
0.1
0.1
0.1
0.1
0.1
0.1
0.15
0.15
0.15
0.150.150.2
0.2
h.
180˚W 150˚W 120˚W 90˚W 60˚W 30˚W 0˚ 30˚E 60˚E 90˚E 120˚E 150˚E 180˚lon
30
˚S0
˚3
0˚N
60
˚Nla
t
-0.05
-0.05
-0.05
-0.05
-0.05
0.05
0.05
0.050.05
0.05
0.05
0.1
0.1
i.
180˚W 150˚W 120˚W 90˚W 60˚W 30˚W 0˚ 30˚E 60˚E 90˚E 120˚E 150˚E 180˚lon
30
˚S0
˚3
0˚N
60
˚Nla
t
-0.1
-0.1
-0.1
-0.1-0.05
-0.05
-0.05
-0.05
-0.05
0.05
0.05
0.05
0.05
0.1
0.1
0.1
0.1
0.15
0.15
0.15
0.2
Figure 3. The three leading patterns of a Principal Component Analysis performed on annual mean (July-June) precipitation
over Africa during 1930-1995. a, b, c: The spatial patterns, obtained by linear regression of the time series in d,e,f onto
precipitation - anomalies are in color, in mm/month, while the contours delimit regions where regression is statistically
significant at the 5% level. d, e, f: The associated time series (in units of standard deviation). Note that the upward trend in
(d) indicates increasingly stronger values of the negative anomalies in the pattern in (a), i.e. a drying trend. g, h, i: Regression
patterns of the time series in d,e,f with sea surface temperature (Kaplan et al. 1998). Anomalies are in contour, spaced every
0.05◦C, and dashed in the case of negative values; the presence of color represents their statistical significance at a level of 5%
or higher.
rev-africa_Oct2007_final.tex; 31/10/2007; 11:57; p.34

A global perspective on African climate 35
180 120W 60W −0 60E 120E 180
30S
EQ.
30N
60N
0.3
0
−0.3
0.3
0.6
0.6
00.3
Across−Model Mean of XX−PI Surface Temperaturea.
180 120W 60W −0 60E 120E 180
30S
EQ.
30N
60N
−0.2
0.4 0.2
−0.2 0.2
Across−Model Mean of XX−PI Precipitationb.
180 120W 60W −0 60E 120E 180
30S
EQ.
30N
60N
% of Models with XX−PI Mean Surface Temperature >.4 (<−.4)c.
60
20
80
60
60
c.
180 120W 60W −0 60E 120E 180
30S
EQ.
30N
60N
−40−60
6020
% of Models with XX−PI Precipitation >0.05 (<−0.05)d.
Figure 4. difference (XX-PI) between late 20th century (1975-1999) climate in the XX simulations and pre-industrial climate,
as estimated from a 25-year mean from the PI simulations. The left panels refer to annual mean surface temperature, the right
panels to annual mean precipitation. Warm colors indicate positive and cool colors negative anomalies. The top panels are the
mean across all 19 models (the shading interval is 0.1◦C for temperature and 0.03mm day−1 for precipitation), the solid black
line in the right panel is the 4mm day−1 contour in the XX simulations and indicates the location of mean maximum rainfall
. The bottom panels are a measure of inter-model agreement: a value of 1 (-1) was assigned at every gridpoint and for every
model if the XX-PI difference was positive (negative) and larger than a threshold (0.4◦ C or 0.05 mm day−1) value; the panels
show the sum over all models as percentages (shading interval is every 10%, contour interval is every 20%).
rev-africa_Oct2007_final.tex; 31/10/2007; 11:57; p.35

36 Giannini, Biasutti, Held and Sobel
180 120W 60W −0 60E 120E 180
30S
EQ.
30N
60N
2.1
2.43.3
2.11.8
1.8
2.1
3.92.1
2.74.2
3.9
3.33.3
Across−Model Mean of A1B−XX Surface Temperaturea.
180 120W 60W −0 60E 120E 180
30S
EQ.
30N
60N
0.4
−0.20.6
1.40.4
−0.2
0−0.4
Across−Model Mean of A1B−XX Precipitationb.
180 120W 60W −0 60E 120E 180
30S
EQ.
30N
60N
8010040
40
80
4020
100
80
60
60
80
% of Models with A1B−XX Mean Surface Temperature >2 (<−2)c.
180 120W 60W −0 60E 120E 180
30S
EQ.
30N
60N
20
40
−4020
40
−40
8080
−80
80
−60
80
% of Models with A1B−XX Precipitation >0.1 (<−0.1)d.
Figure 5. As for figure 4, but for the A1B-XX difference. In the top panels, the shading (contour) interval is 0.6◦C (0.3◦C)
for temperature and 0.15 mm day−1 (0.2 mm day−1) for rainfall. In the bottom left panel the threshold is 2◦C, while in the
bottom right panel it is 0.1 mm day−1 .
rev-africa_Oct2007_final.tex; 31/10/2007; 11:57; p.36

A global perspective on African climate 37
1950 1975 2000 2025 2050 2075−30
−20
−10
0
10
20
30West Africa
Year
Rai
nfal
l Cha
nge
(%)
1950 1975 2000 2025 2050 2075−30
−20
−10
0
10
20
30East Africa
Year
Rai
nfal
l Cha
nge
(%)
1950 1975 2000 2025 2050 2075−30
−20
−10
0
10
20
30South Africa
Year
Rai
nfal
l Cha
nge
(%)
Figure 6. Regional averages of precipitation in the IPCC 4AR model simulations; 20th century simulations from 1950 to 2000,
and A1B scenario simulations from 2000 to 2100. Regions are defined as in figure 2. Each grey line represents one model, and
the thicker black line is the multi-model mean.
rev-africa_Oct2007_final.tex; 31/10/2007; 11:57; p.37

rev-africa_Oct2007_final.tex; 31/10/2007; 11:57; p.38