a gis view of hydrology - brown€¦ · a gis view of hydrologya gis view of hydrology contact...
TRANSCRIPT

1
Quantitative Elements of Hydrology
© John F. HermanceJanuary 24, 2007
A GIS View of HydrologyA GIS View of Hydrology
Contact information:Jack HermanceEnvironmental Geophysics/HydrologyDepartment of Geological SciencesBrown University, Providence, RI 02912-1846Tel: 401-863-3830e-mail: [email protected]
(Information for the Presenter)
This is the “toggle” symbol to prompt presenter to return to previous slide for quick comparisons with the current slide.
The following “traffic light” signals appear in lower right corner of the slide to prompt presenter accordingly.
Move forward quickly, probably the next slide has the essential information (e.g. labels).
Move forward after a slight pause to assess whether content deserves brief comment.
Move forward after a longer pause, perhaps a few brief comments are required.
Conventions for Prompting Slide Changes.
This is a pausing point at which motivating comments can be made, or the contents thoroughly discussed.
2
Quantitative Elements of Hydrology
© John F. HermanceJanuary 24, 2007
Some examples of GIS imagesrelated to hydrology.
Some examples of GIS imagesrelated to hydrology.
© John F. HermanceJanuary 24, 2007
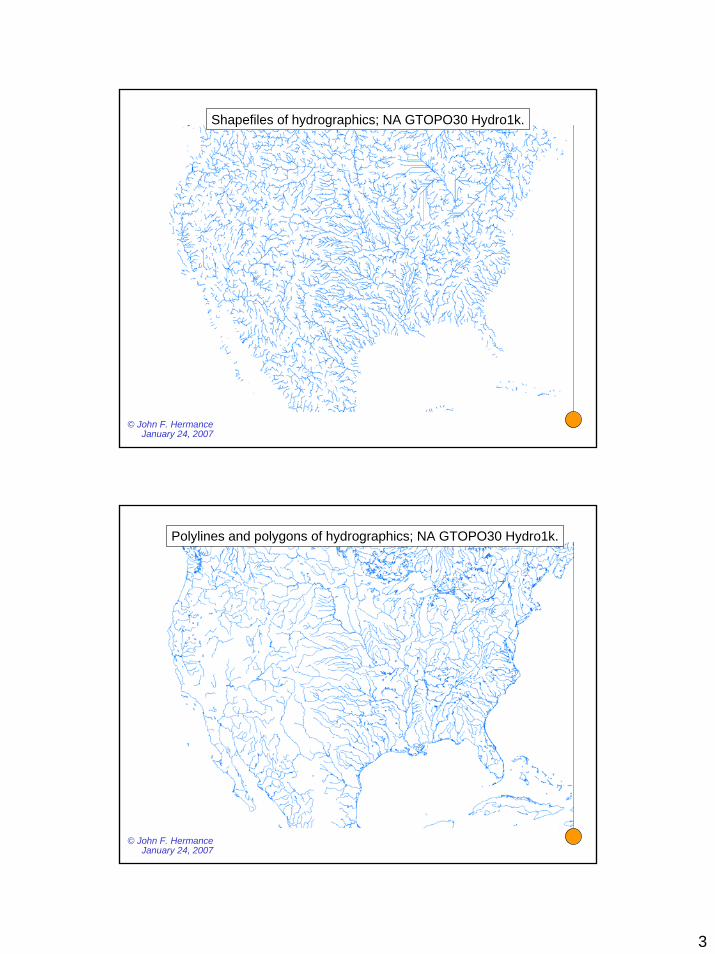
Shapefiles of provinces and states; North American Atlas.
3
© John F. HermanceJanuary 24, 2007
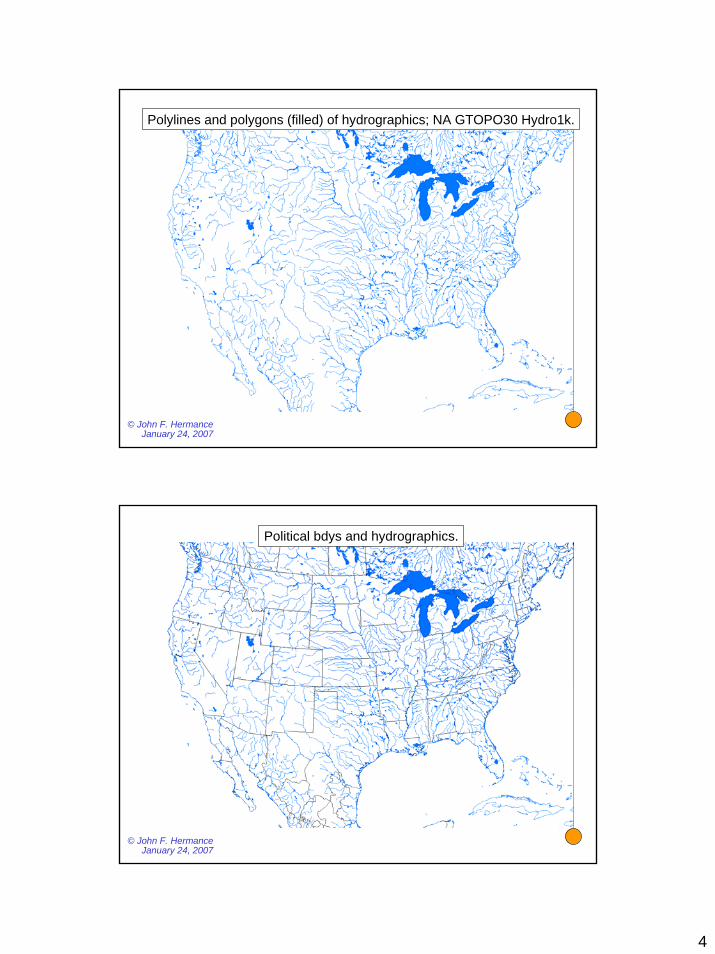
Shapefiles of hydrographics; NA GTOPO30 Hydro1k.
Polylines and polygons of hydrographics; NA GTOPO30 Hydro1k.
© John F. HermanceJanuary 24, 2007
4
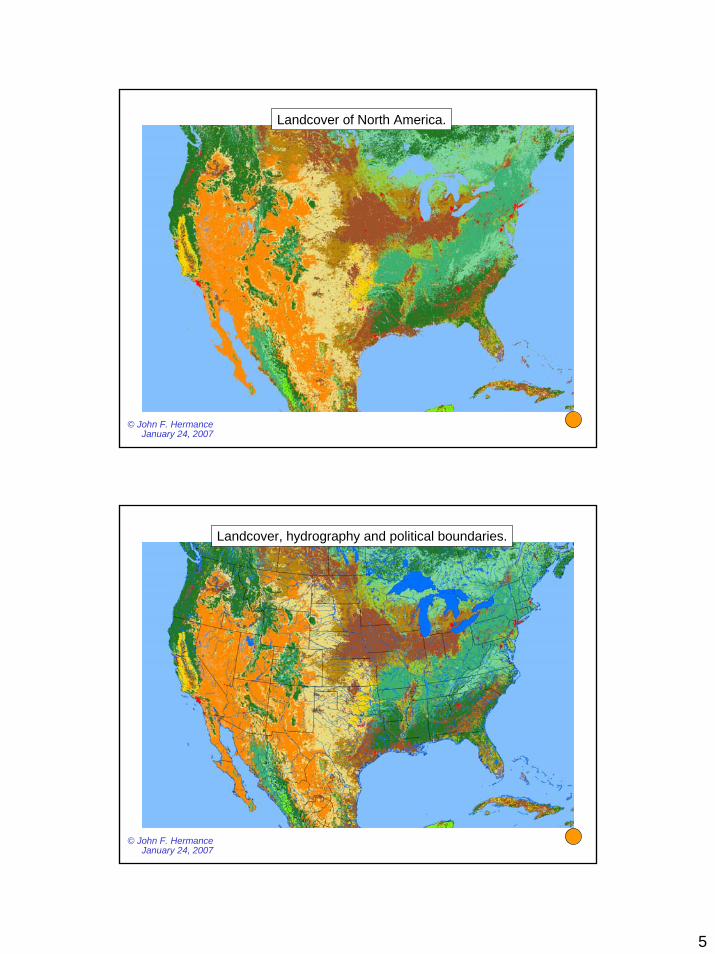
Polylines and polygons (filled) of hydrographics; NA GTOPO30 Hydro1k.
© John F. HermanceJanuary 24, 2007
Political bdys and hydrographics.
© John F. HermanceJanuary 24, 2007
5
Landcover of North America.
© John F. HermanceJanuary 24, 2007
Landcover, hydrography and political boundaries.
© John F. HermanceJanuary 24, 2007
6
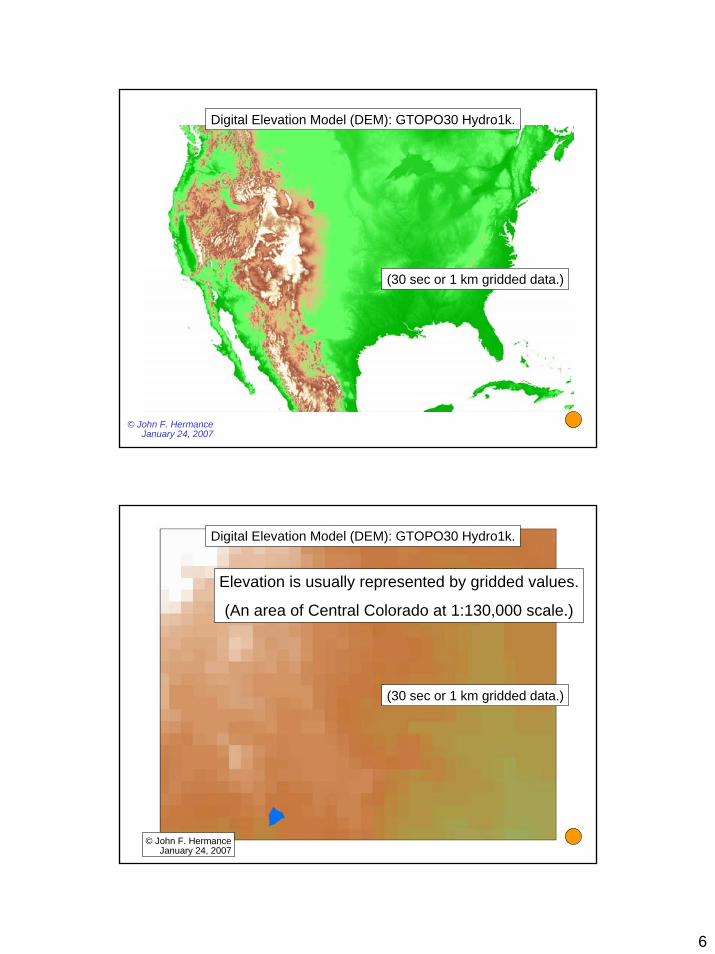
Digital Elevation Model (DEM): GTOPO30 Hydro1k.
© John F. HermanceJanuary 24, 2007
(30 sec or 1 km gridded data.)
Digital Elevation Model (DEM): GTOPO30 Hydro1k.
© John F. HermanceJanuary 24, 2007
(30 sec or 1 km gridded data.)
Elevation is usually represented by gridded values.
(An area of Central Colorado at 1:130,000 scale.)
7
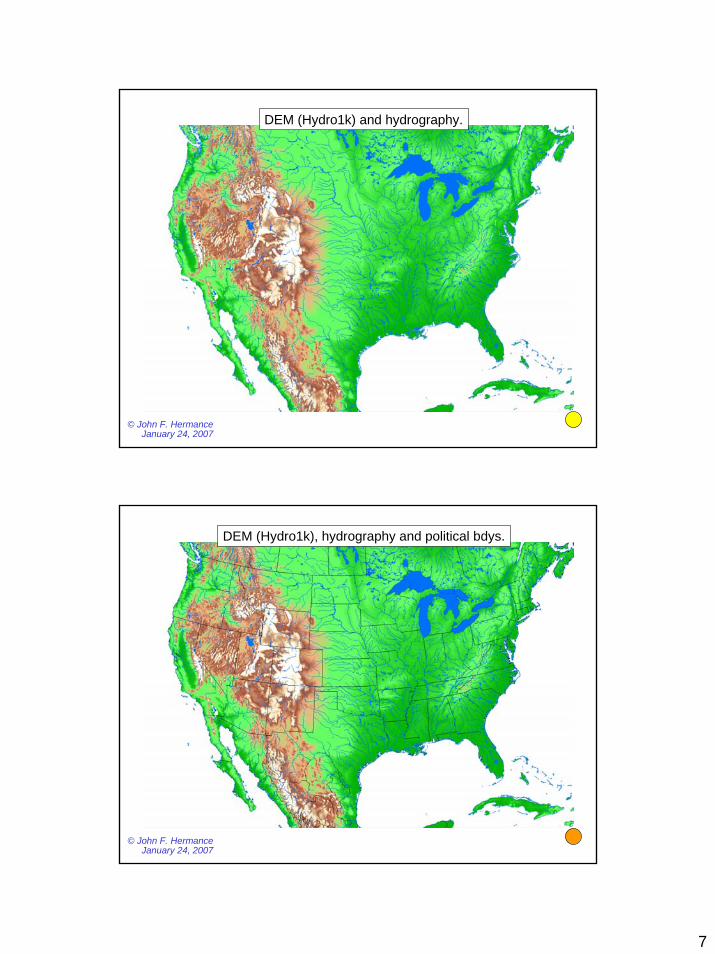
DEM (Hydro1k) and hydrography.
© John F. HermanceJanuary 24, 2007
DEM (Hydro1k), hydrography and political bdys.
© John F. HermanceJanuary 24, 2007
8
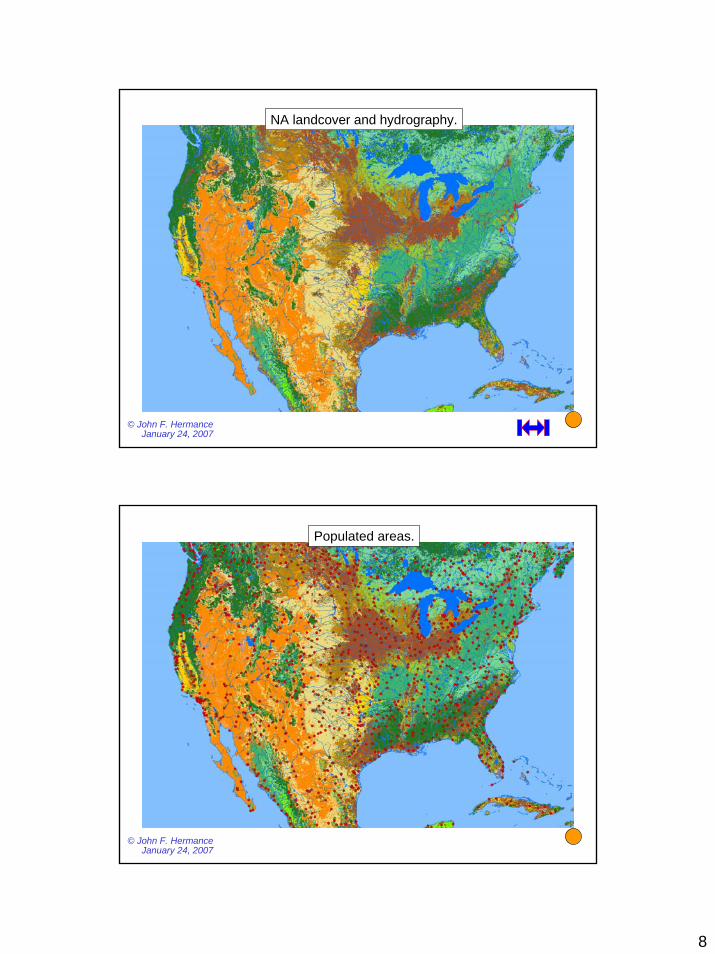
NA landcover and hydrography.
© John F. HermanceJanuary 24, 2007
Populated areas.
© John F. HermanceJanuary 24, 2007
9
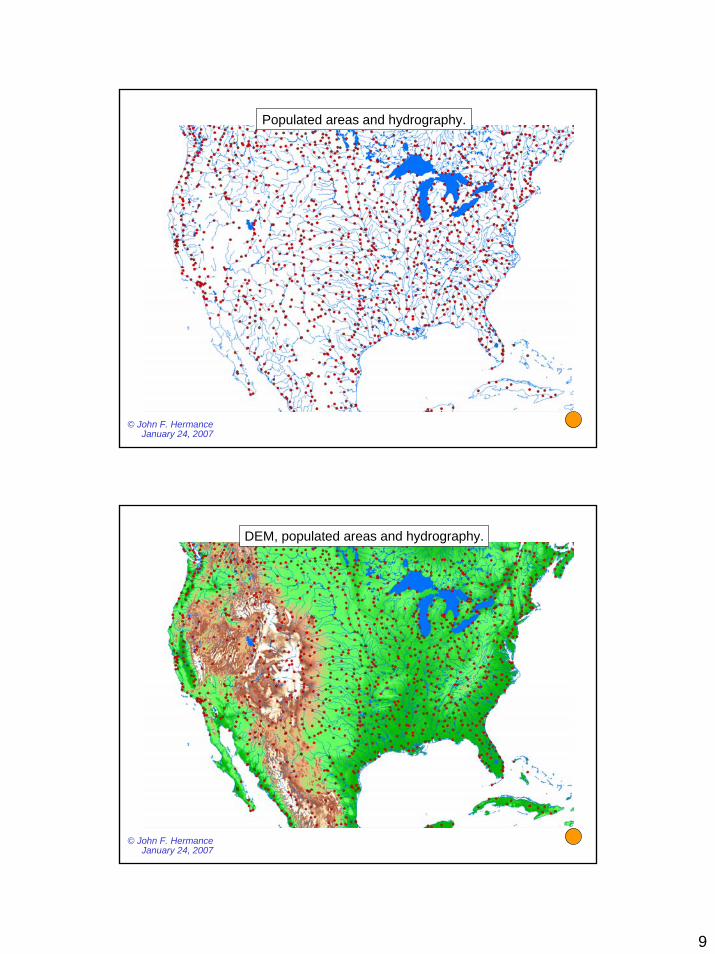
Populated areas and hydrography.
© John F. HermanceJanuary 24, 2007
DEM, populated areas and hydrography.
© John F. HermanceJanuary 24, 2007
10
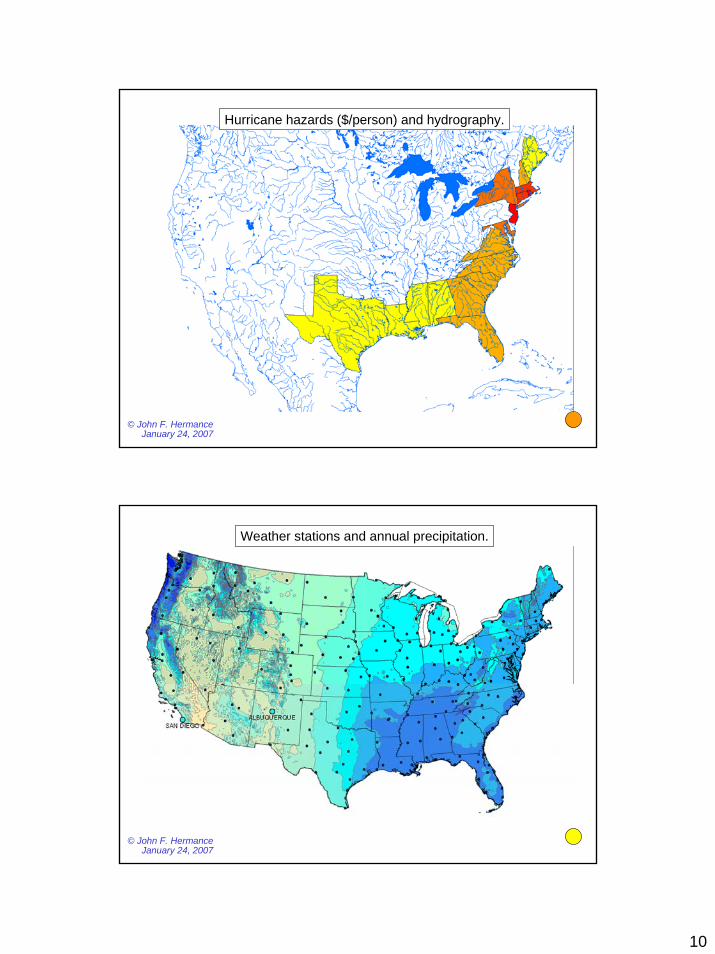
Hurricane hazards ($/person) and hydrography.
© John F. HermanceJanuary 24, 2007
Weather stations and annual precipitation.
© John F. HermanceJanuary 24, 2007
11
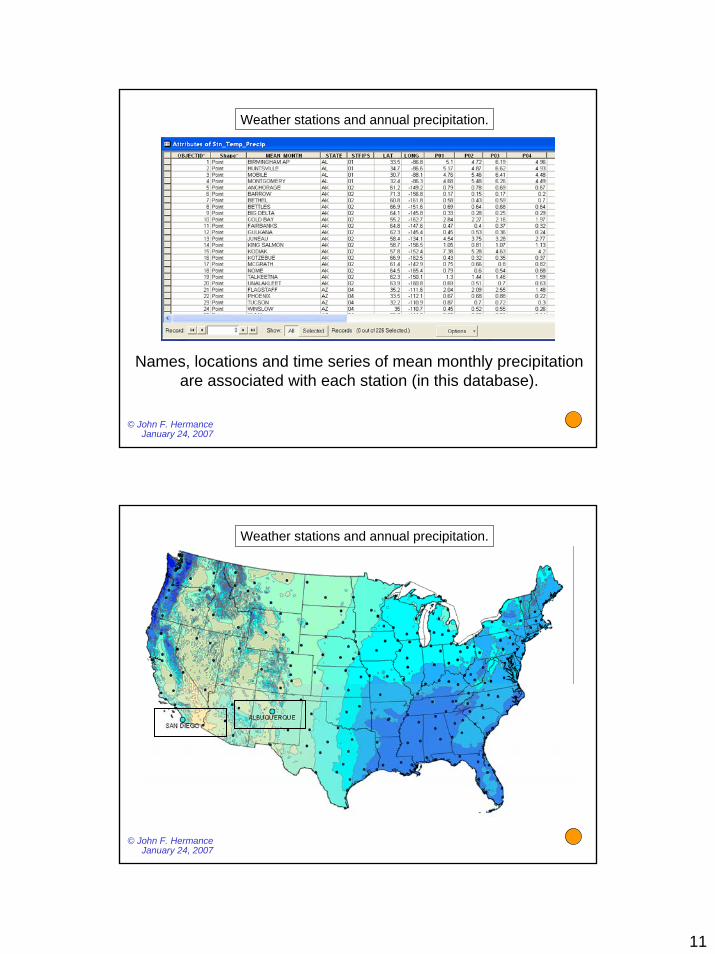
Weather stations and annual precipitation.
© John F. HermanceJanuary 24, 2007
Names, locations and time series of mean monthly precipitationare associated with each station (in this database).
Weather stations and annual precipitation.
© John F. HermanceJanuary 24, 2007
12
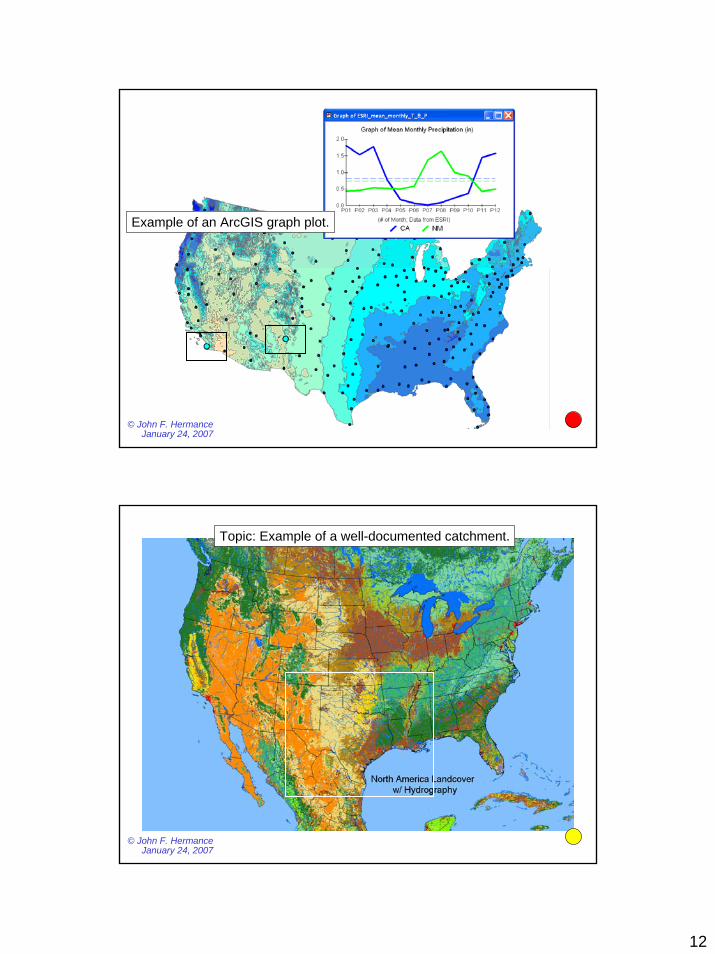
Example of an ArcGIS graph plot.
© John F. HermanceJanuary 24, 2007
Topic: Example of a well-documented catchment.
© John F. HermanceJanuary 24, 2007
13
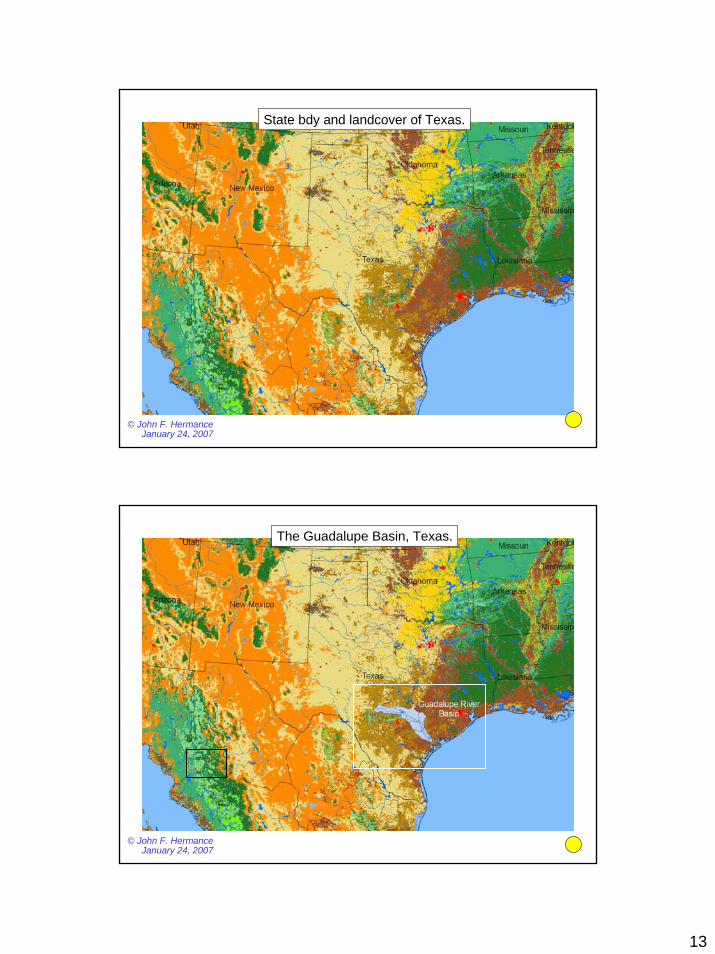
State bdy and landcover of Texas.
© John F. HermanceJanuary 24, 2007
The Guadalupe Basin, Texas.
© John F. HermanceJanuary 24, 2007
14
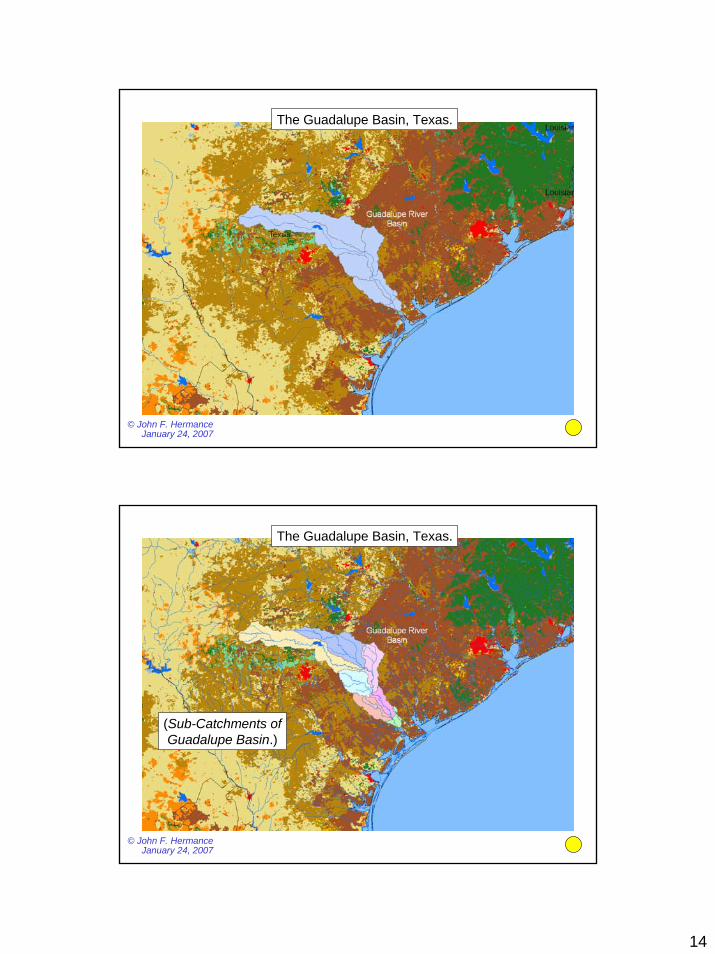
The Guadalupe Basin, Texas.
© John F. HermanceJanuary 24, 2007
The Guadalupe Basin, Texas.
© John F. HermanceJanuary 24, 2007
(Sub-Catchments ofGuadalupe Basin.)
15
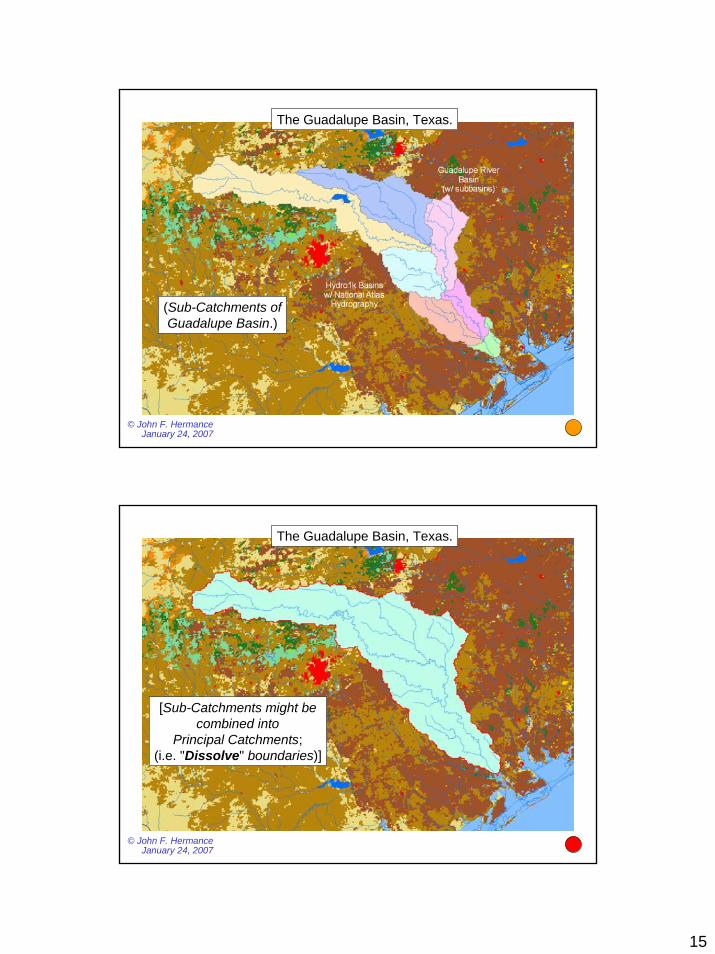
The Guadalupe Basin, Texas.
© John F. HermanceJanuary 24, 2007
(Sub-Catchments ofGuadalupe Basin.)
The Guadalupe Basin, Texas.
© John F. HermanceJanuary 24, 2007
[Sub-Catchments might becombined into
Principal Catchments;(i.e. "Dissolve" boundaries)]
16
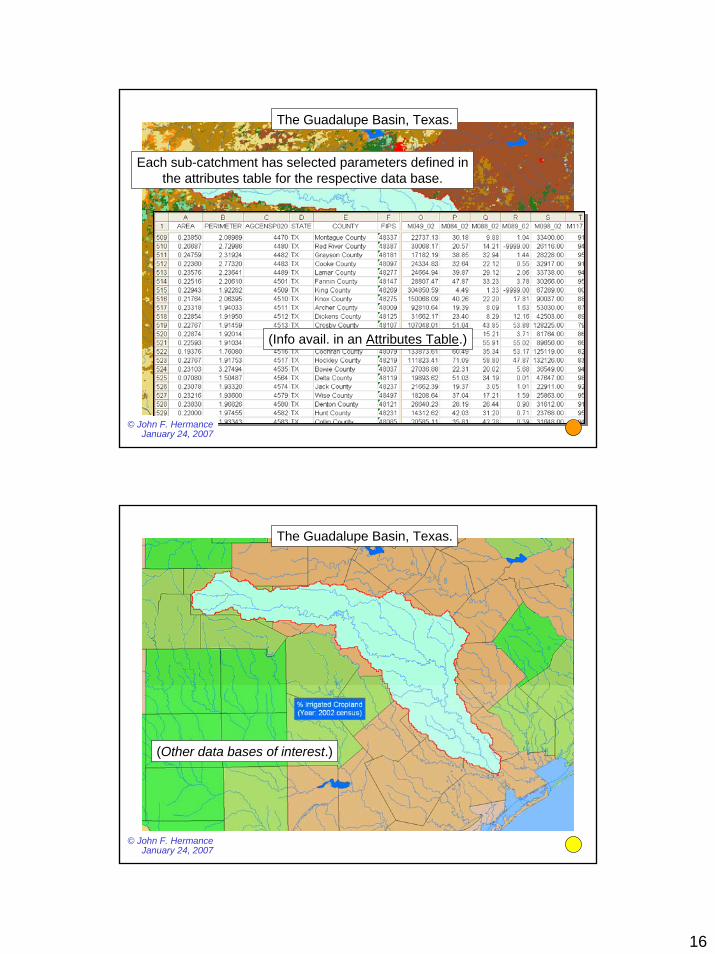
The Guadalupe Basin, Texas.
© John F. HermanceJanuary 24, 2007
(Info avail. in an Attributes Table.)
Each sub-catchment has selected parameters defined inthe attributes table for the respective data base.
The Guadalupe Basin, Texas.
© John F. HermanceJanuary 24, 2007
(Other data bases of interest.)
17
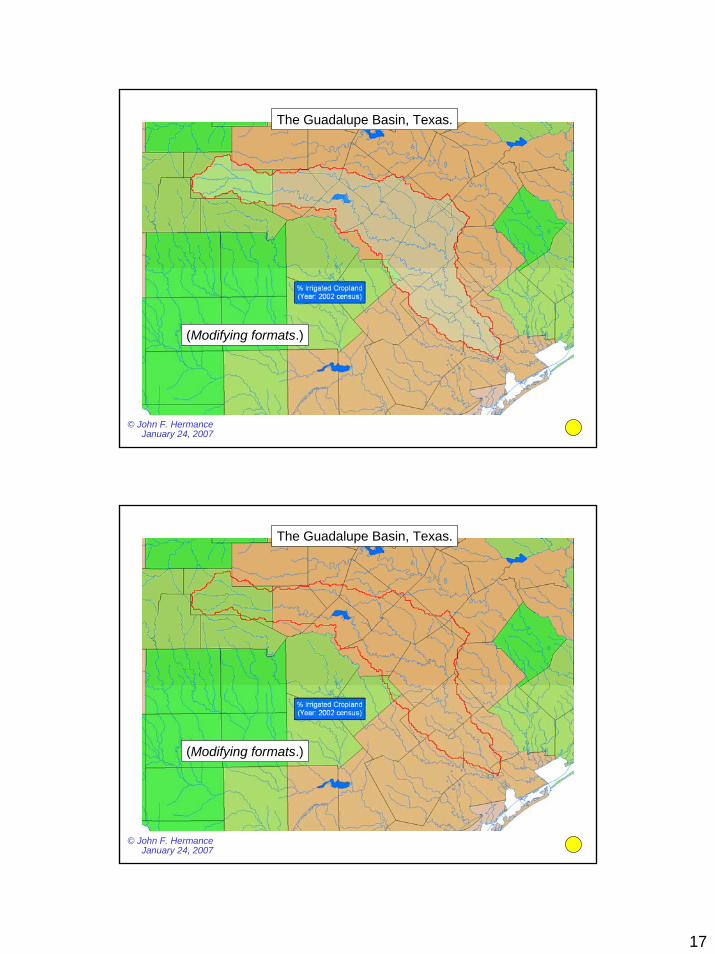
The Guadalupe Basin, Texas.
© John F. HermanceJanuary 24, 2007
(Modifying formats.)
The Guadalupe Basin, Texas.
© John F. HermanceJanuary 24, 2007
(Modifying formats.)

18
The Guadalupe Basin, Texas.
© John F. HermanceJanuary 24, 2007
(Modifying formats.)
(Label: County names.)
The Guadalupe Basin, Texas.
© John F. HermanceJanuary 24, 2007
(Label: County names.)
(Modifying formats.)
19
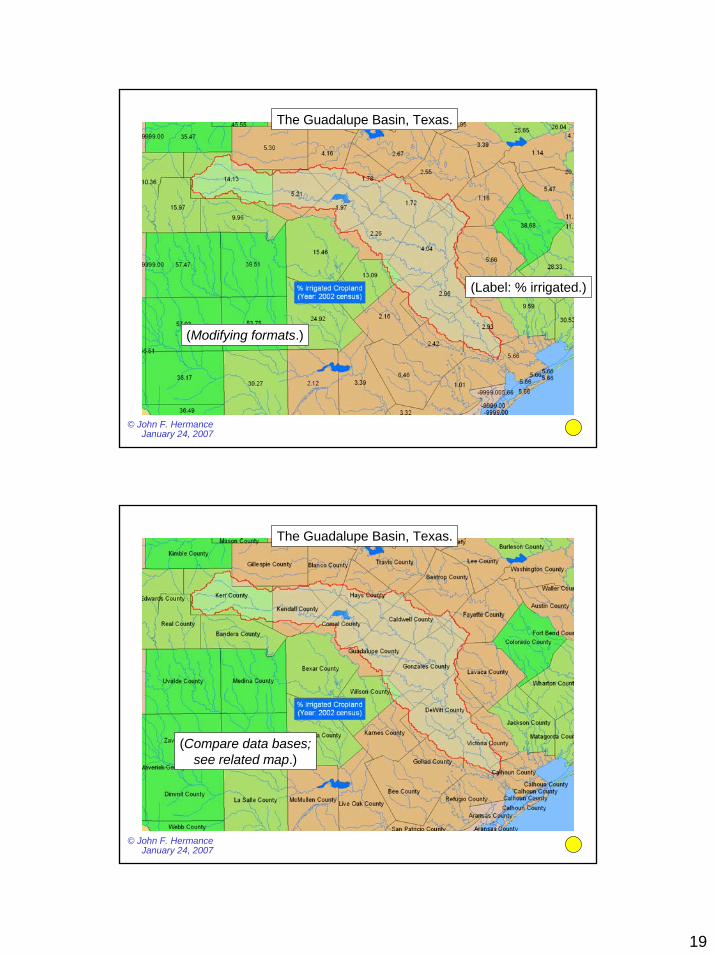
The Guadalupe Basin, Texas.
© John F. HermanceJanuary 24, 2007
(Label: % irrigated.)
(Modifying formats.)
The Guadalupe Basin, Texas.
© John F. HermanceJanuary 24, 2007
(Compare data bases;see related map.)
20
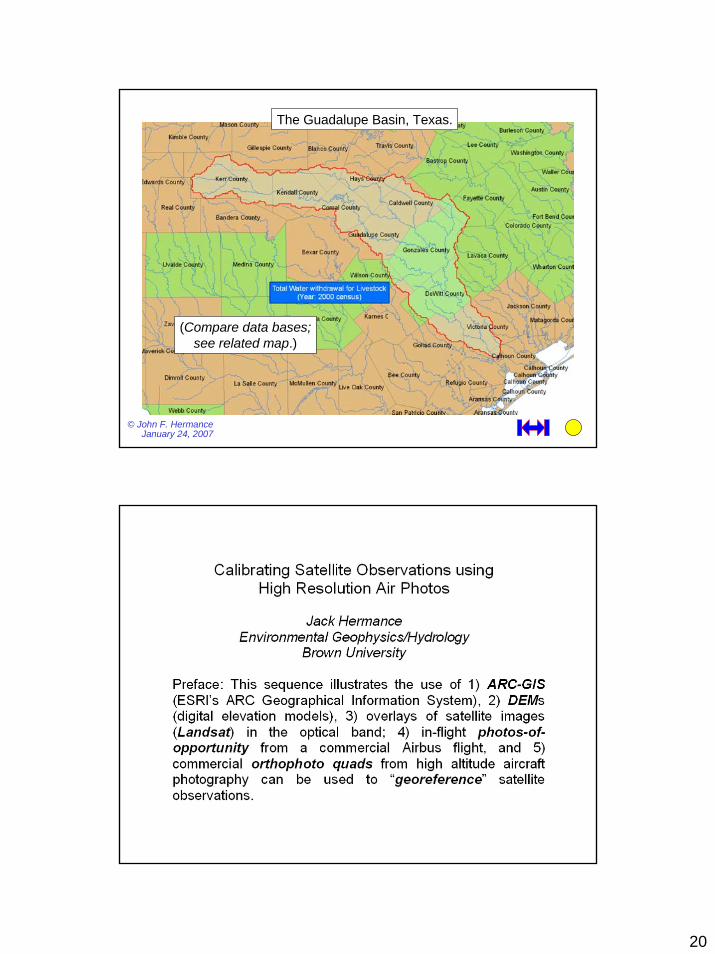
The Guadalupe Basin, Texas.
© John F. HermanceJanuary 24, 2007
(Compare data bases;see related map.)
21
© John F. HermanceJanuary 24, 2007
22
© John F. HermanceJanuary 24, 2007
© John F. HermanceJanuary 24, 2007

23
© John F. HermanceJanuary 24, 2007
(View direction.)
© John F. HermanceJanuary 24, 2007
24
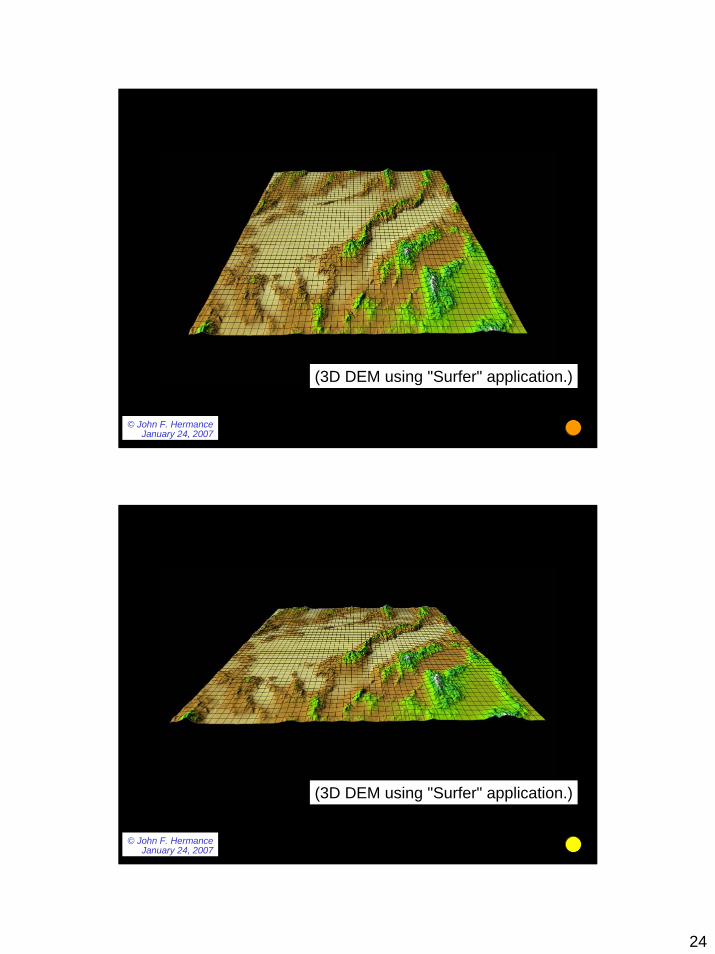
(3D DEM using "Surfer" application.)
© John F. HermanceJanuary 24, 2007
© John F. HermanceJanuary 24, 2007
(3D DEM using "Surfer" application.)
25
© John F. HermanceJanuary 24, 2007
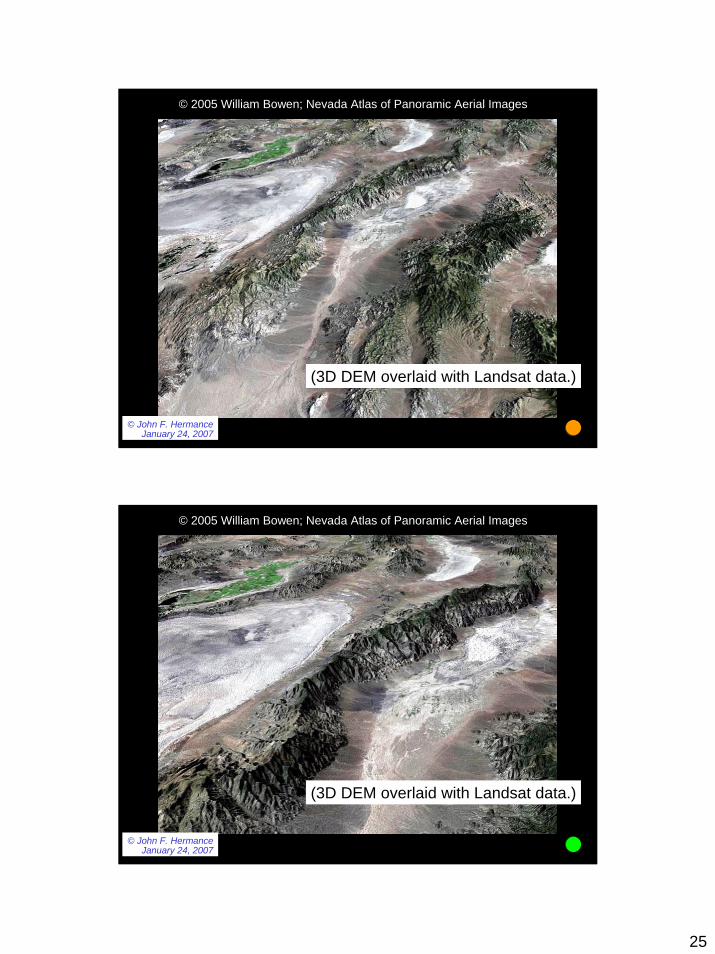
(3D DEM overlaid with Landsat data.)
© 2005 William Bowen; Nevada Atlas of Panoramic Aerial Images
© John F. HermanceJanuary 24, 2007
(3D DEM overlaid with Landsat data.)
© 2005 William Bowen; Nevada Atlas of Panoramic Aerial Images
26
© John F. HermanceJanuary 24, 2007
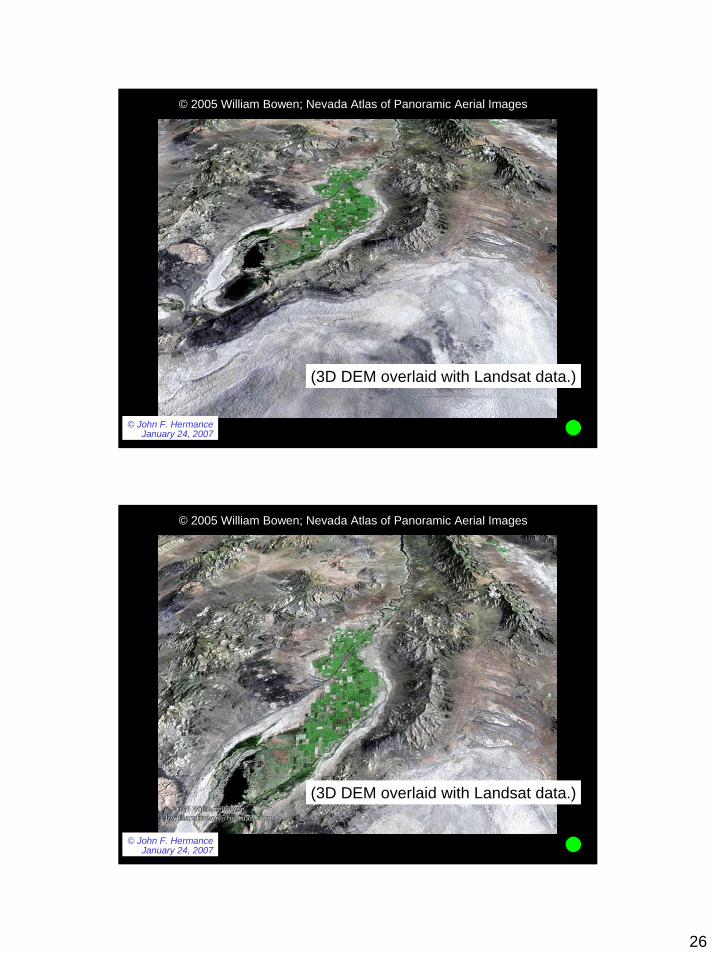
(3D DEM overlaid with Landsat data.)
© 2005 William Bowen; Nevada Atlas of Panoramic Aerial Images
© John F. HermanceJanuary 24, 2007
(3D DEM overlaid with Landsat data.)
© 2005 William Bowen; Nevada Atlas of Panoramic Aerial Images
27
© John F. HermanceJanuary 24, 2007
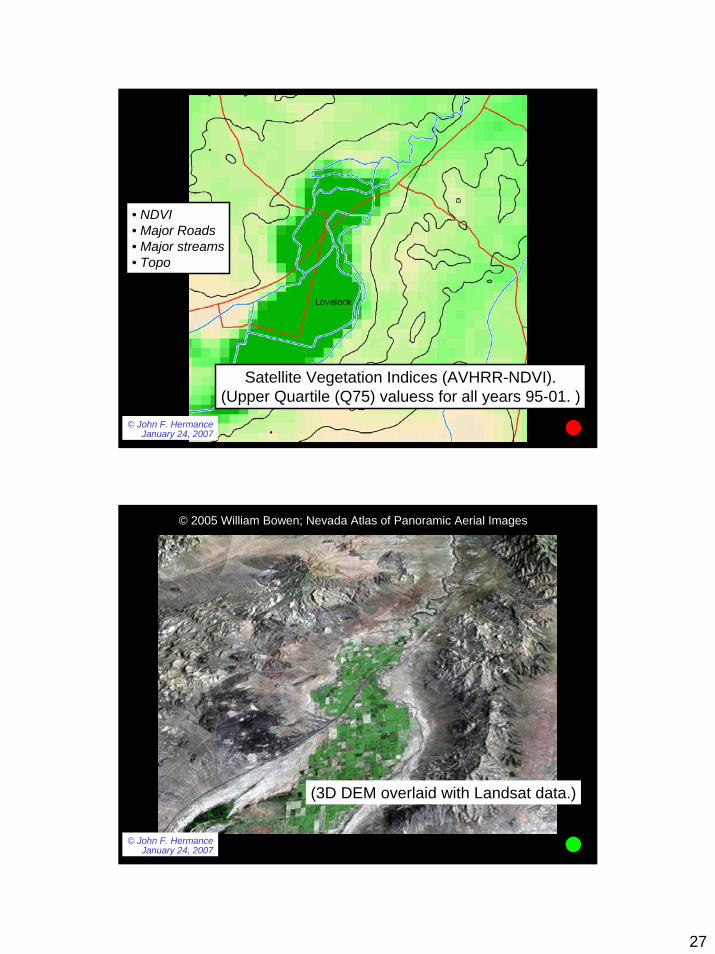
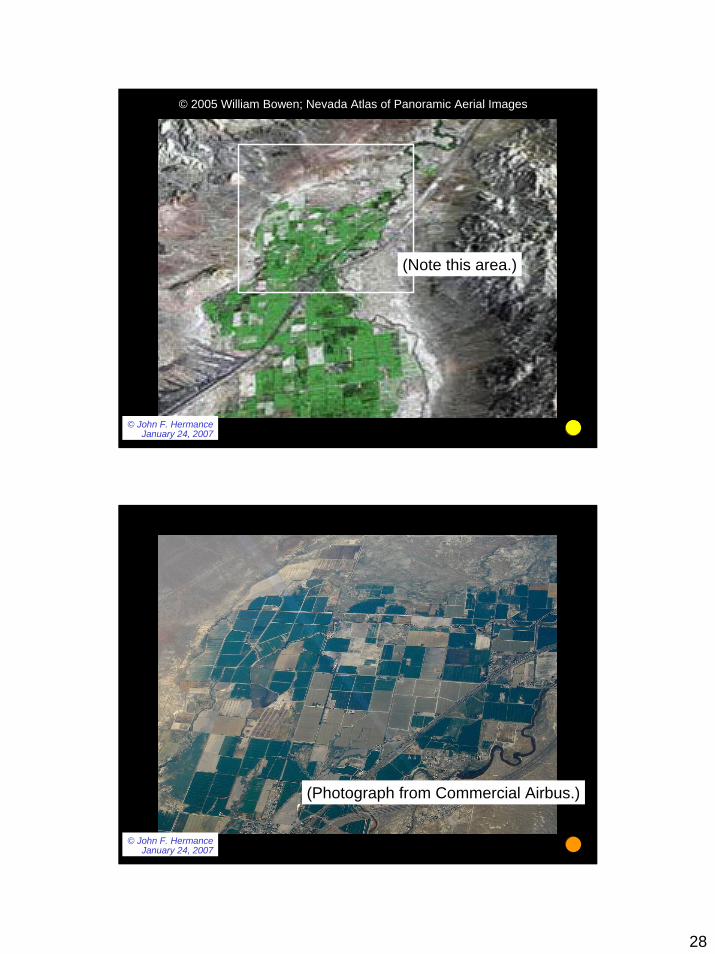
Satellite Vegetation Indices (AVHRR-NDVI).(Upper Quartile (Q75) valuess for all years 95-01. )
• NDVI• Major Roads• Major streams• Topo
© John F. HermanceJanuary 24, 2007
(3D DEM overlaid with Landsat data.)
© 2005 William Bowen; Nevada Atlas of Panoramic Aerial Images
28
© John F. HermanceJanuary 24, 2007
© 2005 William Bowen; Nevada Atlas of Panoramic Aerial Images
(Note this area.)
© John F. HermanceJanuary 24, 2007
(Photograph from Commercial Airbus.)
29
© John F. HermanceJanuary 24, 2007
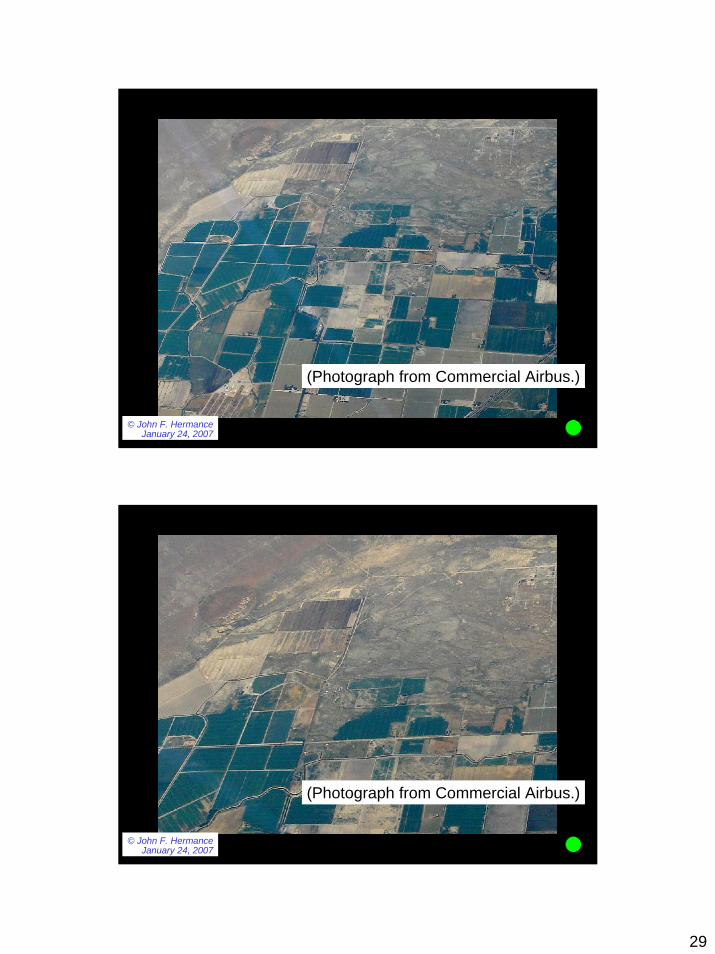
(Photograph from Commercial Airbus.)
© John F. HermanceJanuary 24, 2007
(Photograph from Commercial Airbus.)
30
© John F. HermanceJanuary 24, 2007
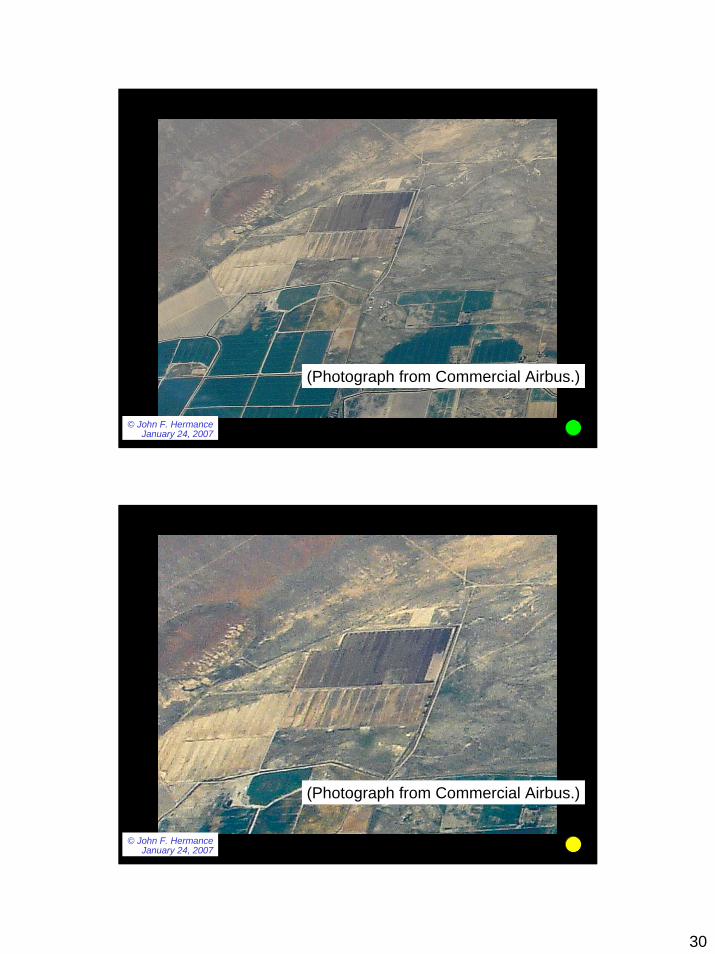
(Photograph from Commercial Airbus.)
© John F. HermanceJanuary 24, 2007
(Photograph from Commercial Airbus.)
31
© John F. HermanceJanuary 24, 2007
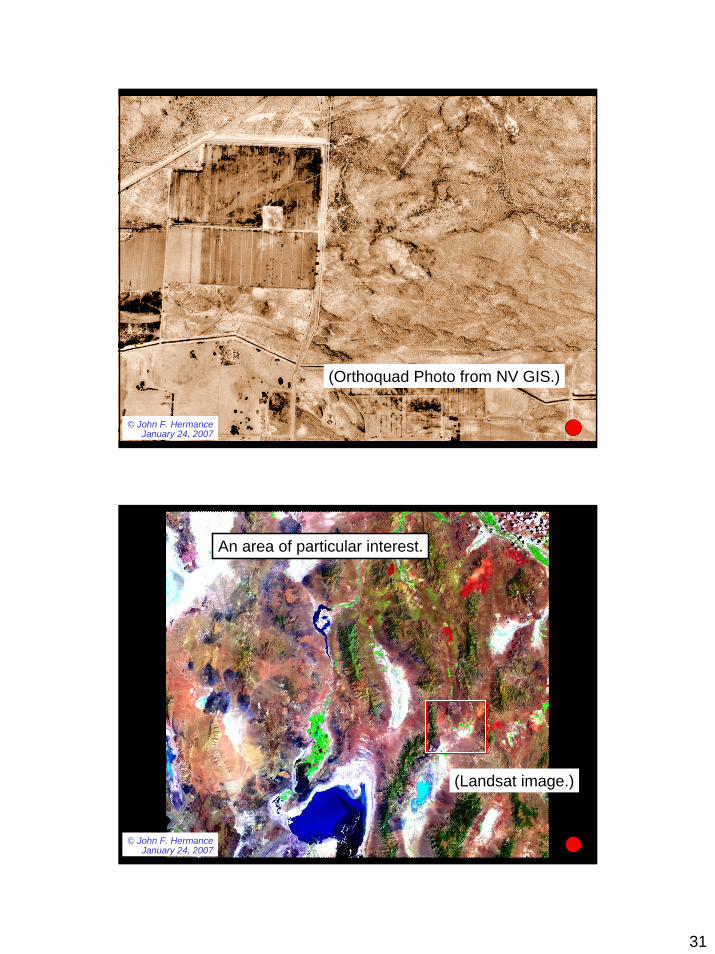
(Orthoquad Photo from NV GIS.)
© John F. HermanceJanuary 24, 2007
(Landsat image.)
An area of particular interest.
32
© John F. HermanceJanuary 24, 2007
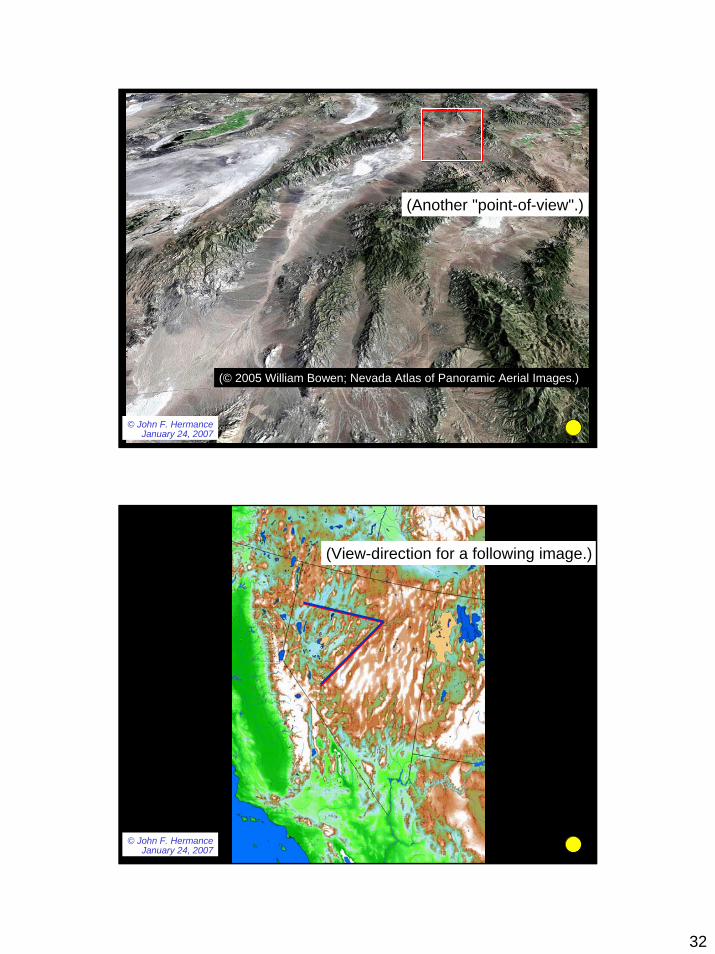
(Another "point-of-view".)
(© 2005 William Bowen; Nevada Atlas of Panoramic Aerial Images.)
© John F. HermanceJanuary 24, 2007
(View-direction for a following image.)
33
© John F. HermanceJanuary 24, 2007
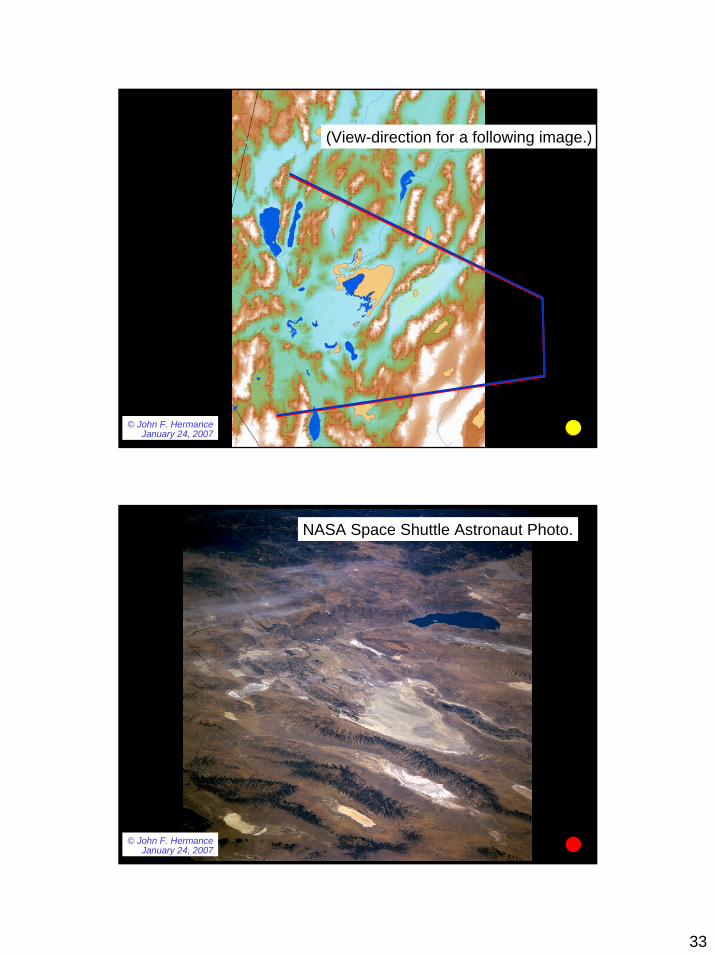
(View-direction for a following image.)
© John F. HermanceJanuary 24, 2007
NASA Space Shuttle Astronaut Photo.
34
© John F. HermanceJanuary 24, 2007
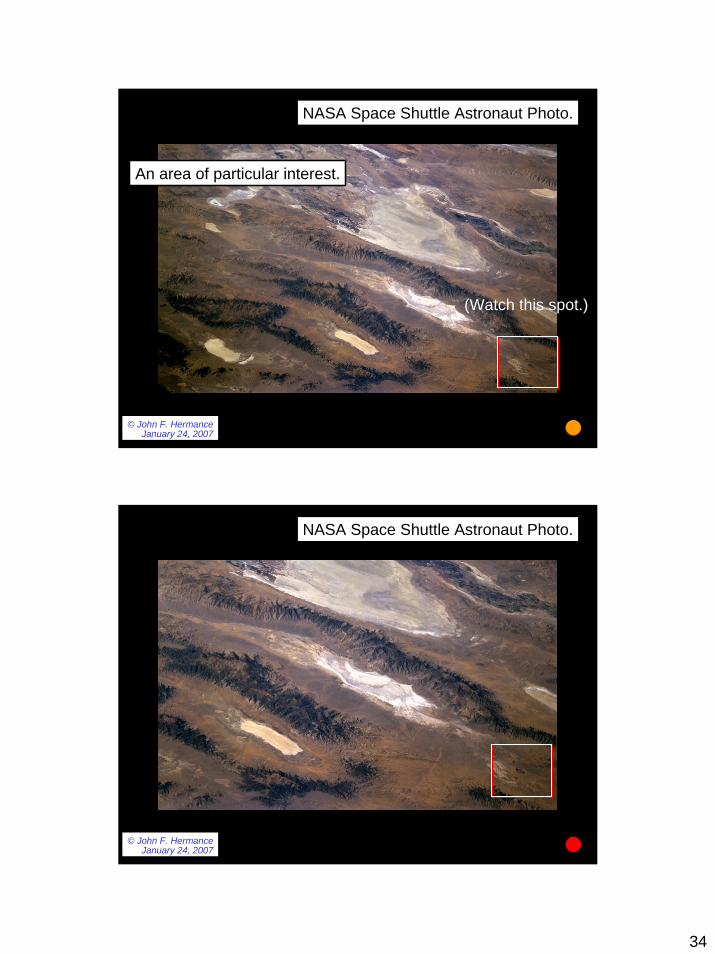
NASA Space Shuttle Astronaut Photo.
(Watch this spot.)
An area of particular interest.
© John F. HermanceJanuary 24, 2007
NASA Space Shuttle Astronaut Photo.
35
© John F. HermanceJanuary 24, 2007
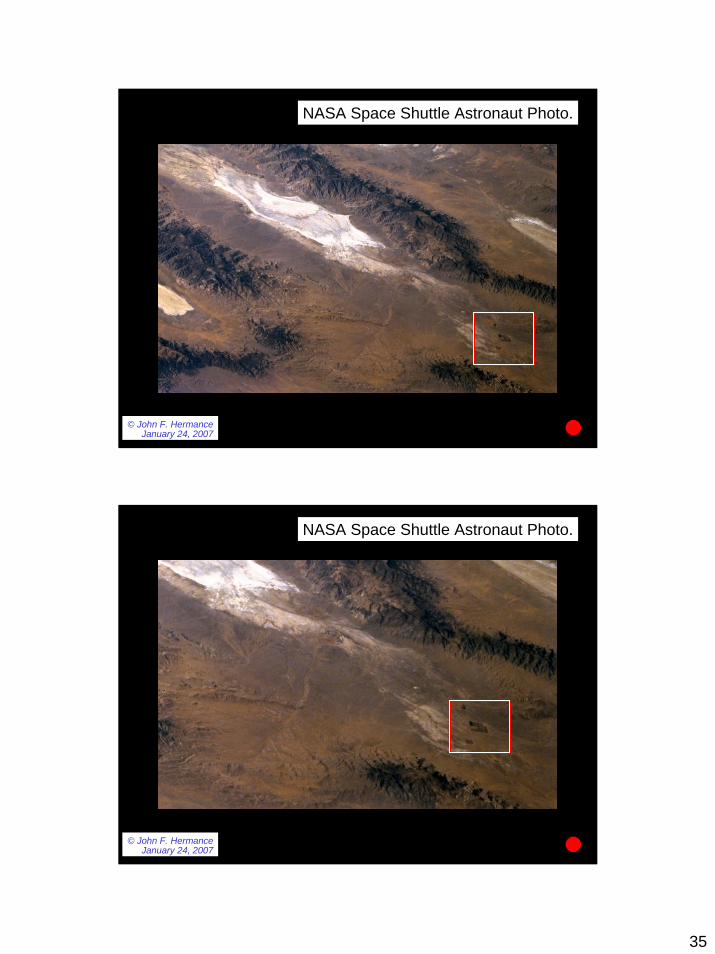
NASA Space Shuttle Astronaut Photo.
© John F. HermanceJanuary 24, 2007
NASA Space Shuttle Astronaut Photo.
36
© John F. HermanceJanuary 24, 2007
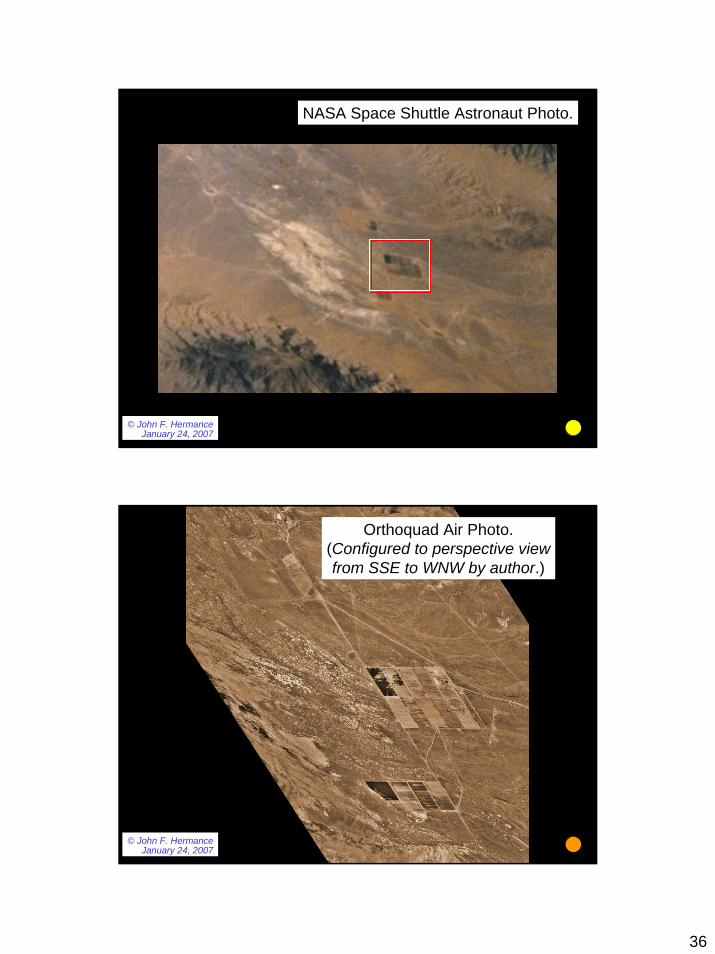
NASA Space Shuttle Astronaut Photo.
© John F. HermanceJanuary 24, 2007
Orthoquad Air Photo.(Configured to perspective viewfrom SSE to WNW by author.)
37
© John F. HermanceJanuary 24, 2007
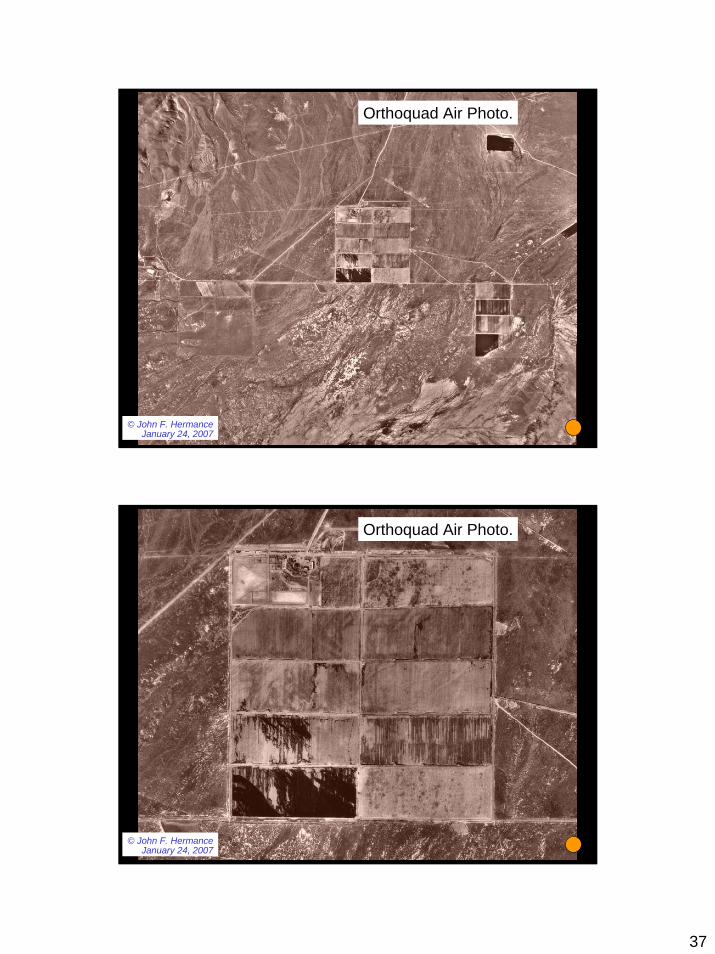
Orthoquad Air Photo.
© John F. HermanceJanuary 24, 2007
Orthoquad Air Photo.
38
© John F. HermanceJanuary 24, 2007
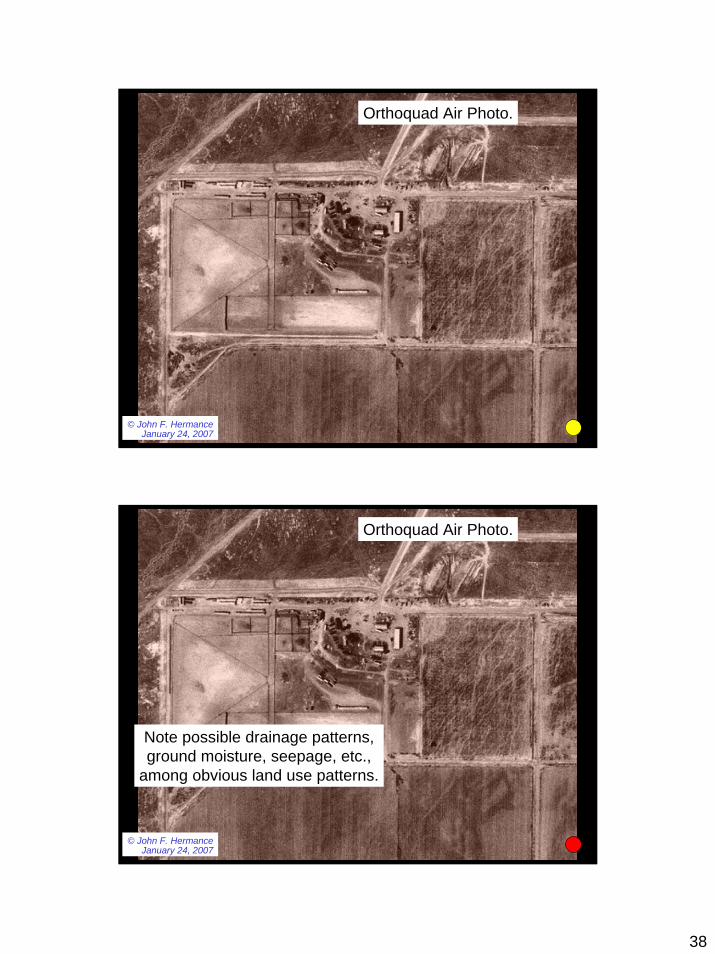
Orthoquad Air Photo.
© John F. HermanceJanuary 24, 2007
Note possible drainage patterns,ground moisture, seepage, etc.,
among obvious land use patterns.
Orthoquad Air Photo.
39
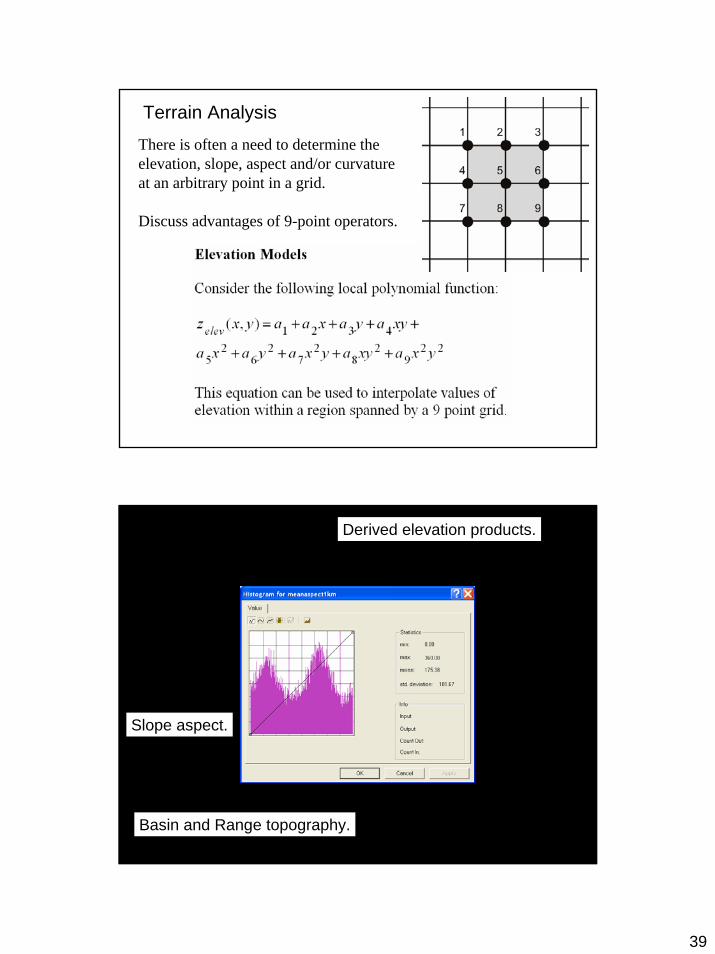
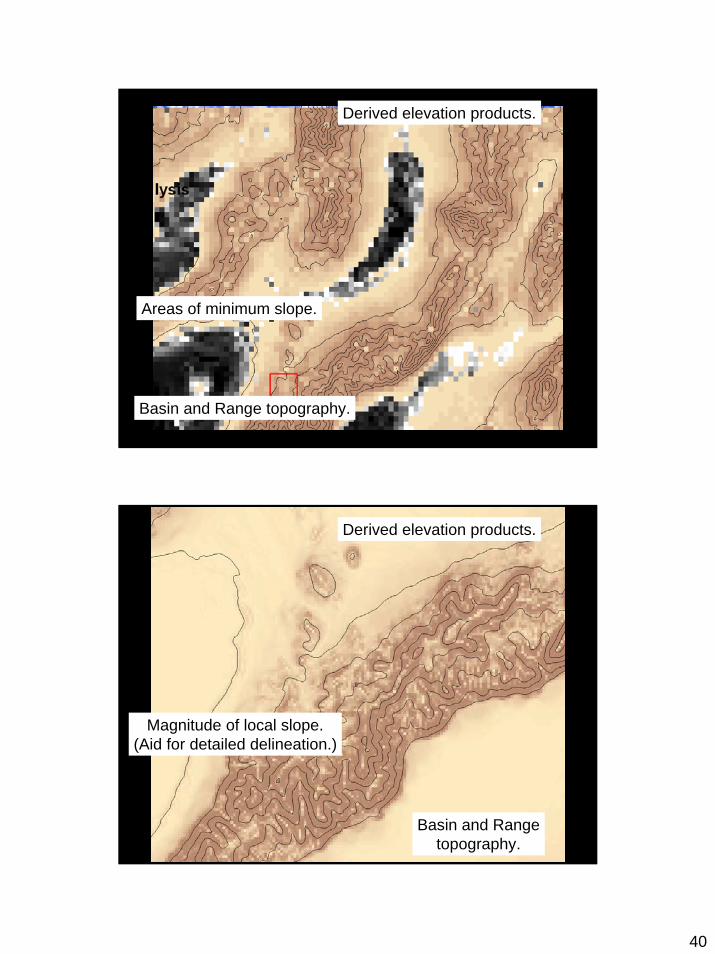
There is often a need to determine the elevation, slope, aspect and/or curvature at an arbitrary point in a grid.
Discuss advantages of 9-point operators.
Terrain Analysis
Derived elevation products.
Basin and Range topography.
Slope aspect.
40
Derived elevation products.
Basin and Range topography.
Areas of minimum slope.
Derived elevation products.
Basin and Rangetopography.
Magnitude of local slope.(Aid for detailed delineation.)
41
Quantitative Elements of Hydrology
© John F. HermanceJanuary 24, 2007
End of Presentation(A GIS View of Hydrology)
End of Presentation(A GIS View of Hydrology)
Contact information:Jack HermanceEnvironmental Geophysics/HydrologyDepartment of Geological SciencesBrown University, Providence, RI 02912-1846Tel: 401-863-3830e-mail: [email protected]