a geographic analysis of the area surrounding mount shasta...
TRANSCRIPT

A Geographic Analysis of the Area Surrounding Mount Shasta and
a Recent History of Severe Fire
NAME REDACTED
12/9/2016
GSP 270 online
Introduction
Mount Shasta is one of the highest peaks in California at 14,179 ft. high. The
surrounding land is incredibly diverse with the Klamath Mountains to the west, high desert and
pine-juniper woodland to the north, and vast areas of ponderosa pine and mixed conifer forest to
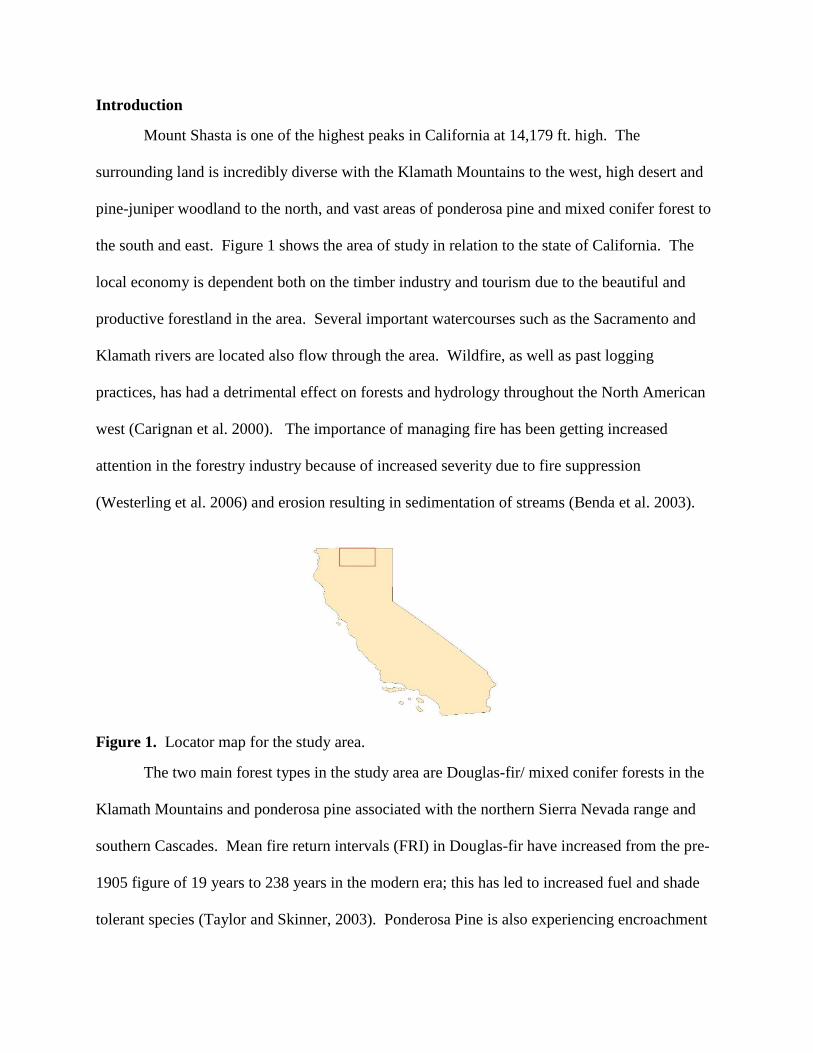
the south and east. Figure 1 shows the area of study in relation to the state of California. The
local economy is dependent both on the timber industry and tourism due to the beautiful and
productive forestland in the area. Several important watercourses such as the Sacramento and
Klamath rivers are located also flow through the area. Wildfire, as well as past logging
practices, has had a detrimental effect on forests and hydrology throughout the North American
west (Carignan et al. 2000). The importance of managing fire has been getting increased
attention in the forestry industry because of increased severity due to fire suppression
(Westerling et al. 2006) and erosion resulting in sedimentation of streams (Benda et al. 2003).
Figure 1. Locator map for the study area.
The two main forest types in the study area are Douglas-fir/ mixed conifer forests in the
Klamath Mountains and ponderosa pine associated with the northern Sierra Nevada range and
southern Cascades. Mean fire return intervals (FRI) in Douglas-fir have increased from the pre-
1905 figure of 19 years to 238 years in the modern era; this has led to increased fuel and shade
tolerant species (Taylor and Skinner, 2003). Ponderosa Pine is also experiencing encroachment
by shade tolerant species, leading to more severe fires than are believed to have occurred
historically (Miller et al. 2009). Fire severity refers to the amount of vegetation killed by fire,
rather than the intensity of fire itself. The purpose of this geographic analysis is to illustrate the
severity of large fires around Mount Shasta and the resources they may be affecting.
Method
The Earth Explorer database provided by the U.S. Geological Survey (USGS) provides
digital elevation models (DEMs) for the geographic United States. For the purposes of this
study, two DEMs were downloaded and merged to show approximately 7,159 square miles
surrounding Mount Shasta. The USGS also provides data on the National Map website. The data
provided includes hydrological feature and governmental boundary shapefiles which were used
in this study. The vector data for governmental boundaries was used to show the incorporated
city boundaries in the area and the large areas of national forest land (including the wilderness
area located on Mount Shasta itself. Data for hydrological features includes the many river
systems and waterbodies affected by fire in the area.
Burn severity data was downloaded from the Monitoring Trends in Burn Severity
(MTBS) website. MTBS is an ongoing project that includes cooperative efforts made by the
USGS, U.S. Forest Service (USFS), and various landowning agencies in the U.S. Department of
the Interior (DOI). Burn severity data was compiled and downloaded in raster format for fires
larger than or equal to 1000 acres within the project area. The files including the GIS data also
provided tables illustrating the number of acres burned for each level of severity within the fire
boundary. All raster and vector information used in this project was converted to the Universal
Transverse Mercator projection applying the NAD 1983 geographic coordinate system.
Results

Boundaries for incorporated areas and national forests are depicted in Figure 2. The three
national forests (NF) neighboring Mount Shasta include the Modoc NF, Shasta-Trinity NF
(depicted as Shasta National Forest on the map), and the Klamath National Forest. The Mount
Shasta wilderness is located on the mountain itself and is under the management jurisdiction of
the Shasta-Trinity NF. The largest city is Yreka, the seat of Siskiyou County, with an estimated
population of 7,597. The unincorporated area not illustrated by polygon shapefiles includes
unincorporated communities, industrial timberland, rural homesteads, and ranches and farms.
Figure 2. Incorporated cities and national forests surrounding Mt. Shasta and the unincorporated
rural areas in between.
The Sacramento, McCloud, Trinity, and Shasta River headwaters headwaters are all in
close proximity to Mount Shasta (Figure 3). Other major rivers nearby are the Lost, Klamath,
and Pit. All of the hundreds are tributaries to these seven large watercourses. There are many
lakes in the area, the largest being in the flat basin to the northeast of the mountain. The rivers

and tributaries in the steep Klamath and northern Sierra Nevada mountains are the most prone to
sedimentation after fire.
Figure 3. Major rivers and bodies of water in the Mt. Shasta area.
The search for fires that occurred between 2010 and 2014 (2014 being the most recent
data available) and being 1000 acres or larger yielded six results shown in Figure 4. The fires
affected mostly national forest land the Day Fire and the Little Deer Fire burned in
unincorporated areas as well. The Day Fire also burned on two different forests. Also of note is
that the Scorpion Complex consists of two separate fires which were combined for management
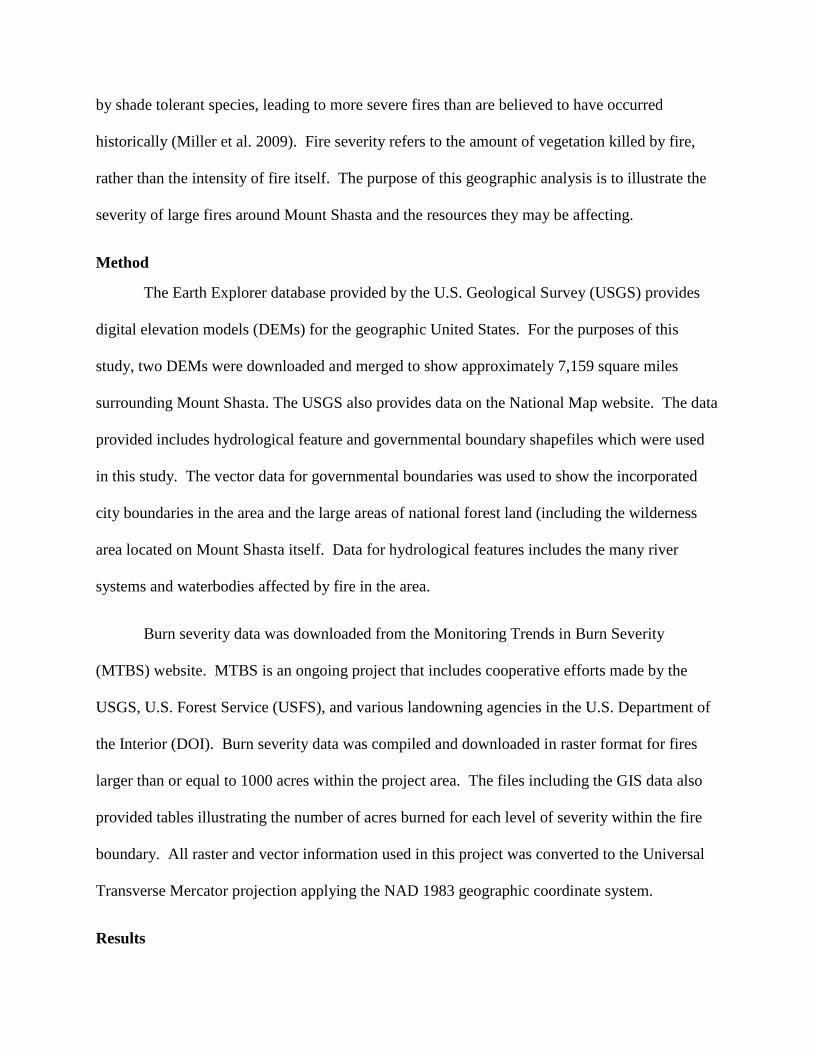
reasons and the sake of suppression efforts. Table 1 shows the acres burned in each fire and the
number of acres burning under each level of severity. The largest fire included in this analysis is
the Bagley at 47,737 acres. However, the Beaver Fire in the Klamath Mountains had the largest

area of high severity burn at 11,968 acres. Total acreage burned under severe conditions was
30,861 acres, approximately 6,500 acres less than low severity and roughly equal to moderate.
High severity fire burned in 29% of the total acres burned.
Figure 4. Showing the locations of six wildfires and there relative size to the landscape. (Note
the Bagley fire could not be fit entirely on the map).
Table 1. The number of acres burned by fire and severity.
Severity Unburned/low Low Moderate High Total
Scorpion Complex 336 2329 101 0 2768 Little Deer 589 1227 2488 1279 5714 Day 1568 1467 2900 7786 13749 Beaver 1849 9187 11269 11968 34278
Cougar 91 756 854 242 1944 Bagley 3114 22404 12621 9586 47737
Totals 7547 37370 30233 30861 106190
Discussion
Forest types like ponderosa pine and Douglas-fir/mixed conifer that have very low FRI
are assumed to naturally burn at low severity. Fuel reduction from fire is the main factor
attributed to this relationship (Agee, 1998). High severity fire burned nearly a third of the area
covered by fires in this study. The science is still unclear whether patches of high severity fire
are natural in these ecosystems. It is entirely possible that burn severity varied spatially in
historic fire regimes creating a patchwork-like pattern across the landscape. There is evidence
that western mixed conifer forests historically experienced a mixed severity fire regime, even
with low FRI (Perry et al. 2011). This would explain the patchiness of the fires in this analysis.
Appendix 1 shows burn severity maps for each, and they all include, to some degree a patchy
pattern of severity. The exception is the Scorpion Complex which was mostly a low severity fire
with some small patches of moderate severity. There are many factors that may have played a
role in the reduced severity of this fire including weather conditions and vegetation type.
Conclusion
The area surrounding Mount Shasta includes diverse vegetation and important
hydrological features. This makes the management of fire in the area a critical issue. With
climate change and drought occurring in Northern California, it is important for land managers to
make informed decisions on fire use and fire suppression. Prescribed fire in the area has
increased in recent years and is an effective tool in reducing fuel loading and, therefore, possibly
mitigating the hazard of high severity fire. Many ecologists and forest managers agree that
prescribed burn programs are the key to healthier forests. However socio-economic factors have
so far limited the use of prescribed fire; this is a problem science may not be able to solve
directly.
Appendix 1
Red= High Severity
Yellow= Moderate
Light Blue= Low

Green= Low/ Unburned
Figure 5. Burn Severity raster for the Bagley Fire.
Figure 6. Burn severity raster for the Beaver Fire.

Figure 7. Burn severity raster for the Day Fire.
Figure 8. Burn severity raster for the Cougar Fire
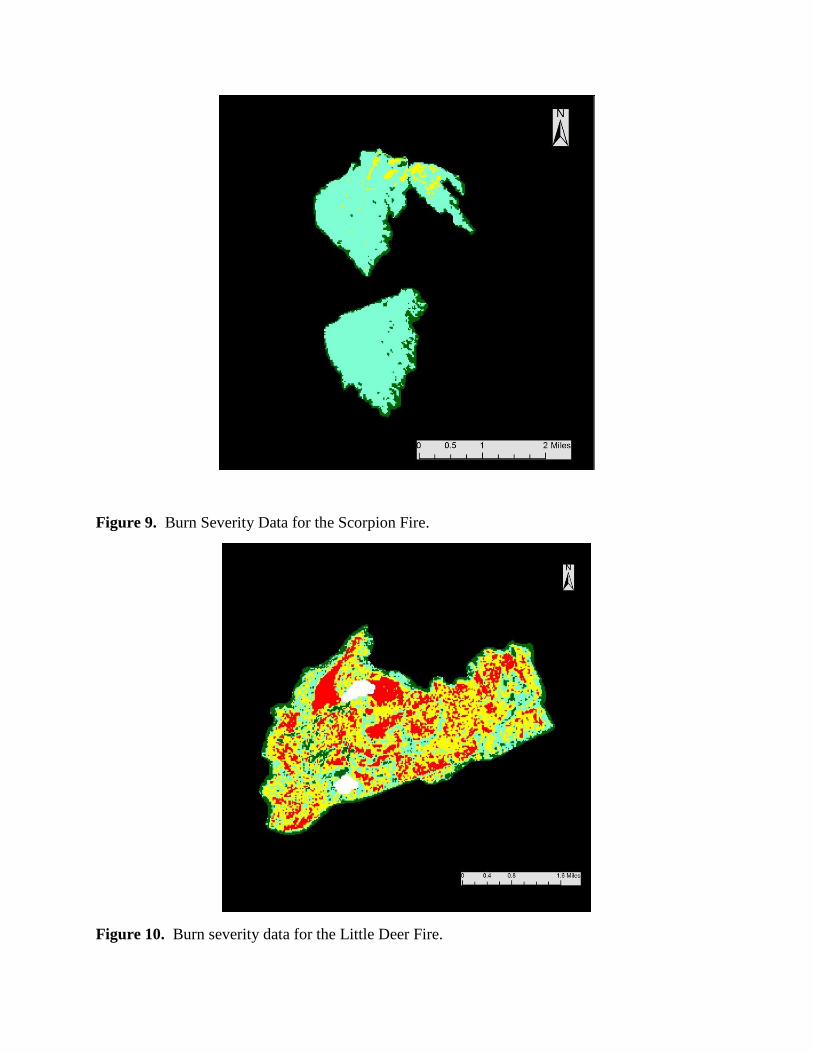
Figure 9. Burn Severity Data for the Scorpion Fire.
Figure 10. Burn severity data for the Little Deer Fire.

GIS Data Sources
National Map- https://nationalmap.gov/
Earth Explorer- https://earthexplorer.usgs.gov/
Monitoring Trends in Burn Severity- http://www.mtbs.gov/
References
Agee, J. K. (1998). The landscape ecology of western forest fire regimes. Northwest Science, 72,
24.
Benda, L., Miller, D., Bigelow, P., & Andras, K. (2003). Effects of post-wildfire erosion on
channel environments, Boise River, Idaho. Forest Ecology and Management, 178(1), 105-
119.
Carignan, R., D'Arcy, P., & Lamontagne, S. (2000). Comparative impacts of fire and forest
harvesting on water quality in Boreal Shield lakes. Canadian Journal of Fisheries and
Aquatic Sciences, 57(S2), 105-117.
Miller, J. D., Safford, H. D., Crimmins, M., & Thode, A. E. (2009). Quantitative evidence for
increasing forest fire severity in the Sierra Nevada and southern Cascade Mountains,
California and Nevada, USA. Ecosystems, 12(1), 16-32.
Perry, D. A., Hessburg, P. F., Skinner, C. N., Spies, T. A., Stephens, S. L., Taylor, A. H., ... &
Riegel, G. (2011). The ecology of mixed severity fire regimes in Washington, Oregon, and
Northern California. Forest Ecology and Management, 262(5), 703-717.
Taylor, A. H., & Skinner, C. N. (2003). Spatial patterns and controls on historical fire regimes and
forest structure in the Klamath Mountains. Ecological Applications, 13(3), 704-719.
U.S. Census Bureau (2015). Yreka, California. Retrieved from https://www.census.gov/
Westerling, A. L., Hidalgo, H. G., Cayan, D. R., & Swetnam, T. W. (2006). Warming and earlier
spring increase western US forest wildfire activity. science, 313(5789), 940-943.