a genetic algorithm-based methodology for optimizing
TRANSCRIPT

1114 JOURNAL OF LIGHTWAVE TECHNOLOGY, VOL. 21, NO. 5, MAY 2003
A Genetic Algorithm-Based Methodology forOptimizing Multiservice Convergence
in a Metro WDM NetworkHyo-Sik Yang, Martin Maier, Martin Reisslein, Member, IEEE, and W. Matthew Carlyle
Abstract—We consider the multi-objective optimization of amulti-service arrayed-waveguide grating-based single-hop metroWDM network with the two conflicting objectives of maximizingthroughput while minimizing delay. We develop and evaluatea genetic algorithm based methodology for finding the optimalthroughput-delay tradeoff curve, the so-called Pareto-optimalfrontier. Our methodology provides the network architecture(hardware) and the Medium Access Control (MAC) protocolparameters that achieve the Pareto-optima in a computation-ally efficient manner. The numerical results obtained with ourmethodology provide the Pareto-optimal network planning andoperation solutions for a wide range of traffic scenarios. Thepresented methodology is applicable to other networks with asimilar throughput-delay tradeoff.
Index Terms—Arrayed-waveguide grating, genetic algorithm,medium access control protocol, metropolitan area network,multi-objective optimization, Pareto-optimal, wavelength-divisionmultiplexing (WDM).
I. INTRODUCTION
OPTICAL single-hop wavelength division multiplexing(WDM) networks have the potential to provide high
throughput and low delay connectivity in metropolitan andlocal area settings, as demonstrated by recent studies [1]–[6].The throughput-delay performance of these single-hop WDMnetworks is typically very sensitive to the setting of thearchitec-ture parameters(e.g., degree of underlying arrayed-waveguidegrating (AWG), degree of employed combiners and splitters)and the medium access control (MAC)protocol parameters(e.g., length of frames in timing structure, number of controlslots, node back-off probability). For good network perfor-mance, these parameters must be set properly, which is achallenge due to the large search space of possible parametercombinations and the typically computationally demanding
Manuscript received April 23, 2002; revised February 5, 2003. This work wassupported in part by the National Science Foundation under Grant No. CareerANI-013322 and the German Federal Ministry of Education and Research underthe TransiNet Project.
H.-S. Yang is with the Department of Electrical Engineering, Arizona StateUniversity, Tempe, AZ 85287–7206 USA (e-mail: [email protected]).
M. Maier is with the Telecommunication Networks Group, Technical Uni-versity Berlin, 10587 Berlin, Germany (e-mail: [email protected]).
M. Reisslein is with the Telecommunication Research Center, Department ofElectrical Engineering, Arizona State University, Tempe, AZ 85287-7206 USA(e-mail: [email protected]).
W. M. Carlyle was with the Department of Industrial Engineering, ArizonaState University, Tempe, AZ 85287-7206 USA. He is now with the OperationsResearch Department, Naval Postgraduate School, Monterey, CA 93943 USA(e-mail: [email protected]).
Digital Object Identifier 10.1109/JLT.2003.811564
evaluation of a particular parameter combination. Importantly,in single-hop WDM networks, the objectives to maximizethe throughput while minimizing the delay are typically con-flicting. With certain combinations of parameter settings, thenetworks achieve a small delay and moderate throughput, whichis perfectly suited fordelay-sensitivetraffic with moderatethroughput requirements, such as voice traffic. On the otherhand, certain combinations of parameter settings achieve alarge throughput but introduce some moderate delays, which isperfectly suited forthroughput-sensitivetraffic that can toleratesome delays, such as Internet (FTP, HTTP, e-mail) and FrameRelay traffic. Typically, these different types of traffic dominateduring different times of the day, as illustrated in Fig. 1(a)–(c)[7]. During office hours, voice traffic dominates the networkload. Whereas Internet and Frame Relay traffic play a majorrole in the evening and at night, respectively. By carryingthese heterogeneous traffic types in a single converged networkthe utilization of the network resources can be significantlyincreased, as illustrated in Fig. 1(d). The resulting multi-servicenetwork enables revenue-generating services in an efficient andcost-effective way [8], [9]. This is very important especially incost-sensitive metropolitan and local area networks.
The challenge of multi-service convergence lies in i) pro-viding the different types of small delay—moderate throughputand large throughput—moderate delay service at differenttimes of the day in a given fixed installed network, and ii) pro-viding these different service types efficiently, e.g., achievingthe largest possible throughput in the small delay—mod-erate throughput regime. Optimizing the parameter setting insingle-hop WDM networks for multi-service convergence thusgives rise to a so-called multi-objective optimization problem.This multi-objective optimization problem does not have asingle solution; instead, the solution is a Pareto-optimal tradeoffcurve between throughput and delay. Roughly speaking, thistradeoff curve gives the smallest achievable delay as a functionof the desired throughput, or conversely, the largest achievablethroughput as a function of the tolerable delay. Finding theoptimal tradeoff curve as well as the combinations of parametersettings that attain this optimal tradeoff curve is a challengingproblem. This is due to the large search space of parametercombinations and the typically demanding evaluation of anindividual parameter combination. The optimal tradeoff curve,however, is crucial for 1) the planning and provisioning of newnetworks, i.e., to determine the best architecture (hardware)parameters, and 2) the efficient operation of installed networkhardware. The Pareto-optimal throughput-delay tradeoff curve
0733-8724/03$17.00 © 2003 IEEE

YANG et al.: A GENETIC ALGORITHM-BASED METHODOLOGY FOR OPTIMIZING MULTISERVICE CONVERGENCE IN A METRO WDM NETWORK 1115
Fig. 1. Different types of traffic dominate during different times of the day.
can thus be used in a two-step optimization process as follows.First, we optimize anewnetwork by finding the optimal archi-tecture (hardware) parameter values. Second, after fixing thearchitecture, we optimize the protocol (software) parameters foranexistingarchitecture. Specifically, we operate the network atdifferent points of its Pareto-optimal throughput-delay tradeoffcurve according to the traffic type that dominates at a giventime of the day. The network protocol parameters are tunedto provide varying degrees of i) small delay (and moderatethroughput) service, or ii) large throughput (and moderatedelay) service as the traffic changes with the time of the day.This tuning requires detailed knowledge of the optimal tradeoffcurve, which can be precomputed with our methodology andstored in tables for fast look-up.
In this paper, we develop a genetic algorithm based method-ology for solving the multi-objective optimization problem ofmaximizing throughput and minimizing delay in single-hopWDM networks. We consider the arrayed-waveguide grating(AWG)-based network [2] as an example throughout this paper.Our methodology finds the optimal tradeoff curve and the pa-rameter combinations attaining the curve in a computationallyefficient manner. Our work enables network planners to selectthe (hardware) network architecture parameters that give thebest performance. In addition, our methodology enables theoperators of (fixed) installed network hardware to optimallytune the throughput-delay performance along the optimaltradeoff curve by changing the (software) network MACprotocol parameters.
While we focus on the AWG-based network [2] in thiswork, our methodology applies analogously to networks witha similar throughput-delay tradeoff. Our genetic algorithmbased approach takes an analytic characterization of the mean
throughput and the mean delay of the network as input. Thisanalytic characterization may involve highly nonlinear equa-tions (or possibly systems of equations); we only require thatthe equations can be solved numerically. Our methodology mayalso be applied to networks that are analytically intractable andrequire simulations to obtain the (mean) throughput and the(mean) delay. The computational effort required to obtain theoptimal throughput-delay tradeoff curve for a given traffic loadwith our approach depends on the effort required to evaluatethe throughput and the delay for a particular combination ofnetwork parameters and the size of the exhaustive search space.The number of parameter combinations that our approachneeds to evaluate to obtain the optimal tradeoff curve is usuallyon the order of thousand times smaller than the exhaustivesearch space. In typical scenarios, our approach requires lessthan one day of CPU time on a 933 MHz PC to find the optimaltradeoff curve, whereas the exhaustive search would requireseveral years of CPU time.
This paper is organized as follows. In the following sectionwe review the related work on optimizing optical WDM net-works, including works that employ genetic algorithm based ap-proaches. In Section II, we formulate the multi-objective opti-mization problem of maximizing throughput while minimizingdelay. We briefly review the AWG-based single-hop WDM net-work [2], which is used as an example throughout the paper.We give the two objective functions (throughput and delay),we identify the decision variables in the optimization and dis-cuss the constraints on the decision variables. In Section III, wedevelop our genetic algorithm based methodology for findingthe Pareto-optimal throughput-delay tradeoff curve. First, webriefly review the notion of multi-objective optimization andexplain why we base our solution methodology on genetic al-

1116 JOURNAL OF LIGHTWAVE TECHNOLOGY, VOL. 21, NO. 5, MAY 2003
gorithms. We then discuss and evaluate in detail the individualcomponents of our methodology. In Section IV we apply ourmethodology to the AWG-based single-hop WDM network andstudy its optimal throughput-delay tradeoffs in detail. We sum-marize our conclusions in Section V.
A. Related Work
We now give a brief overview of the literature on optimiza-tion in optical WDM networks, which may be broadly cate-gorized into studies addressing i) wide-area wavelength-routedmesh WDM networks (typically envisioned as Internet back-bone networks), ii) WDM ring networks, and iii) WDM net-works with a physical star topology (typically employed in themetro/local area with a central passive star coupler (PSC) orAWG). The design and operation of wavelength-routed mesh(wide area) WDM networks have been optimized extensively,including aspects such as the routing and wavelength assign-ment, as well as the design of optimal logical topologies, see forinstance [10]–[13], and references therein. Also, optimality is-sues in planning and operation of survivable wavelength-routedWDM networks have been thoroughly investigated, see for in-stance [14], [15] and references therein. The optimal placementof wavelength converters in WDM mesh networks is studied in[16], while [17] studies the optimal amplifier placement. Theoptimal setting of physical parameters in optical networks, suchas the power budget and detection thresholds, have also beeninvestigated, e.g., [18], [19]. General strategies for the optimalplanning of optical networks are explored in [20].
WDM ring networks (including SONET/SDH rings) have re-ceived a great deal of attention and a wide range of aspectsof ring networks, including the placement of add–drop multi-plexers, traffic grooming strategies, the provisioning of wave-lengths and hardware components to ensure network surviv-ability, as well as MAC protocols and wavelength assignmenthave been optimized, see for instance, [21]–[24].
WDM networks with a physical star topology are typicallystudied in the context of single-hop networks [25] or multi-hopnetworks [26]. For multi-hop networks, much research has goneinto the design of optimal virtual topologies (see for instancethe survey [26]). For single-hop networks most optimization ef-forts have focused on the optimal scheduling, see for instance[27] and [28]. Our optimization methodology is orthogonal tothese studies in that our methodology optimizes the architec-ture and MAC protocol parameters of the network without as-suming any particular scheduling mechanism. (To fix ideas asimple FCFS scheduling policy is used in [29], where the meanthroughput and the mean delay of the network considered inthis paper are derived.) A unique aspect of our work is that wejointly optimize the networkarchitecture(hardware) and theMAC protocol parameters (software). Generally, the existingworks, in isolation optimize either hardware or software pa-rameters. We also note that most of the existing literature onsingle-hop WDM networks considers networks based on a cen-tral PSC, which is a broadcast device and hence does not allowfor spatial wavelength reuse. In contrast, we consider a net-work based on an AWG, which provides wavelength-sensitive
routing and thus allows for spatial wavelength reuse. This allowsfor increased concurrency and as we demonstrate in this paper,makes the AWG based network a promising candidate for effi-ciently achieving multi-service convergence in metro area net-works. (The wavelength routing property of the AWG has re-cently also been exploited in other networking contexts, e.g., inoptical packet switches [30].)
Another distinguishing feature of our work is that we explic-itly consider a multi-objective optimization problem, whereasmost of the existing literature focuses on optimizing a singleobjective function. Optical network optimization with multipleconflicting objectives is considered only by a few studies. In[31] reconfiguration policies to accommodate changing traffic(routing) patterns or the failure of network components in aPSC-based single-hop WDM network are studied. It is foundthat maximizing the degree of load balancing and minimizingthe number of transceiver retunings are conflicting objectives.The problem is formulated in a Markov decision process frame-work, which is used to evaluate reconfiguration policies. The re-configuration policy that achieves the desired balance betweenthe two conflicting objectives is determined by selecting propercost functions and weights for the objectives. In [24] it is notedthat minimizing the number of nodes (optical add–drop multi-plexers) and minimizing the number of rings in a stack of WDMrings are conflicting objectives; the tradeoff is quantified and aheuristic for finding a spectrum of designs is developed. Sim-ilarly, in [22], [23] it is observed that the objectives to mini-mize the number of optical add–drop multiplexers and to mini-mize the number of wavelengths in a WDM ring network areconflicting and a number of designs that strike different bal-ances between the objectives are proposed. In [32] a multi-ob-jective optimization problem to find the wavelength assignmentin a mesh WDM network that minimizes the path lengths whilemaximizing the fiber utilizations is formulated and solved usinggenetic algorithms.
A wide range of optimization methods are employed inthe reviewed optical network optimization studies. Some usetraditional optimization methods that are guaranteed to find theglobal optimum, such as integer linear programming, employedfor instance in [10], [15]. However, due to the complexity of theproblems and the prohibitive computational effort required forsolving them with traditional methods, novel algorithms andheuristics are developed (e.g., [13]) and heuristic algorithms,such as Tabu-search (e.g., in [11]), simulated annealing (e.g., in[12]), and genetic algorithms (in [17], [32]–[36]) are applied.We note that the use of evolutionary (genetic) algorithms in thedesign of general wide area mesh network topologies that mini-mize the network cost is studied in [37]. Genetic algorithms arecompared with simulated annealing for optimizing the topo-logical design of a network in [38] and it is found that geneticalgorithms give better performance than simulated annealing.The existing studies employing genetic algorithms for opticalnetwork optimization typically optimize asingleobjective, e.g.,minimize the number of amplifiers [17], minimize the networkcost [35], [36], or maximize the number of connections whilesatisfying power constraints [33]. In contrast, in this paper we

YANG et al.: A GENETIC ALGORITHM-BASED METHODOLOGY FOR OPTIMIZING MULTISERVICE CONVERGENCE IN A METRO WDM NETWORK 1117
Fig. 2. Architecture of AWG based WDM network.
consider amulti-objective optimization problem—minimizedelay while maximizing throughput.
II. FORMULATING THE MULTI-OBJECTIVE
OPTIMIZATION PROBLEM
In this section we formulate the multi-objective optimizationproblem of maximizing throughput while minimizing delay insingle-hop WDM networks. We first review the AWG-basedsingle-hop WDM network [2], which we use as an example net-work throughout this paper.
A. Overview of AWG-Based Single-Hop WDM Network
The basic architecture of the single-hop WDM network [2] isbased on a AWG, as shown in Fig. 2. At each AWG inputport, a wavelength-insensitive combiner collects data from
attached nodes. Similarly, at each AWG output port, signalsare distributed to nodes by a wavelength-insensitivesplitter. (An Erbium Doped Fiber Amplifier (EDFA) is placedat the output of each combiner and the input of each splitter tocompensate for the splitting/combining and fiber losses.) Eachnode is composed of a transmitting part and a receiving part.The transmitting part of a node is attached to one of the com-biner ports. The receiving part of the same node is located atthe opposite splitter port. The network connectsnodes. At each AWG input port we exploit adjacent FreeSpectral Ranges (FSR’s) of the AWG, each FSR consists of
contiguous wavelengths. The total number of wavelengthsat each AWG input port is . The network runs anattempt-and-defer type of MAC protocol, i.e., a data packet isonly transmitted after the corresponding control packet has beensuccessfully transmitted. In the MAC protocol, time is dividedinto cycles. Each cycle consists of frames. Each frame con-tains slots. The slot length is equal to the transmission time
of a control packet. Each frame is partitioned into the first,, slots and the remaining ( ) slots. In the
first slots, control signals are transmitted based on a modifiedslotted ALOHA protocol and all nodes must be tuned (locked)to one of the Light Emitting Diode (LED) slices carrying thecontrol information. (This LED slice broadcast mechanism canalso be used to quickly update the protocol parameters in all net-work nodes. By looking up the appropriate parameter settingsin a table precomputed with our methodology and broadcastingthem to the nodes with the LED slices in one single hop, the net-work is able to adapt almost instantly to changing traffic condi-tions and throughput-delay requirements.) In every frame withinthe cycle, the nodes attached to a different AWG input port sendtheir control packets. Specifically, all nodes attached to AWGinput port , , (via a common combiner) send theircontrol packets in frameof the cycle. During the first slotsof frame , control and data packets can be transmitted simulta-neously by the nodes attached to AWG input port. Transmis-sions from the other AWG input port cannot be received duringthis time interval. In the last ( ) slots of each frame, nocontrol packets are sent. The receivers are unlocked, allowingtransmission between any pair of nodes. This allows for spatialwavelength reuse. In the considered traffic scenario, a node thatis not backlogged generates a new packet with probabilityatthe beginning of its transmission cycle. The generated packet islong (has size slots) with probability , and is short (has size
slots) with probability . The parameters ofthe considered network architecture and MAC protocol, as wellas the traffic parameters are summarized in Table I.
B. Objective Functions: Throughput and Delay
The two key performance metrics of single-hop WDM net-works, such as the AWG-based network reviewed in the pre-ceding section, are the mean throughput and the mean delay. The

1118 JOURNAL OF LIGHTWAVE TECHNOLOGY, VOL. 21, NO. 5, MAY 2003
TABLE IPARAMETERS OFNETWORK ARCHITECTURE ANDMAC PROTOCOL
typical goal of the optimization of single-hop WDM networksis to maximize the throughput while minimizing the delay. Forthe reviewed AWG-based network, the mean throughput and themean delay have been derived in [29] as functions of the param-eters summarized in Table I. (The derivation in [29] consideredthe case , i.e., . In our optimization, we allowfor , i.e., ; the objective functions for the specialcase are derived in [39].) We briefly review here thesetwo objective functions of our optimization.
The average throughput of the network is defined as the av-erage number of transmitting nodes in a slot and is given by
(1)
where is the expected number of successfully scheduledlong packets (of size slots) from a given (fixed) AWG inputport to a given (fixed) AWG output port per cycle (of lengthslots), and is the expected number of successfully sched-uled short packets (of length slots) from a given(fixed) AWG input port to a given (fixed) AWG output port percycle. (We note that the throughput given by (1) may also be in-terpreted as the average number of transmitted data packets perframe; for convenience we will use this packets/frame interpre-tation in our numerical work in Sections III and IV) and
are evaluated by modeling the control packet contentionand the data packet scheduling, and then establishing a set ofequilibrium equations for the network. In brief, the arrival rateof control packets to a given control slot is expressed as
(2)
where is the fraction of idle (i.e., not backlogged) nodes insteady state. The number of successful (i.e., not collided) controlpackets destined to a given AWG output port in a given frameis expressed as
(3)
The probability that a given control packet corresponds to a longdata packet (either newly generated by an idle node, or retrans-mitted by a backlogged node) is denoted by; note that typically
since long data packets are more difficult to schedule andthus typically require more retransmissions than short packets.The analysis of the data packet scheduling results in
(4)
and
(5)
where accounts for the “packing” of the short packets intothe schedule and is given by a nonlinear function of the network

YANG et al.: A GENETIC ALGORITHM-BASED METHODOLOGY FOR OPTIMIZING MULTISERVICE CONVERGENCE IN A METRO WDM NETWORK 1119
and traffic parameters and. Finally, in equilibrium, the num-bers of serviced long and short packets are equal to the numbersof newly generated long and short packets, which, after somealgebraic manipulations, results in the equations
(6)
and
(7)
(7) is solved numerically and the obtainedis inserted in (2)to obtain , which in turn is used in (4) to obtain . Thesequantities are in turn used to obtainfrom (6), and finallyfrom (4) and from (5).
The mean packet delay is defined as the average time periodin slots from the generation of the control packet correspondingto a data packet until the transmission of the data packet. Theaverage delay in the network in slots is
(8)
C. Decision Variables and Constraints
We now identify the decision variables in our optimizationproblem and identify the constraints on the decision variables.We select the AWG degree as the (independent) decision vari-able for the network (hardware) architecture; we determine theother architecture parametersand (see Table I) as functionsof (and the given and ), as discussed shortly. Generally,the decision variable can take any integer satisfying
and (9)
where is the maximum number of wavelength channelsaccommodated by the fast tunable transceivers employed inthe considered network. In other words, is the maximumtuning range of the employed transceivers divided by thechannel spacing and is thus very technology dependent. [Touse transceivers with a negligible tuning time (and a smalltuning range) we set in our numerical investigations inSections III and IV.] We also note that the number of ports ofcommercially available photonic devices is typically a powerof two. We can easily incorporate this constraint by restricting
to the set .The number of used FSRs depends on the (independent)
decision variable and the given tuning range of the trans-ceivers. Generally, must be an integer satisfying ,i.e., . The larger , the more parallel channels areavailable between each input-output port pair of the AWG, andhence the larger the throughput. Therefore, we setto thelargest integer less than or equal to , i.e., . Wenote that the tuning range and degree are typically powersof two for commercial components. Hence, is a power oftwo for practical networks, and we may write . Thecombiner/splitter degree depends on the decision variableand the given number of nodes in the network. In determiningthe combiner/splitter degree, it is natural to assume that thenodes are equally distributed among theAWG input/outputports; i.e., each input/output port serves at least nodes.
This arrangement minimizes the required combiner/splitter de-gree , which in turn minimizes the splitting loss in the com-biners/splitters. Hence, we set .
We now turn to the protocol (software) parameters; seeTable I. We identify three decision variables; these are,and . Generally, the number of slots per framecan take anypositive integer, i.e., , while the number of control slotsper frame can take any positive integer less than or equal to,i.e., . (Note that in case , the length ofthe short packets degenerates to zero. In this case only largepackets contribute to the throughput; the objective functionsfor this case are given in [39].) We note that the size of thepackets to be transported may impose additional constraintson and . With a given maximum packet size, mustbe large enough to accommodate the maximum size packetin a frame. If short packets have a specific size requirement,
should be large enough to accommodate that packetsize. For our numerical work in Sections III and IV, we do notimpose packet size requirements. Instead, we let the geneticalgorithm determine the and values that give the optimalthroughput-delay performance, subject only to and
. The packet re-transmission probabilitymaytake any real number in the interval [ ]. To reasonably limitthe search space we restrictto [0, 0.05, 0.10, 0.15,…, 1.0] inour numerical work.
D. Network Cost Considerations
Minimizing the total network cost could be a third objective,in addition to the maximize throughput and minimize delay ob-jectives introduced in Section II-B. We note that the genetic al-gorithm methodology could accommodate the third objectivein a straightforward fashion, it would make the solution spacethree dimensional. Specifically, we would obtain an optimalthroughput-delay tradeoff plane for a given (acceptable) costlevel. We did not include network cost minimization in our op-timization model because we are primarily interested in uncov-ering the fundamental performance limitations and tradeoffs inthe metro WDM network. Network cost—while an importantconsideration—is typically not considered a fundamental per-formance metric for a network. In addition, network costs tendto be highly variable. The costs of the hardware components inthe considered network are expected to drop significantly oncethey are extensively mass produced.
Even though we did not include cost minimization in our op-timization model, we now briefly discuss the impact that thecost minimization objective would have on the problem and itssolution. Generally, the total network cost is the sum of capitalexpenditures (cost of network hardware and installation) and op-erational expenditures (cost of network management). With thecurrent component pricing structure, the hardware cost of thenetwork increases linearly with the AWG degree. This is be-cause i) there is typically a per-port charge for an AWG, and ii)the number of required EDFAs increases linearly with. (Thecost of the splitters/combiners is typically insignificant. Also,the number of transceivers depends only on the number of net-work nodes.) The cost of installation is roughly fixed (and in-dependent of the decision variables), as is the network manage-ment cost. Thus the total network cost is approximately a linear

1120 JOURNAL OF LIGHTWAVE TECHNOLOGY, VOL. 21, NO. 5, MAY 2003
Fig. 3. Illustration of Pareto-optimal solutions for maximize throughput-minimize delay problem.
function of the AWG degree . Since is typically a powerof two, the genetic algorithm methodology would give optimalthroughput-delay planes for each . This three di-mensional solution gives the best throughput-delay tradeoff fora given acceptable cost level.
III. GENETIC ALGORITHM BASED METHODOLOGY
In this section we discuss the difficulties in optimizing themultiple objectives of maximizing throughput while minimizingdelay. We point out why we base our solution methodology ongenetic algorithms. We describe our genetic algorithm solutionapproach to the multi-objective optimization problem formu-lated in the previous section and evaluate the performance ofour approach.
A. Why Evolutionary Algorithm (Genetic Algorithm)?
The familiar notion of an optimal solution becomes some-what vague when a problem has more than one objective func-tion, as is the case in our metro WDM network optimization.A solution (i.e., set of decision variables, , , and ) thatgives very large throughput may also give large delay and thusrate poorly on the minimize delay objective. The best we cando is to find a set of optimal tradeoff solutions, i.e., solutionsthat give the largest achievable throughput for a given toler-able delay, or equivalently the smallest achievable delay for arequired throughput level. After a set of such optimal tradeoffsolutions is found, a user can then use higher-level considera-tions, such as the traffic patterns illustrated in Fig. 1, to makea choice. A feasible solution to a multi-objective optimizationproblem is referred to asefficient pointor Pareto-optimalsolu-tion [40]. As illustrated in Figs. 3 and 4, we have two objec-tives—maximizing throughput, and minimizing delay. The re-gion which is shaded in light gray is said to bedominatedby thepoint . All points in the region, e.g., and have larger delayand smaller throughput than the point. Clearly, the point issuperior to the points and . Thus all points in the light gray
Fig. 4. Illustration of efficient frontier for maximize throughput-minimizedelay problem.
rectangle are dominated by point. All points in the dark grayrectangle, e.g., the point , are said todominatethe point .Since all points in the dark gray rectangle have larger throughputand smaller delay than . The point is superior to the point
. Based on the concept of Pareto dominance, the optimalitycriterion for multi-objective problems can be introduced. Con-sider the points , , , and . These points are uniqueamong all the points in the plot in that each of them is not domi-nated by any other point. The set of these solutions is termed asPareto-Optimalsolution set orEfficient Frontier. The efficientfrontier corresponding to Fig. 3 is shown in Fig. 4.
The goal of multi-objective optimization is to find such afeasible efficient frontier. Classical methods for generatingthe Pareto-optimal solution set aggregate the objectives into asingle, parameterized objective function. The parameters of thisfunction are not set by the decision maker, but systematicallyvaried by the optimizer [41]. In contrast to classical searchand optimization algorithms, evolutionary algorithms use apopulationof solutions in each iteration, instead of a singlesolution. Since a population of solutions is processed in eachiteration, the outcome of an evolutionary algorithm is also apopulation of solutions for the conflicting objective functions.These multiple optimal solutions can be used to capturemultiple efficient points of the problem [40].
We now proceed to develop a methodology for efficientlyfinding the Pareto-optimal solutions (optimal tradeoff curve) ofthe multi-objective problem of maximizing throughput whileminimizing delay in single-hop WDM networks. Our solutionmethodology is based on genetic algorithms, which are mem-bers of the family of evolutionary algorithms.
B. Basic Operation of Genetic Algorithm
The basic structure of a genetic algorithm is illustrated inFig. 5. In the genetic algorithm, we consider a population of in-dividuals. Each individual is represented by a string of the deci-sion variables, i.e., , , , and (as well as the correspondingobjective function values andDelay). In the terminology of

YANG et al.: A GENETIC ALGORITHM-BASED METHODOLOGY FOR OPTIMIZING MULTISERVICE CONVERGENCE IN A METRO WDM NETWORK 1121
Fig. 5. Basic structure of a genetic algorithm.
genetic algorithms the string of decision variables is referred toaschromosome, while each individual decision variable is re-ferred to asgene. The quality of an individual in the populationwith respect to the two objective functions is represented by ascalar value, calledfitness. After generating the initial popula-tion (by randomly drawing the decision variables for each in-dividual from uniform distributions over the respective rangesof the decision variables), each individual is assigned a fitnessvalue. The population is evolved repeatedly, generation by gen-eration, using the crossover operation and the mutation opera-tion. The crossover and mutation operations produce offspringby manipulating the individuals in the current population thathave good fitness values. The crossover operation swaps por-tions of the chromosomes. The mutation operation changes thevalue of a gene. Individuals with a better fitness value are morelikely to survive and to participate in the crossover (mating) op-eration. After a number of generations, the population containsmembers with better fitness values. The Pareto-optimal individ-uals in the final population are the outcome of the genetic al-gorithm. Each operation is discussed in detail in the followingsubsections.
C. Fitness Function
The fitness function is typically a combination of objectivefunctions. We evaluate three commonly used types of fitnessfunction. We generate generations, each with a popula-tion size of to compare the quality of the fitness func-tions. We set the probability of crossover to 0.9 and the prob-ability of mutation to 0.05, which are typical values. We com-pare the genetic algorithm outputs with the true Pareto-optimalsolutions which were found by conducting an exhaustive searchover all possible combinations of the decision variables. We fix
and for this evaluation. All results presentedin this paper assume a channel spacing of 200 GHz, i.e., 1.6 nmat 1.55 m. Thus, we can use 7–10 wavelengths at each AWG
input port with fast tunable transceivers with a tuning range of10–15 nm [29]. For all subsequent results, the number of wave-lengths is fixed at eight, i.e., . can take the values 2,4, and 8. Thus, the correspondingvalues are 4, 2, and 1. Wefix the number of nodes in the network at . To rea-sonably limit the search space of the genetic algorithm, we re-strict to be smaller than 400 slots in this paper. We note thatwith a large , the considered network generally achieves largerthroughput values (at large delays), however, the computationaleffort for evaluating a given parameter combination increases as
increases. For the exhaustive search, we therefore limittovalues less than or equal to 200 slots.
First, we evaluate the Vector Evaluated Genetic Algorithm(VEGA), which is easy to implement. The VEGA algorithm di-vides the population into two subpopulations according to ourtwo objective functions. The individuals in each subpopulationare assigned a fitness value based on the corresponding objec-tive function. When using only one objective function to deter-mine the fitness values of the individuals in a subpopulation, itis likely that solutions near the optimum of an individual ob-jective function are preferred by the selection operator. Suchpreferences take place in parallel with other objective functionsin different subpopulations. The main disadvantage of VEGAis that typically after several generations, the algorithm fails tosustain diversity among the Pareto-optimal solutions and con-verges near one of the individual solutions. Indeed, as reportedin Table II, the VEGA finds only 15 Pareto-optimal solutions;the efficient frontier spanned by these solutions is plotted inFig. 6. We observe, however, that the VEGA efficient frontieris overall quite close to the true efficient frontier (found by ex-haustive search).
Next, we evaluate the Weight Based Genetic Algorithm(WBGA) which uses the weighted sum of the objective func-tions as fitness function. The main difficulty in WBGA is thatit is hard to choose the weight factors. We use the same weightfactor of 1/2 for each objective function. Since the mean delay

1122 JOURNAL OF LIGHTWAVE TECHNOLOGY, VOL. 21, NO. 5, MAY 2003
TABLE IINUMBER OF PARETO-OPTIMAL SOLUTIONS IN FINAL POPULATION FOR
GENETIC ALGORITHM BASED SEARCH WITH F � 400; EXHAUSTIVE SEARCH
FORF � 200 GIVES 580 PARETO-OPTIMAL SOLUTIONS
Fig. 6. Efficient frontiers obtained with different fitness functions withoutelitism forF � 400 and with exhaustive search forF � 200.
should be minimized in our problem, we use the negative delayas the second objective function. The fitness function used is
(10)
Our goal is to maximize the average throughput while mini-mizing the mean delay. Thus, with the WBGA approach, thelarger the fitness value, the better. We observe from the resultsgiven in Fig. 6 and Table II that the WBGA finds more Pareto-optimal solutions than VEGA. However, the WBGA efficientfrontier has parts (particularly in the throughput range from7–13 packets/frame) that are distant from the true efficient fron-tier. We note that the average network delay given in (8) in unitsof slots is on the order of thousands of slots in typical scenarios,whereas the average throughput is typically on the order of oneto 16 packets per frame. To achieve a fair weighing of boththroughput and delay in the fitness function, we use the delayin unit of cycles (where one cycle corresponds to slots)in the evaluation of the fitness in (10) (and the following fitnessdefinition in (11)); with this scaling, the delay is on the order of1 to 20 cycles in typical scenarios.
Finally, we evaluate the Random Weight Genetic Algorithm(RWGA) which weighs the objective functions randomly. Anew independent random set of weights is drawn each time anindividual’s fitness is calculated. We use the fitness function
(11)
where is uniformly distributed in the interval (0, 1). We ob-serve from Fig. 6 that the RWGA efficient frontier is relatively
Fig. 7. Efficient frontiers obtained with different fitness functions withoutelitism forF � 400 and with exhaustive search forF � 200.
far from the true efficient frontier in the throughput range from8–10 packets/frame. Also, the RWGA finds only a relativelysmall number of Pareto-optimal solutions.
We now study the concept ofelitism. Elitism is one of theschemes used to improve the search; with elitism the good so-lutions in a given generation are kept for the next generation.This prevents losing the already found good solutions in thesubsequent crossover operation(s), which may turn good so-lutions into bad solutions. For each generation we determinethe Pareto-optimal solutions by comparing the throughput anddelay achieved by the individuals in that generation. (Note thatthe thus determined Pareto-optimal solutions are not necessarilythe true Pareto-optimal solutions to the optimization problem,rather they are Pareto-optimal with respect to the other individ-uals in the considered generation.) The determined Pareto-op-timal solutions are kept for the next generation; they are not sub-jected to the crossover operation, they are, however, subjectedto the mutation operation (as explained in Sections III-E andIII-F ). If we find that a Pareto-optimal solution from a previousgeneration is no longer Pareto-optimal solution in a new gener-ation, i.e., it is dominated by some other individual in the newgeneration, then this old Pareto-optimal solution is discarded.
The results obtained with elitism are given in Fig. 7 andTable II. We observe that the number of Pareto-optimal so-lutions in the final population is dramatically larger and theefficient frontiers are closer to the true efficient frontier of theproblem. From Fig. 7, it appears that all schemes with elitismperform quite well, with RWGA hugging the true efficientfrontier most closely. This observation is corroborated bycomparing the number of Pareto-optimal solutions in the finalpopulation in Table II, which indicates that RWGA gives thebest performance. According to the observations made in thissection, we use RWGA with elitism throughout the remainderof this paper.
D. Population Size and Number of Generations
The population size trades off the time complexity (computa-tional effort) and the number of optimal solutions. In order to ac-

YANG et al.: A GENETIC ALGORITHM-BASED METHODOLOGY FOR OPTIMIZING MULTISERVICE CONVERGENCE IN A METRO WDM NETWORK 1123
commodate all Pareto-optimal solutions, the population shouldbe large enough. However, as the population size grows, the timecomplexity for processing a generation increases (whereby themost computational effort is typically expended on evaluatingthe throughput and delay achieved by an individual to determineits fitness value). On the other hand, for a smaller population,the time complexity for the population decreases while the pop-ulation may lose some Pareto-optimal solutions. As a result, thesmallest population size which can accommodate all Pareto-op-timal solutions is preferable.
For schemes that employ elitism, we categorize the popu-lation in generation into three groups: i) Theelite groupofsize which contains the Pareto-optimal solutions from thepreceding generation , ii) the reproduction groupof size
which is reproduced from the individuals with good fit-ness values in the preceding generation through crossover(see Section III-E), and iii) therandom groupof sizewhich is generated randomly (by drawing the decision vari-ables from uniform distributions over their respective ranges).The random group is required to prevent the algorithm fromgetting stuck in local optima. The population size should ac-commodate these three groups appropriately. Furthermore, thesize of the reproduction group and the random group need tobe carefully considered. If the reproduction group is too large,the solution may get stuck in a local optimum. If the size ofthe random group is too large, we may spend most of the timecalculating the fitness values of solutions that are very distantfrom the efficient frontier. However, the population size shouldat least be larger than the elite group. To find the proper pop-ulation size, we evaluate the adopted RWGA with elitism forthe population sizes , 200, and 300. We initially setthe size of the reproduction group to one half of the populationsize, i.e., . Once the number of Pareto-optimal so-lutions in a generation exceeds , i.e., ,we set the size of the reproduction group toin the next generation. Thus .If the number of Pareto-optimal solutions in a generationis less than , we set the size of the random group to
in the next generation, otherwisewe set ; i.e., .Thus, the more Pareto-optimal solutions there are in the pre-ceding generation, the fewer randomly generated individuals arein the next generation. (If the number of Pareto-optimal solu-tions in a generation exceeds , the succeeding generationdoes not contain randomly generated individuals.) For the fol-lowing evaluation, the parameters, , , and the ranges of ,
, , and are set as given in Section II-C. For comparison,we set the number of generations to , 15, and 10, re-spectively. Thus, the total number of considered individuals is
in all cases. The results are shown in Fig. 8.We observe from Fig. 8 that all three efficient frontiers hug thetrue Pareto-optimal frontier quite closely, with all three curveshaving “humps” around a throughput of 14 packets/frame. Thenumber of Pareto-optimal solutions obtained for the populationsizes , 200, and 300 are 87, 104 and 70, respectively.The population size of does not perform very wellin our network optimization because it typically cannot accom-modate all the Pareto-optimal solutions. This is because the elite
Fig. 8. Efficient frontiers for different population sizesP with P �G = 3000,fixed.
Fig. 9. Efficient frontiers for different initial sizesP of the reproductiongroup (Population sizeP = 200, fixed).
group takes up almost two thirds of the population. With a popu-lation size of (and only generations to ensure afair comparison) the evolution of the generations does not settledown as much as for 20 and 15 generations and therefore givesonly 70 Pareto-optimal solutions (although the efficient frontierhas a relatively small “hump”). Overall, we conclude that allthree considered population sizes give fairly good results. Wechoose for the following experiments in this paper as itappears to accommodate all three population groups in a properfashion. In Fig. 9 we plot the efficient frontiers obtained withdifferent initial sizes and 100 of the reproductiongroup (with , fixed). The number of Pareto-optimal so-lutions for and 100, are 85 and 115, respectively. Weobserve from Fig. 9 that both efficient frontiers are quite closeto the true Pareto-optimal frontier. We set for allthe following experiments in this paper.
We now investigate the impact of the number of generations. In Fig. 10, we plot the size of the elite group as a

1124 JOURNAL OF LIGHTWAVE TECHNOLOGY, VOL. 21, NO. 5, MAY 2003
Fig. 10. Size of elite groupP (t) as a function of generation countert.
Fig. 11. Sum of fitness values of individuals in elite group as a function of thegeneration countert.
function of the generation counter. Recall that is de-fined as the number of Pareto-optimal solutions in generation
; thus is the number of Pareto-optimal solutions inthe initial generation . In Fig. 11, we plot the sum of the fit-ness values of the individuals in the elite group as a func-tion of the generation counter. We observe from Fig. 10 that thenumber of Pareto-optimal solutions in a generation first steadilyincreases and then settles on a fixed value as the generationsevolve. (The slight drop around the fifteenth generation is be-cause we found a Pareto-optimal solution which dominates sev-eral earlier Pareto-optimal solutions.) We observe from Fig. 11that the sum of the fitness values of the Pareto-optimal solu-tions in a generation first increases quickly, then fluctuates, andfinally settles down as the generations evolve. This behavior istypical for genetic algorithm based optimization and is due tothe random nature of the evolution of the population. To allowfor the evolution to settle down sufficiently, we set the totalnumber of generations to . According to the decisionsmade in this section, we set the population size to ,the number of generations to , and the initial size of thereproduction group to .
E. Crossover Operation
The crossover operation swaps parts of the chromosomes ofthe fittest individuals in the current generation to produce off-spring with large fitness values for the reproduction group inthe next generation. In our crossover operation the individualsin the generation are sorted in decreasing order of theirfitness values (whereby the individuals from all three groups,i.e., elite group, reproduction group, and random group, are con-sidered). A mating pool is formed from the first individ-uals in the ordering. Parts of the chromosomes of the individualsin the mating pool are then exchanged (swapped) with a fixedcrossover probability. We chose to swap theirvalues becausewe have observed that (with , , and fixed) tends to ex-plore potential solutions in the vicinity of the parents (as is alsoevidenced by the tables in the Appendix, which are discussedin detail in Section IV). More specifically, the first indi-viduals in the ordering, i.e., the mating pool, are processed asfollows. We take the first two individuals in the ordering. Withthe crossover probability (which we fix at the typical value 0.9),we swap their values, i.e., we put the value of the first in-dividual (in the ordering) in place of the value of the secondindividual, and vice versa. The other three decision values,,
, and , in the individuals’ chromosomes remain unchanged.(Note that in our problem the swapping of while keeping ,
, and in place may result in a chromosome that violates theconstraint . If this situation arises, we discard the vio-lating value and randomly draw a new from a uniformdistribution over [1, ].) With the complementary crossoverprobability (0.1), the chromosomes of the two individuals re-main unchanged. The two individuals (irrespective of whethertheir chromosomes were swapped or not) then become mem-bers of the reproduction group in the next generation. We thenmove on to the third and fourth individuals in the ordering, andswap their values with probability 0.9, move them to the re-production group in the next generation, and so on. We notethat the elite group of the next generation is formed from thePareto-optimal individuals in the current generation, irrespec-tive of whether these individuals are in the mating pool of thecurrent generation. (An individual may appear twice in the nextgeneration if it is Pareto-optimal in the current generation andparticipates in the crossover operation without having thevalue changed. Only one copy of such a “duplicate” individualis processed in the next generation, the other copy is discarded.)
F. Mutation Operation
The mutation operation keeps diversity in the population bychanging small parts in the individuals’ chromosomes with agiven (typically small) mutation probability. We mutate eachindividual in the elite group, the reproduction group and therandom group with a mutation probability of 0.05 (a typicalvalue). The mutation is typically performed by flipping a bit inthe binary representation of the individual’s chromosome. Thelocation of the bit is typically drawn from a uniform distributionover the length of the chromosome. We chose not to use bitwisemutation because bitwise mutation would frequently produceoffspring that are distant from the parents. Instead, we imple-ment the mutation operation by randomly drawing anvalue

YANG et al.: A GENETIC ALGORITHM-BASED METHODOLOGY FOR OPTIMIZING MULTISERVICE CONVERGENCE IN A METRO WDM NETWORK 1125
TABLE IIINUMBER OF PARETO-OPTIMAL SOLUTIONS WITH D = 2, 4, AND 8
from a uniform distribution over [1, ]. This operation does notresult in constraint violations, yet tends to keep the populationsufficiently diverse.
After the mutation operation, we evaluate the averagethroughput and mean delay achieved by the individuals (in allthree groups, i.e., elite group, reproduction group, and randomgroup) in the new generation and start the next evolution cycle;as illustrated in Fig. 5. In this new evolution cycle, we selectagain the individuals with the largest fitness values for thecrossover operation, which gives the reproduction group of thenext generation. We also determine again the Pareto-optimalindividuals to form the elite group in the next generation.
IV. NUMERICAL RESULTS
In this section, we employ the genetic algorithm basedmethodology developed in the preceding section to optimizethe AWG-based single-hop WDM network. We determinethe settings of the network architecture parameterand theprotocol parameters , , and that give Pareto-optimalthroughput-delay performance. We use the random weightgenetic algorithm (RWGA) with elitism with the parametersettings found in the preceding Section, ie., a population size of
, generations, crossover probability 0.9, andmutation probability 0.05. Data packets can have one of twolengths. A data packet is slots long with probability , and
slots long with probability ( ). To reasonablylimit the search space we restrict to be no larger than 400slots. The number of nodes in the network is set toand the transceiver tuning range is fixed at wavelengths.
In the first set of optimizations, we determine the Pareto-optimal performance for different (but fixed) combinations oftraffic load and fraction of long packet traffic. Specifically,we optimize the network for a light traffic scenario with
, a medium traffic scenario with , and heavy loadscenarios with and . For each traffic load level,we consider the fractions , 0.5, and 0.9 of long packettraffic. In these optimizations we determine the free decisionvariables , , , and that give the Pareto-optimal solutions.
To put the optimizations for fixed and in perspective,we also conduct an optimization where the traffic loadandthe fraction of long packet traffic are free decision variables(in addition to , , , and ). This optimization givesthe best achievable network performance, which we refer toas network frontier. Loosely speaking, the network frontiergives the Pareto-optimal performance when the network is“fed optimally” with traffic. (To find the network frontier, weexchange (swap) as well as in the crossover operationand use a population size of rather than toaccommodate the larger chromosome.) Some detailed solutionsfor the network frontier are given in Table IV in the Appendix.
Fig. 12. Efficient frontiers for light traffic load� = 0:1 for different fractionsq of long packet traffic and network frontier (with� and q as free decisionvariables).
Due to space constraints, we present throughout only a fewrepresentative individual solution in this paper. We refer theinterested reader to [39] for the full table listings which have asmany rows as there are Pareto-optimal solutions.
A. Pareto-Optimal Performance for Light Traffic Load
Fig. 12 shows the Pareto-optimal throughput-delay frontierfor a light traffic load of for , 0.5, and 0.9(along with the network frontier). Table V and Table VI in theAppendix give some representative individual Pareto-optimalsolutions. The numbers of Pareto-optimal solutions with each
, 4, and 8 are shown in Table III. We observe from Fig. 12that for a small fraction of long packets the network is able toachieve relatively small delays (of less than 1500 slots) evenfor large throughputs (of 8 packets/frame and more). When thefraction of long packet traffic is large, however, the smallestachievable delays become very large (up to 2250 slots) for largethroughputs. This is because the considered network allows forthe scheduling of at most long packets in a cycle(consisting of frames) at each of the AWG input ports.(There are also transmission slots exclusively forshort packets in a cycle at each AWG input port; in addition shortpackets can fill up the long packet transmission slots.) Witha larger fraction of long packets, the probability increases that adata packet fails in the scheduling and requires re-transmissionof the corresponding control packet, resulting in larger delays.
We also observe that the light traffic scenario is able toachieve the small delay (and small throughput) part of thenetwork frontier. This is because a small numberof controlslots is sufficient to ensure reasonably large success probabili-ties in the control packets contention when the probabilityofan idle node generating a new packet at the beginning of a cycle

1126 JOURNAL OF LIGHTWAVE TECHNOLOGY, VOL. 21, NO. 5, MAY 2003
is small. The small in turn allows for small frame length ,and thus short cycle length , which results in small delays.
We observe that there are some instances where the Pareto-optimal frontier for dominates the network frontier, e.g.,around a throughput of 7.7 packets/frame. This is due to the sto-chastic nature of the genetic algorithm, which finds a very closeapproximation of the true optimal frontier in a computationallyefficient manner. By definition, the true network frontier cannotbe dominated by the true frontier for a fixedor ; finding thesetrue frontiers, however, is computationally prohibitive.
We observe from Tables III, V, and VI that for the consideredlight traffic load , most of the Pareto-optimal solutionshave . However, for a larger fraction of long packettraffic the number of Pareto-optimal solutions withincreases. We observe from the Table VI that is thebest choice to achieve low delay service. This is because thelong packets are more difficult to schedule and therefore tendto require more re-transmissions of control packets, resultingin increased mean delay. Recall that a control packet is dis-carded if the corresponding data packet cannot be scheduled.This makes the control packet contention a bottleneck when thepacket scheduling becomes difficult. With larger, fewer nodes
contend for the control slots available to themevery th frame. This increases the probability of successfulcontrol slot contention, thus relieving the control packet con-tention bottleneck. Note that the control packet contention bot-tleneck could also be relieved by reducing the re-transmissionprobability . However, we see from the results in Table VI thatthis strategy is not selected (except in the 9th row of Table VIwhen the transition from to occurs). The reasonfor this is that the smaller would result in a relative large in-crease in the mean delay, making it preferable to increaseandkeep large (the first eight rows of Table VI).
Generally, we observe from Table V and Table VI that thePareto-optimal solutions with larger throughput are achieved forlarger . The Pareto-optimal values, on the other hand, re-main in the range 30–60 for and and are typ-ically 30–80 for , even for very large . Upon closeinspection we discover an interesting underlying trend in theand solutions as we move along the efficient frontier fromsmall to large throughput values. The frame lengthtypicallymakes a jump to a new value (e.g., from to 59 in thefourth row of Table V) and stays around the new value for a fewsolutions. For (almost) fixed, several distinct Pareto-optimalsolutions are obtained for decreasingvalues (fromto 30 for around 59 in Table V). Once makes a jump (tovalues around 100 in line 20), is reset to a larger value (of 50in line 20). The explanation of this behavior is as follows. Forlarge , the probability of successful control packet contentionis large, and the probability of control packet re-transmissionis small, giving small delays. However, for large, the length
of a short packet is small, resulting in a smallcontribution of a short packet to the throughput (1). Now asdecreases (for fixed), control packet re-transmission becomesmore likely, increasing the mean delay, while the contribution ofa short packet to the throughput increases. We also observe fromthe tables that for optimal network operation the re-transmissionprobability should be in the range from 0.75 to 1.0.
Fig. 13. Efficient frontiers for medium traffic load� = 0:3 for differentfractionsq of long packet traffic and network frontier (with� andq as freedecision variables).
B. Pareto-Optimal Performance for Medium Traffic Load
Fig. 13 shows the Pareto-optimal solutions for a mediumtraffic load of . The numbers of Pareto-optimalsolutions with , 4, and 8 are shown in Table III andsamples of the individual Pareto-optimal solutions are givenin Tables VII–IX in the Appendix. We observe from Fig. 13that the differences in performance for the different fractions
of long packet traffic are more pronounced for the largertraffic load , compared to the light traffic loadshown in Fig. 12. For , the efficient frontiers for
and roughly overlap and give both a smallestachievable delay of roughly 715 slots for a throughput of 8packets/frame. For , on the other hand, the efficientfrontier for clearly dominates, giving a smallestachievable delay of roughly 555 slots for a throughput of 8packets/frame, whereas the corresponding smallest achievabledelay for is more than twice as large. This increasinggap in performance is again due to the fact that long packetsare more difficult to schedule and thus tend to cause largerdelays. The smaller delay of 555 slots for , comparedto 715 slots for is achievable because with the larger
, the throughput level of eight transmitting nodes per slot isreached with smaller sized packets (i.e., smallerand smaller
), thus reducing the cycle length and in turn thedelay. We observe from Tables VII–IX that small delays areagain achieved for large values. For and ,the first few Pareto-optimal solutions at the top of the tableshave , then is optimal as we go down the tablesto larger delays. As in the case of , this behavior is dueto the control packet contention and data packet schedulingbottlenecks. From Table III we observe that there is no cleartrend in the number of solutions with and . Thisappears to be due to the stochastic nature of the genetic algo-rithm approach, which finds a large total number of solutionsfor , with many solutions being tightly spaced in theregion where is optimal. As before, larger throughputis optimally achieved for large . The optimal settings of

YANG et al.: A GENETIC ALGORITHM-BASED METHODOLOGY FOR OPTIMIZING MULTISERVICE CONVERGENCE IN A METRO WDM NETWORK 1127
Fig. 14. Efficient frontiers for heavy traffic load� = 0:6 for differentfractionsq of long packet traffic and network frontier (with� andq as freedecision variables).
Fig. 15. Efficient frontiers for heavy traffic load� = 0:8 for differentfractionsq of long packet traffic and network frontier (with� andq as freedecision variables).
are typically in the range from 60–80. The optimal settings ofare mostly 0.95 for and . For , the
optimal settings are typically 0.7. This smallersetting for amedium load of predominantly long packet traffic is better asit somewhat abates the control packet contention bottleneck atthe expenses of slightly larger delays, as discussed above.
C. Pareto-Optimal Performance for Heavy Traffic Load
Figs. 14 and 15 show the Pareto-optimal solutions for a heavytraffic load of and , respectively. The numberof Pareto-optimal solutions with and 8 are given inTable III. The complete parameter vectors corresponding to thePareto-optimal solutions are given in Tables X–XII. We observefrom the figures and the tables that both considered heavy loadscenarios give similar results with the , sce-nario attaining the larger throughput region of the network fron-tier. We notice that with an increasing fractionof long packet
Fig. 16. Percentage of Pareto-optimal solutions withD = 2, 4, and 8 as afunction of the traffic load� (fraction of long packet trafficq = 0:1).
Fig. 17. Percentage of Pareto-optimal solutions withD = 2, 4, and 8 as afunction of the traffic load� (fraction of long packet trafficq = 0:9).
traffic, the number of Pareto-optimal solutions with in-creases, while the number of solutions with decreases.There are two primary effects at work here. On the one hand, alarger allows for a larger throughput. To see this, note thatthe considered network allows for the scheduling of at most
long packets at each of the AWG input portswithin one cycle (consisting of frames); for a total of at most
scheduled long packets per cycle in the entire net-work. The network also allows for the scheduling of at most
short packets at each of theAWG input ports withinone cycle; for a total of at most sched-uled short packets per cycle in the network (in addition shortpackets may take up long packet transmission slots). Thus, fora larger the network allows for the scheduling of more shortpackets and thus for an overall larger throughput; this is a resultof the spatial reuse of all wavelengths at all AWG ports.
On the other hand, a larger increases the delay in the net-work (provided the frame length is constant). This is becausea larger cycle length increases the delay incurred by the
1128 JOURNAL OF LIGHTWAVE TECHNOLOGY, VOL. 21, NO. 5, MAY 2003
(a) (b)
(c) (d)
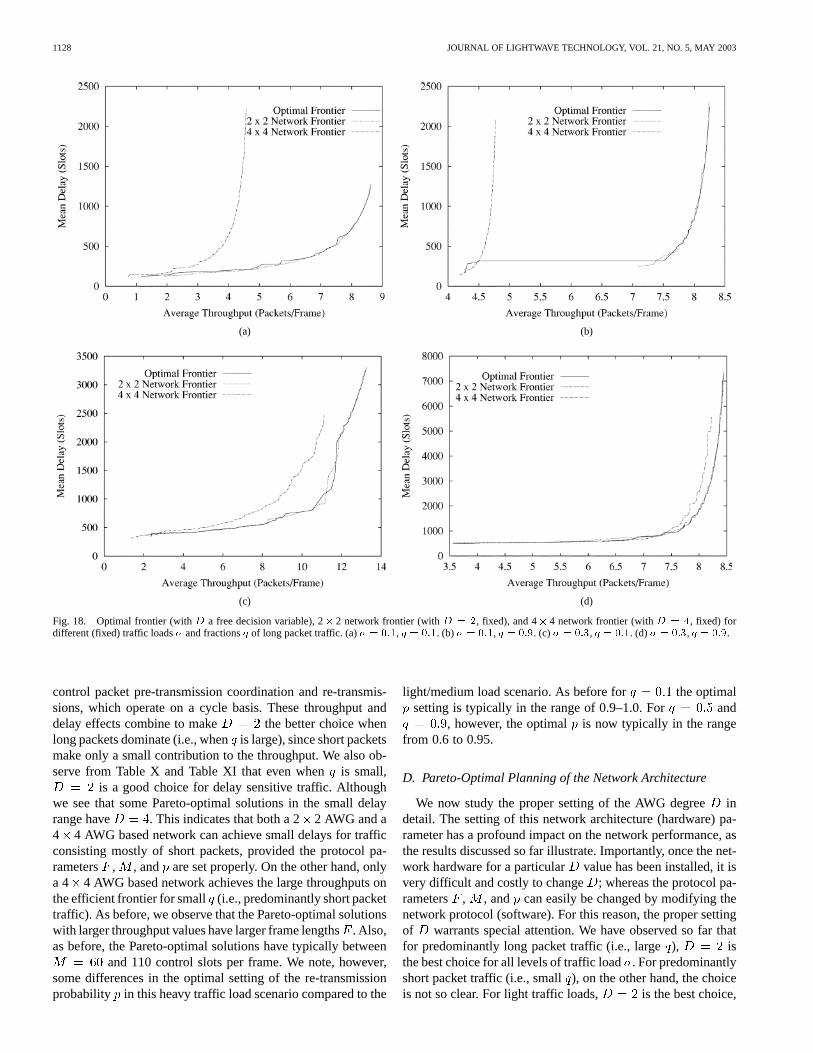
Fig. 18. Optimal frontier (withD a free decision variable), 2� 2 network frontier (withD = 2, fixed), and 4� 4 network frontier (withD = 4, fixed) fordifferent (fixed) traffic loads� and fractionsq of long packet traffic. (a)� = 0:1, q = 0:1. (b)� = 0:1, q = 0:9. (c)� = 0:3, q = 0:1. (d)� = 0:3, q = 0:9.
control packet pre-transmission coordination and re-transmis-sions, which operate on a cycle basis. These throughput anddelay effects combine to make the better choice whenlong packets dominate (i.e., whenis large), since short packetsmake only a small contribution to the throughput. We also ob-serve from Table X and Table XI that even whenis small,
is a good choice for delay sensitive traffic. Althoughwe see that some Pareto-optimal solutions in the small delayrange have . This indicates that both a 22 AWG and a4 4 AWG based network can achieve small delays for trafficconsisting mostly of short packets, provided the protocol pa-rameters , , and are set properly. On the other hand, onlya 4 4 AWG based network achieves the large throughputs onthe efficient frontier for small (i.e., predominantly short packettraffic). As before, we observe that the Pareto-optimal solutionswith larger throughput values have larger frame lengths. Also,as before, the Pareto-optimal solutions have typically between
and 110 control slots per frame. We note, however,some differences in the optimal setting of the re-transmissionprobability in this heavy traffic load scenario compared to the
light/medium load scenario. As before for the optimalsetting is typically in the range of 0.9–1.0. For and
, however, the optimal is now typically in the rangefrom 0.6 to 0.95.
D. Pareto-Optimal Planning of the Network Architecture
We now study the proper setting of the AWG degreeindetail. The setting of this network architecture (hardware) pa-rameter has a profound impact on the network performance, asthe results discussed so far illustrate. Importantly, once the net-work hardware for a particular value has been installed, it isvery difficult and costly to change ; whereas the protocol pa-rameters , , and can easily be changed by modifying thenetwork protocol (software). For this reason, the proper settingof warrants special attention. We have observed so far thatfor predominantly long packet traffic (i.e., large), isthe best choice for all levels of traffic load. For predominantlyshort packet traffic (i.e., small), on the other hand, the choiceis not so clear. For light traffic loads, is the best choice,

YANG et al.: A GENETIC ALGORITHM-BASED METHODOLOGY FOR OPTIMIZING MULTISERVICE CONVERGENCE IN A METRO WDM NETWORK 1129
(e) (f)
(g) (h)
Fig. 18. (Continued.) Optimal frontier (withD a free decision variable), 2� 2 network frontier (withD = 2, fixed), and 4� 4 network frontier (withD = 4,fixed) for different (fixed) traffic loads� and fractionsq of long packet traffic. (e)� = 0:6, q = 0:1. (f) � = 0:6, q = 0:9. (g)� = 0:8, q = 0:1. (h)� = 0:8,q = 0:9.
whereas for heavy traffic loads, turns out to be the bestchoice.
To explore the optimal setting of as a function of thetraffic load , we plot in Figs. 16 and 17 the percentage ofPareto-optimal solutions with , 4, and 8 forand , respectively. We observe from Fig. 16 that for
less than 0.4, most Pareto-optimal solutions have ,whereas for larger than 0.4, most Pareto-optimal solutionshave . The explanation of this behavior is as follows.For light traffic loads, is preferred as it achieves smallerdelays while at the same time providing sufficient resources forcontrol packet contention and data packet scheduling. (Recallthat nodes at an AWG input port content for the
control slots available to them in one frame (out of theframes in a cycle), and that spatial wavelength reuse providesfor transmission slots for short packets.) As thetraffic load increases, however, the control packets contentionand data packet scheduling become increasingly bottleneckswhich are relieved for larger .
E. Pareto-Optimal MAC Protocol Tuning (Network Operation)for Fixed Network Architecture
Next, we fix the AWG degree at and ,and allow only the protocol parameters, , and to vary(i.e., only , , and are decision variables, is fixed). Weemploy our genetic algorithm based methodology to obtain thePareto-optimal throughput-delay frontiers in these settings; werefer to these efficient frontiers as the22 network frontierandthe 4 4 network frontier, respectively. We compare the thusobtained efficient frontiers with the efficient frontier obtainedwhen both the hardware parameterand the software param-eters , , and are decision variables, which we refer to asoptimal frontier. We compare the 2 2 frontier and the 4 4frontier with the optimal frontier in Fig. 18(a)–(h). Samples ofthe corresponding Pareto-optimal solutions for the combination
, are tabulated in Table XIII and Table XIV.We refer the interested reader to [39] for the other tables, whichwe cannot include here because of space constraints. A number

1130 JOURNAL OF LIGHTWAVE TECHNOLOGY, VOL. 21, NO. 5, MAY 2003
of observations are in order. First, as expected the 22 fron-tier approximately coincides with the optimal frontier for lightto medium loads of predominantly short packet traffic, and allload levels of predominantly long packet traffic. For heavy loadsof predominantly short packet traffic, on the other hand, the4 4 network frontier achieves the optimal frontier, as we ex-pect from our earlier results. We also observe that there aresome instances where the optimal frontier is dominated by the2 2 network frontier or the 4 4 network frontier, e.g., inFig. 18(c) around a throughput of 11.5 packets/frame. These in-stances are again due to the stochastic nature of the employedgenetic algorithms. By definition, the 22 network frontierand the 4 4 network frontier cannot dominate the true op-timal frontier, which however could only be found by a compu-tationally prohibitive exhaustive search. The genetic algorithmmethodology finds a very close approximation of the true op-timal frontier in a computationally efficient manner.
Fig. 18(a)–(h) give also a number of surprising results, whichwe would not expect, based on our earlier observations. First, the4 4 network is able to come close to the optimal frontier formedium and heavy loads of predominantly long packet traffic,which is a surprise given the results in Table III and Fig. 17. The4 4 network achieves this by properly tuning its three protocolparameters, and , as detailed in the corresponding ta-bles in [39]. Overall, the 4 4 network shows some flexibilityin achieving good performance close to the optimal frontier formedium to heavy loads of both short and long packet traffic byproperly tuning the protocol parameters (in software). For lighttraffic loads, however, the 4 4 network is not able to comeclose to the optimal frontier. The 22 network, on the otherhand, appears to be more flexible than the 44 network. Byproperly tuning its protocol parameters, the 22 network isable to come fairly close to the optimal frontier even for heavyloads of short packet traffic [see Fig. 18(e) and (g)]. Overall,our results indicate that the 22 network is the best choice forachieving efficient multi-service convergence in a metro WDMnetwork. The 2 2 network frontier approximately coincideswith the optimal frontier for all load levels of long packet trafficand for light to medium loads of short packet traffic. For heavyloads of short packet traffic, the 44 network attains the op-timal frontier. But the 2 2 network is able to come fairly closeto the optimal frontier, simply by adjusting its protocol param-eters in software.
V. CONCLUSION
We have developed a genetic algorithm based methodologyfor the multi-objective optimization problem of maximizingthroughput while minimizing delay in an AWG-based metroWDM network. Our methodology finds the Pareto-optimalthroughput-delay tradeoff curve in a computationally efficientmanner. The optimal tradeoff curve can be used to opti-mally provide varying degrees of small delay (and moderate
throughput) or large throughput (and moderate delay) packettransport services. Our methodology thus facilitates efficientmulti-service convergence for increased cost-effectiveness inmetropolitan and local area networks.
Specifically, for the AWG based network considered as anexample throughout this paper, we find that a network basedon a 2 2 AWG is most flexible in efficiently providing dif-ferent transport services under a wide range of traffic loads andpacket size distributions. In addition, using an AWG with theminimum degree of minimizes the network cost (seeSection II-D) which is an important consideration in cost-sensi-tive metro WDM networks.
For a fixed network hardware the different transport servicesare achieved by optimally tuning the MAC protocol parameters(software) according to the found Pareto-optimal solutions.In particular, small frame lengths in the timing structure ofthe AWG network’s MAC protocol give Pareto-optimal per-formance with small delay (and moderate throughput), whilelarge frame lengths achieve optimal performance with largethroughput (and moderate delays). The optimal number of con-trol packet contention slots per frame is typically in the rangefrom 30 to 80, the specific optimal values for a given trafficload and required throughput-delay performance are availablein tables in [39]. The optimal control packet re-transmissionprobabilities are close to one for light traffic loads and in therange from 0.6–0.75 for heavy loads.
The developed genetic algorithm methodology can beapplied in analogous fashion to networks with a similarthroughput-delay tradeoff. The methodology is especiallyuseful for the multi-objective optimization of networks withcomplex, highly nonlinear characterizations of the networkthroughput and delay.
APPENDIX
TABLES FORPARETO-OPTIMAL SOLUTIONS
TABLE IVNETWORK FRONTIER: PARETO-OPTIMAL SOLUTIONS
WITH � AND q AS FREE DECISION VARIABLES

YANG et al.: A GENETIC ALGORITHM-BASED METHODOLOGY FOR OPTIMIZING MULTISERVICE CONVERGENCE IN A METRO WDM NETWORK 1131
TABLE VPARETO-OPTIMAL SOLUTIONS FOR� = 0:1 AND q = 0:1
TABLE VIPARETO-OPTIMAL SOLUTIONS FOR� = 0:1 AND q = 0:9
TABLE VIIPARETO-OPTIMAL SOLUTIONS FOR� = 0:3 AND q = 0:1
TABLE VIIIPARETO-OPTIMAL SOLUTIONS FOR� = 0:3 AND q = 0:5
TABLE IXPARETO-OPTIMAL SOLUTIONS FOR� = 0:3 AND q = 0:9

1132 JOURNAL OF LIGHTWAVE TECHNOLOGY, VOL. 21, NO. 5, MAY 2003
TABLE XPARETO-OPTIMAL SOLUTIONS FOR� = 0:6 AND q = 0:1
TABLE XIPARETO-OPTIMAL SOLUTIONS FOR� = 0:8 AND q = 0:1
TABLE XIIPARETO-OPTIMAL SOLUTIONS FOR� = 0:8 AND q = 0:9
TABLE XIIIPARETO-OPTIMAL SOLUTIONS WITH D = 2 FOR� = 0:6 AND q = 0:1
TABLE XIVPARETO-OPTIMAL SOLUTIONS WITH D = 4 FOR� = 0:6 AND q = 0:1
ACKNOWLEDGMENT
The authors are grateful to B. Kim of Arizona State Univer-sity for sharing his insights on genetic algorithms and assistingus in the implementation of our methodology in a C program.
REFERENCES
[1] B. Mukherjee, “WDM optical communication networks: Progress andchallenges,”IEEE J. Select. Areas Commun., vol. 18, pp. 1810–1824,Oct. 2000.
[2] M. Maier, M. Reisslein, and A. Wolisz, “High performance switchlessWDM network using multiple free spectral ranges of an arrayed-wave-guide grating,” inProc. SPIE Terabit Optical Networking: Architecture,Control, and Management Issues, Boston, MA, Nov. 2000, pp. 101–112.
[3] F. Jia and B. Mukherjee, “MultiS-net: A high-capacity, packet-switched,multi-channel, single-hop architecture and protocol for a local lightwavenetwork,”J. High Speed Networks, vol. 5, pp. 221–241, 1999.
[4] K. Bengi, “Performance of single-hop WDM LAN’s supportingreal-time services,”Photonic Network Communications, vol. 1, no. 4,pp. 287–301, Dec. 1999.
[5] A. Bianco, E. Leonardi, M. Mellia, and F. Neri, “Network controllerdesign for sonata—A large-scale all-optical passive network,”IEEE J.Select. Areas Commun., vol. 18, pp. 2017–2028, Oct. 2000.
[6] A. Okadaet al., “All-optical packet routing by an out-of-band opticallabel and wavelength conversion in a full-mesh network based on acyclic-frequency AWG,” inOFC 2001 Tech. Dig., Anaheim, CA, Mar.2001, Paper ThG5.

YANG et al.: A GENETIC ALGORITHM-BASED METHODOLOGY FOR OPTIMIZING MULTISERVICE CONVERGENCE IN A METRO WDM NETWORK 1133
[7] J. Spaeth, “Dynamic wavelengths under decentralized management,” inTransiNet Workshop, Berlin, Germany, Oct. 2001.
[8] K. Kumaran, M. Mandjes, D. Mitra, and I. Saniee, “Resource usage andcharging in a multi-service multi-QoS packet network,” in MIT Work-shop on Internet Service Quality Economics, Dec. 1999.
[9] P. Streilein and J. John, “Enabling revenue-generating services—Theevolution of next-generation networks,”Bell Labs Tech. J., vol. 6, no.1, pp. 3–12, Jan. 2001.
[10] D. Banerjee and B. Mukherjee, “Wavelength-routed optical networks:Linear formulation, resource budgeting tradeoffs, and a reconfigurationstudy,” IEEE/ACM Trans. Networking, vol. 8, pp. 684–696, Oct. 2000.
[11] A. Grosso, E. Leonardi, M. Mellia, and A. Nucci, “Logical topologiesdesign over WDM wavelength routed networks robust to traffic uncer-tainties,”IEEE Commun. Lett., vol. 5, pp. 172–174, Apr. 2001.
[12] B. Mukherjee, D. Banerjee, and A. Mukherjee, “Some principles fordesigning a wide-area WDM optical network,”IEEE/ACM Trans. Net-working, vol. 5, pp. 684–696, Oct. 1996.
[13] Z. Zhang and A. S. Acampora, “A heuristic wavelength assignment algo-rithm for multihop WDM networks with wavelength routing and wave-length re-use,”IEEE/ACM Trans. Networking, vol. 3, pp. 281–288, June1995.
[14] A. Fumagalli and L. Valcarenghi, “IP restoration vs. WDM protection: Isthere an optimal choice?,”IEEE Network, vol. 14, pp. 34–41, Nov./Dec.2000.
[15] M. Sridharan, M. V. Salapaka, and A. K. Somani, “A practical approachto operating survivable WDM networks,”IEEE J. Select. AreasCommun., vol. 20, pp. 34–46, Jan. 2002.
[16] G. Xiao and Y.-W. Leung, “Algorithms for allocating wavelength con-verters in all-optical networks,”IEEE/ACM Trans. Networking, vol. 7,pp. 545–557, Aug. 1999.
[17] L. Zhong and B. Ramamurthy, “Optimization of amplifier placements inswitch-based optical network,” inProc. IEEE ICC ’01, vol. 1, Helsinki,Finland, June 2001, pp. 224–228.
[18] C. L. Lu, R. T. Hofmeister, P. Poggiolini, and L. G. Kazovsky, “Powerbudget optimization of a WDM network with MSCM control usingsemiconductor optical amplifier,”IEEE Photon. Technol. Lett., vol. 9,pp. 115–117, Jan. 1997.
[19] D. Remondo, R. Srinivasan, V. F. Nicola, W. Van Etten, and H. E.P. Tattje, “Adaptive importance sampling for performance evaluationand parameter optimization of communication systems,”IEEE Trans.Commun., vol. 48, pp. 557–565, Apr. 2000.
[20] N. Geary, A. Antonopoulos, E. Drakopoulos, and J. O’Reilly, “Anal-ysis of optimization issues in multi-period DWDM network planning,”in Proc. IEEE INFOCOM ’01, vol. 1, Anchorage, AK, Apr. 2001, pp.152–158.
[21] A. L. Chiu and E. H. Modiano, “Traffic grooming algorithm for re-ducing electronic multiplexing costs in WDM ring networks,”J. Light-wave Technol., vol. 18, pp. 2–12, Jan. 2000.
[22] O. Gerstel, R. Ramaswami, and G. H. Sasaki, “Cost-effective trafficgrooming in WDM rings,”IEEE/ACM Trans. Networking, vol. 8, pp.618–630, Oct. 2000.
[23] H. Ghafouri-Shiraz, G. Zhu, and Y. Fei, “Effective wavelength assign-ment algorithms for optimizing design costs in SONET/WDM rings,”J.Lightwave Technol., vol. 19, pp. 1427–1439, Oct.r 2001.
[24] A. S. T. Lee, D. K. Hunter, D. G. Smith, and D. Marcenac, “Heuristic forsetting up a stack of WDM rings with wavlength reuse,”J. LightwaveTechnol., vol. 18, pp. 521–529, Apr. 2000.
[25] B. Mukherjee, “WDM-based local lightwave networks part I: Single-hopsystems,”IEEE Network Magazine, vol. 6, no. 3, pp. 12–27, May 1992.
[26] , “WDM-based local lightwave networks part II: Multihop sys-tems,”IEEE Network, vol. 6, pp. 20–32, July 1992.
[27] A. Dasylva and R. Srikant, “Optimal WDM schedules for optical starnetworks,” IEEE/ACM Trans. Networking, vol. 7, pp. 446–456, June1999.
[28] G. N. Rouskas and V. Sivaraman, “Packet scheduling in broadcast WDMnetworks with arbitrary transceiver tuning latencies,”IEEE/ACM Trans.Networking, vol. 5, pp. 359–370, June 1997.
[29] M. Maier, M. Scheutzow, M. Reisslein, and A. Wolisz, “Wavelengthreuse for efficient transport of variable-size packets in a metro WDMnetwork,” inProc. IEEE INFOCOM ’02, New York, NY, June 2002, pp.1432–1441.
[30] M. C. Chia, D. K. Hunter, I. Andonovic, P. Ball, I. Wright, S. P. Ferguson,K. M. Guild, and M. J. O’Mahony, “Packet loss and delay performanceof feedback and feed-forward arrayed-waveguide gratings-based opticalpacket switches with WDM inputs-outputs,”J. Lightwave Technol., vol.19, pp. 1241–1254, Sept. 2001.
[31] I. Baldine and G. N. Rouskas, “Traffic adaptive WDM networks: A studyof reconfiguration issues,”J. Lightwave Technol., vol. 19, pp. 433–455,Apr. 2001.
[32] R. Inkret, B. Mikac, and I. Podnar, “A heuristic approach to wavelengthassignment in all-optical network,” inProc. MELECON ’98, vol. 2,1998, pp. 759–763.
[33] M. Ali, B. Ramamurthy, and J. S. Deogun, “Routing algorithms for all-optical networks with power considerations: The unicast case,” inProc.8th IEEE ICCCN ’99, Boston-Natick, MA, Oct. 1999, pp. 237–241.
[34] S. T. Sheu, Y. R. Chuang, Y. J. Cheng, and H. W. Tseng, “A novel op-tical IP router architecture for WDM networks,” inProc. 15th Int. Conf.Information Networking, 2001, pp. 335–340.
[35] M. C. Sinclair, “Minimum cost topology optimization of the COST239European optical network,” inProc. Int. Conf. Artificial Neural Net-works and Genetic Algorithm, Apr. 1995, pp. 26–29.
[36] H. Tzeng, J. Chen, and N. Chen, “Traffic grooming in WDM networksusing genetic algorithm,” inProc. IEEE SMC ’99, vol. 1, 1999, pp.1003–1006.
[37] J. Arabas and S. Kozdrowski, “Applying an evolutionary algorithm totelecommunication network design,”IEEE Trans. Evol. Comput., vol.5, pp. 309–322, Aug. 2001.
[38] D. R. Thompson and G. L. Bilbro, “Comparison of a genetic algorithmwith a simulated annealing algorithm for the design of an ATM net-work,” IEEE Commun. Lett., vol. 4, pp. 267–269, Aug. 2000.
[39] H.-S. Yang, M. Maier, M. Reisslein, and W. M. Carlyle, “A Genetic Al-gorithm Based Methodology for Optimizing Multi-Service Convergencein a Metro WDM Network (Extended Version),” Arizona State Univer-sity, Telecommunications Research Center, http://www.eas.asu.edu/~re,2002.
[40] K. Deb, Multi-Objective Optimization using Evolutionary Algo-rithms. New York: Wiley, 2001.
[41] E. Zitzler, “Evolutionary Algorithms for Multi-Objective Optimization:Methods and Application,” Ph.D. dissertation, Swiss Federal Institute ofTechnology, Zurich, 1999.
Hyo-Sik Yang, photograph and biography not available at the time ofpublication.
Martin Maier , photograph and biography not available at the time ofpublication.
Martin Reisslein (A’96–S’97–M’98), photograph and biography not availableat the time of publication.
W. Matthew Carlyle , photograph and biography not available at the time ofpublication.