a gap analysis of nsse, bcsse and fsse - heqco.ca
TRANSCRIPT

Disappointment, Misunderstanding and Expectations:A Gap Analysis of NSSE, BCSSE and FSSE
Prepared by: Maureen Mancuso, Serge Desmarais, Kelly Parkinson and Brian Pettigrew of the University of Guelph
for the Higher Education Quality Council of Ontario

Disclaimer: The opinions expressed in this research document are those of the authors and do not necessarily represent the views or official polices of the Higher Education Quality Council of Ontario or other agencies or organizations that may have provided support, financial or otherwise, for this project.
Published by:
The Higher Education Quality Council of Ontario
1 Yonge Street, Suite 2402 Toronto, ON Canada M5E 1E5 Phone: (416) 212-3893 Fax: (416) 212-3899 Web: www.heqco.ca E-mail: [email protected] © Queens Printer for Ontario, 2010
Cite this publication in the following format: Mancuso, M., Desmarais, S., Parkinson, K., & Pettigrew, B. (2010) Disappointment, Misunderstanding and Expectations: A Gap Analysis of NSSE, BCSSE and FSSE. Toronto: Higher Education Quality Council of Ontario.

1 – Disappointment, Misunderstanding and Expectations: A Gap Analysis of NSSE, BCSSE and FSSE
Table of Contents Introduction 3
Expectation and Experience 4
Methodology 8
Analytical Model 8
Survey Comparability 10
Sample Reliability 13
Analysis 14
Level of Academic Challenge 15
Active and Collaborative Learning 20
Interaction with Faculty Members 23
Enriching Educational Experiences 25
Supportive Campus Environment 29
Conclusions 31
References 36
2 – Disappointment, Misunderstanding and Expectations: A Gap Analysis of NSSE, BCSSE and FSSE
List of Tables Table 1: Course Challenge 16
Table 2: Writing 18
Table 3: Higher-Order Thinking Skills 19
Table 4: Active Learning 20
Table 5: Collaborative Learning 21
Table 6: Out-of-Class Interaction 22
Table 7: Course Interaction 24
Table 8: Information Technology 26
Table 9: Diversity 27
Table 10: Varied Experiences 28
Table 11: Intrapersonal Environment 30
Table 12: Support for Student Success 31
Table 13: Outcome Measure: Gains in Practical Skills 33
Table 14: Outcome Measure: Gains in General Education 34
Note: All item and scalelet mean differences are significant at p < .01, with two exceptions:
the scalelet MI in Tables 2 and 3 are significant at p < .05 (indicated by ‘*’).

3 – Disappointment, Misunderstanding and Expectations: A Gap Analysis of NSSE, BCSSE and FSSE
Introduction The postsecondary undergraduate educational experience takes place in an environment rife
with expectation. Those “bright college years,” destined to be memorialized and celebrated,
attract a cluster of sociocultural images and resonances, some realistic and some fanciful.
Students see these years as a unique time of opportunity and unprecedented autonomy, a
psycho-social moratorium where possibilities open up and they can grow into their own adult
skins. And while matriculating students look forward to what awaits them, the other group
intensely involved in the educational process — the faculty — looks back, projecting their
own experience-derived expectations upon undergraduates who, in fact, may be
experiencing a generationally-different world.
What should new students expect to find when they begin — and settle into — this new, but
temporary, university life? And how will those expectations change as they are met,
surpassed, or frustrated? What should faculty expect of students, and will they or should
they measure up to faculty models? To what extent can faculty expectations serve as a
control or calibrating influence on the subjective expectations and experiences of students?
These are questions that are of vital interest to those attempting to understand the link
between student engagement and student success and, in this paper, these questions are
explored through three surveys—the National Survey of Student Engagement (NSSE), the
Beginning College Survey of Student Engagement (BCSSE), and the Faculty Survey of
Student Engagement (FSSE).
The BCSSE collects data on the expectations that beginning students have about university.
The NSSE covers similar topics from the reflective point of view of students who are in their
first year of university. Between the two surveys lies a “disappointment gap,” a measure of
how far students’ actual experiences fall short of their original expectations.1 Between the
NSSE and the FSSE, which records instructors’ impressions of students’ experiences and
motivations, lies a “misunderstanding gap” that spans the distance between what instructors
1 It is, of course, true and quite common that this ‘disappointment’ is actually a positive surprise in some aspects: the undergraduate experience can easily exceed expectations. We focus on the negative possibilities mostly because they represent the actual risk of lowered success. Excess delight is rarely a deterrent to engagement in the way that frustration often can be.

4 – Disappointment, Misunderstanding and Expectations: A Gap Analysis of NSSE, BCSSE and FSSE
think students are, or should be, accomplishing and what students believe they have
accomplished or will accomplish. Moreover, the two gaps converge or overlap when
students’ expectations about interactions with faculty confront the reality of university
practice. One of the biggest disappointments for students lies in access to faculty, and one of
the biggest misunderstandings is whether that access is adequate or deficient.
These gaps are not unambiguous measures of institutional or operational failure, because
expectations can be unrealistic or even wrong. How the information that underlies the
process of forming one’s expectations is understood and the clarity with which those
expectations are communicated both limit the possibility that the expectations will be met.
What we’ve called disappointment is, in part, an inevitable consequence of the
unpredictability of the future and of the fallible communications that contribute to
misunderstanding. But such disappointment — whether rational or irrational, avoidable or
inherent — can be a powerful deterrent to engagement in the university experience, and
misunderstandings can signal a disconnect in the pedagogical process that hampers its
effectiveness. It is, therefore, important to understand the nature of these gaps and the
factors that affect them. To put it another way, the causes of these forms of disengagement
come in three classes: inevitable, intentional, and unintentional. We can do nothing about the
first, by definition. The second represents choices that may be sound for other reasons (if
only because expectations are rarely 100 per cent accurate, which is one of the primary
meta-lessons of the postsecondary experience). But the erosion of engagement by
unintentional factors represents a gap between existing and potential performance that we
should be able to close or limit. A better understanding of the sources of disengagement will
allow us to choose more successful strategies to enhance engagement.
Expectation and Experience The expectations students bring to university have several aspects. Students have
expectations about the services, opportunities, challenges, and lifestyle that university will
offer to them; expectations about what they themselves will be able to contribute; and
expectations about the demands that the university experience will place upon them.
Based on those expected inputs to the educational process, there are also expectations
about outputs: learning outcomes, skills, career advancement, friendships, memories. Each

5 – Disappointment, Misunderstanding and Expectations: A Gap Analysis of NSSE, BCSSE and FSSE
kind of expectation conditions the perception of actual experience albeit in different ways —
and there is constant interplay between them. Students with loftier or more detailed long-
term goals may expect to work harder, make more use of research facilities, and achieve
higher grades than the students more concerned with the social aspects of university life.
Although it is important to recognize the spectrum of expectations, the distinction between
types is less important than the interaction of expectations with real experiences, and the
effect that unfulfilled expectations can have on student engagement and student success.
Theories rooted in the social and behavioural sciences suggest that expectations can serve
(a) “as sense-making or interpretive schema for filtering experience to determine what is or is
not appropriate and meaningful activity, and (b) as stimuli or deterrents to behaviour” (Olsen
et al., 1999, p. 5). Expectations can also form the basis for a kind of implicit contract between
an individual and, in this context, the institution in which he or she participates in order to gain
experience and skills (Kuh, Gonyea, & Williams, 2005, p. 36). Students choose a university
in part because they feel that their choice will offer them more in terms of educational gain
and personal or career advantage. If the gain experienced fails to live up to expectations,
this contract is broken, or at least stressed, and such stress is always a hindrance to
continuing engagement.
Scholarship continues to enhance the understanding of the dynamics of the relationship
between expectations and experiences. Braxton, Vesper, and Hossler (1995) found
empirical support for the effect of student expectations on students’ successful integration
into the academic and social aspects of campus. In other words, the more congruence or “fit”
there was between a student’s expectations and the experiences offered by the institution the
more likely the student was to persist in his or her studies. One study found additional
support for the “freshman myth” that “students’ expectations for themselves and the
academic demands of college were greater than what they subsequently experienced”
(Olsen, Kuh, Simmons, Buu, Connolly, Schilling, et al., 1999, p. 20). This research also
confirmed the link between expectations and experiences. However, according to Olsen et
al., “while findings support the widespread contention that student expectations of college are
critical to students’ experiences in college, it is also the case that students’ experiences on
our campuses — in our classrooms, residence halls, and student unions — have the greatest
and most immediate impact on academic success and persistence” (pp. 22–23).

6 – Disappointment, Misunderstanding and Expectations: A Gap Analysis of NSSE, BCSSE and FSSE
In What Students Expect from College and What They Get, Kuh, Gonyea, and Williams
summarized the state of research on expectations and experiences by suggesting that
“expectations and experiences individually and together affect key outcomes of college,
including academic performance, persistence, and self-reported gains” (p. 39). Using data
from the College Student Expectations Questionnaire and the College Student Experiences
Questionnaire to explore the link between expectations and experiences, Kuh and his
colleagues found that a first-year student’s abilities, aspirations, and motivations had more
influence on expectations than any other student characteristic, including race, being a first-
generation college student, or institutional characteristic. They also found that, in a kind of
self-fulfilling prophecy, first-year students with relatively high expectations were more likely to
report fulfillment of those expectations (see also Olsen et al., 1999). Institutional type and
student background characteristics did little to influence this relationship. They concluded
… that colleges and universities need to be as effective and persuasive as possible in explaining to students what is required to succeed in college and then holding students accountable for those expectations once they arrive (p. 58).
Lapses in such explanations and failures to maintain that accountability are, therefore,
especially hazardous to the practical health of the educational process. If a student’s desire
to succeed is so important to that student’s success, then it is vital that all students
understand what success entails—they must realize clearly what they are getting into—and
achievement relative to the standard of success be clearly communicated—they must be
aware of how well they did.
The interplay between expectation and experience constantly evolves, but it is in times of
significant transition, like the first year of university, when the relationship has more powerful
effects, because the stress of a transition inevitably raises the introspective questions: Have I
made the right choice? or, to put it in a more provocative form: “Have I made a mistake that I
need to correct? At the same time, successful management of the transition sets the pattern
and baseline for subsequent experiences — first year is the foundation upon which a
student’s university career is built. So it is important to understand not only whether initial
experiences match up to expectations (and thus whether they are reinforced or strained by

7 – Disappointment, Misunderstanding and Expectations: A Gap Analysis of NSSE, BCSSE and FSSE
assumptions and preconceptions) but also whether those experiences are being realistically
evaluated or simply suffer in comparison to expectations.
Students, especially first-year students, are likely unfamiliar with university practices and can
be expected to assess their experiences through the newcomer’s perceptions. It is tempting,
then, to calibrate student-reported experiences by calling in the professionals, that is, the
faculty who spend their adult lives assessing student performance. Although each student
undergoes first-year only once, instructors see first-year students go through essentially the
same process on an annual basis and build up a large reservoir of knowledge— and
expectations — about what a typical first-year student encounters and accomplishes.
Students have only expectations, formed outside the postsecondary environment, to guide
them in evaluating their experiences; faculty have “seen it all before”, from the inside of
academe, and can avoid the unrealistic expectations that might be formed in anxious high-
school minds.
And yet, there is nothing inherently objective about the perceptions of a tenured professor: a
Ph.D. does not grant immunity to personal bias or limitations of perspective, even if it likely
required developing an awareness of the dangers and unreliability of subjective
assessments. Moreover, generational effects, curricular change, and technological and
social evolution mean that the first-year experience is not really the same each year, even
though it is human nature in the faculty ranks to view it as such. In the end, faculty
expectations may not be any more reliable than student expectations when analyzing student
experience — more likely, both are unreliable, but for different reasons.
Some differences of opinion and perception between instructor and student can be settled
easily and finally — the assignment of grades is a subjective process that has been
institutionalized and operationalized to yield an objective result. But just as most teachers will
admit to continuously learning from their students, so too must they admit when pressed that
they cannot be sure their perceptions are wholly accurate, even if they claim a better batting
average than the undergraduate students. Identifying the gaps in perception between
students and faculty members does not resolve the question of who is correct; rather, it
highlights where the misunderstandings lie and suggests where better communication could
enhance the outcome of the educational process.

8 – Disappointment, Misunderstanding and Expectations: A Gap Analysis of NSSE, BCSSE and FSSE
Methodology The NSSE surveys provide an ideal tool to examine these gaps between expectation and
experience, since they pose a similar set of questions to students before and after entering
university and to the faculty who teach those students. The University of Guelph has data
sets from the three surveys that facilitate direct comparison. BCSSE was administered in
September 2005 to a cohort of entering students; 798 of those respondents also completed
the NSSE toward the end of their first year in March 2006. This subgroup of respondents thus
forms a significant longitudinal sample bracketing the first-year experience, and from which
measures of response consistency can be extracted.
FSSE was administered to a sample of 401 Guelph faculty in March 2007. Because the
student experience changes so much through a program of study, we divided the faculty
respondents by teaching load and selected only those 97 respondents who primarily taught
first-year courses. It is these faculty whose perceptions of student experience should be
dominated by actual contact and interaction with first-year students. Although this survey
was not precisely contemporaneous with the NSSE/BCSSE cohort, it is reasonable to
assume that faculty perceptions do not vary excessively from year to year. The NSSE and
FSSE results offer a comparison, not of individual respondents’ evolved perceptions, but of
the same process from the perspective of different participants.
Analytical Model Not surprisingly for a research project based on a specific survey format, the NSSE project
has developed a rich literature interpreting its research instruments. This literature focuses
not only on the extraction of reliable meaning and sometimes subtle insights but also on the
practical application of results in diverse academic environments. NSSE is intended to be
used at all levels of the university experience — from the assessment of individual
departments (where small sample sizes become a significant issue) to state or provincial
system-wide analysis (where commensurability across distinct institutions can be a concern).
Much of the initial NSSE literature focused on identifying and applying a suite of five

9 – Disappointment, Misunderstanding and Expectations: A Gap Analysis of NSSE, BCSSE and FSSE
benchmarks, aggregate measures that loaded together and conveyed related impressions
about aspects of educational engagement (Kuh, 2003).
Subsequent research has focused on identifying finer-grained metrics that might illuminate
performance and guide subsequent initiatives. Gary Pike decomposed the broad benchmark
categories into twelve subcategories or “scalelets” (Pike, 2006a; Pike, 2006c). Each scalelet
consists of an aggregate of 3 to 10 survey items (the scalelets also encompass some items
not included in the benchmarks). The overall schema of scalelets within benchmarks follows:
• Level of Academic Challenge
o Course Challenge
o Writing
o Higher-Order Thinking Skills
• Active and Collaborative Learning
o Active Learning Experience
o Collaborative Learning Experience
• Student Interaction with Faculty
o Course Interaction
o Out-of-Class Interaction
• Enriching Educational Experiences
o Varied Experiences
o Information Technology
o Diversity
• Supportive Campus Environment
o Support for Student Success
o Interpersonal Environment

10 – Disappointment, Misunderstanding and Expectations: A Gap Analysis of NSSE, BCSSE and FSSE
Pike has argued persuasively that the scalelets have greater explanatory power and provide
deeper insights than the benchmarks and, moreover, that they produce stable and reliable
means for analysis (Pike, 2006c). Pike was also able to relate his scalelet scores to
performance on NSSE “gains,” that is, learning outcomes. These two items (Gains in
Practical Skills and Gains in General Education) are also aggregated from NSSE items (Pike
2006a; see also Kuh, Gonyea, & Palmer, 2002) in the same manner as the scalelets.
Because this paper focuses on the gaps between the surveys and the pedagogical barriers
they imply, we have chosen to employ Pike’s theoretical framework as the primary basis for
our analysis rather than devise a new method of breaking down and aggregating the results.
Accordingly, our Analysis section is structured around the scalelets and outcome measures,
with the emphasis on the gaps between the surveys. Although this choice raises some
problems of applicability to the three surveys, it avoids the complications of constructing a
new set of components or factors.
Survey Comparability The first issue in attempting to compare the three surveys is that the NSSE scores must be
compared across two gaps of different shape and structure: the NSSE/FSSE comparison
involves two independent and discrete samples, while the NSSE/BCSSE comparison
involves successive surveys of the same respondents. Consequently, we had to calculate all
NSSE means and aggregate scores twice — once with pairwise exclusion of missing values
for comparison with BCSSE, and once without for comparison with FSSE.
The second issue is that not all questions comprising the scalelets are present in all three
surveys. Specifically, while the NSSE and the FSSE cover the same full set of scalelet
components, some are missing from the BCSSE. Two of the scalelets (Higher-Order
Thinking skills, Intrapersonal Environment) have no items at all in the BCSSE questionnaire,
two others (Writing, Varied Experiences) are missing a majority of their components and,
finally, two scalelets (Course Challenge, Out-of-Class Interaction) lack one item in BCSSE.
The remaining six scalelets and the two outcome measures are identical across all three
surveys. For those scalelets missing only one component, we have calculated the
NSSE/BCSSE aggregate scores using only the items present in both surveys.

11 – Disappointment, Misunderstanding and Expectations: A Gap Analysis of NSSE, BCSSE and FSSE
Only 2 of the 9 components of the Varied Experiences scalelet are present in the BCSSE,
which severely restricts the coverage of the scalelet and unavoidably changes its emphasis;
therefore, we have chosen to ignore that scalelet for BCCSE/NSSE purposes. While the
Writing scalelet is missing three of five items in BCSSE, we have retained it and calculated
two aggregates as above because the three missing items are essentially the same question
applied to different scales: “How often have you written a paper or report of 20 pages or
more/ between 5 and 19 pages/ less than 5 pages?” The two remaining questions probe
different aspects of writing skills and writing challenges. In a sense, only one-third of the
semantic breadth of this scalelet is missing from BCSSE, and we have chosen to include it in
restricted form in the BCSSE/NSSE comparison.
There is also some inter-survey variation in question wording, and these framing differences
might undermine the process of comparing responses. One variation is inescapable, given
that the BCSSE is a future-oriented survey, probing plans and intentions, while the others are
reflective of past experiences or observations. For example, in the BCSSE section titled
University Expectations, respondents were asked “How important is it to you that you do the
following at this university during the coming school year?” (The activities in this question
include “making a class presentation” “discussing grades or assignments with an instructor”
and so on). The question asks the respondent to assess the value placed on engaging in an
activity. In contrast, in the NSSE, the similar question asks how often the respondent has
done the same list of activities. This form of the question requires no value assessment, only
an enumeration and a possibly inaccurate recollection. Similarly, in FSSE, the questions are
framed in terms of the faculty member’s impression of how often a typical student has done
the activities, which requires both an estimation and an enumeration, but no assessment of
importance or worth.
The BCSSE form does not explicitly ask respondents about expectations per se. A
respondent might consider it very important to engage in an activity, and yet have low
expectations of actually doing that activity. For example, a deeply indebted mathematician
might consider it very important to win the lottery, but have virtually no expectation of
becoming instantly rich. But the wording of the question emphatically emphasizes the
subjectivity and personalization of the activity, as in “How important is it to you that you do the

12 – Disappointment, Misunderstanding and Expectations: A Gap Analysis of NSSE, BCSSE and FSSE
[activity]?” Thus, while the BCSSE scale may not directly measure expectation of
accomplishment, it certainly involves an element of desire and value.
None of the activities depicted are inherently unlikely or inaccessible (such as winning a
lottery), and all are the kinds of activities that seem likely to present themselves to typical
students. It, therefore, seems reasonable to use value and importance as a proxy for
expected experience in this context (Feather, 1992; Hitlin & Piliavin, 2004).
In comparing FSSE and NSSE, we do not have to adjust for a different question emphasis,
but we do have to acknowledge that, despite the similarity, the questions are targeted at
different individuals playing different roles in the educational process.
Moreover, while the students are asked on the NSSE to report their own experiences, the
faculty members on the FSSE are being asked for their perceptions of the experiences of
others (Kuh, Laird, & Umbach, 2004; Kuh, 2008, pp. 21–22). The different perspectives of
the respondents is especially important in a number of survey items common to NSSE and
FSSE, but missing from BCSSE, which are phrased in the form “Have you, or do you plan to
participate in (activity)?” In NSSE, the response choices are “have not decided,” “do not plan
to do,” “plan to do,” and “done.” In the FSSE, the question is phrased in terms of how
important it is for students to participate in the activity, and the response choices are “not
important,” “somewhat important,” “important,” and “very important.” We have re-coded these
questions in a binary form, assigning scores of 100 to the “plan to do/done” and
“important/very important” responses and scores of 0 to the other responses. This re-coding
is an adaptation of the same all-or-nothing re-coding used by Pike for these questions (Pike,
2006c).
A final issue of comparability stems from the use of slightly different measures and scales for
otherwise similar questions in the three surveys. For example, on the BCSSE, response
values for the question “How important is it to you that you do the following at this college
during the coming school year? — “make a class presentation” ranges from 1 (not important)
to 6 (very important). In contract, the NSSE scale for the similar question “In your experience
at your institution during the current school year, about how often have you done each of the
following?” ranges from 1 to 4 (1 = never, 2 = sometimes, 3 = often, 4 = very often); the FSSE
scale for the comparable question “About how often has the typical student done each of the
following?” uses the same scale. We have followed the methodology used by the creators of

13 – Disappointment, Misunderstanding and Expectations: A Gap Analysis of NSSE, BCSSE and FSSE
the NSSE in the calculation of benchmarks and resolved this inconsistency by re-coding
these items to a common 100-point scale (NSSE, 2006) (see also Pike, 2006c).
Sample Reliability One of the fundamental tenets of “the engagement movement” is that student success is self-
reinforcing. Students who have performed exceptionally well at the secondary level can be
expected to have high expectations for postsecondary success, and they tend to be more
engaged and more successful in fulfilling their expectations. It is, therefore, important to
gauge whether our sample was truly representative of the overall student population. We did
this in a number of ways. First, we considered the best six entering marks for students (data
were available for 718 of the 798 respondents). The mean of the best six for our BCSSE/
NSSE respondents was 83 per cent, which is not significantly different from the overall
population mean of 82 per cent. This suggests that the respondents were not qualitatively
different from the population in terms of academic success before arriving at university.
Similarly, an analysis of Winter 2006 cumulative grade averages shows that the same group
was also not especially different from their peers in success through their first year: the
average grade for respondents was 71 per cent, compared to the population average of 68
per cent.
One potentially significant variation is that the sample was 78 per cent female compared to
the general population average of 63 per cent. It is unclear whether this difference can be
expected to affect the survey results, however. Some studies have found gender effects on
survey variables but, in general, demographic variables have been shown to be less
important than psychological and cognitive factors such as student motivation or ability
(Miller, Kuh, Paine & Associates, 2006). Indeed, we had initially hoped to include the
standard sort of demographic analysis of results, relating responses to the variables of
gender, visible-minority status, parental education (whether the respondent is a first-
generation university attendee), and so on, but our analysis showed that these variables have
very little explanatory power in this context.
Previous studies using the College Student Expectations Questionnaire and the College
Student Experiences Questionnaire have not been a great deal more successful at finding

14 – Disappointment, Misunderstanding and Expectations: A Gap Analysis of NSSE, BCSSE and FSSE
clear demographic patterns: while they found some effects (mostly and sporadically related to
gender) One study concluded that “who students are was less important to engagement,
achievement, and persistence than what they expect from college and subsequently
experience” (Olsen et al., 1999, p. 22; Kuh, Gonyea, & Williams, 2005). As for the faculty
sample, since FSSE is a confidential survey, we could not draw upon external sources to
compare sample and population. However, the FSSE 2007 Respondent Characteristic
Report provides some overall sample statistics that can be used. We therefore know that
60 per cent of respondents are male (69% of the population), 71 per cent are tenured (78%
population), and the rank distribution is 40 per cent assistant / 38 per cent associate /
17 per cent professor (population 30%/ 35%/ 35%, respectively). The sample is thus—as
might be expected of a group of faculty who primarily teach first-year courses, relatively
junior, and (as an expected correlation of academic generation change) less gender-skewed.
Again, there is no basis on which to suspect that these differences would invalidate the
analysis.
Analysis Quantifying the “disappointment” and “misunderstanding” gaps between the surveys is
conceptually quite simple: for any given equivalent constructs, the inter-survey difference
between mean scores gives a first-order measure of the magnitude (and direction) of the
divergence. Accordingly, we have calculated for each individual item and for the various
scalelets in aggregate a “disappointment index” (DI) by subtracting the NSSE mean from the
BCSSE mean.2 The higher the DI score the greater the degree to which experience failed to
meet expectations. Because the BCSSE and the NSSE used the same set of respondents,
this difference between means is equivalent to an aggregate mean DI score over all the
individual respondents.
Similarly, a “misunderstanding index” (MI) can be calculated by subtracting the FSSE means
from the NSSE means. High MI scores indicate a wider gap between student and faculty
2 Thus a negative index actually represents a normatively “positive” result or “pleasant surprise” of experience exceeding expectations. The choice of sign is arbitrary and does not affect the analysis, but since most of the divergence is toward what we have labelled “disappointment” (expectations exceeding actual experience), it seems simpler to deal with mostly positive values.

15 – Disappointment, Misunderstanding and Expectations: A Gap Analysis of NSSE, BCSSE and FSSE
assessments of the student experience. Since most of the survey items are, or have been
re-coded to be, normatively “positive” — higher raw scores represent more generally
desirable experiences and outcomes — a high MI, from the faculty perspective, can be
interpreted as especially concentrated disbelief or skepticism that students have really
achieved or encountered as much as the students themselves believed. Of course, from the
student perspective, a high MI represents areas in which faculty are overly critical of student
experiences. Again, as we have emphasized, this difference in perception and perspective
cannot be resolved a priori in favour of either group — what is important is that the difference
exists and is embedded within a pedagogical process that so intensely relies on clear
communication and mutual understanding.
In what follows, we discuss salient patterns in the DI and MI results. The discussion is
organized around Pike’s scalelet schema. In all cases, we report the means and the
standard deviations for each of the three surveys. For each index, we report the value and
the effect size (Pearson’s r). For clarity, differences in the mean that are not statistically
significant at p <.01 have been omitted from the table, as have the values for survey items
that are missing from BCSSE.
Level of Academic Challenge
The Course Challenge scalelet neatly exemplifies the notion of “disappointment” as we have
used it (see Table 1: Course Challenge).

16 – Disappointment, Misunderstanding and Expectations: A Gap Analysis of NSSE, BCSSE and FSSE
Table 1: Course Challenge
BCSSE Mean (s.d.)
DI IndexEffect Size
NSSE3 Mean (s.d.)
MI Index Effect Size
FSSE Mean (s.d.)
How often have you … worked harder than you thought you could to meet an instructor’s standards or expectations? [impwrkhd workhard tworkhrd]
79.12 (21.22)
34.380.74
44.75 (26.11)
44.69 (20.01)
How often have you … come to class without completing readings or assignments? {reverse coding for clunprep tclunpre corrected} [impprep clunprep tclunpre]
88.47 (16.35)
30.660.74
57.81 (25.81)
18.80 0.48
39.01 (30.78)
To what extent have … your examinations during the current school year challenged you to do your very best work? [--- exams texams]
76.20 (18.23)
12.40 0.20
63.79 (20.99)
How many hours a week do you spend … preparing for class (studying, reading, writing, rehearsing, and other activities related to your academic program)? [acprpcol acadpr01 tactprep]
63.48 (20.52)
13.720.49
49.76 (23.25)
19.62 0.65
30.14 (18.38)
To what extent does your institution emphasize … spending significant amounts of time studying and on academic work? [empschol envschol fenvscho]
69.76 (23.39)
70.00 (23.91)
69.76 (26.39)
Course Challenge 75.25 (13.61)
19.630.75
55.62 (15.64)
59.73 (14.12)
10.19 0.21
49.54 (13.65)
It is clear that entering students had high expectations but suffered a significant reality check
by the end of their first year. Students had expected to work hard, but they discovered that
hard work was not necessary most of the time. Students had expected to come to class
well-prepared, but they found themselves getting away without doing any preparation, and
perceived that the overall workload of preparing for class was significantly lower than
3 Because one of the components of this scalelet is not present in BCSSE, two aggregate scalelet means were calculated for NSSE, one using just the BCSSE components (for calculating DI) and one with the full set of components (for MI). These are reported on the left and right, respectively of the table’s last row. The same presentation is used for other subsequent scalelets with missing components.

17 – Disappointment, Misunderstanding and Expectations: A Gap Analysis of NSSE, BCSSE and FSSE
expected. This gap could indicate that students are simply poor estimators of the effort they
might have expended, but in most respects, faculty members — who should be more
experienced at estimating academic effort — perceived their first-year students to be
significantly less prepared for class and to be investing even less time in preparation than
the students themselves reported. This pattern (BCSSE > NSSE > FSSE) suggests a
pedagogically-dangerous chain of perceptions. High expectations give way to mediocre
experiences and, from the instructors’ perspective; even those experiences are being over-
emphasized or over-reported.
These are some of the highest DI scores in the suite: clearly there is a disconnect between
the image and the reality of first-year university, and that reality is subject to competing
perceptions The one bright spot might be the insignificant levels of disappointment and
misunderstanding regarding institutional aspirations. Respondents on both surveys agreed
that the institution emphasizes hard work, but the other results suggest that emphasis may
not be operationalized very consistently or completely.
The Writing scalelet presents less conclusive and less provocative results (see Table 2:
Writing).

18 – Disappointment, Misunderstanding and Expectations: A Gap Analysis of NSSE, BCSSE and FSSE
Table 2: Writing
BCSSE Dis. Idx NSSE Mis. Idx FSSE How often have you … prepared two or more drafts of a paper or assignment before turning it in? [impdraft rewropap trewropa]
61.53 (28.00)
16.04 0.43
45.49 (31.96)
21.47 0.20
24.01 (31.23)
How often have you … worked on a paper or project that required integrating ideas or information from various sources [impinteg integrat tintegra]
63.28 (24.37)
65.91 (24.76)
16.44 0.39
49.47 (36.01)
During the current school year … number of written papers or reports of 20 pages or
more? [--- writemor twrtmr05]
4.24 (12.24)
-7.81 0.39
12.05 (17.18)
During the current school year … number of written papers or reports between 5 and 19 pages?
[--- writemid twrtmd05]
26.62 (16.13)
30.36 (21.28)
During the current school year … number of written papers or reports of fewer than 5 pages?
[--- writesml twritsml]
34.65 (20.98)
39.41 (23.27)
Writing 62.41 (23.28)
6.70 0.24
55.70 (23.61)
35.32 (12.82)
4.02* 0.22
31.30 (16.68)
There is mild disappointment and similar misunderstanding about the need to prepare
multiple drafts of papers. But the students’ expectations about the challenges of
synthesizing diverse sources of knowledge in written work appear to be validated even if
faculty are somewhat dubious. There appear to be very few long (over 20-page) papers
being written at all, although interestingly, faculty estimate a higher number than the
students do. This is unsurprising in the overall context of first-year courses only.
The Higher-Order Thinking Skills scalelet offers a respite from the theme of student
disappointment, if only because it is not present in the BCSSE and, thus, we have no gauge
of student expectations (see Table 3: Higher-Order Thinking Skills).

19 – Disappointment, Misunderstanding and Expectations: A Gap Analysis of NSSE, BCSSE and FSSE
Table 3: Higher-Order Thinking Skills
BCSSE Dis. Idx NSSE Mis. Idx FSSE During the current school year, to what extent has your coursework emphasized … memorizing facts, ideas, or methods from your courses and readings so you can repeat them in pretty much the same form? {reverse coding for memorize tmemoriz corrected} [--- memorize tmemoriz]
31.91 (27.26)
38.20 (28.23)
During the current school year, to what extent has your coursework emphasized … analyzing the basic elements of an idea, experience, or theory, such as examining a particular case or situation in depth and considering its components? [--- analyze tanalyze]
66.02 (25.20)
61.42 (27.01)
During the current school year, to what extent has your coursework emphasized … synthesizing and organizing ideas, information, or experiences into new, more complex interpretations and relationships? [--- synthesz tsynthes]
54.58 (27.54)
53.93 (28.21)
During the current school year, to what extent has your coursework emphasized … making judgments about the value of information, arguments, or methods such as examining how others gathered and interpreted data and assessing the soundness of their conclusions? [--- evaluate tevaluat]
56.04 (28.35)
10.35 0.11
45.69 (30.72)
During the current school year, to what extent has your coursework emphasized … applying theories or concepts to practical problems or in new situations? [--- applying tapplyin]
65.63 (28.08)
16.94 0.44
48.69 (29.75)
Higher-Order Thinking Skills 54.84 (17.02)
5.25* 0.20
49.59 (23.03)
There is some misunderstanding, but it is mild and focused on how much coursework has
required evaluation of competing sources and application of knowledge to new contexts.
Interestingly, while faculty were somewhat dubious of students’ abilities to synthesize
information in written work (in the second Writing item), there appears to be little divergence
when it comes to the synthetic content of actual courses.

20 – Disappointment, Misunderstanding and Expectations: A Gap Analysis of NSSE, BCSSE and FSSE
Overall, these scalelets and items challenge the curricular content and process of the
university. There is broad agreement that academic challenge is an important goal; but
what is actually required in practice falls short of students’ pre-entrance expectations, and is
evaluated quite differently by the two participants in the learning experience.
Active and Collaborative Learning
The items in the Academic Challenge benchmark largely address issues of “how much” —
how much effort is required to succeed; how much time must be invested (and how much of
it is rote learning as opposed to synthetic activity. The next benchmark drills down more into
the “how” of learning. Table 4: Active Learning and Table 5: Collaborative Learning show
results for the kinds of learning activities that are often touted as the key to operationalizing
a high level of challenge while maintaining engagement and avoiding discouragement.
Table 4: Active Learning
BCSSE Dis. Idx NSSE Mis. Idx FSSE How often have you … asked questions in class or contributed to class discussions? [impquest clquest tclquest]
61.23 (27.07)
28.02 0.70
33.21 (24.74)
-15.91 0.45
49.12 (27.86)
How often have you … made a class presentation? [impres clpresen tclprsnt]
37.39 (29.74)
12.62 0.36
24.77 (22.04)
24.31 (33.33)
How often have you … participated in a community-based project as part of a regular course? [impcompr commproj tcommpro]
39.74 (26.41)
32.50 0.75
7.25 7.24 (17.89) (17.88)
11.24 (20.69)
Active Learning Experience 46.05 (21.08)
24.34 0.76
21.71 21.73(14.26) (14.26)
-6.56 0.31
28.28 (18.52)

21 – Disappointment, Misunderstanding and Expectations: A Gap Analysis of NSSE, BCSSE and FSSE
Table 5: Collaborative Learning
BCSSE Dis. Idx NSSE Mis. Idx FSSE How often have you … worked with other students on projects during class? [impclgrp classgrp tclassgr]
58.45 (28.28)
31.38 0.64
27.07 (28.77)
29.86 (31.52)
How often have you … worked with classmates outside of class to prepare class assignments? [impocgrp occgrp toccgrp]
67.23 (27.22)
9.26 0.25
57.97 (28.40)
14.11 0.35
43.86 (33.43)
How often have you … tutored or taught other students (paid or voluntary)? [imptutor tutor ttutor]
33.32 (26.92)
13.46 0.38
19.86 (25.74)
21.11 (20.27)
How often have you … discussed ideas from your readings or classes with others outside of class (students, family members, coworkers, etc.)? [impoidea oocideas toocid05]
59.54 (25.37)
60.56 (27.69)
21.02 0.61
39.53 (21.40)
Collaborative Learning Experience 54.55 (18.46)
13.29 0.52
41.26 (16.74)
7.54 0.32
33.73 (19.86)
Unfortunately, we see a similar pattern here, at least with respect to the disappointment
index. In the NSSE, students report significantly lower levels of actual contribution to
class discussion, presentations, and community-based interaction than they expected
they would encounter, as indicated by BCSSE.4 They work less frequently with other
students than they expected, either as peers in or out of class or as mentors/mentees.
The only item where first-year experience seems to match up to expectation is in the
discussion of ideas from coursework in settings outside the classroom. The DI suggests
that students found the overall learning experience unexpectedly passive and solitary.
Faculty did not see the contrast as quite so stark. Indeed, the MI is negative for Active
Learning, implying that faculty assessed the learning experience as more active than
students did. On further analysis, however, this is due entirely to the influence of one
significant item about asking questions in class: faculty perceived the frequency of in-
class questions to be higher than that reported by students. It is reasonable to
4 It is worth noting here that the overall level of NSSE-reported community-based learning experiences is quite low even in absolute terms, and yet this is still a significant drop from the rather moderate level of expectations.

22 – Disappointment, Misunderstanding and Expectations: A Gap Analysis of NSSE, BCSSE and FSSE
hypothesize that the one faculty member present in a classroom might tend to
overestimate the number of questions asked, while the many students might tend to
underestimate them. In a lecture scenario (and 67% of first-year classes are lectures in
this asymmetric model), every question engages the instructor, but many students will
only be passive listeners to the dialogue that results. This gap between NSSE and FSSE
is a misunderstanding, but it may be an inherent or unavoidable one. Future research
along these lines may be needed to normalize or calibrate a “standard” level for this
difference rather than focus on the absolute number.
The direction of the MI swings back to positive when we look at the Collaborative
Learning items, but it is dominated by different components. Faculty are primarily
dubious about student experiences in regard to collaboration outside of class, either on
actual class assignments or in discussing course material with others outside the
classroom. This strong effect raises the question “How do they know?” Items to be
discussed below specifically target outside-of-class interaction of students with faculty
members themselves (see Table 6: Out-of-Class Interaction), and this item does not
mention faculty members, but rather “students, family members, coworkers, etc.”
Table 6: Out-of-Class Interaction
BCSSE Dis. Idx NSSE Mis. Idx FSSE How often have you … talked about career plans with a faculty member or advisor? [impplans facplans tplans]
67.08 (26.56)
51.71 0.85
15.37 (23.92)
-17.61 0.56
32.97 (21.14)
How often have you … worked with faculty members on activities other than coursework (committees, orientation, student-life activities, etc.)? [impother facother tfacothr]
48.90 (26.53)
40.30 0.81
8.60 (19.18)
-10.12 0.42
18.73 (18.77)
Have you, or do you plan to … work on a research project with a faculty member outside of course or program requirements? [--- resrch04 fimpr05]
29.57 (45.66
)
-20.43 0.33
50.00 (50.26)
Out-of-Class Interaction 58.14 (22.25)
46.10 0.88
12.04 (17.82)
17.76 (21.15
)
-17.34 0.24
35.10 (21.43

23 – Disappointment, Misunderstanding and Expectations: A Gap Analysis of NSSE, BCSSE and FSSE
FSSE respondents may be genuine in their belief that students do not discuss class
topics with others very much, but this belief is hard to quantify — certainly harder than
measuring the instructors’ opinions and perceptions directly.
With some latitude, we can make the general observation that higher absolute scores on
the surveys are associated with greater engagement in the learning process, or greater
participation in activities thought to enhance engagement. With this in mind, we can say
that the items and scalelets of the two benchmarks discussed so far present a generally
consistent pattern: students entering university have fairly high expectations of
engagement; as they complete first year, the students report less engagement than they
had expected. And faculty evaluate students’ experiences as even less engaging. The
one exception so far has been the item on asking questions in class, where faculty
perceived a more engaging experience or perceived themselves as more engaged in
answering. The next benchmark will inevitably highlight and extend this exception.
Interaction with Faculty Members
Indeed, the response pattern for items directly addressing student-faculty interaction is
nothing if not exceptional (Table 7: Course Interaction).

24 – Disappointment, Misunderstanding and Expectations: A Gap Analysis of NSSE, BCSSE and FSSE
Table 7: Course Interaction
BCSSE Dis. Idx NSSE Mis. Idx FSSE How often have you … discussed grades or assignments with an instructor? [impgrade facgrade tgrade]
68.84 (24.05)
41.34 0.81
27.50 (24.98)
-26.26 0.31
53.76 (25.08)
How often have you … discussed ideas from your readings or classes with faculty members outside of class? [impfidea facideas tideas]
55.12 (26.73)
39.84 0.78
15.28 (24.50)
-20.59 0.60
35.87 (22.77)
How often have you … received prompt feedback from faculty on your academic performance (written or oral)? [impfeedb facfeed tfeed]
79.15 (21.13)
37.19 0.75
41.96 (28.75)
-28.33 0.29
70.29 (25.89)
Course Interaction 67.76 (19.15)
39.41 0.87
28.35 (18.32)
-25.10 0.39
53.46 (16.40)
The DI is strong — stronger in aggregate than any of the other scalelets — representing
a significant shortfall of experience compared to expectation, but the MI swings strongly
the other way. Students are clearly and consistently disappointed in the access to, and
contact with, faculty members, but faculty consistently see their interaction as more
extensive and frequent. In previous scalelets, at least some of the items yielded weak or
insignificant differences; not so for this item, each one of which seems to elicit a deep
and distinct and unambiguous gap.
As hinted above with respect to active learning and in-class questions, that faculty
perceive their contact with students as more pervasive than the students do themselves
is not unexpected: the asymmetry of the instructor-student relationship is constantly
acknowledged by educational metrics like “student-faculty ratio” (it’s always some
number “to one”) and “contact hours.” But this difference in perspective is also
something we can expect faculty to be aware of when they choose their responses, at
least to some extent. And we know from previously discussed items that faculty may
tend to downplay the level of student engagement they perceive in the student activities
that do not involve direct faculty interaction.
25 – Disappointment, Misunderstanding and Expectations: A Gap Analysis of NSSE, BCSSE and FSSE
It should be pointed out that, even considered in isolation, the level of expectation
manifested in the BCSSE responses is quite aggressive. Easily the largest absolute
disappointment index value is found in the “discuss career plans with a faculty member”
item — there is a strong expression that this activity is important to entering students, and
an equally strong indication that few students actually manage to participate in it. What
we don’t know and can’t determine from these data is whether this kind of expectation is
doomed to be unrealistic, although that is one explanation for the yawning
disappointment gap.
The response patterns in this group, while consistent, do not allow us to assign blame or
responsibility for the divergences in perception that are revealed. Nevertheless, both
gaps should be examined in more detail and taken seriously. Whether student
interaction with faculty is deficient or simply a victim of inflated expectations, it is clearly a
sensitive point in students’ first-year experience. And regardless of whether students
underestimate or faculty overestimate their level of interaction, there is some disconnect
between the groups that could indicate a serious pedagogical challenge.
Enriching Educational Experiences
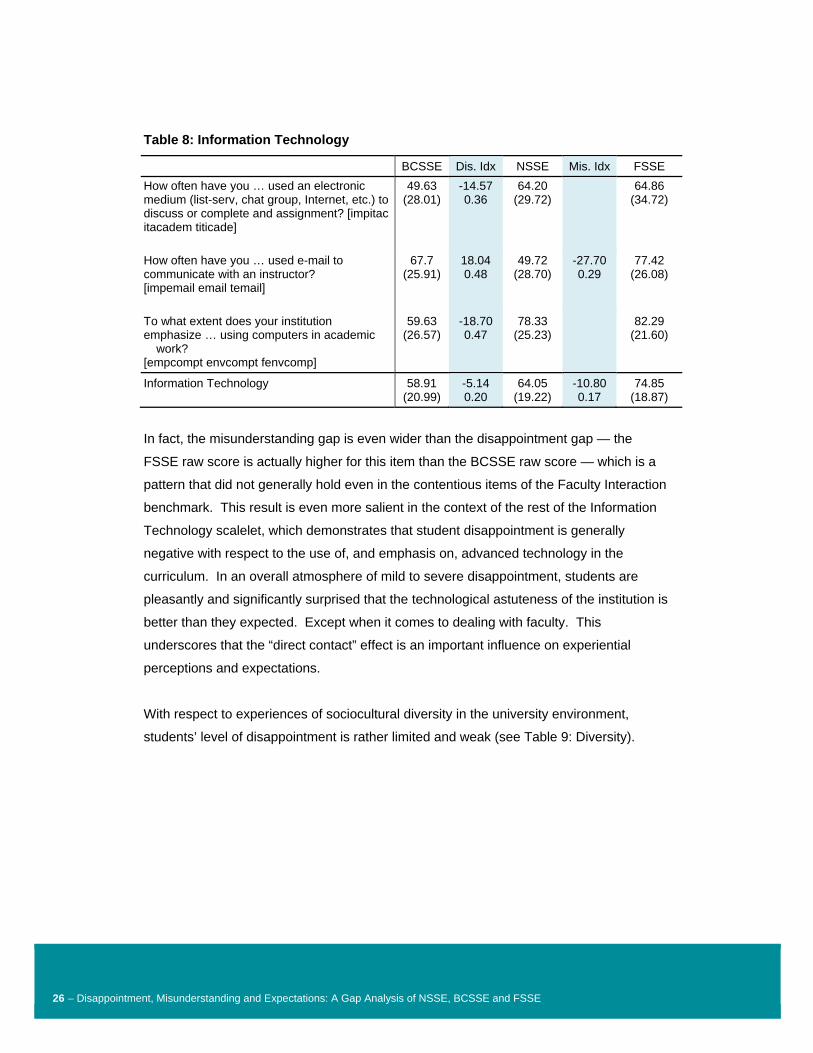
The most striking result in the Enriching experiences group of questions, once again
manifest this pattern of strong and opposing gaps for areas where the direct involvement
of the faculty with students is an aspect of the scenario. When asked how often they
communicate with instructors through e-mail, students express significant
disappointment, and instructors in turn report significantly higher contact frequency (see
Table 8: Information Technology).
26 – Disappointment, Misunderstanding and Expectations: A Gap Analysis of NSSE, BCSSE and FSSE
Table 8: Information Technology
BCSSE Dis. Idx NSSE Mis. Idx FSSE How often have you … used an electronic medium (list-serv, chat group, Internet, etc.) to discuss or complete and assignment? [impitac itacadem titicade]
49.63 (28.01)
-14.57 0.36
64.20 (29.72)
64.86 (34.72)
How often have you … used e-mail to communicate with an instructor? [impemail email temail]
67.7 (25.91)
18.04 0.48
49.72 (28.70)
-27.70 0.29
77.42 (26.08)
To what extent does your institution emphasize … using computers in academic
work? [empcompt envcompt fenvcomp]
59.63 (26.57)
-18.70 0.47
78.33 (25.23)
82.29 (21.60)
Information Technology 58.91 (20.99)
-5.14 0.20
64.05 (19.22)
-10.80 0.17
74.85 (18.87)
In fact, the misunderstanding gap is even wider than the disappointment gap — the
FSSE raw score is actually higher for this item than the BCSSE raw score — which is a
pattern that did not generally hold even in the contentious items of the Faculty Interaction
benchmark. This result is even more salient in the context of the rest of the Information
Technology scalelet, which demonstrates that student disappointment is generally
negative with respect to the use of, and emphasis on, advanced technology in the
curriculum. In an overall atmosphere of mild to severe disappointment, students are
pleasantly and significantly surprised that the technological astuteness of the institution is
better than they expected. Except when it comes to dealing with faculty. This
underscores that the “direct contact” effect is an important influence on experiential
perceptions and expectations.
With respect to experiences of sociocultural diversity in the university environment,
students’ level of disappointment is rather limited and weak (see Table 9: Diversity).

27 – Disappointment, Misunderstanding and Expectations: A Gap Analysis of NSSE, BCSSE and FSSE
Table 9: Diversity
BCSSE Dis. Idx NSSE Mis. Idx FSSE How often have you … had serious conversations with students of a different race or ethnicity than your own? [impdicon divrstud tdivrstu]
53.85 (28.40)
51.46 (32.88)
19.38 0.54
32.08 (22.78)
How often have you … had serious conversations with students who differ from you in terms of their religious beliefs, political opinions, or personal values? [impdicn2 diffstu2 tdiffstu]
55.45 (28.14)
56.55 (31.39)
23.62 0.64
32.92 (20.75)
To what extent does your institution emphasize … encouraging contact among students from different economic, social, and racial or ethnic backgrounds? [empdivrs envdivrs fenvdivr]
66.59 (27.35)
11.87 0.30
54.72 (31.26)
15.89 0.16
38.83 (32.52)
Diversity 58.64 (23.80)
4.40 0.15
54.24 (23.83)
19.36 0.64
34.88 (18.72)
In fact, the two items addressing personal experience demonstrate no significant
disappointment value at all. Somewhat disturbingly, it is only when assessing the
emphasis that the institution itself places on encouraging contact across social barriers
that students report some mild disappointment. Faculty not only share this doubt about
the goals of their institution, only more so, because their responses reveal an even lower
score for this item. And where students are not noticeably disappointed about their own
personal experience, faculty are sceptical on their behalf, showing a fairly severe
misunderstanding gap on the other items in this scalelet.
Interpretation of the Varied Experiences scalelet is somewhat hampered by a perspective
and emphasis shift in the questions. Students were asked about their plans, faculty
about the importance of the activities described (see Table 10: Varied Experiences).

28 – Disappointment, Misunderstanding and Expectations: A Gap Analysis of NSSE, BCSSE and FSSE
Table 10: Varied Experiences
BCSSE Dis. Idx NSSE Mis. Idx FSSE Have you, or do you plan to … participate in a practicum, internship, field experiences, co-op experience, or clinical assignment? [--- intern04 fintern]
57.16 (49.52)
-13.67 0.24
70.83 (45.69)
Have you, or do you plan to … participate in community service or volunteer work? [--- volntr04 fvoluntr]
77.27 (41.94)
36.03 0.54
41.24 (49.48)
Have you, or do you plan to … participate in a learning community or some other formal program where groups of students take one or more classes together? [--- lrncom04 flerncom]
28.38 (45.12)
-20.07 0.33
48.45 (50.24)
Have you, or do you plan to … take foreign-language coursework? [--- forlng04 fforlang]
37.45 (48.43)
29.90 (46.02)
Have you, or do you plan to … study abroad? [--- stdabr04 fstudyab]
42.84 (49.52)
45.83 (50.09)
Have you, or do you plan to … participate in an independent study or self-designed major? [--- indstd04 findst06]
13.53 (34.23)
-46.26 0.65
59.79 (49.29)
Have you, or do you plan to … participate in a culminating senior experiences (comprehensive exam, capstone course, thesis, project, etc.)? [--- snrx04 fsenior]
22.24 (41.61)
-57.14 0.40
79.38 (40.67)
How many hours a week do you spend … participating in co-curricular activities (organizations, campus publications, student government, social fraternity or sorority, intercollegiate or intramural sports, etc.)? [cocurcol cocurr01 tactcocou]
13.70 (15.86)
-9.58 0.18
23.28 (12.46)
To what extent does your institution emphasize … attending campus events and activities (special speakers, cultural performances, athletic events, etc.)? [empevent envevent fenveven]
64.96 (27.93)
59.03 (26.26)
Varied Experiences n/a n/a 39.73 7.76)
-11.63 0.20
51.36 (19.96)

29 – Disappointment, Misunderstanding and Expectations: A Gap Analysis of NSSE, BCSSE and FSSE
Nevertheless, there are some wide disagreements, and the pattern of responses is
interesting. Students are clearly more enthusiastic than faculty about community service
and volunteer work. But faculty consider co-curricular activities like practica, co-op terms,
and internships more important than other activities. Faculty also ascribe more
importance to structured learning groups, independent study and self-designed majors,
and capstone projects. These last three items share an emphasis on the actual practice
of education, in particular, the experiences that may well be perceived as remote from the
pressing concerns of first-year university life. So, on the one hand, it is not surprising that
first-year students are comparatively uninterested in senior theses and projects; on the
other hand, it indicates that first-year students are not being sufficiently coached on how
to prepare fully for the more advanced and personalized learning experiences they will
eventually come to desire and seek out.
The final weakly-significant but notable misunderstanding here has to do with the amount
of effort students invest in co-curricular activities. Previously discussed results might lead
us to suspect that FSSE respondents would continue to estimate lower values than the
students themselves. Previously, we saw a general scepticism about the time and
energy that students put into class preparation and assignments. But on this item, faculty
seem uncharacteristically charitable. Without making too much of this tentative
observation, it is possible that, yet again, where student activities that do not directly
involve faculty members, they tend to be viewed by faculty members as more authentic,
more engaged, and more legitimately experienced than in-class and in-course activities.
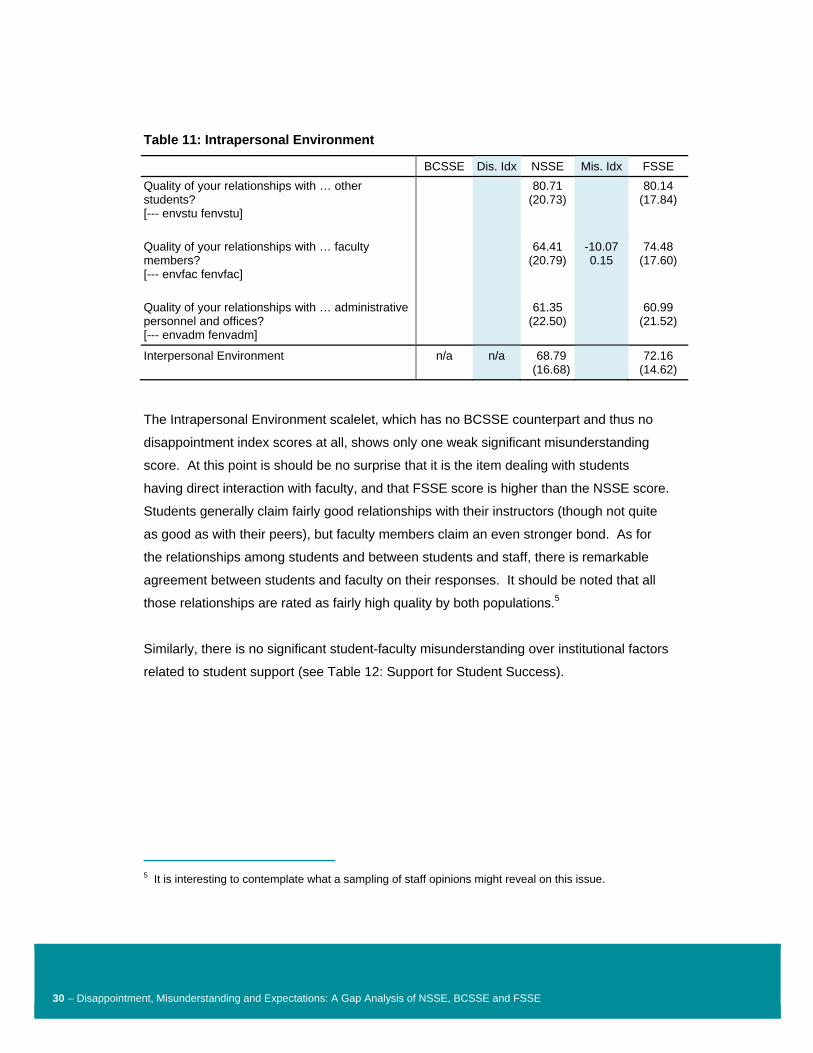
Supportive Campus Environment
Thus far, many questionnaire items have demonstrated reinforcing or counteracting gaps
between the pairs of surveys analyzed. In the Supportive Campus Environment
benchmark, this is not the case (see Table 11: Intrapersonal Environment).
30 – Disappointment, Misunderstanding and Expectations: A Gap Analysis of NSSE, BCSSE and FSSE
Table 11: Intrapersonal Environment
BCSSE Dis. Idx NSSE Mis. Idx FSSE Quality of your relationships with … other students? [--- envstu fenvstu]
80.71 (20.73)
80.14 (17.84)
Quality of your relationships with … faculty members? [--- envfac fenvfac]
64.41 (20.79)
-10.07 0.15
74.48 (17.60)
Quality of your relationships with … administrative personnel and offices? [--- envadm fenvadm]
61.35 (22.50)
60.99 (21.52)
Interpersonal Environment n/a n/a 68.79 (16.68)
72.16 (14.62)
The Intrapersonal Environment scalelet, which has no BCSSE counterpart and thus no
disappointment index scores at all, shows only one weak significant misunderstanding
score. At this point is should be no surprise that it is the item dealing with students
having direct interaction with faculty, and that FSSE score is higher than the NSSE score.
Students generally claim fairly good relationships with their instructors (though not quite
as good as with their peers), but faculty members claim an even stronger bond. As for
the relationships among students and between students and staff, there is remarkable
agreement between students and faculty on their responses. It should be noted that all
those relationships are rated as fairly high quality by both populations.5
Similarly, there is no significant student-faculty misunderstanding over institutional factors
related to student support (see Table 12: Support for Student Success).
5 It is interesting to contemplate what a sampling of staff opinions might reveal on this issue.

31 – Disappointment, Misunderstanding and Expectations: A Gap Analysis of NSSE, BCSSE and FSSE
Table 12: Support for Student Success
BCSSE Dis. Idx NSSE Mis. Idx FSSE To what extent does your institution emphasize … providing the support you need to help you succeed academically? [empsuprt envsuprt fenvsupr]
85.71 (17.74)
14.31 0.44
71.40 (25.11)
75.26 (23.71)
To what extent does your institution emphasize … helping you cope with your non-academic responsibilities (work, family, etc.)? [empnacad envnacad fenvnaca]
60.21 (26.57)
17.51 0.43
42.70 (29.11)
47.37 (28.17)
To what extent does your institution emphasize … providing the support you need to thrive socially? [empsocal envsocal fenvsoca]
61.50 (25.49)
8.04 0.22
53.46 (28.47)
53.90 (28.96)
Support for Student Success 69.16 (18.67)
13.32 0.45
55.83 (21.81)
58.51 (21.32)
However, students are generally somewhat disappointed with the levels of support they
receive, most notably for non-academic challenges. This is not to say that there is
significant dissatisfaction reported — initial expectations are quite high and even the
disappointed students indicate their belief that the institution provides a great deal of
needed support, especially academic. In the end, it is difficult to make any general
claims about these items and this dimension of engagement.
Conclusions There are substantial and persistent differences between the responses to the three
NSSE surveys. In most areas measured by the surveys, students in retrospect rate their
first-year experience as less engaging than they had expected it to be before entering
university. The sole exception to this trend (other than indifference about some aspects
of the experience) is a finding that information technology use and emphasis is more
pervasive than expected; the net result being not unhappy or disgruntled students. So it
is possible to argue that all the disappointment measured by the index is an inevitable
side-effect of the perspective-broadening that remains a central tenet and goal of the
university experience. Nevertheless, the extent to which first-year activities do not

32 – Disappointment, Misunderstanding and Expectations: A Gap Analysis of NSSE, BCSSE and FSSE
conform to prior expectations is potentially troubling — either students’ expectations are
unrealistic or the experience fails to meet students’ expectations in partial but noticeable
ways. Universities need to understand where and why this student disappointment is
most acute, and be careful to examine these potential trouble spots in more detail. When we compare how faculty assess students’ experiences with how students assess
their own experiences, the results are strongly bimodal. When the activity does not
involve direct interaction with an instructor, instructors are quite sceptical (in comparison
with the students) about the value of the engagement extracted from or invested in the
activity. To some degree, we must acknowledge that students tend to be idealistic about
their once-in-a-lifetime university experience, while faculty tend to have a more cynical or
prosaic view. Neither is truly objective but, according to FSSE respondents, the NSSE
respondents’ diminished assessments are still too generous, at least for experiences not
related to direct interaction.
But for activities involving direct interaction, faculty in contrast tend to be more positive
than the students and report greater frequency of, participation in, or value of that
interaction. The misunderstanding in this relationship swings both ways, and is
undoubtedly a product of subjectivity and misperception on both sides of the gap, but if
students and faculty are so consistently unable to value experiences in the same way —
especially the activities involving both groups at the very heart of the pedagogical mission
— then we have the potential for erosion of educational effectiveness and for the
disengagement that can undermine students’ success.
More important, the cleavage in misunderstanding between faculty-involved and non-
faculty-involved activities represents a basic lack of communication between students
and faculty. Students report less interaction with faculty than they had expected, which is
one of the most acute areas of disappointment, and faculty simply do not agree. If the
students are right, then the faculty members are not acknowledging the problem, which
could lead to more fractious relations. If the faculty are right, then the students are
making excessive and unreasonable demands on an already stressed resource, which
could also lead to problems. The failure of each group to understand the perspectives
and concerns of the other could confound efforts to improve how they work together to
pursue the overall education mission.

33 – Disappointment, Misunderstanding and Expectations: A Gap Analysis of NSSE, BCSSE and FSSE
These observations are not a call to the barricades nor a sign of impending disaster.
Despite measurable disappointment and misunderstanding, the respondents reported
overall satisfaction and engagement — an acceptable result. And if we examine some
NSSE metrics for learning outcomes, we find that the levels of comparable
disappointment and misunderstanding are rather minor compared to those found in some
of the experiential measures. Table 13: Outcome Measure: Gains in Practical Skills and
Table 14: Outcome Measure: Gains in General Education summarize the same DI/MI
results for the two learning outcomes used by Pike to test the explanatory power of his
scalelet model.
Table 13: Outcome Measure: Gains in Practical Skills
BCSSE Dis. Idx NSSE Mis. Idx FSSE To what extent has your experience at this institution contributed to your knowledge, skills, and personal development in … using computing and information technology? [cmpcomp gncmpts tgncmpts]
53.68 (21.35)
-8.95 0.26
62.63 (28.76)
68.63 (25.90)
To what extent has your experience at this institution contributed to your knowledge, skills, and personal development in …analyzing quantitative problems? [cmpquant gnquant tgnquant]
56.15 (19.82)
-8.59 0.26
64.74 (28.41)
13.19 0.14
51.55 (27.85)
To what extent has your experience at this institution contributed to your knowledge, skills, and personal development in …acquiring job or work-related knowledge and skills? [cmpwork gnwork tgnworkk]
60.97 (21.77)
9.01 0.24
51.95 (30.46)
48.78 (27.81)
Gains in Practical Skills 56.94 (14.17)
-2.80 0.12
59.74 (22.32)
55.84 (21.27)

34 – Disappointment, Misunderstanding and Expectations: A Gap Analysis of NSSE, BCSSE and FSSE
Table 14: Outcome Measure: Gains in General Education
BCSSE Dis. Idx NSSE Mis. Idx FSSE To what extent has your experience at this institution contributed to your knowledge, skills, and personal development in … writing clearly and effectively? [cmpwrite gnwrite tgnwrite]
61.58 (19.18)
5.61 0.17
55.96 (28.57)
50.39 (31.83)
To what extent has your experience at this institution contributed to your knowledge, skills, and personal development in … speaking clearly and effectively? [cmpspeak gnspeak tgnspeak]
58.95 (20.02)
12.24 0.33
46.71 (30.77)
41.76 (29.74)
To what extent has your experience at this institution contributed to your knowledge, skills, and personal development in … thinking critically and analytically? [cmpthink gnanaly tgnanaly]
62.57 (19.21)
-9.36 0.29
71.93 (24.94)
15.22 0.39
56.71 (32.59)
To what extent has your experience at this institution contributed to your knowledge, skills, and personal development in … acquiring a broad general education? [cmpgened gngenled tgngenle]
63.45 (16.90)
-8.34 0.29
71.80 (23.99)
15.17 0.43
56.63 (28.86)
Gains in General Education 61.64 (14.11)
61.60 (20.98)
10.36 0.35
51.25 (24.76)
No matter how disappointed students might be with some aspects of their educational
experience, their overall impression of the outcomes is at worst neutral and with respect
to practical skills even slightly positive (i.e., a negative DI) compared to expectations.
The gap between faculty and student perceptions is still present but limited, and for the
most part the overall impression is still on the positive side. In other words, first-year
university may not live up to the hype but is still seems to be seen as a productive and
satisfying experience by all those involved (learners and teachers).
We have intentionally approached these gaps in perception in an abstract manner, in part
due to the preliminary status of this kind of analysis. Future efforts, however, should try
to contextualize the gaps in disappointment and misunderstanding, and measure them in
light of institution-specific values and priorities. Crafting successful initiatives to close
these gaps in practice will require sensitivity to an institution’s unique mission and goals
and understanding of the particular programs and policies that tend to widen or narrow
the disparities between expectation and experience.
35 – Disappointment, Misunderstanding and Expectations: A Gap Analysis of NSSE, BCSSE and FSSE
One of the particularly promising aspects of this research and the data sets is the
availability of BCSSE and NSSE results for the same individual respondents. We have
been able to compare, without sample variation, the responses given to similar questions
both before and after a significant transition in students’ academic careers. This same
cohort of students just completed their final year of university, and we intend to survey
them with NSSE, whose responses will produce another set of interesting comparisons
because we will be able to track how experiences (and levels of disappointment) evolved
over the course of the four-year honours curriculum. Initial comparisons between
different cohorts of NSSE respondents (contemporaneous first-year and final-year
samples) suggest, as might be expected, that student perceptions change significantly as
the individual progresses through the mind-expanding cyclical levels of increasing
intensity in their university studies and activities. We will also be able to compare FSSE
responses — from instructors who primarily teach senior-level courses — with those
senior-level NSSE results. These possible surveys may offer different views of the
disappointment and misunderstanding gaps — or perhaps reveal completely new and
different gaps altogether.

36 – Disappointment, Misunderstanding and Expectations: A Gap Analysis of NSSE, BCSSE and FSSE
References
Braxton, J., Vesper, N., & Hossler, D. (October 1995). Expectations for college and
student persistence. Research in Higher Education, Vol. 36(5), pp. 595–611.
Feather, N. (1992). Values, valences, expectations, and actions. Journal of Social Issues,
48, pp. 109–124.
Hitlin, S., & Piliavin, J. (2004). Values: Reviving a dormant concept. Annual Review of
Sociology, 30, pp. 359–393.
Kuh, G. (2008). High-impact educational practices: What they are, who has access to
them, and why they matter. Association of American Colleges and Universities.
Kuh, G. (2003). The National Survey of Student Engagement: Conceptual framework and
overview of psychometric properties. Available November 5, 2009, from National
Survey of Student Engagement at
http://nsse.iub.edu/pdf/conceptual_framework_2003.pdf.
Kuh, G., Gonyea, R., & Palmer, M. (est. 2002). The disengaged commuter student: Fact
or fiction? Bloomington, IN: National Survey of Student Engagement, Indiana
University Center for Postsecondary Research and Planning. Available November 5,
2009, from http://nsse.iub.edu/pdf/commuter.pdf.
Kuh, G., Gonyea, R., & Williams, J. (2005). What students expect from college and what
they get. In T. Miller, B. Bender, & J. Schuh, Promoting reasonable expectations:
Aligning student and institutional views of the college experience. (2005, pp. 34–64) .
San Francisco: Jossey-Bass, an imprint of Wiley.
Kuh, G., Laird, T. N., & Umbach, P. (2004). Aligning faculty activities and student
behaviour realizing the promise of greater expectations. Liberal Education, Fall 2004,
pp. 24–31.

37 – Disappointment, Misunderstanding and Expectations: A Gap Analysis of NSSE, BCSSE and FSSE
Miller, T., Kuh, G., Paine, D., & Associates. (2006). Taking student expectations
seriously: A guide for campus applications. Washington, DC: National Association of
Student Personnel Administrators (NASPA), Inc.
National Survey of Student Engagement. (annual since 2001). NSSE SPSS Syntax
Library: Syntax for creating student-level benchmark scores and institutional
benchmarks. Available November 5, 2009, from the National Survey of Student
Engagement at http://nsse.iub.edu/html/syntax_library.cfm.
Olsen, D., Kuh, G., Simmons, A., Buu, A., Connolly, M., Schilling, K. M., et al. (1999,
February). Great expectations: What first-year college students say they will do and
what they actually do. Paper presented at the annual meeting of the Association for
the Study of Higher Education, Miami, FL.
Pike, G. (2006a). NSSE SPSS Syntax Library: Pike’s Scalelets. Available November 5,
2009, from the National Survey of Student Engagement at
http://nsse.iub.edu/html/syntax_library.cfm.
Pike, G. (2006b). The dependability of NSSE Scalelets for college and department-level
assessment. Research in Higher Education, pp. 177–195.
Pike, G. (2006c). The convergent and discriminant validity of NSSE Scalelet scores.
Journal of College Student Development, pp. 551–564. Available November 5, 2009,
at
http://cpr.iub.edu/uploads/Pike%20JCSD%20NSSE%20Scalet%20Paper%202006.p
df.
