a gamma-ray burst database of batse - iopscience
TRANSCRIPT

A GAMMA-RAY BURST DATABASE OF BATSE SPECTRAL LAGAND INTERNAL LUMINOSITY FUNCTION VALUES
Jon Hakkila, Timothy W. Giblin, Kevin C. Young,1Stephen P. Fuller,
2Christopher D. Peters,
Chris Nolan,3and Sarah M. Sonnett
4
Department of Physics and Astronomy, College of Charleston, Charleston, SC 29424; [email protected]
and
David J. Haglin and Richard J. Roiger
Department of Computer and Information Sciences, Minnesota State University, Mankato, MN 88001
Received 2006 September 20; accepted 2006 November 28
ABSTRACT
We present a database of spectral lags and internal luminosity function (ILF) measurements for gamma-ray bursts(GRBs) in the BATSE catalog. Measurements were made using 64 ms count rate data and are defined for variouscombinations of the four broadband BATSE energy channels. We discuss the processes used for measuring lags andILF characteristics. We discuss the statistical and systematic uncertainties in measuring these attributes, as well as therole of temporal resolution in measuring lags and/or ILFs—these are particularly noticeable for GRBs belonging tothe Short class. Correlative and clustering properties of the lag and ILF are examined, including the ability of theseattributes to predict GRB time history morphologies. We conclude that the ILF and lag have great potential for study-ing GRB physics when used with other burst attributes.
Subject headinggs: gamma rays: bursts — methods: data analysis
Online material: machine-readable tables
1. INTRODUCTION
The relation between observed properties and physical modelsof gamma-ray bursts (GRBs) has provided new insights intoGRBphysics. Interesting behaviors are those where burst attributes areclustered (indicative of new classes) or correlated (indicative ofrelated behaviors). Both clustering and correlative behaviors havehistorically been difficult to identify in bursts because GRBs ex-hibit such a wide range of individual behaviors, and because thecharacteristics of an individual burst often evolve significantly.
An example of clustering is the delineation between the Shortand Long GRB classes. Short GRBs typically have short dura-tions, are faint, and have hard spectra (Kouveliotou et al. 1993;Mukherjee et al. 1998; Nakar&Piran 2002a;Hakkila et al. 2003a;Balazs et al. 2004). They are also characterized by short spectrallags (Norris & Bonnell 2006; Donaghy et al. 2006) and narrowpulses (i.e., FWHM of roughly 65 ms; Norris et al. (1994), al-though eight Short GRBs in the BATSE catalog and six in thecurrent Swift catalog have been found to have episodes of ex-tended emission (Norris & Bonnell 2006). Application of datamining tools to GRB classification has shown that Short BATSEGRBs generally have T90< 1:954 or 1:954� T90< 4:672 andHR3;21> 3:01 (Hakkila et al. 2003a), where T90 is the duration inwhich 90% of the burst emission occurs, and HR3;21, a measureof the spectral hardness, is the ratio of the fluence in the 100Y300 keV range to the 20Y100 keV range (Mukherjee et al. 1998).
Note that the quoted high degree of accuracy is a byproduct ofthe data mining classification approach used and of themeasuredvalues of specific training instances, rather than an indicator ofthe accuracy to which the subset of Short GRBs can be delin-eated from Long ones. The contrast between the properties ofthe high-energy prompt emission of the Short class and the Longclass has led to theoretical models involving compact mergerscenarios (Goodman 1986; Eichler et al. 1989; Paczynski 1990;Narayan et al. 1992;Meszaros &Rees 1992; Katz&Canel 1996),with the instances of extended emission caused by awind imping-ing on a stellar companion (MacFadyen et al. 2005).Examples of correlative behaviors in LongGRBs include spec-
tral lag and peak luminosity (Norris et al. 2000), spectral lag withjet opening angle (Norris et al. 2000), and burst variability withpeak luminosity (Norris et al. 2000; Reichart et al. 2001). Char-acterizing thewide range of GRBproperties for correlative studiesis often limited by counting statistics. There are not often mean-ingful ways to subdivide burst counts into spectral and temporalproperties with sufficient signal-to-noise ratio that a meaningfulnew statistic can be adequately developed and/or explored.It has been known for some time that the morphology of GRB
time histories (i.e., light curves) is not stochastic, but that thepulse structure provides insights into GRB physics. For example,there is strong evidence that the majority of GRB pulses resultfrom internal shocks in relativistic outflows; these arguments havebeen made based on short pulse durations, pulse width evolu-tion, spectral evolution, and short interpulse durations (Daigne& Mochkovitch 1998; Ramirez-Ruiz & Fenimore 2000; Nakar& Piran 2002a, 2002b). However, other explanations such as elec-tromagnetic outflow are also possible; see Lyutikov&Blandford(2003). In addition, a number of bursts exhibit a soft componentindicative of external shocks that could be interpreted as onset ofafterglow (Connaughton 2002; Giblin et al. 2002).Supportive evidence for a structured arrangement of GRB
pulses and pulse widths has recently been verified (Hakkila &
1 Current address: Department of Physics, University of California at Berkeley,Berkeley, CA 94720.
2 Current address:Department of Physics andAstronomy,ClemsonUniversity,Clemson, SC 29634.
3 Discovery Informatics Program, College of Charleston, Charleston, SC29424.
4 Current address: Institute for Astronomy, University of Hawaii at Manoa,Honolulu, HI 96822.
A
62
The Astrophysical Journal Supplement Series, 169:62Y74, 2007 March
# 2007. The American Astronomical Society. All rights reserved. Printed in U.S.A.

Giblin 2006) using two GRB attributes: spectral lags and com-ponents of the internal luminosity function (ILF). Spectral lagsare the average time by which hard prompt emission leads softprompt emission; lags are generally obtained from the peak ofthe cross-correlation function (CCF) between two energy chan-nels (Band 1997). The ILF is the distribution of luminosity withina GRB (Horack & Hakkila 1997), and is obtained from the fluxdistribution. Lags and the ILFs have been used to sort GRBmor-phologies into a continuum of time profiles having similar ap-pearances (Hakkila & Giblin 2006). This delineation is valuablebecause lag is related to the intrinsic characteristic of peak lu-minosity, and the ILF is related to the intrinsic characteristic ofthe number of pulses. The similarity of time history morphol-ogies thus appears to be primarily intrinsic as opposed to extrinsic.Thus, characteristics related to the relativistic outflow are gener-ally more pronounced than cosmological effects.
Because of their usefulness in clustering and correlative stud-ies, a public database of spectral lags and ILF measurements isof great potential use to the astronomical community. We in-clude such a database here, obtained from the Burst And TransientSourceExperiment (BATSE) thatwasflownonNASA’sComptonGamma-Ray Observatory. BATSE was composed of eight large-area detectors having four broadband energy channels (channel 1between 20 and 50 keV, channel 2 between 50 and 100 keV,channel 3 between 100 and 300 keV, and channel 4 between300 keVand roughly 2 MeV). These measurements can be usedin conjunction with other published BATSE GRB characteristics.The database is also described here, along with some cautionarynotes about its use, and some correlative and clustering proper-ties of these attributes with other known GRB characteristics.The lag and ILF data are part of a larger database that is avail-able online along with a suite of data mining tools (the GRBToolSHED; Haglin et al. 2000, 2005; Hakkila et al. 2003b;Giblin et al. 2004).5
2. CATALOG DESCRIPTION
We have measured lags and ILF values using the BATSE64ms discrimination data.6This data type is advantageous becauseof its four-channel energy bins and high temporal resolution. Ithas the disadvantage of being a heterogeneous data type made bycombining BATSE DISCLA, PREB, and DISCSC data. PREB(preburst) data is 64ms time resolution data spanning the 2.048 sbefore a trigger, while DISCSC is 64 ms time resolution datacovering roughly four minutes following the trigger early in theComptonGamma-RayObservatorymission (prior to trigger 2099)or 10Y11 minutes following the trigger late in the mission (aftertrigger 2099). The combination of PREB and DISCSC data gen-erally span a burst’s duration, except when a significant precursoris present or when burst emission continues more than 11 minutespast the trigger. Inclusion of the lower time resolution DISCLAdata allows the 64ms burst data to be extended beyond that whichcan be obtained using DISCSC data alone (Horack & Hakkila1997). Time intervals undersampled by DISCSC and PREB datahave thus been filled in using the continuous 1024 ms time reso-lution DISCLA data type through a count rate normalization pro-cess at NASA’s Goddard Space Flight Center.
Other GRB characteristics, such as GRB number, flux andfluence data, durations, and spectral hardnesses are not included
here. These characteristics are part of the BATSECurrent Catalogand will eventually be published in the BATSE 5B Catalog.7
2.1. Spectral Lag Data
The spectral lag is the time delay between hard and soft promptGRB emission. BATSE’s four broadband energy channels canbe used to produce six different lag combinations (lag21, lag31,lag32, lag41, lag42, and lag43). The CCF is measured for eachchannel combination using the procedures defined byBand (1997)using the aforementioned 64 ms data. A fit is made to each CCFdistribution function so that the peak and corresponding lag canbe determined statistically. The CCF is assumed to have a shapefitted by a GRB pulse model (Norris et al. 1996) near its peak;the time interval over which this function is valid is small whenthe burst is dominated by narrow pulses, and large when it isdominated by broad ones. The time-asymmetric pulse functionhas more degrees of freedom than a cubic (Norris et al. 2000)and produces an accurate fit even when the CCF is dominated bybroad pulses. The fittedCCF range can strongly affect the lagmea-surement (Wu & Fenimore 2000; Norris et al. 2000), becausemultiple peaks in theCCF (typically caused by timescales onwhichpulse structure repeats) introduce a source of contamination.
The number of bursts found in the resulting data set is sum-marized in Table 1. Only the lags that could be measured areincluded for each BATSE trigger listed in the table. Thus, nomeasurements at all could be made for some bursts with verylow signal-to-noise. GRBs with no 64 ms data are of courseexcluded. Few lag measurements exist in the 300 keV to 1 MeVrange since channel 4 signal is weak in some bursts and non-existent for many others (NHE bursts; see Pendleton et al. 1997).The lag with the greatest number of represented bursts is lag32because channels 2 and 3 have the strongest signals (GRBs usu-ally peak around 300 keV; e.g., Kaneko et al. 2006). Uncer-tainties are estimated by averaging the lag values obtained fromseveral measurements spanning a range of temporal shifts (typ-ically, 5Y8 trial measurements made over a broad range of CCFvalues in the vicinity of the CCF peak). The error distribution foreach set of lag measurements �lagnm (for channels n and m, withboth lagnm and �lagnm measured in units of seconds) can be fittedby an empirical function
�lagnm1s
¼ 10A lagnm1s
� �B: ð1Þ
5 These tools are found at http://grb.mnsu.edu/grbts and http://grb2.cofc.edu/grbts.
6 Available from http://cossc.gsfc.nasa.gov/cossc/batse/batseburst /sixtyfour_ms.
7 The values may be found at http://www.batse.msfc.nasa.gov/batse/grb/catalog /current.
TABLE 1
Number of Bursts in the BATSE Lag Catalog
Lag Energy Channels All Lags Lags of Zero Positive Lags
21............................................... 1914 265 1280
31............................................... 1902 273 1366
32............................................... 2024 352 1379
41............................................... 819 98 618
42............................................... 900 129 641
43............................................... 993 214 622
All Combinations.................. 8552 1331 5906
Note.—Errors are fit to the empirical relation �lag nm¼ 10A(lagnm)
B (lag is inunits of seconds), where N is the number of bursts used to establish the fit forchannels n and m.
BATSE ILF AND LAG DATABASE 63

The resulting coefficients are given in Table 2. A small, negativevalue of the A coefficient indicates a smaller lag uncertainty thandoes a larger value of A. A small value of the B coefficient in-dicates that lag uncertainties depend weakly on lag, while largerB values indicate stronger lag dependencies. Since lags from allBATSE energy channel combinations are fitted with positive Bvalues, long lags typically have larger uncertainties than shortlags. However, larger uncertainties and a greater dependence onthe lag are found when the energy difference between channels islarge, such as for lag measurements involving channel four.
Some GRBs have CCFs for which only one trial measurementcould be made. An error has been assigned to these bursts us-ing the aforementioned empirical relations, and bursts for whichuncertainties have been assigned are tagged in the data file. Laguncertainties for GRBs with a single trial measurement and(lagnm)/(1 s)� (0:032)1/B10�A/B have been set equal to 0.032 s.
The entire lag database is contained in Table 3. Each recordrepresents the best value obtained for a GRB lag, which is typ-ically determined by the greatest number of measurements ob-tained by a single operator. Column (1) contains the BATSEtrigger number, columns (2) and (3) are the starting and endingtimes (in seconds) of the interval assumed to contain the burstsignal, column (4) is the lag (seconds), column (5) is the lag un-certainty (seconds), column (6) contains the number of trial mea-surements used to obtain the lag and uncertainty, column (7)indicates the energy channels across which the measurementwas made, column (8) is an indicator of the operator who madethe measurement (used to search for systematic measurementerrors) and column (9) is a note concerning the uncertainty (noteof 0 indicates that the uncertainty is taken from the measure-ments, note of 1 represents that the uncertainty has been obtainedusing equation (2.1) and Table 3, and note of 2 indicates that alag near zero was assigned a minimum uncertainty of 32 ms).
We demonstrate the best fits for two sample bursts having verydifferent lags; BATSE triggers 829 (Fig. 2) and 3035 (Fig. 3).The time histories of these GRBs are shown in Figure 2a andFigure 3a, respectively, while the corresponding CCFs are shownin Figure 2b and Figure 3b. Trigger 829 is a multipeaked FRED(fast rise exponential decay) burst with a long lag of lag31 ¼2:368 � 0:001. Trigger 3035 is a complex, spiky burst (Fig. 3a)with a short lag of lag31 ¼ 2:368 � 0:001.
2.2. Internal Luminosity Function Data
The internal luminosity function (ILF), or (L), is the observedluminosity distribution from a GRB or other transient event mea-sured in counts per second (Horack & Hakkila 1997). The quan-tity (L)�L represents the fraction of time that aGRB’s luminosityis found between L and Lþ�L. As such, the ILF summarizesinformation about the distribution of luminosity within a burstwithout explicitly describing the order in which the emission oc-curred. The detector’s signal-to-noise ratio places a lower limiton the effectiveness with which faint luminosities can be sam-pled, while binning of the detector’s integration window limitsthe temporal resolution of the ILF.The ILF can be calculated from BATSE data for any con-
secutive combination of the four broadband energy channels, so10 combinations can be produced easily (Ch1, Ch2, Ch3, Ch4,Ch1+2, Ch2+3, Ch3+4, Ch1+2+3, Ch2+3+4, and Ch1+2+3+4).To obtain accurate ILF measurements, the effects of backgroundmust be understood and removed (without doing this, the faintdistribution would be dominated by background). The signal-to-noise ratio used in measuring the ILF can be increased by com-bining energy channels, although some of the ILF’s potentialvalue can be lost in this manner because burst temporal charac-teristics are often energy-dependent.
2.2.1. Measuring the ILF
A description of the method used to calculate our ILF valueshas been given by Hakkila & Giblin (2006). We expand on thisdescription with the following procedure:
1. A representative background level is obtained (typicallyjust following the burst) so that average Poisson fluctuationscan be estimated. Different choices of the background intervaltypically do not alter the measured ILF properties significantlyunless background is chosen from a portion of the time historycontaining (a) burst emission, (b) emission from some other tran-sient source, (c) poor temporal resolution (rebinned data from
TABLE 2
Error Coefficients for Lags
Lag Energy Channels nm A B N
21.......................................................... �0.908392 0.492238 1830
31.......................................................... �0.863113 0.558372 1776
32.......................................................... �0.893366 0.579896 1959
41.......................................................... �0.738831 0.595810 693
42.......................................................... �0.793212 0.591698 785
43.......................................................... �0.654015 0.674395 891
TABLE 3
Energy-dependent Lags of BATSE GRBs
Trigger Start Time End Time Lag Error Measurements Channels Observer Note
105............................... �4 25 0.030 0.013 9 Ch21 a 0
105............................... �4 25 0.026 0.030 10 Ch31 a 0
105............................... �4 25 �0.005 0.011 8 Ch32 a 0
105............................... �4 25 �0.064 0.001 7 Ch41 a 2
105............................... �4 25 �0.091 0.034 6 Ch42 a 0
105............................... �4 25 �0.064 0.001 10 Ch43 a 2
107............................... �30 20 �0.150 0.165 7 Ch21 b 0
107............................... �30 20 0.083 0.421 3 Ch31 b 0
107............................... �30 20 0.731 0.147 6 Ch32 b 0
Notes.—Col. (1) contains the BATSE trigger number, cols. (2) and (3) are the starting and ending times (in seconds) of the interval assumed to contain the burst signal,col. (4) is the lag (seconds), col. (5) is the lag uncertainty (seconds), col. (6) contains the number of trial measurements used to obtain the lag and uncertainty, col. (7)indicates the energy channels across which the measurement was made, col. (8) is an indicator of the operator who made the measurement (used to search for systematicmeasurement errors), and col. (9) is a note concerning the uncertainty (note of 0 indicates that the uncertainty is taken from the measurements, note of 1 representsthat the uncertainty has been obtained using eq. (1) and Table 3, and note of 2 indicates that a lag near zero was assigned a minimum uncertainty of 32 ms). Table 3 ispublished in its entirety in the electronic edition of the Astrophysical Journal Supplement. A portion is shown here for guidance regarding its form and content.
HAKKILA ET AL.64 Vol. 169

DISCLA data), or (d ) residual background left from a rapidlychanging background. Equivalent time intervals are used inthe ILF calculation for all energy channels and energy channelcombinations.
2. A linear fit is obtained to model time-dependent back-ground variations in each energy channel, which are then removed.
3. Occasionally, some burst time intervals have poor time res-olution (e.g., a small number of GRBs have pulses in the 1024mspretrigger DISCLA data, and some GRBs continue to burst oncethe DISCSC data collection period has expired). Monte Carlomodels of Poisson variations are used to artificially create iden-tical temporal resolution in these time intervals (a ‘‘noisification’’process), thus providing an estimate of the time historywith 64msresolution.
4. The ILF distribution function is constructed by binningcount rates relative to a definedminimum (e.g., 1, 2, or 3 � abovethe background). Expected Poisson background rates are sub-tracted from each ILF bin so that only estimated source countsremain. Typically, there are many more ILF bins containing faintflux than there are containing bright flux. Thus, the methodologydescribed here allows us to extend the range of the ILF to fluxvalues less than the 3 � cutoff used by Horack & Hakkila (1997)allowing the ILF to be measured for many faint GRBs.
5. The number of bins used in calculating the ILF is initiallyestimated using an algorithm that allots more bins to long bursts(having many 64 ms bins) and to bright bursts (having a largedynamic flux range). Long, bright bursts are initially allotted thelargest number of bins, which is similar to the�40 bins used byHorack & Hakkila (1997). Once the binned data has been col-lected, an iterative process removes bins with too few counts tobe statistically meaningful, then redistributes the ILF values intothe remaining bins. The process stops when the remaining binseach contain at least five measurements (a minimum numberassumed for Gaussian statistics). Sometimes this condition is notreached, and the number of bins becomes very small. This lattercondition occurs when a burst is very faint, very short, or bothvery faint and very short.
6. The ILF is normalized by the requirement that� (L)�L ¼ 1. In addition, the peak luminosity Lpeak corre-sponding to the peak flux Fpeak is normalized to a value of unityin the ILF calculation. If the GRB redshift can be measured,then the internal luminosities can be recalibrated to an absolutescale rather than to a relative one. However, information thatcan be used to characterize the shape of the distribution is stillavailable even without this calibration.
7. Errors (� i(L)) are obtained for the luminosity in each of thei bins using propagation of error and standard Poisson statistics:
� i(L) ¼ffiffiffiffiffiffiffiffiffiffiffiffiffiffiffiffiffiffiffiffiffiffiffiffiffiN 2
back;i � N 2i
q; ð2Þ
where Ni is number of counts in bin i and Nback;i indicates theestimated number of counts in the bin resulting from Poissonvariations in the background.
The approach listed here expands on the methodology used byHorack & Hakkila (1997), who calculated the ILF specificallyusing energy channels 2+3 and a minimum threshold of 3 �above background. Their analysis avoided using fluxes that weretoo close to the background because of perceived uncertainty indeconvolving background from ILF signal. The updated tech-nique described here statistically filters out the background andallows us to trace the ILF structure closer to it. In addition, theoriginal choice of energy channels 2+3 provided a strong signal-to-noise ratio and limited the ILF to two energy channels that
have relatively similar temporal characteristics. The generic cod-ing procedure that we implemented allows the ILF calculationsto be extended to a large number of energy channel combinationsand limiting thresholds at no additional compromise.
2.2.2. Fitting the ILF
We have parameterized the ILF in a way that allows us to sum-marize its properties as simple attributes. The process is genericto the wide variety of energy channel and threshold combina-tions described above.
Horack&Hakkila (1997) fitted the ILFwith a quasi-power-lawfunction of the form
(L) ¼CL� ; ð3Þ
with normalization constant C and power-law index � . Thevalues of � are generally negative, since most of the emissionis weighted toward low luminosities. We initially calibrated ourILF calculations using this fitting function, and compared our re-sults to Horack & Hakkila (1997) in order to verify other aspectsof the procedure. A systematic bias was noticed: GRBs with largevalues of� (e.g.,� � 0) were relatively insensitive to the choiceof the low-luminosity cutoff Lmin (corresponding to a minimumflux,Fmin, at 1, 2, or 3 � above background), whereas GRBswithsmall � -values (�T0) changed noticeably between 1 � andhigher cutoff luminosities (Stallworth et al. 2003). As a result,the fitting function was modified to have the form
(L) ¼ CL�10�½log (L)� 2 : ð4Þ
We refer to the additional fitting parameter � as the ‘‘curvatureindex,’’ and note that introducing it solves the aforementionedproblem by recognizing that GRB ILFs with small � -values alsotend to change slope at fainter luminosities. Introduction of thisparameter also recognized that some GRBs have inherently dif-ferent ILF values than other GRBs.
Nine parameters are obtained from fitting the ILF with thenonlinear least-squared routine MPFIT. Three of these (the ILFpower-law index � , the curvature index �, and the fitting con-stant C ) describe the functional form of the ILF. The internal lu-minosity range R ¼ Fpeak /Fmin ¼ Lpeak /Lmin indicates the rangeof fluxes between Fmin and Fpeak that could be fitted; it is a quan-tity that has a meaning similar to the 64 ms peak flux. The formalfitting errors in the coefficients are given by �C , �� , and ��. Theoverall goodness-of-fit is given by�2
� , while � indicates the num-ber of degrees of freedom used in the fit.
Themodel parameters� and� are found to adequately describeGRB luminosity structure. The power-law index � indicates theamount of lower-luminosity emission relative to the peak lumi-nosity. A large � -value (� � 0) indicates that the distributionfunction shows only a slight luminosity decline between the peakand the threshold. In other words, the burst has a large amount oflower-luminosity emission relative to the peak emission. Single-pulsed FREDs (fast rise exponential decay bursts) are examplesof bursts that typically have large � -values. Conversely, a small� (�T0) indicates that the distribution function drops off rap-idly between the peak luminosity and the threshold; this occursfor a burst that is depleted in low-luminosity emission. The cur-vature index � indicates how the low-intensity emission deviatesfrom its expected variations near the peak (characterized by � ).A near-zero �-value indicates a GRB for which the emission nearthreshold is as expected from the emission near the peak. A small�-value (�T0) describes a GRB for which the faint end of thedistribution function is deficient from what would be expected
BATSE ILF AND LAG DATABASE 65No. 1, 2007

from the bright end of the distribution function. In general,� and� are orthogonal parameters that are also highly correlated, sothat only one parameter (usually � ) other than the normalizationC is sufficient for summarizing the ILF characteristics.
We have made ILF fits for all bursts in the current BATSEcatalog that have 64 ms data.8 For each or these GRBs, all 10 ofthe prescribed energy channel combinations were attempted, us-ing all three predefined threshold levels (1, 2, and 3 �). A qualityfactor, q, has been introduced to indicate measurements that havelarge uncertainties due to short duration and/or low signal-to-noise ratios. A quality factor of q ¼ 0 indicates that too few 64msbins were available to perform a reliable fit. In other words, the5 or fewer degrees of freedom available for the model fit pro-duced essentially meaningless data, and ILF fit parameters ob-tained when q ¼ 0 should be ignored. A quality factor of q ¼ 1indicates that 6Y10 degrees of freedom were available for themodel fit. The model fit in this case is suspect because the formal�2� generally underestimates the actual uncertainty in the fit. A
quality factor of q ¼ 2 indicates that the model fit used more than10 degrees of freedom. The �2
� is an additional indicator of thequality of the fit in these cases; a large value of �2
� indicates thatthe GRB’s ILF has more structure than can be easily representedby the simple model.
2.2.3. The ILF Database
The results of the ILF measurements are summarized in Ta-ble 4. A total of 18925 ILF measurements were obtained with
quality factors of q ¼ 2 and another 7414 measurements wereobtained with quality factors of q ¼ 1. The largest number ofhigh-quality measurements were obtained when the signal wastraced as close to the background as possible (� ¼ 1) and /orwhen the signal-to-noise ratio was large (e.g., for energy channelcombinations 1þ 2þ 3, 2þ 3þ 4, and 1þ 2þ 3þ 4), whereasthe smallest number of high-quality measurements were obtainedwhen only a small range of signal was available (� ¼ 3) and/orwhen the signal-to-noise ratio was small (e.g., energy channel 4).Some energy channel combinations produced reliable ILFfitswhensampled to the 1 � threshold but not to the 2 or 3 � thresholds.The overall database is presented in Table 5 and Table 6. ILF
measurements were successfully processed for 2124 GRBs.Table 5 contains information concerning the background and
foreground time intervals used in the ILF calculations for all GRBs.Column (1) contains the BATSE Trigger ID, while columns (2)and (3) contain the background start and end times (BGS andBGE) and columns (3) and (4) contain the burst (foreground)start and end times (FGS and FGE).Table 6 contains the 30 records of measured ILF values for
all GRBs. In these records, column (1) is the BATSE Trigger ID,and column (2) identifies the number of sigma above backgroundat which the cutoff threshold is set (1, 2, or 3 �). Column (3) liststhe energy channel combination from which the flux counts dataare being taken for the ILF measurement as a three-letter code(‘‘1,’’ ‘‘2,’’ 3,’’ ‘‘4,’’ ‘‘1+2,’’ ‘‘2+3,’’ ‘‘3+4,’’ ‘‘123,’’ ‘‘234,’’ or‘‘all’’). Column (4) is the ILF normalization constant C, with itsformal error of �C listed in column (5). Column (6) is the ILFpower-law index� , with its formal error of �� listed in column (7).8 See http://f64.nsstc.nasa.gov /batse /grb / catalog /current.
TABLE 4
Distribution of the 2124 Bursts in the BATSE ILF Catalog with ILF Measurements
Energy Channels Cutoff (� Above Background) Quality 0 Quality 1 Quality 2
1.......................................................... 1 883 323 918
2.......................................................... 1 695 379 1050
3.......................................................... 1 763 380 981
4.......................................................... 1 1660 177 287
1+2 ..................................................... 1 633 355 1136
2+3 ..................................................... 1 616 347 1161
3+4 ..................................................... 1 857 385 882
1+2+3................................................. 1 552 361 1211
2+3+4................................................. 1 660 360 1104
1+2+3+4............................................. 1 591 351 1182
1.......................................................... 2 1514 196 414
2.......................................................... 2 1327 250 547
3.......................................................... 2 1348 270 506
4.......................................................... 2 1948 83 93
1+2 ..................................................... 2 1216 270 638
2+3 ..................................................... 2 1153 295 676
3+4 ..................................................... 2 1456 221 447
1+2+3................................................. 2 1111 261 752
2+3+4................................................. 2 1218 269 637
1+2+3+4............................................. 2 1146 260 718
1.......................................................... 3 1764 131 229
2.......................................................... 3 1613 164 347
3.......................................................... 3 1620 168 336
4.......................................................... 3 2018 43 63
1+2 ..................................................... 3 1529 177 418
2+3 ..................................................... 3 1457 201 466
3+4 ..................................................... 3 1691 134 299
1+2+3................................................. 3 1393 217 514
2+3+4................................................. 3 1509 186 429
1+2+3+4............................................. 3 1440 200 484
Total ............................................... All Combinations 37381 7414 18925
HAKKILA ET AL.66 Vol. 169

Column (8) is the ILF curvature index �, with its formal error of�� listed in column (9). Column (10) indicates the formal�2
� , withthe number of degrees of freedom � listed in column (11). Col-umn (12) indicates the internal luminosity range R. Column (13)identifies the quality factor q of the measurement.
We have examined our analysis technique to determinewhetheror not additional errors occur as a result of the human operator’sparticipation in the measurement process. An external error hasbeen estimated by running ILF fitting models on a specific burstsubset by several human operators. Our calibration sample con-sists offive bursts independently analyzed by six human operators(BATSE triggers 249, 973, 1039, 1533, and 1700). The differencebetween the independently calculated external errors (Eext) andinternal errors (Eint) in the power-law and curvature indices is anoffset error (EoAset ¼ Eext �Eint) that is not identified in the for-mal measurement of these parameters. This additional source oferror is attributed to the choice of background and burst intervalsselected by the human operator, as well as any Monte Carlo‘‘noisification’’ of some 1024 ms background intervals. The re-sults of our analysis indicate that ILF power-law index and cur-vature errors are roughly twice as large as the formally quotedinternal errors for GRBs with reasonable signal-to-noise that havelarge ILF power-law indices. A larger scatter is obtained for faintGRBs, and GRBs with very small power-law indices are moresusceptible to the choice of the time interval containing the burstsignal.
2.2.4. Characterizing the ILF Fit Parameters
The fit parameters � and � are found to be highly-correlated.Figure 1 demonstrates this correlation for 901 high-quality (q ¼ 2)GRBs having their ILFs measured in channels 2þ 3 with the
TABLE 5
Burst Time Intervals Used to Calculate the BATSE Internal
Luminosity Function Measurements
Trigger BGS BGE FGS FGE
105..................... 10.000 40.000 0.000 10.000
107..................... 10.000 140.000 �2.000 10.000
108..................... 2.000 10.000 �2.000 2.000
109..................... 115.000 240.000 �5.000 110.000
110..................... 115.000 210.000 �5.000 115.000
111..................... 80.000 230.000 �2.000 80.000
114..................... 30.000 130.000 �3.000 30.000
121..................... 120.000 230.000 �4.000 120.000
130..................... 100.000 210.000 �5.000 80.000
133..................... 200.000 235.000 �3.000 200.000
Notes.—Col. (1) contains the BATSE trigger ID, cols. (2) and (3) contain thebackground start and end times (BGS and BGE), and cols. (4) and (5) contain theburst (foreground) start and end times (FGS and FGE). Table 5 is published in itsentirety in the electronic edition of theAstrophysical Journal Supplement. A portionis shown here for guidance regarding its form and content.
TABLE 6
Internal Luminosity Function Measurements of BATSE GRBs
Trigger nsig Channel C �C � �� � �� �2 /� � R q
105................................. 1.0 1 3.426 2.328 �3.801 0.860 �1.765 0.568 1.121 22 56.13 2
105................................. 1.0 2 0.263 0.404 �5.952 1.608 �2.708 0.911 1.872 15 91.96 2
105................................. 1.0 3 1.012 1.008 �4.702 1.105 �2.123 0.654 1.179 17 70.75 2
105................................. 1.0 4 25.442 8.023 �2.217 1.617 �4.781 3.924 0.190 4 4.27 0
105................................. 1.0 1+2 1.974 1.672 �4.177 0.980 �1.884 0.594 1.396 22 99.18 2
105................................. 1.0 2+3 0.346 0.499 �5.938 1.540 �2.870 0.889 1.769 20 115.50 2
105................................. 1.0 3+4 0.504 0.632 �5.655 1.430 �2.790 0.880 1.273 16 58.09 2
105................................. 1.0 123 3.218 2.427 �3.371 0.832 �1.312 0.476 1.533 20 119.22 2
105................................. 1.0 234 0.130 0.176 �7.040 1.420 �3.477 0.813 1.318 19 104.00 2
105................................. 1.0 All 1.230 1.105 �4.669 0.997 �2.144 0.588 1.338 22 112.74 2
105................................. 2.0 1 4.083 2.729 �3.670 0.867 �1.715 0.584 1.174 19 28.06 2
105................................. 2.0 2 0.406 0.525 �5.561 1.343 �2.494 0.755 1.654 14 45.98 2
105................................. 2.0 3 1.289 1.247 �4.459 1.080 �1.988 0.640 1.206 16 35.37 2
105................................. 2.0 4 14.363 7.720 �7.108 4.025 �23.754 14.830 0.375 5 2.13 0
105................................. 2.0 1+2 2.557 1.972 �3.781 0.879 �1.600 0.525 1.389 20 49.59 2
105................................. 2.0 2+3 1.463 1.606 �3.866 1.116 �1.461 0.600 1.956 15 57.75 2
105................................. 2.0 3+4 0.427 0.610 �5.711 1.611 �2.779 0.982 1.489 16 29.05 2
105................................. 2.0 123 3.052 2.185 �3.608 0.787 �1.515 0.454 1.445 19 59.61 2
105................................. 2.0 234 0.159 0.229 �6.893 1.525 �3.444 0.886 1.483 19 52.00 2
105................................. 2.0 All 2.564 2.109 �3.646 0.915 �1.500 0.530 1.553 20 56.37 2
105................................. 3.0 1 0.779 1.020 �6.065 1.718 �3.490 1.205 1.742 15 18.71 2
105................................. 3.0 2 0.097 0.187 �7.128 2.031 �3.425 1.171 2.056 13 30.65 2
105................................. 3.0 3 0.279 0.395 �6.259 1.571 �3.105 0.948 1.327 14 23.58 2
105................................. 3.0 4 2.549 3.742 �28.145 15.948 �155.668 90.520 0.330 5 1.42 0
105................................. 3.0 1+2 2.101 1.851 �4.052 1.025 �1.772 0.624 1.506 18 33.06 2
105................................. 3.0 2+3 0.357 0.469 �5.746 1.375 �2.635 0.780 1.690 14 38.50 2
105................................. 3.0 3+4 0.128 0.226 �7.163 1.989 �3.685 1.230 1.501 14 19.36 2
105................................. 3.0 123 2.949 2.048 �3.722 0.795 �1.598 0.476 1.283 17 39.74 2
105................................. 3.0 234 0.107 0.171 �7.350 1.698 �3.728 0.993 1.576 17 34.67 2
105................................. 3.0 All 1.625 1.575 �4.233 1.089 �1.860 0.645 1.613 18 37.58 2
Notes.—The 30 records for each GRB have the following formats: col. (1) is the BATSETrigger ID, col. (2) is the cutoff threshold above background (1, 2, or 3 �), andcol. (3) lists the three-letter energy channel combination nm. Cols. (4) and (5) are the ILF normalization constant C and its uncertainty �C, cols. (6) and (7) are the ILFpower-law index� and its uncertainty�� , and cols. (8) and (9) are the ILF curvature index� and its uncertainty ��. Col. (10) is the formal�2
� , with the number of degrees offreedom � in col. (11). Col. (12) is the internal luminosity range R and col. (13) identifies the measurement’s quality factor q. Table 6 is published in its entirety in theelectronic edition of the Astrophysical Journal Supplement. A portion is shown here for guidance regarding its form and content.
BATSE ILF AND LAG DATABASE 67No. 1, 2007

flux threshold set 1 � above background. A Spearman rank ordercorrelation test finds this the probability that this correlation israndom to be only p ¼ 4:5 ;10�88. A simple linear relation be-tween the two parameters is
� ¼ Aþ B�; ð5Þ
where A ¼ 1:2496 � 0:0110 and B ¼ 1:1010 � 0:0005 are thebest-fit coefficients. This correlation indicates that GRBs withlarge power-law indices (� � 0) are best fitted with a simplepower-law and no curvature index. The ILFs of these bursts aredescribed by a simple functional form over their observed lumi-nosity range from peak luminosity to threshold luminosity. How-ever, GRBs with small power-law indices (�T0) have ILFswith pronounced curvatures, such that the slope of the distri-bution near the peak luminosity indicates a depletion of high-luminosity emission relative to moderate-luminosity emission,while the slope of the distribution near the threshold luminos-ity indicates a depletion of low-luminosity emission relative tomoderate-luminosity emission. Thus, GRBs with small power-law indices produce a large amount of their emission from a rel-atively narrow range of luminosities.
Similarly strong correlations are found for ILF fits obtainedusing other energy channel combinations; the coefficients obtainedfrom these correlations are shown in Table 7. Most of the energychannel combinations produce similar coefficients,with only chan-nel 4 being noticeably different. This means that, although both� and � are needed to characterize the ILF, only one is needed asan indicator of the ILF since it implies the value of the other.
We demonstrate the best fits for two sample bursts havingvery different ILF values; BATSE triggers 829 (Fig. 2) and 3035(Fig. 3). Both bursts are measured using channels 2+3 with acutoff threshold 1 � above background. Both are high-qualitymeasurements with more than 30 degrees of freedom, good fits(1 � �2
� < 2), and large internal luminosity ranges (R > 50).Trigger 829 is a multipeaked FRED burst (Fig. 2a) that produceslarge ILF indices (� ¼ �0:35 � 0:33,� ¼ 0:21 � 0:25; Fig. 2c)indicating that there is a moderate amount of high-luminosityemission relative to low-luminosity emission. Trigger 3035 is acomplex, spiky burst (Fig. 3a) that has small ILF indices (� ¼�4:20 � 0:17, � ¼ �1:92 � 0:11; Fig. 3c) indicating a largeamount of moderate-luminosity emission relative to high- andlow-luminosity emission.
3. DISCUSSION
3.1. Clustering Properties of the GRB Lag and ILF Databases
3.1.1. Characteristics of Long GRBs
It has been shown (Hakkila & Giblin 2006) that the spectrallag and the ILF power-law index are morphology indicators forGRB time histories; the types of morphologies that have beenidentified in this fashion are shown in Figure 4. Long lags typ-ically delineate GRBs with fewer, broader pulses than those withshort lags. GRBs with large ILF � -values typically have only oneor two pulses. This is contrasted with short-lag, small � -valuedGRBs characterized by many narrow pulses, and long-lag, small� -valued GRBs characterized by a few broad pulses.The ordering of GRB time history morphologies by lag and
ILF demonstrates that these attributes primarily measure in-trinsic characteristics (as discussed by Hakkila & Giblin 2006).Cosmological time dilation is apparently less important than theintrinsic lag caused by jet structure and kinematics. Lag is anintrinsic attribute that anticorrelates with burst peak luminosity( long-lag bursts are less luminous than short-lag bursts in thecomoving frame; Norris et al. 2000); this relationship indicatesthat short-lag bursts are luminous and are typically found at largeredshift. If cosmological time dilation were of primary impor-tance, then it would tend to cause the most distant, most lumi-nous GRBs to have the broadest pulses and the longest lags. Itwould also make intermediate- and long-lag bursts into stretched-out versions of short-lag bursts with similar ILF values. Instead,long-lag bursts typically have fewer pulses than short-lag bursts,indicating that the two burst types are inherently different. In ad-dition, the rather small overlap in lag between GRBs of differentmorphological types indicates that most bursts with a specificmorphological type (e.g., narrow-pulsed bursts with complextime profiles) have lags that delineate them from bursts of a dif-ferent morphology (e.g., intermediate-pulse width bursts withcomplex time profiles). If cosmological time dilation were asimportant as the burst’s intrinsic characteristics, then the overlapin lag between the two morphological types should smear outthis delineation. Similarly, the relationship between the numberof pulses and the ILF suggests that this attribute is also primarilyintrinsic, and that viewing angle is probably less important thanjet structure in defining the observed number of pulses.It has also been shown that some GRB time history mor-
phologies are related to specific types of energy productionand outflow. Long GRBs with simple time histories (single- or
Fig. 1.—ILF curvature indices � vs. ILF power-law indices � for bursts mea-sured in channels 2+3 with thresholds set at 2 � above background and havingquality factors of 2. There is a strong correlation between the two attributes. ‘‘Short’’bursts are denoted as diamonds, while ‘‘Long’’ bursts are indicated by asterisks.
TABLE 7
Correlation between Curvature Coefficient � and Power-Law Index � ,Fitted by � ¼ A þ B�
Energy Channels Number of GRBs Intercept A Slope B
1.............................. 727 1:4062 � 0:0111 1:1838 � 0:00032.............................. 829 1:2721 � 0:0083 1:1216 � 0:0003
3.............................. 775 1:2881 � 0:0116 1:0943 � 0:0005
4.............................. 229 4:2464 � 0:1569 1:7585 � 0:00051+2 ......................... 889 1:3802 � 0:0076 1:1604 � 0:0003
2+3 ......................... 910 1:2496 � 0:0110 1:1010 � 0:0005
3+4 ......................... 704 1:2523 � 0:0126 1:0855 � 0:0005
1+2+3 ..................... 948 1:0728 � 0:0089 1:1029 � 0:00042+3+4 ..................... 861 1:2622 � 0:0009 1:1038 � 0:0004
1+2+3+4................. 924 1:3297 � 0:0103 1:1268 � 0:0004
Notes.—These results have been obtained for GRBs having high-quality ILFmeasurements (q ¼ 2) with a 64 ms flux cutoff at 1 � above threshold. The GRBsare further chosen so that their GRB class (e.g., Long or Short) can be identifiedvia T90 and HR3;21.
HAKKILA ET AL.68 Vol. 169

double-pulsed bursts) are more likely than complex bursts to beassociated with type Ibc supernovae (Bosnjak et al. 2006) and/orwith low-luminosity afterglows (Liang & Zhang 2006; Nardiniet al. 2006). Furthermore, long-lag bursts typically have lowerLorentz factors and broader jet opening angles than short-lagbursts (Norris 2002). Short-lag, long, complex bursts are expectedto have canonical afterglows and are unlikely to be associatedwith supernovae (Hakkila & Giblin 2006). This expected mor-
phology is relevant to the classification of Swift GRB 060614, anearby burst having all of these characteristics (Della Valle et al.2006; Gehrels et al. 2006; Cobb et al. 2006), and for which a newclassification scheme has been suggested because no supernovaaccompanied the burst. The observed characteristics of this burstare in agreement with its time history morphology (Hakkila &Giblin 2006), indicating that a new classification scheme is notneeded, and suggesting that a supernovawas not observed because
Fig. 3aFig. 3bFig. 3cFig. 3.—Time history (a) for channels 1 (lightest) to 4 (darkest), CCF forchannels 1 and 3 (b) and ILF (channel 2+3, 2 � measurement; c) for BATSETrigger 3035.
Fig. 3c
Fig. 3b
Fig. 3a
Fig. 2aFig. 2bFig. 2cFig. 2.—Time history (a) for channels 1 (lightest) to 4 (darkest), CCF forchannels 1 and 3 (b), and ILF (channel 2+3, 2 � measurement; c) for BATSETrigger 829.
Fig. 2a
Fig. 2b
Fig. 2c
BATSE ILF AND LAG DATABASE 69No. 1, 2007

the large Lorentz factor and narrow jet opening angle expectedfor this type of GRB is not conducive to supernova formation,rather than because a supernova fell below the detection limits.
We have attempted to use pattern recognition algorithms to ver-ify whether or not the ‘‘regions’’ containing GRBs having similartime history morphologies (Hakkila & Giblin 2006) actually rep-resent disparate classes of Long burst. In other words, wewantedto determine if GRBs cluster in ILF � versus lag31 space. Twounsupervised clusterers, the tree structure algorithm ESX (Roigeret al. 1999) and a Kohonen neural network (Kohonen 1982),were applied to the � , log T90, and lag31 data. An unsupervisedalgorithm is a data mining program that attempts to find clumpsor clusters within a data set that might be indicative of classstructure. Both clusterers ignored the lag attribute in the data set,and both delineated the data on the basis of ILF power-law index� and log T90. However, their results were neither consistent withone another nor could they reproduce groups corresponding tothe time history ‘‘regions’’ identified in Figure 8 below. A backpropagation neural network (Knight 1990) was then applied inan attempt to reproduce the morphological types shown in Fig-ure 8. This technique trains itself on data that are assumed to berepresentative of certain classes, then develops rules for identi-fying unknowns in this class. However, the back propagationneural network was unable to build an accurate model reproduc-ing the specified ‘‘regions.’’ This might indicate that the regionsdo not represent clusters within the data. It more likely indicatesthat duration, lag, and the ILF are inadequate in describing char-acteristics of time histories that the human eye sees as morpho-logically similar (e.g., see the figures in Hakkila & Giblin 2006).
3.1.2. Characteristics of Short GRBs
The ILFs and lags of the Short class of GRBs (Kouveliotouet al. 1993; Mukherjee et al. 1998; Hakkila et al. 2003a; Balazset al. 2004) deserve special attention (note: we assume that theintermediate class of GRBs is really only a subset of LongGRBs
and occurs as a result of selection effects; Hakkila et al. 2003a).On the 64 ms timescale, Short GRBs typically exhibit only a fewnarrow pulses. Thus, their ILF properties are similar to those ofshort FREDs and other simple, narrow-pulsed GRBs: they ex-hibit large ILF power-law indices (� � 0). Unlike FREDs, veryfew of them have nonzero lags (Norris & Bonnell 2006; Hakkila&Giblin 2006). Thus, in the� versus lag31 parameter space, ShortGRBs occupy a region also containing some short-lag FREDsand a few quiescent GRBs (discussed in x 3.3); this is demon-strated in Figure 8. Few Short bursts are visible in the plot becausemost have measured lags consistent with a mean of lag31h i � 0(within the measurement error); most have lags too small to bevisible on the log (lag31) plot, and the ones present appear torepresent the statistical tail of the distribution. Overall, it appearsthat the ILF and lag are able to discern the class of Short GRBs.The placement of Short GRBs in this diagram is likely due in
part to an instrumental bias resulting from the limited resolutionof the 64 ms data. Temporal variations shorter than 64 ms arecommonly found in Short GRBs (Norris 1994; Norris et al. 1996),and these variations are averaged out within individual 64 msbins (Lee & Petrosian 1996). This has the effect of diluting theILF variations and internal luminosity range, and increasing theILF to larger values. Thus, the ILF power-law indices of ShortGRBs are generally larger than they would be if higher time res-olution data were available. Short GRBs have lags that are tooshort to be measured with the 64 ms time resolution available,and thus almost always are measured to be zero seconds. WhenTTE data are used to measure the ILF values, some Short GRBsare found to have small, positive lags (Norris & Bonnell 2006).Thus, the ILF and lag properties of Short GRBs as obtained from64 ms data are unreliable and offer limited usefulness.
3.2. Correlative Properties of the GRB Lag and ILF Databases
Horack&Hakkila (1997) demonstrated that the ILF correlatesand/or anticorrelates with a variety of basic GRB properties,
Fig. 4.—ILF power law index � vs. 31 lag for 901 BATSE GRBs. Regions are identified in which GRBs are found to have similar time history morphologies.
HAKKILA ET AL.70 Vol. 169

including T90, hardness ratios, and fluence (time integrated flux)from a sample of 50 bright GRBs.
Figure 5 is a plot of the internal luminosity range R versusthe ILF power-law index � for a large burst sample. This figuredemonstrates that faint GRBs are morphologically different thanbright GRBs, because faint GRBs tend to have smaller �-valuesthan bright GRBs. GRBswith small� -values are associated eitherwith complex bursts having many short pulses or with LongSmooth bursts (Hakkila & Giblin 2006).
Figure 6 is a plot of the log (T90) duration versus ILF power-law index � for 891 GRBs. We note that the durations of theShort GRBs all have similar values of� near� � �1:5. A Spear-man rank order correlation test identifies the probability that theanticorrelation between � and log (T90) is random to be only p ¼4:7 ; 10�34. A linear fit to the relationship using singular valuedecomposition results in � ¼ �0:566� 2:061log (T90). How-ever, a linear fit does not completely capture the large spread in� -values observed, especially for T90 > 10 s. The reasons forthis are discussed in x 3.3.
Figure 7 is a plot of ILF power-law index � versus numberof pulses Npulses for 278 GRBs. An anticorrelation is observed,and verified with a Spearman rank order correlation test findinga probability that this correlation is random to be only p ¼8:1 ; 10�10. A linear fit to the relationship of the form results inthe best-fit relationship logNpulses ¼ �1:027� 1:253� . Thus, asmall ILF power-law index is an indicator for a large number ofpulses. The plot again has a very large spread in � , which isaddressed in x 3.3.
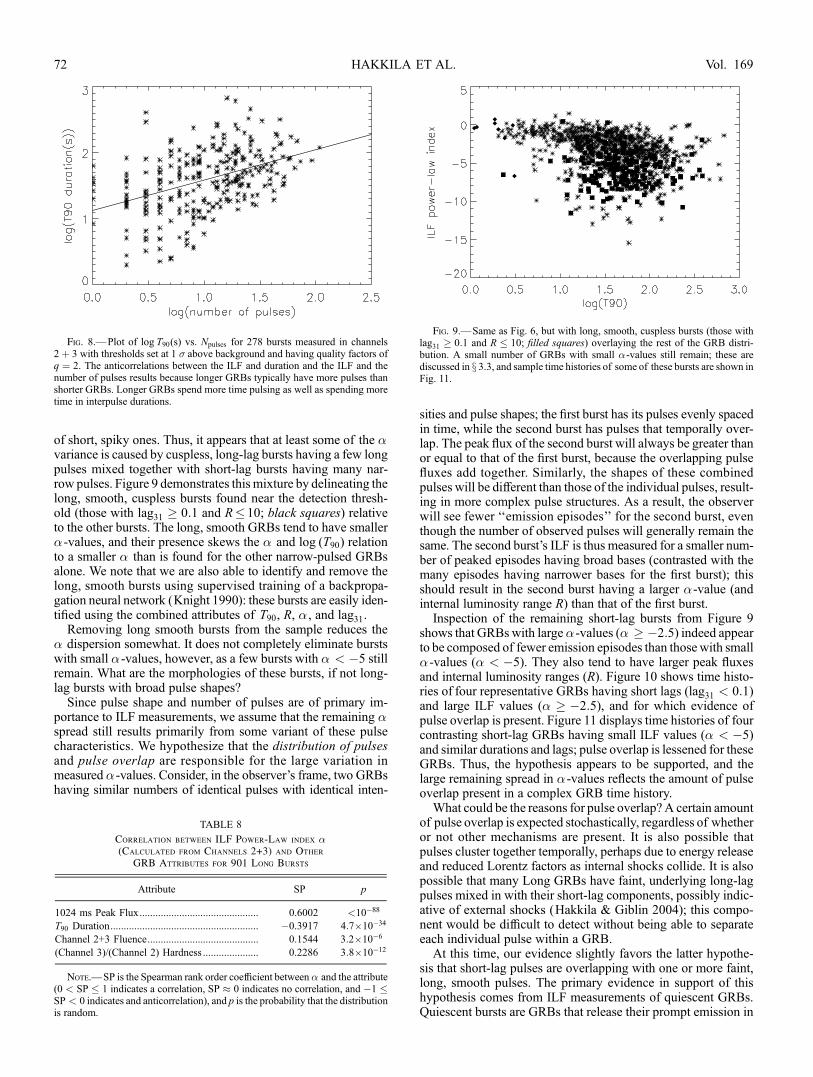
The anticorrelations demonstrated in Figures 6 and 7 implythat there should be a correlation between the number of pulsesin a GRB and its duration. Figure 8 is a plot of log (T90) durationvs. Npulses for 278 GRBs. A Spearman rank order correlation testfinds the probability that this correlation is random to be onlyp ¼ 2:3 ;10�15; this is similar to a result obtained indepen-dently by Quilligan et al. (2002). A linear fit to the relationshipof the form results in the best-fit relationship log (T90)¼1:120þ0:460 logNpulses, againwith a large spread in associated� -values.The explanation for the correlation is that longer GRBs havemore pulses, and more interpulse durations, than shorter GRBs.This also demonstrates that the ILF is sensitive to pulse structure.
Table 8 indicates correlations between � (based on chan-nel 2þ 3) and other key GRB attributes of peak flux, duration,fluence, and hardness. The strong correlation of � with peak flux
is similar to the correlation between � and R, and indicates thatfaint bursts have different morphological structures than brightbursts (see also Fig. 5). The strong correlation between� and spec-tral hardness is another indicator that burst morphology changesas a function of peak flux, since faint Long GRBs are typicallysofter than bright Long GRBs (Mallozzi et al. 1995). The mod-erately strong correlation between � and fluence is a mixture ofthe strong correlation between � and peak flux and the stronganticorrelation between � and T90, since fluence contains someoverlap with both of these properties.
3.3. Pulse Morphologies of Long GRBs
The correlations between � , T90, and Npulses shown in Fig-ures 6, 7, and 8 all exhibit large data spreads, suggesting that someadditional parameter is present that prevents the bursts from fol-lowing a tight-knit relationship. Figure 4 demonstrates that, forlong-lag bursts, pulse shape is clearly a contributor to this spread,because small � -values can be produced by a burst composed oflong-lag, cuspless pulses or by a burst made up of a large number
Fig. 6.—ILF power-law index � vs. log T90(s) for bursts measured in chan-nels 2þ 3 with thresholds set at 1 � above background and having quality factorsof q ¼ 2. Short bursts are identified by diamonds. There is a strong anticorrelationof � with T90, such that a large � -value generally indicates a shorter burst, whilea small� -value indicates a longer burst. The solid line represents the best fit to thedata (described in the text).
Fig. 7.—ILF power-law index � vs. Number of pulsesNpulses for Long burstsmeasured in channels 2þ 3 with thresholds set at 1 � above background andhaving quality factors of 2. There is a strong anticorrelation of � withNpulses, suchthat a small � -value generally indicates a large number of pulses, while a large� -value indicates a small number of pulses.
Fig. 5.—Internal luminosity range R vs. ILF power-law index � for Short(diamonds) and Long (asterisks) bursts measured in channels 2þ 3 with thresh-olds set at 1 � above background and having quality factors of q ¼ 2.
BATSE ILF AND LAG DATABASE 71No. 1, 2007
of short, spiky ones. Thus, it appears that at least some of the �variance is caused by cuspless, long-lag bursts having a few longpulses mixed together with short-lag bursts having many nar-row pulses. Figure 9 demonstrates thismixture by delineating thelong, smooth, cuspless bursts found near the detection thresh-old (those with lag31 � 0:1 and R�10; black squares) relativeto the other bursts. The long, smooth GRBs tend to have smaller� -values, and their presence skews the � and log (T90) relationto a smaller � than is found for the other narrow-pulsed GRBsalone. We note that we are also able to identify and remove thelong, smooth bursts using supervised training of a backpropa-gation neural network (Knight 1990): these bursts are easily iden-tified using the combined attributes of T90, R, � , and lag31.
Removing long smooth bursts from the sample reduces the� dispersion somewhat. It does not completely eliminate burstswith small � -values, however, as a few bursts with � < �5 stillremain. What are the morphologies of these bursts, if not long-lag bursts with broad pulse shapes?
Since pulse shape and number of pulses are of primary im-portance to ILF measurements, we assume that the remaining �spread still results primarily from some variant of these pulsecharacteristics. We hypothesize that the distribution of pulsesand pulse overlap are responsible for the large variation inmeasured � -values. Consider, in the observer’s frame, two GRBshaving similar numbers of identical pulses with identical inten-
sities and pulse shapes; the first burst has its pulses evenly spacedin time, while the second burst has pulses that temporally over-lap. The peak flux of the second burst will always be greater thanor equal to that of the first burst, because the overlapping pulsefluxes add together. Similarly, the shapes of these combinedpulses will be different than those of the individual pulses, result-ing in more complex pulse structures. As a result, the observerwill see fewer ‘‘emission episodes’’ for the second burst, eventhough the number of observed pulses will generally remain thesame. The second burst’s ILF is thus measured for a smaller num-ber of peaked episodes having broad bases (contrasted with themany episodes having narrower bases for the first burst); thisshould result in the second burst having a larger �-value (andinternal luminosity range R) than that of the first burst.Inspection of the remaining short-lag bursts from Figure 9
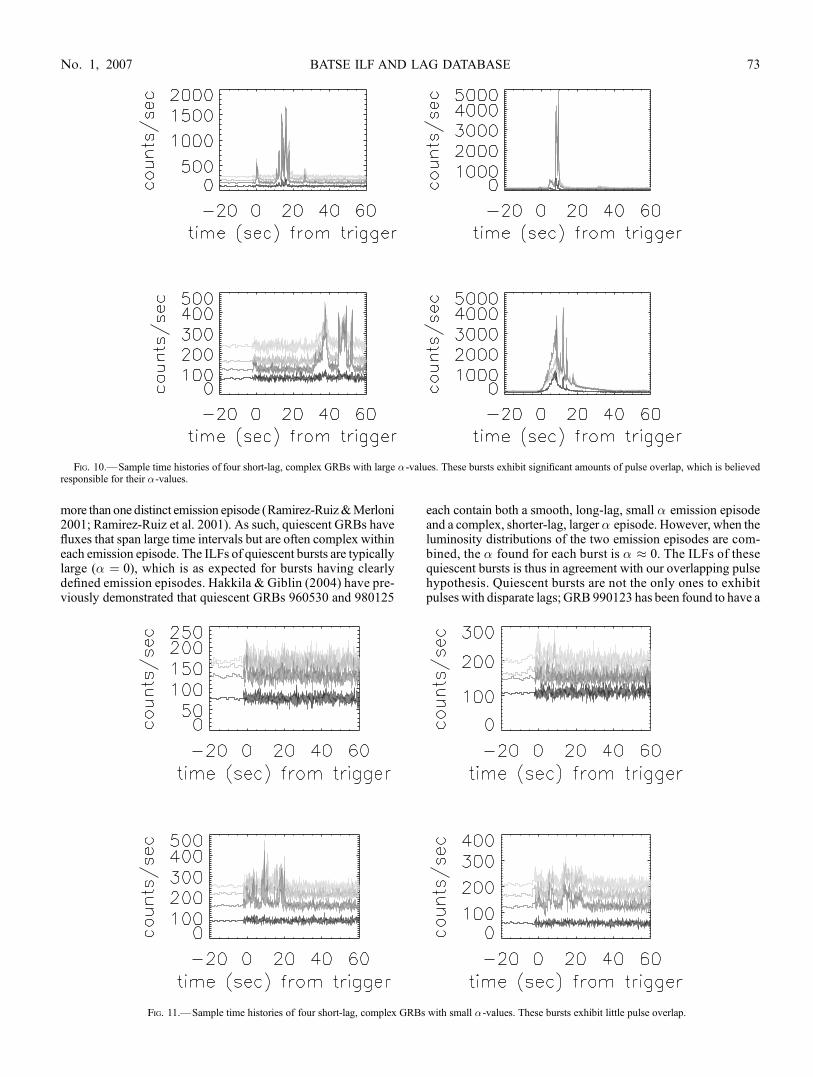
shows that GRBswith large� -values (� � �2:5) indeed appearto be composed of fewer emission episodes than those with small� -values (� < �5). They also tend to have larger peak fluxesand internal luminosity ranges (R). Figure 10 shows time histo-ries of four representative GRBs having short lags (lag31 < 0:1)and large ILF values (� � �2:5), and for which evidence ofpulse overlap is present. Figure 11 displays time histories of fourcontrasting short-lag GRBs having small ILF values (� < �5)and similar durations and lags; pulse overlap is lessened for theseGRBs. Thus, the hypothesis appears to be supported, and thelarge remaining spread in � -values reflects the amount of pulseoverlap present in a complex GRB time history.What could be the reasons for pulse overlap?A certain amount
of pulse overlap is expected stochastically, regardless of whetheror not other mechanisms are present. It is also possible thatpulses cluster together temporally, perhaps due to energy releaseand reduced Lorentz factors as internal shocks collide. It is alsopossible that many Long GRBs have faint, underlying long-lagpulses mixed in with their short-lag components, possibly indic-ative of external shocks (Hakkila & Giblin 2004); this compo-nent would be difficult to detect without being able to separateeach individual pulse within a GRB.At this time, our evidence slightly favors the latter hypothe-
sis that short-lag pulses are overlapping with one or more faint,long, smooth pulses. The primary evidence in support of thishypothesis comes from ILF measurements of quiescent GRBs.Quiescent bursts are GRBs that release their prompt emission in
Fig. 8.—Plot of log T90(s) vs. Npulses for 278 bursts measured in channels2þ 3 with thresholds set at 1 � above background and having quality factors ofq ¼ 2. The anticorrelations between the ILF and duration and the ILF and thenumber of pulses results because longer GRBs typically have more pulses thanshorter GRBs. Longer GRBs spend more time pulsing as well as spending moretime in interpulse durations.
TABLE 8
Correlation between ILF Power-Law index �(Calculated from Channels 2+3) and Other
GRB Attributes for 901 Long Bursts
Attribute SP p
1024 ms Peak Flux............................................. 0.6002 <10�88
T90 Duration........................................................ �0.3917 4:7 ; 10�34
Channel 2+3 Fluence.......................................... 0.1544 3:2 ; 10�6
(Channel 3)/(Channel 2) Hardness ..................... 0.2286 3:8 ; 10�12
Note.—SP is the Spearman rank order coefficient between � and the attribute(0 < SP � 1 indicates a correlation, SP � 0 indicates no correlation, and �1 �SP < 0 indicates and anticorrelation), and p is the probability that the distributionis random.
Fig. 9.—Same as Fig. 6, but with long, smooth, cuspless bursts (those withlag31 � 0:1 and R � 10; filled squares) overlaying the rest of the GRB distri-bution. A small number of GRBs with small � -values still remain; these arediscussed in x 3.3, and sample time histories of some of these bursts are shown inFig. 11.
HAKKILA ET AL.72 Vol. 169
more than one distinct emission episode (Ramirez-Ruiz&Merloni2001; Ramirez-Ruiz et al. 2001). As such, quiescent GRBs havefluxes that span large time intervals but are often complex withineach emission episode. The ILFs of quiescent bursts are typicallylarge (� ¼ 0), which is as expected for bursts having clearlydefined emission episodes. Hakkila & Giblin (2004) have pre-viously demonstrated that quiescent GRBs 960530 and 980125
each contain both a smooth, long-lag, small � emission episodeand a complex, shorter-lag, larger� episode. However, when theluminosity distributions of the two emission episodes are com-bined, the � found for each burst is � � 0. The ILFs of thesequiescent bursts is thus in agreement with our overlapping pulsehypothesis. Quiescent bursts are not the only ones to exhibitpulses with disparate lags; GRB 990123 has been found to have a
Fig. 10.—Sample time histories of four short-lag, complex GRBs with large � -values. These bursts exhibit significant amounts of pulse overlap, which is believedresponsible for their �-values.
Fig. 11.—Sample time histories of four short-lag, complex GRBs with small � -values. These bursts exhibit little pulse overlap.
BATSE ILF AND LAG DATABASE 73No. 1, 2007

long-lag component embedded within its complex time history(Norris et al. 2000). Long-lag emission has additionally beenseen in the decaying tails of bursts such as GRB 991216 (Hakkila& Giblin 2004).
4. CONCLUSIONS AND FUTURE WORK
The lag and the ILF are valuable tools for discerning bothcorrelative and clustering GRB behaviors. To this end, we haveproduced our catalog of ILF and lag values for BATSE bursts.Many of the data products made available here have not beenfully explored; this pertains particularly to the energy dependenceof these attributes. Similarly, correlations with the attributes toother attributes outside the BATSE database have yet to be stud-ied. Despite the limited analyses that have been performed usingILF and lag data, a large number of correlations have alreadybeen identified; these likely relate to physical conditions such asDoppler boost factor �, jet opening angle, and physical condi-
tions (e.g., metallicity and ejecta viscosity) within the progenitors(e.g., Quilligan et al. 2002; McBreen et al. 2002). Furthermore,the attributes of lag and ILF are also useful for predicting GRBtime history morphologies; this includes relating the morphol-ogies to pulse structure. At this time, it is not known whether ornot these morphologies represent classes: this hypothesis is stillbeing explored. It is hoped that this database, along with the suiteof data mining tools available, will prove useful to GRB inves-tigators and thus assist future GRB studies.
We gratefully acknowledge the assistance of T.M. Freismuth,A. J. Sprague,H. Skelton,M.D.Creech,M.Gaultney,W.Moultrie,A. Stallworth, and J. C. Almeter in calculating lags and ILF val-ues. We also thank the anonymous referee for comments thatgreatly strengthened the discussion in this paper. This work wassupported by NSF grant AST 00-98499.
REFERENCES
Balazs, L. G., Bagoly, Z., Horvath, I., Meszaros, A., & Meszaros, P. 2004,Baltic Astron., 13, 207
Band, D. L. 1997, ApJ, 486, 928Bosnjak, Z., Celotti, A., Ghirlanda, G., Della Valle, M., & Pian, E. 2006, A&A,447, 121
Cobb, B. E., Bailyn, C. D., van Dokkum, P. G., & Natarajan, P. 2006, ApJ, 651,L85
Connaughton, V. 2002, ApJ, 567, 1028Daigne, F., & Mochkovitch, R. 1998, MNRAS, 296, 275Della Valle, M., et al. 2006, Nature, 444, 1050Donaghy, T. Q., et al. 2006, ApJ, submitted (astro-ph /0605570)Eichler, D., Livio, M., Piran, T., & Schramm, D. N. 1989, Nature, 340, 126Gehrels, N., et al. 2006, Nature, in press (astro-ph /0610635)Giblin, T. W., Connaughton, V., van Paradijs, J., Preece, R. D., Briggs, M. S.,Kouveliotou, C., Wijers, R. A. M. J., & Fishman, G. J. 2002, ApJ, 570, 573
Giblin, T. W., Hakkila, J., Haglin, D. J., & Roiger, R. J. 2004, in AIP Conf.Proc. 727, Gamma-Ray Bursts: 30 Years of Discovery, ed. E. E. Fenimore &M. Galassi (Melville: AIP), 585
Goodman, J. 1986, ApJ, 308, L47Haglin, D. J., Roiger, R. J., Hakkila, J., Pendleton, G. N., & Mallozzi, R. 2000,in AIP Conf. Proc. 526, 5th Huntsville Symp. on Gamma-Ray Bursts, ed.R. M. Kippen et al. (Melville: AIP), 877
Haglin, D. J., Roiger, R. J., Hakkila, J., & Giblin, T. W. 2005, Data Sci. J., 4, 39Hakkila, J., Giblin, T. W., Roiger, R. J., Haglin, D. J., Paciesas, W. S., &Meegan, C. A. 2003a, ApJ, 582, 320
Hakkila, J., Haglin, D. J., Roiger, R. J., Giblin, T. W., Paciesas, W. S., &Meegan, C. A. 2003b, in AIP Conf. Proc. 662, Gamma-Ray Burst andAfterglow Astronomy 2001, ed. G. R. Ricker & R. K. Vanderspek (Melville:AIP), 556
Hakkila, J., & Giblin, T. W. 2004, ApJ, 610, 361———. 2006, ApJ, 646, 1086Horack, J. M., & Hakkila, J. 1997, ApJ, 479, 371Kaneko, Y., Preece, R. D., Briggs, M. S., Paciesas, W. S., Meegan, C. A., &Band, D. L. 2006, ApJS, 166, 298
Katz, J. I., & Canel, L. M. 1996, ApJ, 471, 915Knight, K. 1990, Commun. ACM, 33, 59Kohonen, T. 1982, Proc. Sixth International Conference on Pattern RecognitionClustering, Taxonomy, and Topological Maps of Patterns, ed. M. Lang(Silver Springs: IEEE), 114
Kouveliotou, C., Meegan, C. A., Fishman, G. J., Bhat, N. P., Briggs, M. S.,Koshut, T. M., Paciesas, W. S., & Pendleton, G. N. 1993, ApJ, 413, L101
Lee, T. T., & Petrosian, V. 1996, ApJ, 470, 479Liang, E., & Zhang, B. 2006, ApJ, 638, L67Lyutikov, M., & Blandford, R. 2003, preprint (astro-ph /0312347)Mallozzi, R. S., Paciesas, W. S., Pendleton, G. N., Briggs, M. S., Preece, R. D.,Meegan, C. A., & Fishman, G. J. 1995, ApJ, 454, 597
McBreen, S., McBreen, B., Quilligan, F., & Hanlon, L. 2002, A&A, 385, L19MacFadyen, A. I., Ramirez-Ruiz, E., & Zhang, W. 2005, preprint (astro-ph /0510192)
Meszaros, P., & Rees, M. J. 1992, ApJ, 397, 570Mukherjee, S., Feigelson, E. D., Jogesh Babu, G., Murtagh, F., Fraley, C., &Raftery, A. 1998, ApJ, 508, 314
Nakar, E., & Piran, T. 2002a, MNRAS, 330, 920———. 2002b, ApJ, 572, L139Narayan, R., Paczynski, B., & Piran, T. 1992, ApJ, 395, L83Nardini, M., Ghisellini, G., Ghirlanda, G., Tavecchio, F., Firmani, C., &Lazzati, D. 2006, A&A, 451, 821
Norris, J. P. 1994, AIP Conf. Proc. 307, Gamma-Ray Bursts, ed. G. J. Fishman(Melville: AIP), 177
———. 2002, ApJ, 579, 386Norris, J. P., & Bonnell, J. T. 2006, ApJ, 643, 266Norris, J. P., Marani, G. F., & Bonnell, J. T. 2000, ApJ, 534, 248Norris, J. P., Nemiroff, R. J., Bonnell, J. T., Scargle, J. D., Kouveliotou, C.,Paciesas, W. S., Meegan, C. A., & Fishman, G. J. 1996, ApJ, 459, 393
Norris, J. P., Nemiroff, R. J., Davis, S. P., Kouveliotou, C., Fishman, G. J.,Meegan, C. A., & Paciesas, W. S. 1994, in AIP Conf. Proc. 307, Gamma-RayBursts, ed. G. J. Fishman (Melville: AIP), 172
Paczynski, B. 1990, ApJ, 348, 485Pendleton, G. N., et al. 1997, ApJ, 489, 175Quilligan, F., McBreen, B., Hanlon, L., McBreen, S., Hurley, K. J., &Watson, D. 2002, A&A, 385, 377
Ramirez-Ruiz, E., & Fenimore, E. E. 2000, ApJ, 539, 712Ramirez-Ruiz, E., & Merloni, A. 2001, MNRAS, 320, L25Ramirez-Ruiz, E., Merloni, A., & Rees, M. J. 2001, MNRAS, 324, 1147Reichart, D. E., Lamb, D. Q., Fenimore, E. E., Ramirez-Ruiz, E., Cline, T. L.,& Hurley, K. 2001, ApJ, 552, 57
Roiger, R. J., Geatz, M. W., Haglin, D. J., & Hakkila, J. 1999, in Proc. FederalData Mining Symp. and Exposition, ed. W. T. Price (Fairfax: AFCEA In-ternational ), 109
Stallworth, A. D., Hakkila, J., & Giblin, T. W. 2003, BAAS, 35, 764Wu, B., & Fenimore, E. 2000, ApJ, 535, L29
HAKKILA ET AL.74