a future ”co2 free” power plant for coal technology and
TRANSCRIPT
Lars Stromberg 2004
© Vattenfall AB
A future ”CO2 Free” Power Plant for Coal Technology and Economics
The annual fall meeting of the German Physical Society
Bad Honnef, October 21-22, 2004
Lars StrömbergVattenfall AB
Group Function StrategyBerlin/Stockhom

Lars Stromberg 2004
© Vattenfall AB
2 The Vattenfall Group
• Vattenfall is one of the major Energy companies in Europe
• Vattenfall sells about 180 TWh electricity– The main part is produced by hydropower, nuclear power, coal and
natural gas.– A smaller part is produced by biofuels and wind power– About 17 TWh is produced in combined heat and power plants
• Vattenfall also sell about 37 TWh heat – The main part is produced by biofuels, coal and gas in cogeneration plants
• Vattenfall emits almost 80 million tons of CO2 per annum
Lars Stromberg 2004
© Vattenfall AB
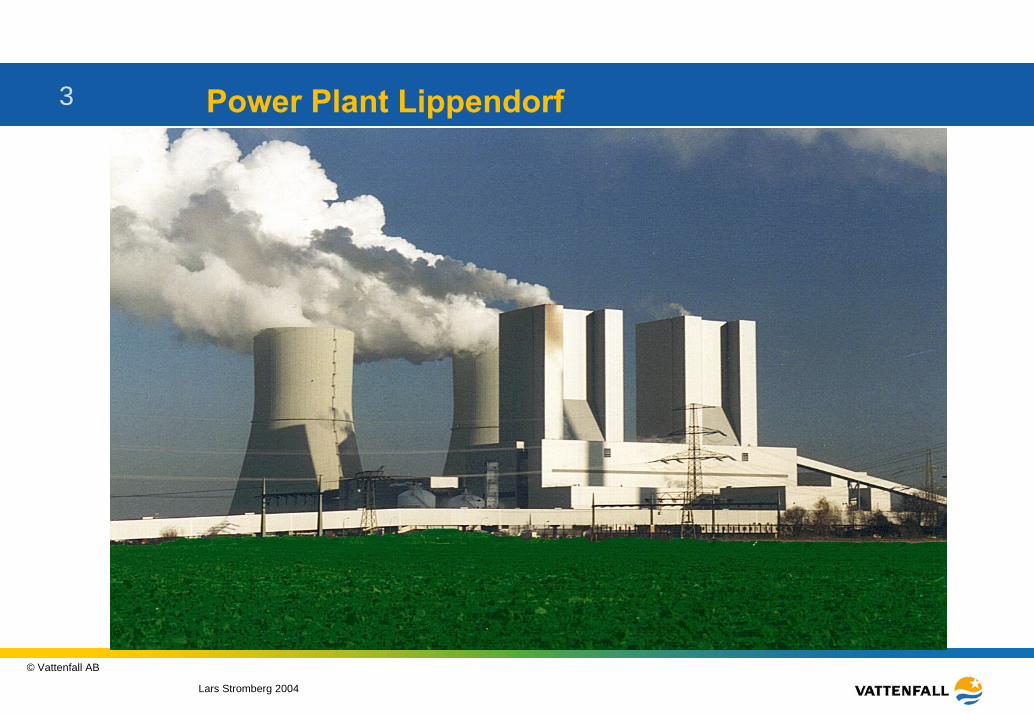
3 Power Plant Lippendorf
Lars Stromberg 2004
© Vattenfall AB
4 CO2 free power plant
Fossil fuels are needed

Lars Stromberg 2004
© Vattenfall AB
5 Need for new capacity in Europe (EU 15)
Equals about 350 BCM/year of gas
Source: VGB PowerTech Annual Report 2002 / 2003 + EU and Eurelectric
Lars Stromberg 2004
© Vattenfall AB
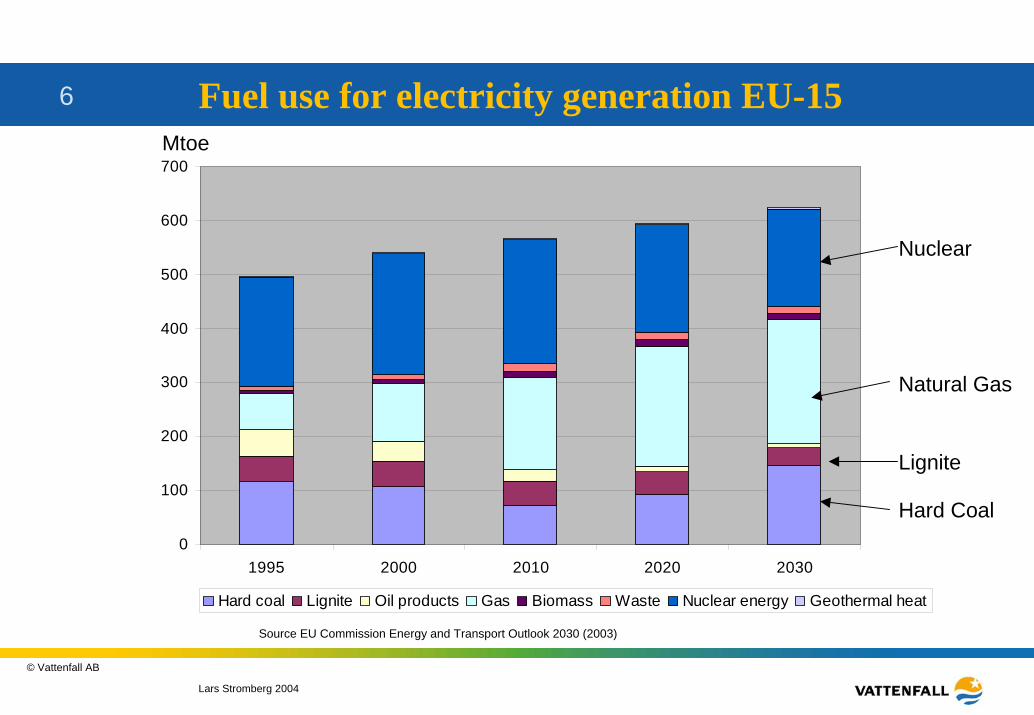
6 Fuel use for electricity generation EU-15
0
100
200
300
400
500
600
700
1995 2000 2010 2020 2030
Hard coal Lignite Oil products Gas Biomass Waste Nuclear energy Geothermal heat
Mtoe
Nuclear
Natural Gas
Lignite
Hard Coal
Source EU Commission Energy and Transport Outlook 2030 (2003)
Lars Stromberg 2004
© Vattenfall AB
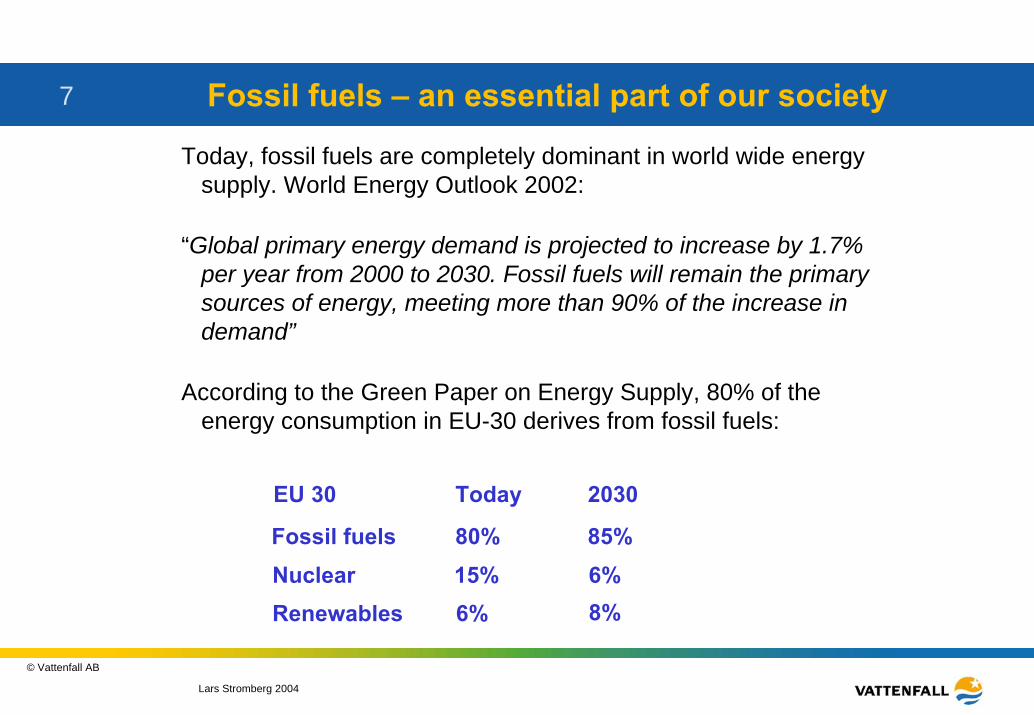
7 Fossil fuels – an essential part of our society
Today, fossil fuels are completely dominant in world wide energy supply. World Energy Outlook 2002:
“Global primary energy demand is projected to increase by 1.7% per year from 2000 to 2030. Fossil fuels will remain the primarysources of energy, meeting more than 90% of the increase in demand”
According to the Green Paper on Energy Supply, 80% of the energy consumption in EU-30 derives from fossil fuels:
EU 30 Today 2030
Fossil fuels 80% 85%Nuclear 15% 6%
8%Renewables 6%
Lars Stromberg 2004
© Vattenfall AB
8 CO2 free power plant
The big challenge for Coalis the CO2 issue
Lars Stromberg 2004
© Vattenfall AB
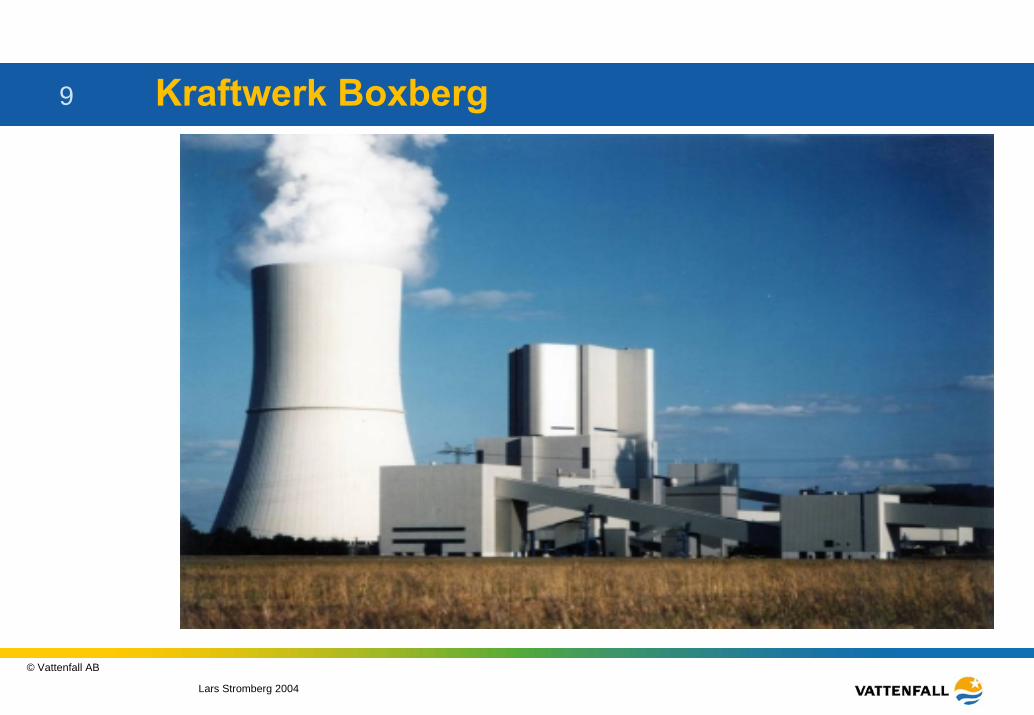
9 Kraftwerk Boxberg
Lars Stromberg 2004
© Vattenfall AB
10 The challenge for Coal
Coal is a very good fuel …..– It is very easy to burn and it is safe to store and transport – The cost is low and stable. It costs less than half compared with gas and it is
available all over the world.
Modern technology allow us to….– Eliminate almost all emissions of “conventional” pollutants as sulfur and
nitrogen oxides, hydrocarbons and particulates, it is only a matter of cost.– Get a very high efficiency (over 45 %)If the trading system prevails
The big challenge for Coal is the carbon dioxide emission. If this can be eliminated we can utilize coal with confidence without endangering the Climate

Lars Stromberg 2004
© Vattenfall AB
11 Emission Trading
Emission Trading sets the commercial framework for new technology
Lars Stromberg 2004
© Vattenfall AB
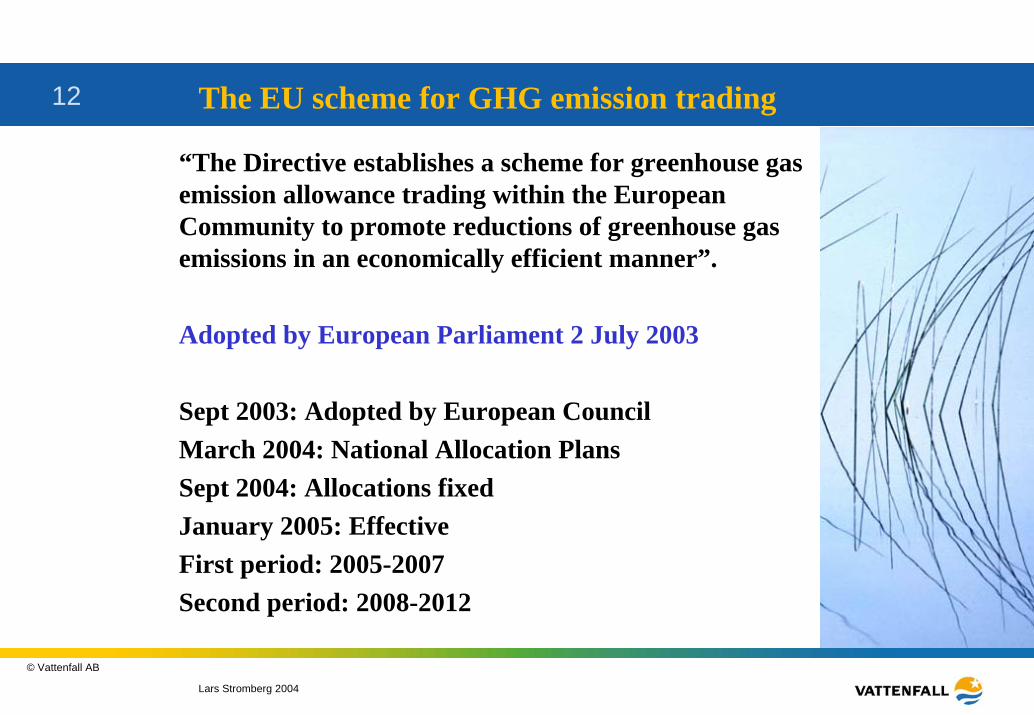
12 The EU scheme for GHG emission trading
“The Directive establishes a scheme for greenhouse gas emission allowance trading within the European Community to promote reductions of greenhouse gas emissions in an economically efficient manner”.
Adopted by European Parliament 2 July 2003
Sept 2003: Adopted by European CouncilMarch 2004: National Allocation PlansSept 2004: Allocations fixedJanuary 2005: EffectiveFirst period: 2005-2007Second period: 2008-2012
Lars Stromberg 2004
© Vattenfall AB
13 The EU emission trading system
The long term price of the allowances will be set by reduction requirements and the costs of physical reduction
As emission allowances become scarce they will have an increasing value
The cost for allowances will be added as a direct marginal production cost and therefore increase the spot price of electricity
Lars Stromberg 2004
© Vattenfall AB
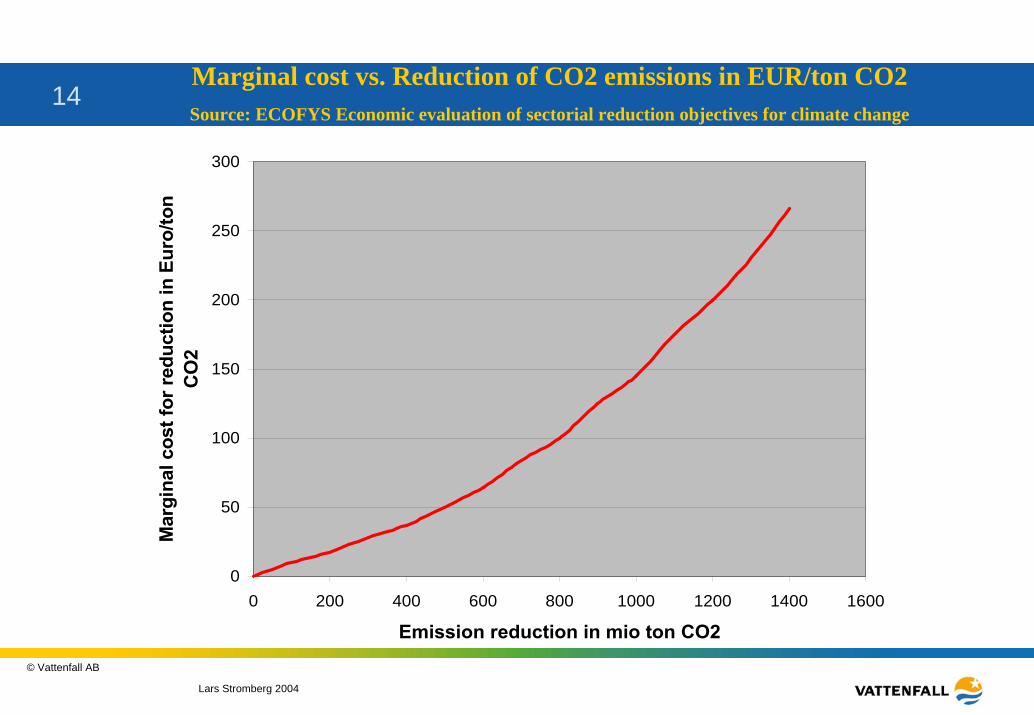
14Marginal cost vs. Reduction of CO2 emissions in EUR/ton CO2Source: ECOFYS Economic evaluation of sectorial reduction objectives for climate change
0
50
100
150
200
250
300
0 200 400 600 800 1000 1200 1400 1600
Emission reduction in mio ton CO2
Mar
gina
l cos
t for
redu
ctio
n in
Eur
o/to
n C
O2
Lars Stromberg 2004
© Vattenfall AB
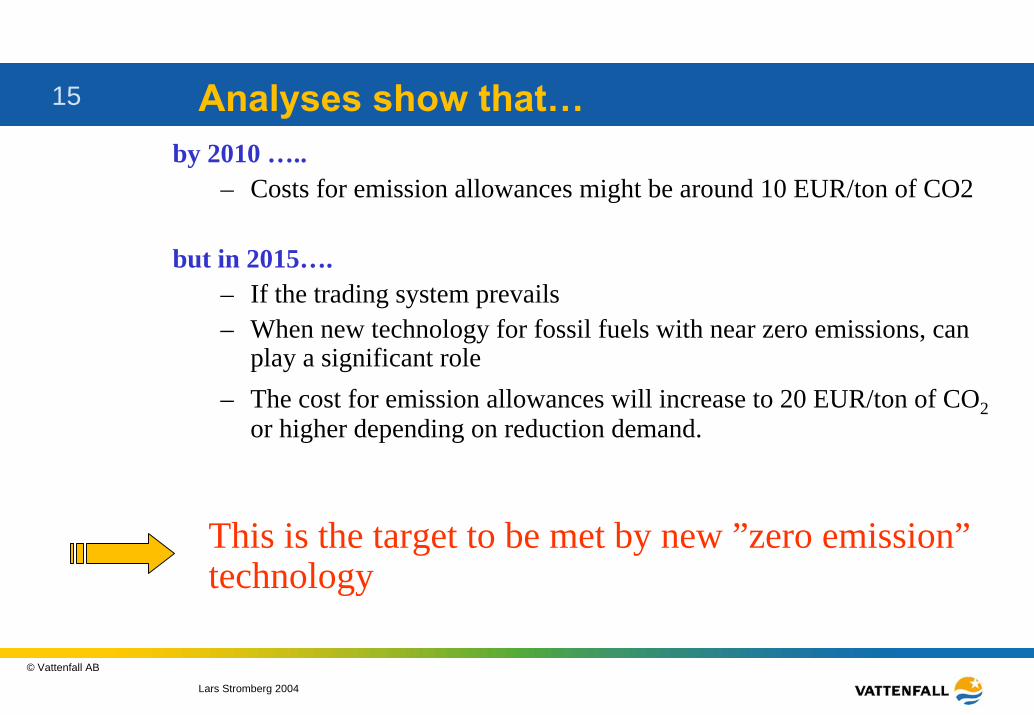
15 Analyses show that…by 2010 …..
– Costs for emission allowances might be around 10 EUR/ton of CO2
but in 2015….– If the trading system prevails – When new technology for fossil fuels with near zero emissions, can
play a significant role– The cost for emission allowances will increase to 20 EUR/ton of CO2
or higher depending on reduction demand.
This is the target to be met by new ”zero emission” technology
Lars Stromberg 2004
© Vattenfall AB
16 Capture and storage of CO2
Capture and storage
Lars Stromberg 2004
© Vattenfall AB
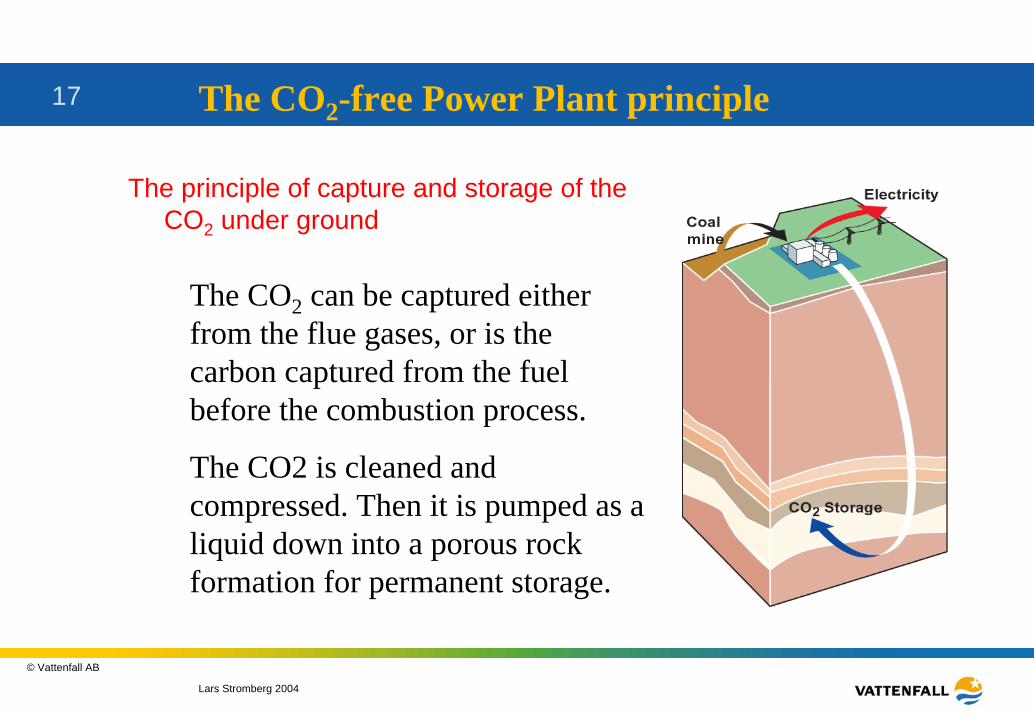
17 The CO2-free Power Plant principle
The principle of capture and storage of the CO2 under ground
The CO2 can be captured either from the flue gases, or is the carbon captured from the fuel before the combustion process.
The CO2 is cleaned and compressed. Then it is pumped as a liquid down into a porous rock formation for permanent storage.

Lars Stromberg 2004
© Vattenfall AB
18 CO2 Capture and storage
Lars Stromberg 2004
© Vattenfall AB
19 CO2 free power plant
Storage

Lars Stromberg 2004
© Vattenfall AB
20
Storage Capacity, saline aquifers
Specific problems:
• structurally complex
• thickness variation
• porosity variation
• residual saturation
Source:
Franz May,
Peter Gerling,
Paul Krull
Bundesanstalt für Geowissenschaften und Rohstoffe, Hannover
Lars Stromberg 2004
© Vattenfall AB
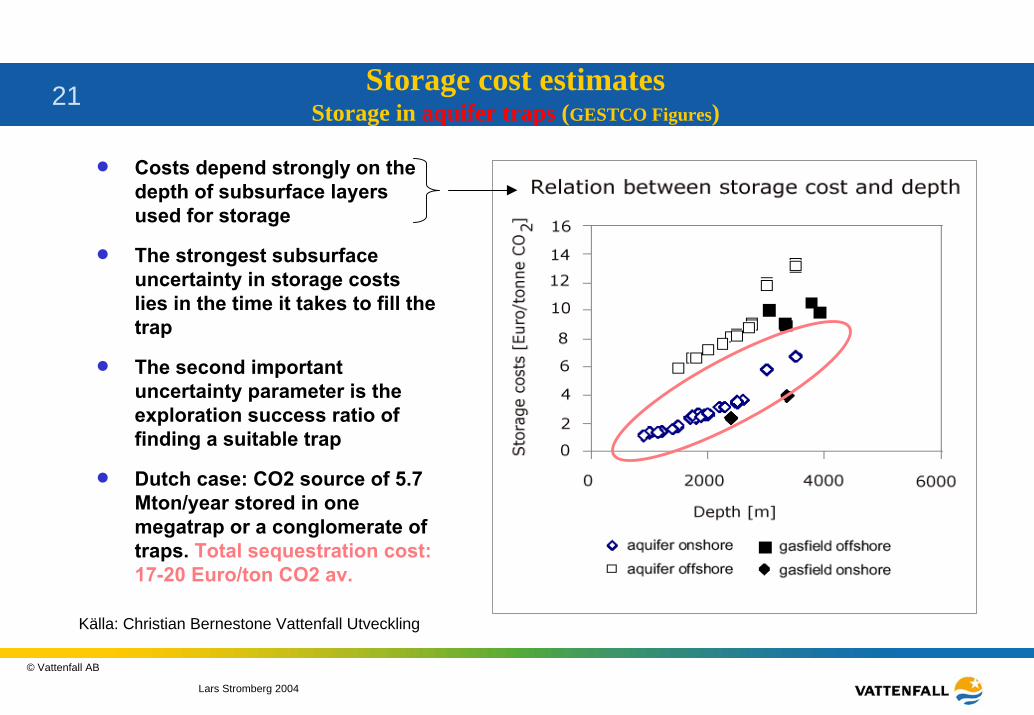
21 Storage cost estimatesStorage in aquifer traps (GESTCO Figures)
n Costs depend strongly on the depth of subsurface layers used for storage
n The strongest subsurface uncertainty in storage costs lies in the time it takes to fill the trap
n The second important uncertainty parameter is the exploration success ratio of finding a suitable trap
n Dutch case: CO2 source of 5.7 Mton/year stored in one megatrap or a conglomerate of traps. Total sequestration cost: 17-20 Euro/ton CO2 av.
Källa: Christian Bernestone Vattenfall Utveckling
Lars Stromberg 2004
© Vattenfall AB
22 CO2 free power plant
Transport

Lars Stromberg 2004
© Vattenfall AB
23 CO2 pipelines in operation in the USA
Lars Stromberg 2004
© Vattenfall AB
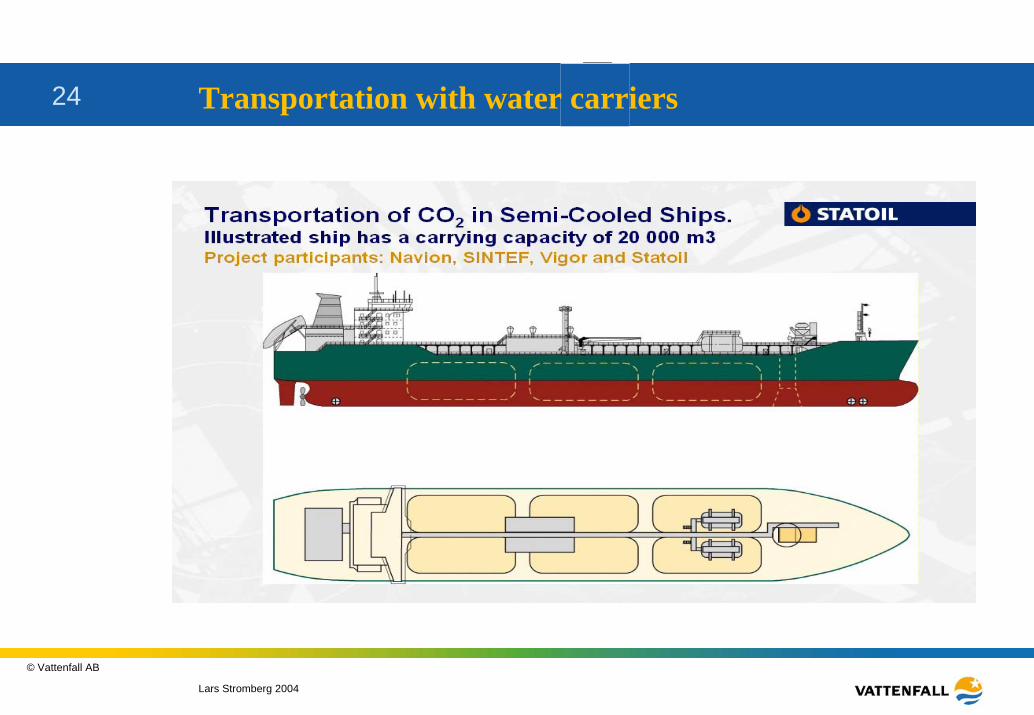
24 Transportation with water carriers

Lars Stromberg 2004
© Vattenfall AB
25 Transport costs for CO2Cost and capacity ranges
Source: Odenberger M, Svensson R, Analysis of Transportation Systems for CO2, Chalmers, 2003

Lars Stromberg 2004
© Vattenfall AB
26 CO2 free power plant
Capture

Lars Stromberg 2004
© Vattenfall AB
27 CO2 free power plant
Different ways to capturethe CO2 – minimizecosts
Lars Stromberg 2004
© Vattenfall AB
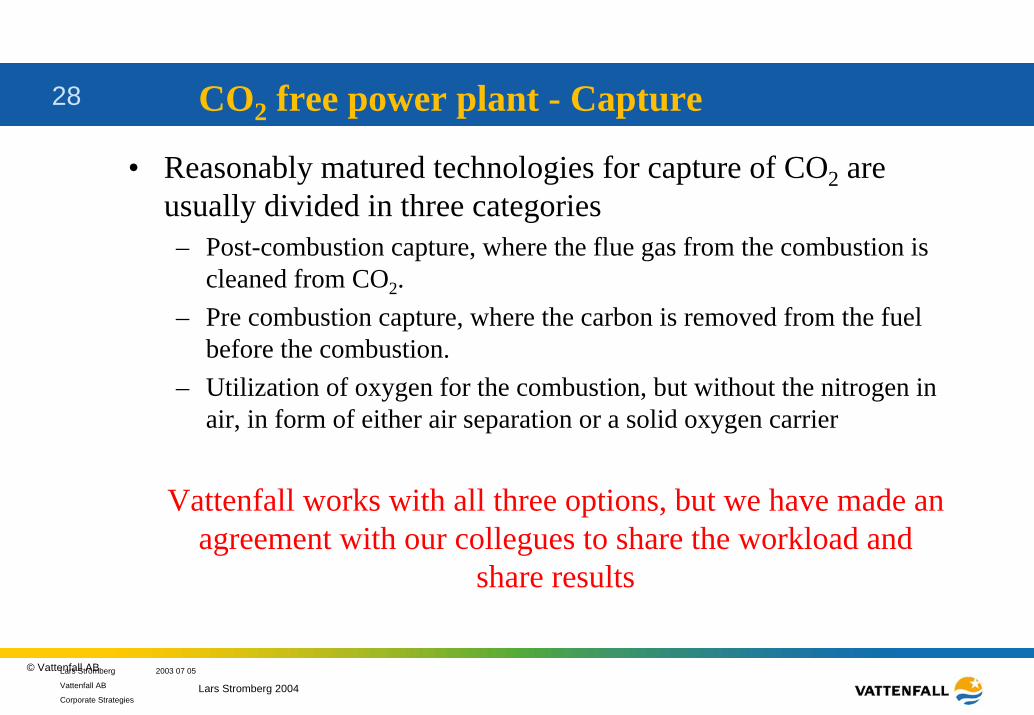
28 CO2 free power plant - Capture
• Reasonably matured technologies for capture of CO2 areusually divided in three categories– Post-combustion capture, where the flue gas from the combustion is
cleaned from CO2.– Pre combustion capture, where the carbon is removed from the fuel
before the combustion. – Utilization of oxygen for the combustion, but without the nitrogen in
air, in form of either air separation or a solid oxygen carrier
Vattenfall works with all three options, but we have made an agreement with our collegues to share the workload and
share results
Lars Strömberg 2003 07 05
Vattenfall AB
Corporate Strategies
Lars Stromberg 2004
© Vattenfall AB
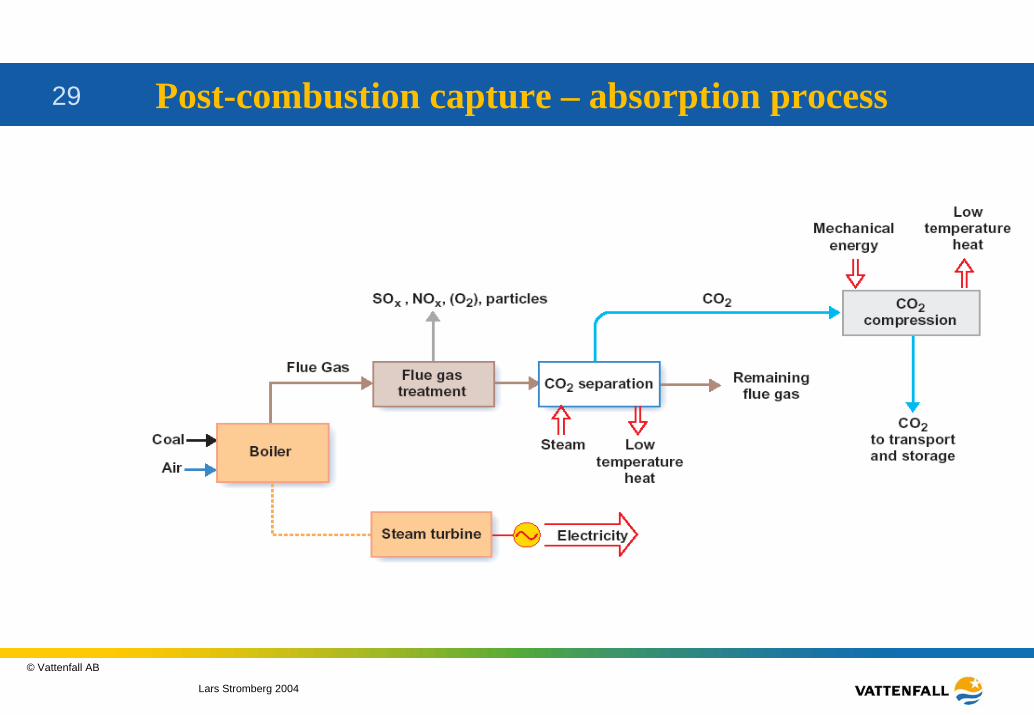
29 Post-combustion capture – absorption process
Lars Stromberg 2004
© Vattenfall AB
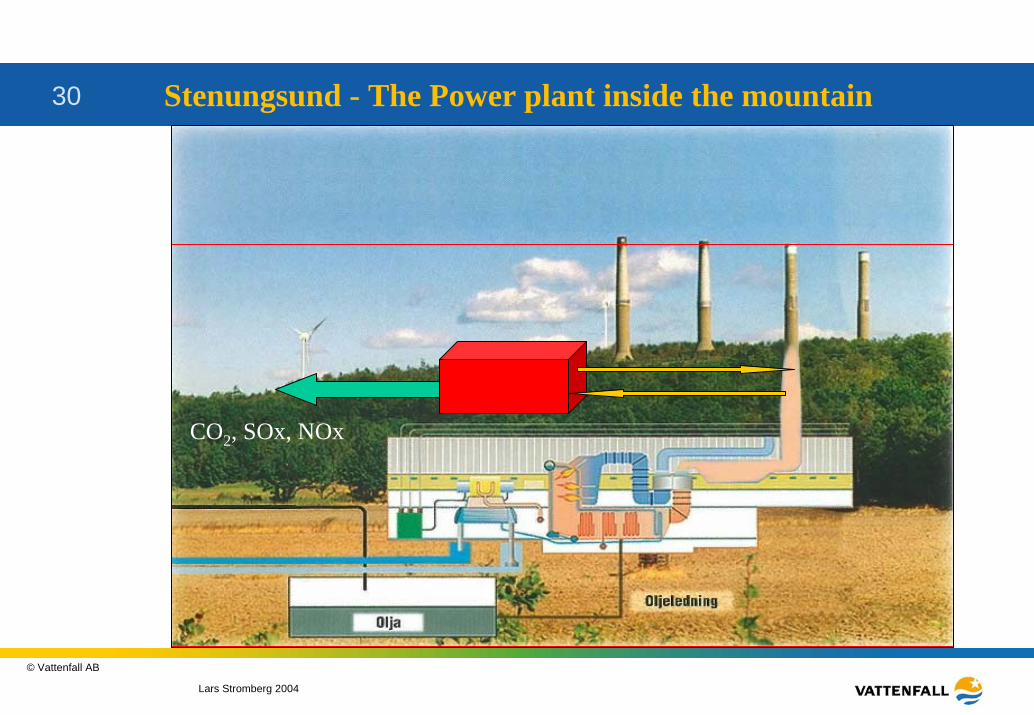
30 Stenungsund - The Power plant inside the mountain
CO2, SOx, NOx
Lars Stromberg 2004
© Vattenfall AB
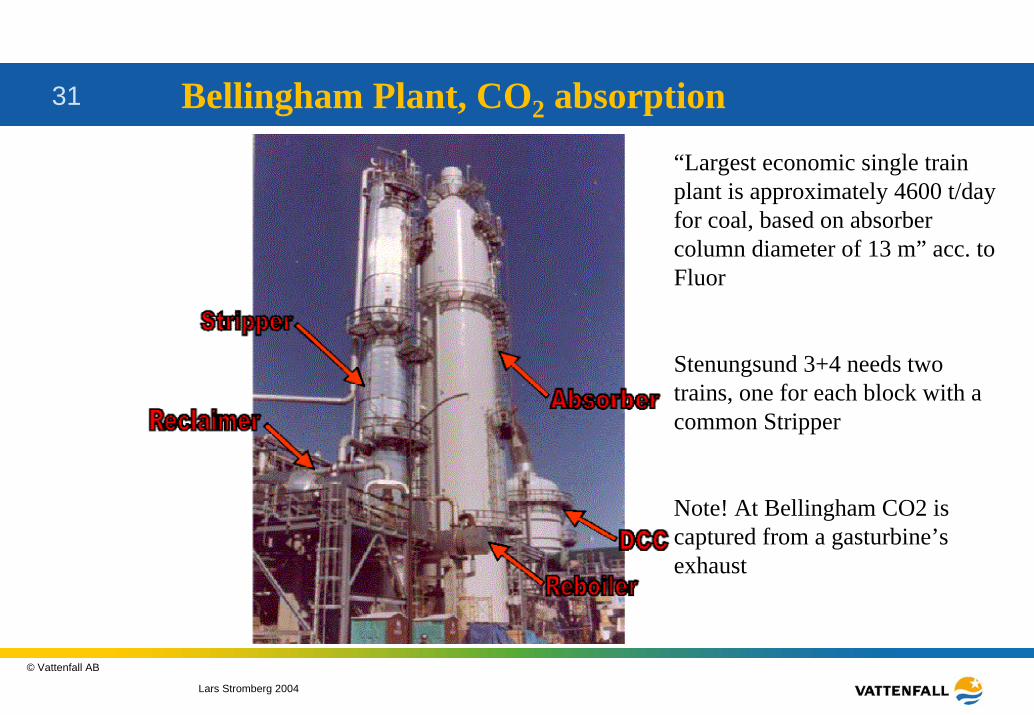
31 Bellingham Plant, CO2 absorption
“Largest economic single train plant is approximately 4600 t/day for coal, based on absorber column diameter of 13 m” acc. to Fluor
Stenungsund 3+4 needs twotrains, one for each block with a common Stripper
Note! At Bellingham CO2 is captured from a gasturbine’s exhaust
Lars Stromberg 2004
© Vattenfall AB
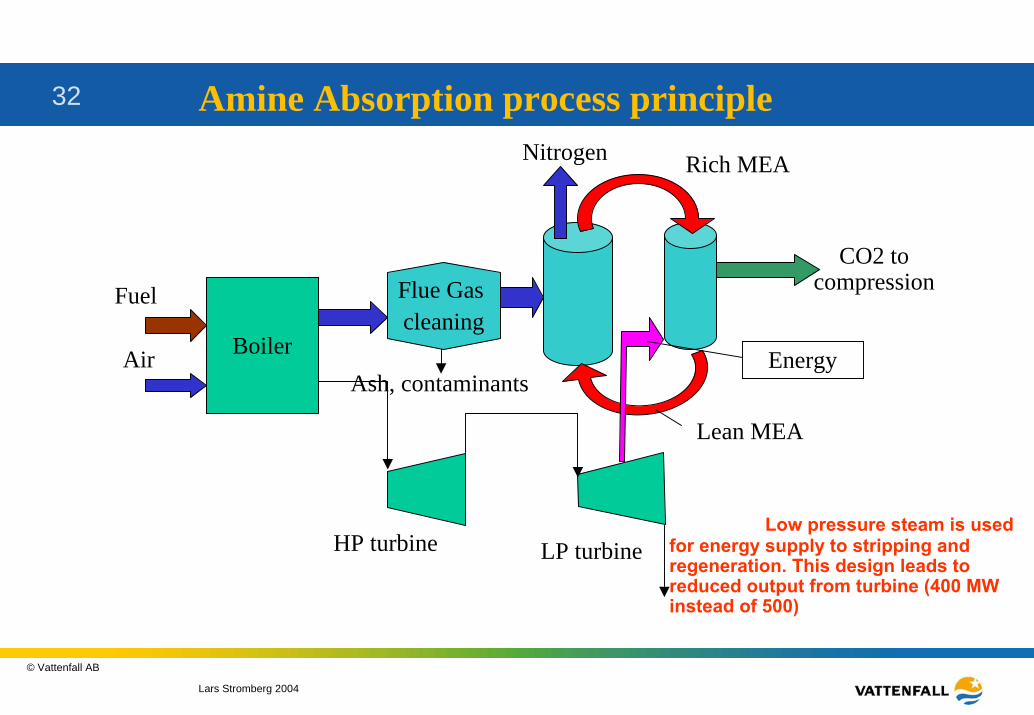
32 Amine Absorption process principle
Boiler
Flue Gas cleaning
CO2 to compressionFuel
AirAsh, contaminants
Nitrogen Rich MEA
Energy
Lean MEA
Low pressure steam is usedfor energy supply to stripping and regeneration. This design leads to reduced output from turbine (400 MW instead of 500)
HP turbine LP turbine
Lars Stromberg 2004
© Vattenfall AB
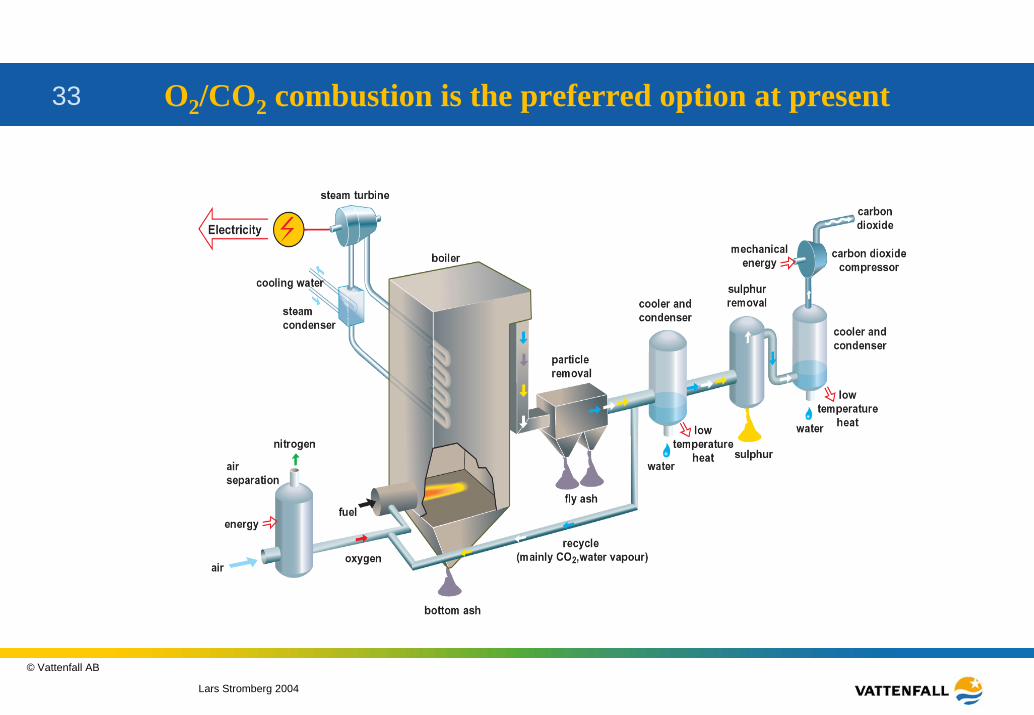
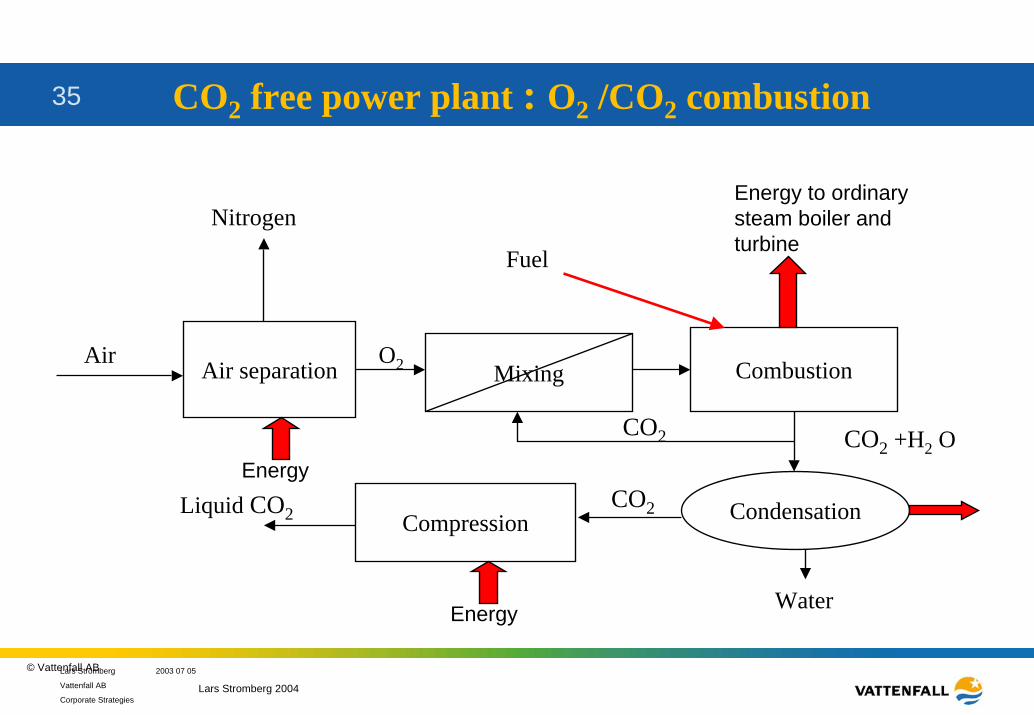
33 O2/CO2 combustion is the preferred option at present
Lars Stromberg 2004
© Vattenfall AB
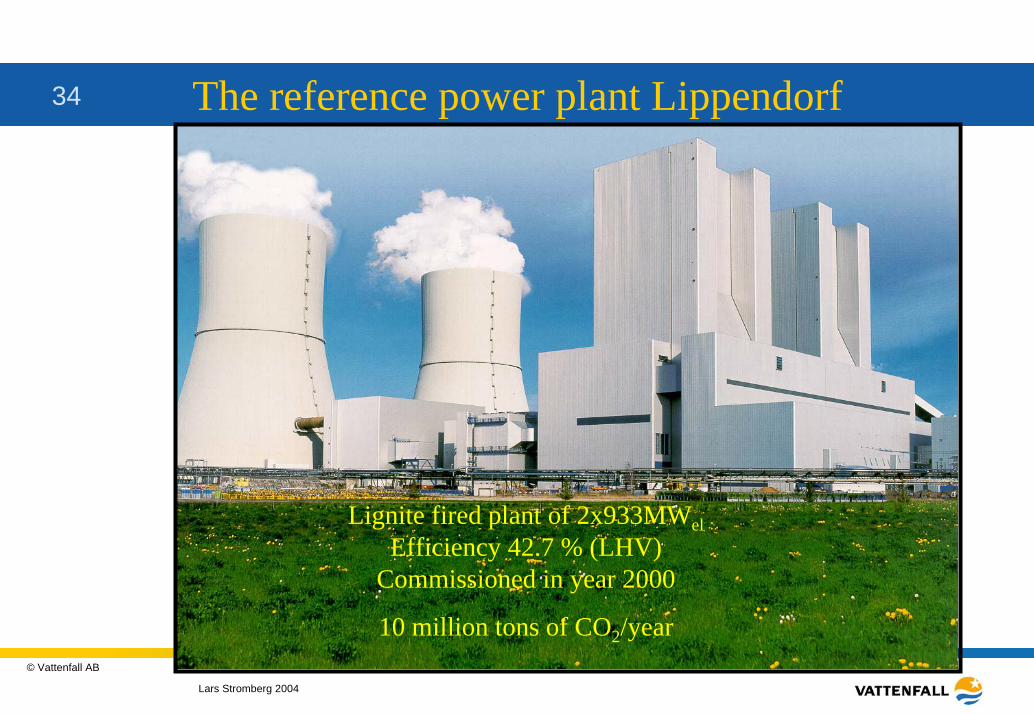
34 The reference power plant Lippendorf
Lignite fired plant of 2x933MWel Efficiency 42.7 % (LHV)
Commissioned in year 2000
10 million tons of CO2/year
Lars Stromberg 2004
© Vattenfall AB
35 CO2 free power plant : O2 /CO2 combustion
Nitrogen
Air separation Mixing Combustion
CondensationCompression
Air O2
CO2 CO2 +H2 O
Water
Liquid CO2
Fuel
Energy
Energy
Energy to ordinary steam boiler and turbine
CO2
Lars Strömberg 2003 07 05
Vattenfall AB
Corporate Strategies

Lars Stromberg 2004
© Vattenfall AB
36 The gas flows in the boiler if fed with an oxidizer with 21% O2
Flue gas:370 kg/sT= 340 C
Flue gas:650 kg/sT= 340 C
Oxygen:177 kg/sT= 20 C
Fuel:193 kg/s
g300 m3
n/s
180 m3n/s H2O
105 m3n/s CO2
7 m3n/s Ar
4 m3n/s O2
2 m3n/s SOx
1 m3n/s NOx
To flue gas treatment
Lars Stromberg 2004
© Vattenfall AB
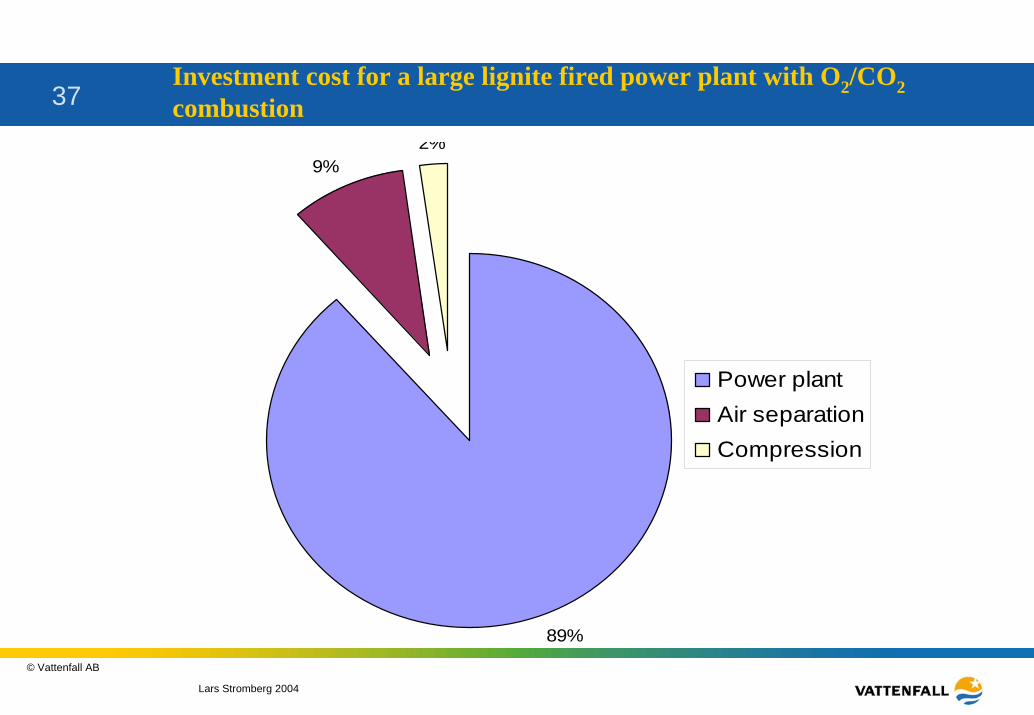
37Investment cost for a large lignite fired power plant with O2/CO2combustion
89%
9%2%
Power plantAir separationCompression
Lars Stromberg 2004
© Vattenfall AB
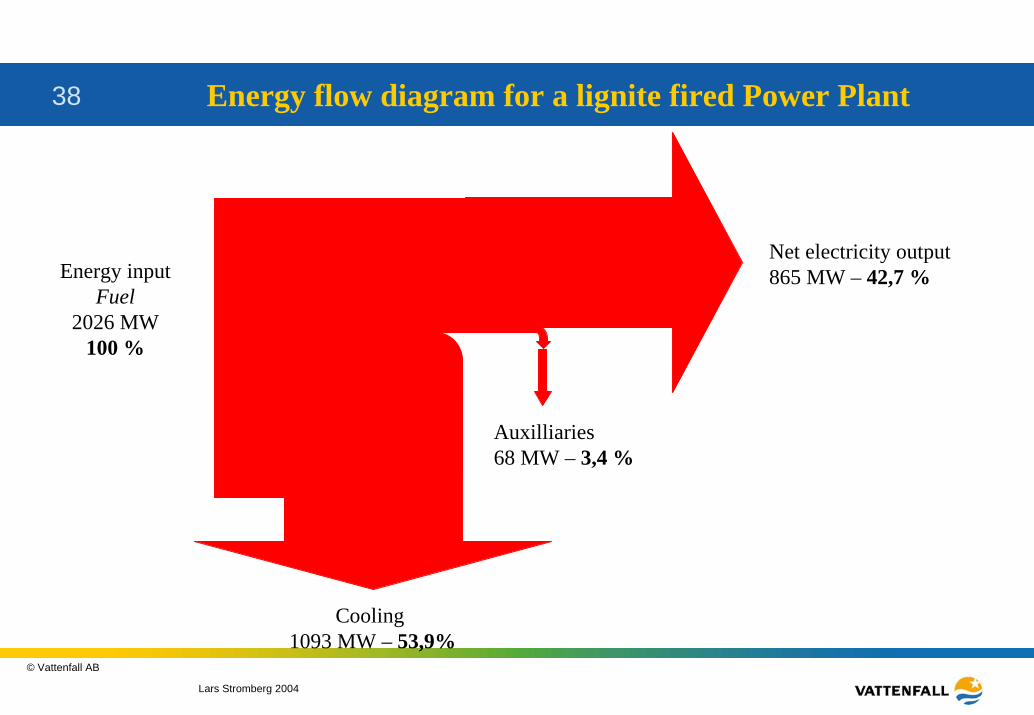
38 Energy flow diagram for a lignite fired Power Plant
Net electricity output865 MW – 42,7 %Energy input
Fuel2026 MW
100 %
Auxilliaries 68 MW – 3,4 %
Cooling 1093 MW – 53,9%
Lars Stromberg 2004
© Vattenfall AB
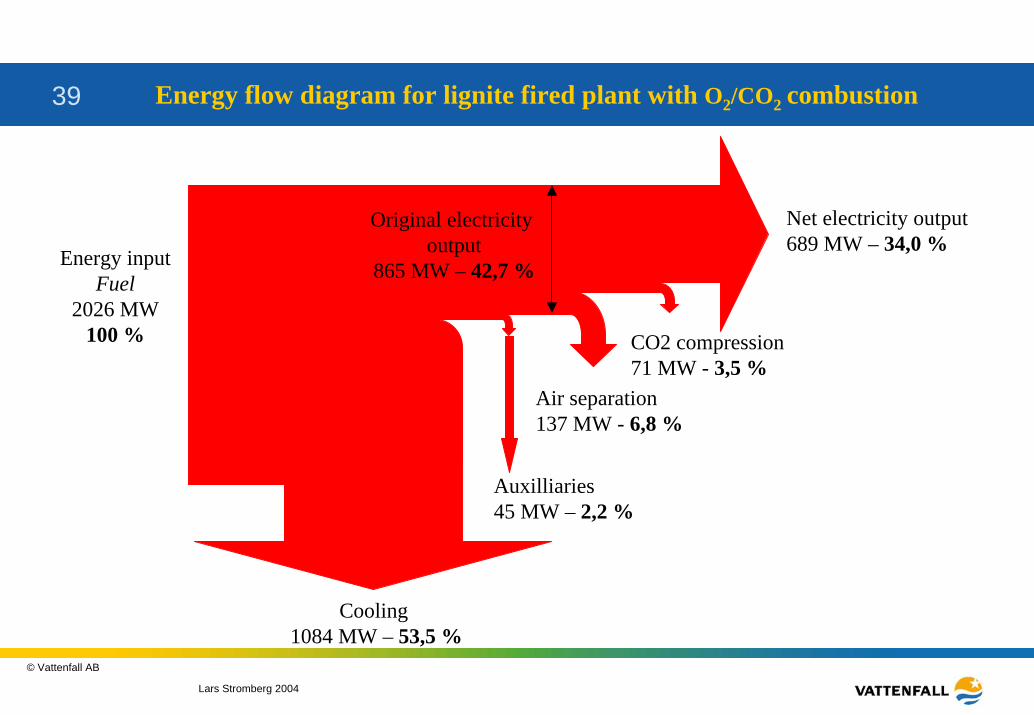
39 Energy flow diagram for lignite fired plant with O2/CO2 combustion
Auxilliaries 45 MW – 2,2 %
Air separation 137 MW - 6,8 %
CO2 compression 71 MW - 3,5 %
Net electricity output689 MW – 34,0 %
Original electricity output
865 MW – 42,7 %Energy input Fuel
2026 MW 100 %
Cooling 1084 MW – 53,5 %

Lars Stromberg 2004
© Vattenfall AB
40 The process design of the O2/CO2 power plant
o2
N2
o2
O2
Air inlet
CO2out
A
B
CFlue gas treatment and liquifaction of the CO2. Power consumption –71 MW
The power plant process. Original gross output 933 MW
Air separation Power Consumption -141 MW
Lars Stromberg 2004
© Vattenfall AB
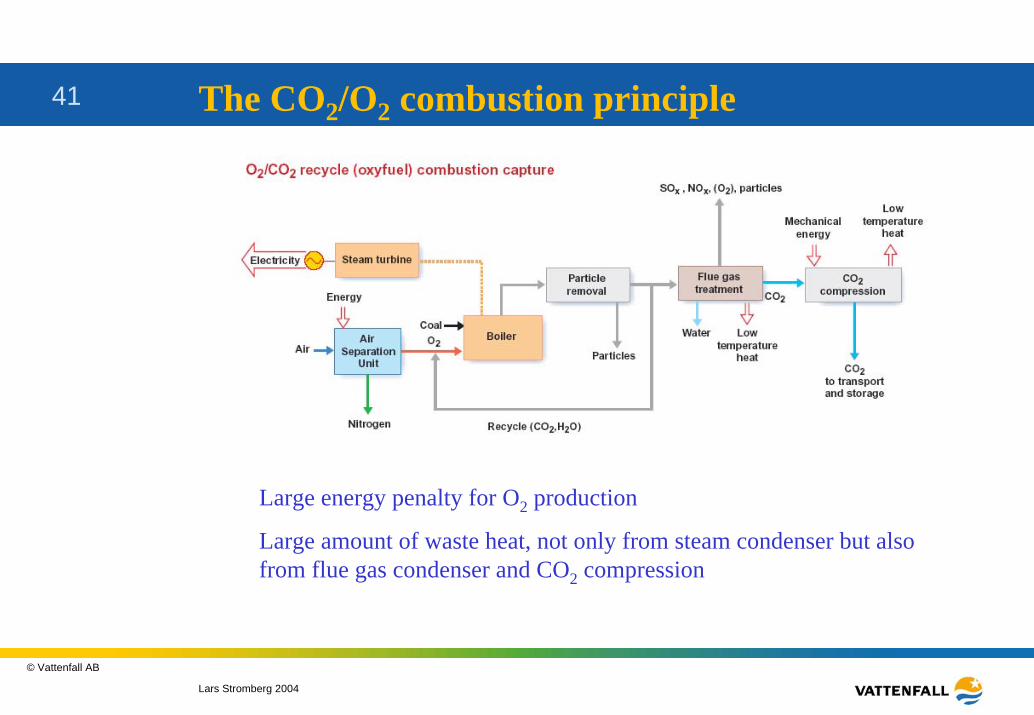
41 The CO2/O2 combustion principle
Large energy penalty for O2 production
Large amount of waste heat, not only from steam condenser but alsofrom flue gas condenser and CO2 compression
Lars Stromberg 2004
© Vattenfall AB
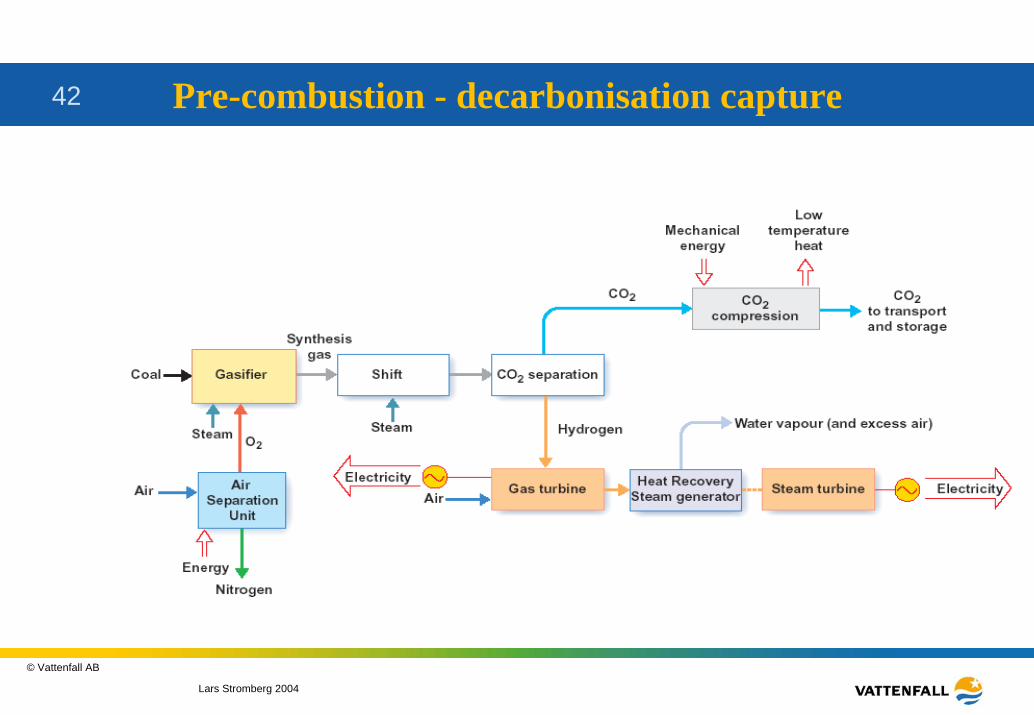
42 Pre-combustion - decarbonisation capture

Lars Stromberg 2004
© Vattenfall AB
43 CO2 free power plant
Evaluation of the options
Lars Stromberg 2004
© Vattenfall AB
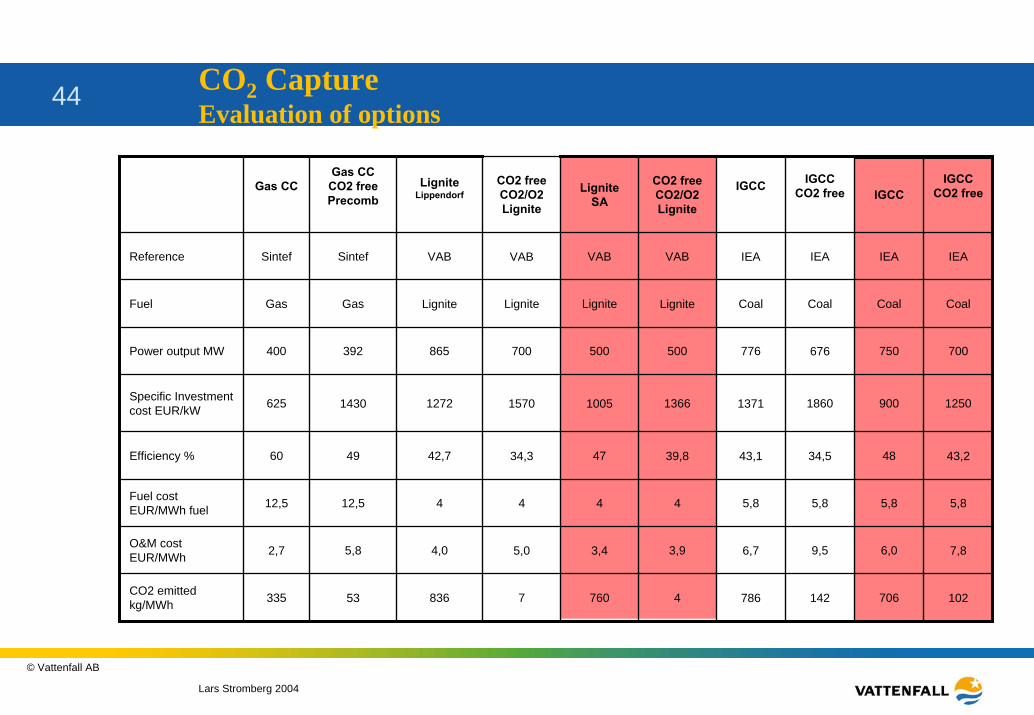
44 CO2 Capture Evaluation of options
Gas CCGas CC CO2 free Precomb
Lignite Lippendorf
CO2 free CO2/O2 Lignite
Lignite SA
CO2 free CO2/O2 Lignite
IGCC IGCC CO2 free IGCC
IGCC CO2 free
Reference Sintef Sintef VAB VAB VAB VAB IEA IEA IEA IEA
Fuel Gas Gas Lignite Lignite Lignite Lignite Coal Coal Coal Coal
Power output MW 400 392 865 700 500 500 776 676 750 700
Specific Investment cost EUR/kW 625 1430 1272 1570 1005 1366 1371 1860 900 1250
Efficiency % 60 49 42,7 34,3 47 39,8 43,1 34,5 48 43,2
Fuel cost EUR/MWh fuel 12,5 12,5 4 4 4 4 5,8 5,8 5,8 5,8
O&M cost EUR/MWh 2,7 5,8 4,0 5,0 3,4 3,9 6,7 9,5 6,0 7,8
CO2 emitted kg/MWh 335 53 836 7 760 4 786 142 706 102
Lars Stromberg 2004
© Vattenfall AB
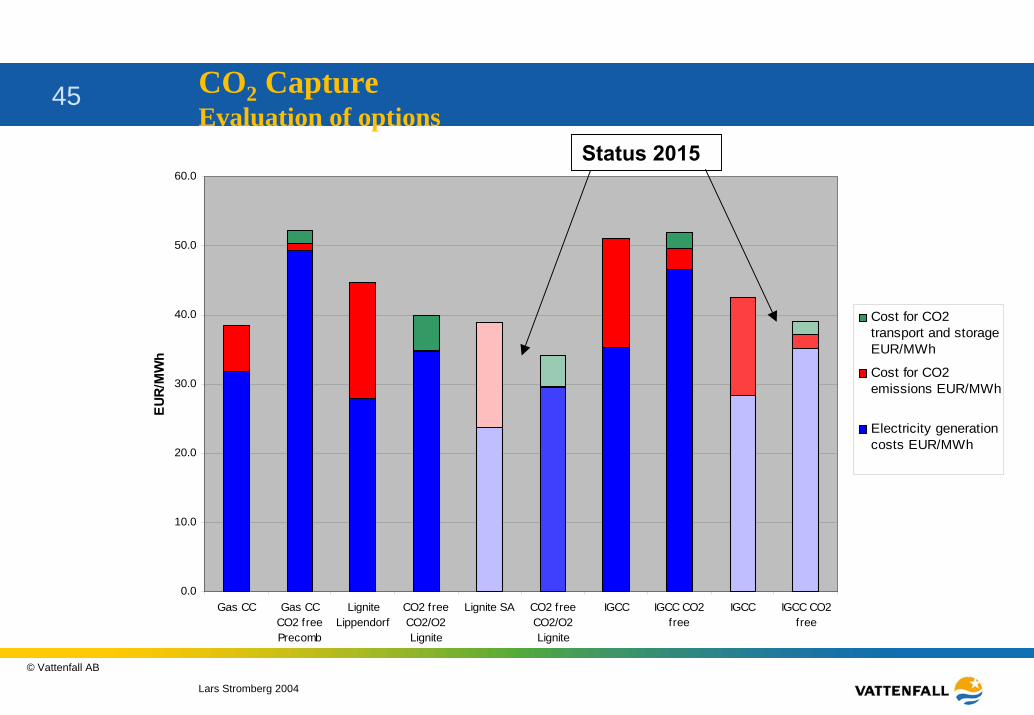
45 CO2 Capture Evaluation of options
0.0
10.0
20.0
30.0
40.0
50.0
60.0
Gas CC Gas CCCO2 freePrecomb
LigniteLippendorf
CO2 freeCO2/O2Lignite
Lignite SA CO2 freeCO2/O2Lignite
IGCC IGCC CO2free
IGCC IGCC CO2free
EUR
/MW
h
Cost for CO2transport and storageEUR/MWh
Cost for CO2emissions EUR/MWh
Electricity generationcosts EUR/MWh
Status 2015
Lars Stromberg 2004
© Vattenfall AB
46 Opportunities with oxyfuel combustion
• Based on existing boiler and steam cycle technology– Can take advantage of ongoing development to increase
efficiency of conventional power plants, e.g. AD700
• Co-capture of CO2 and other pollutants gives a near zero emission power plant– Reduction in cost of flue gas treatment
• Next generation novel boiler designs– Compact PF boiler design through low recycle rate (higher
oxygen concentration)– CFB gives opportunity to even lower recycle rate through use of
solids for heat transfer

Lars Stromberg 2004
© Vattenfall AB
47 Challenge 1: Boiler design• Design of next generation oxyfuel boiler, combustion considerations• Reduced recycle rate or complete removal of recycle• Optimisation of combustion for reduced formation of NOx, to eliminate
catalytic reactors
Lars Stromberg 2004
© Vattenfall AB
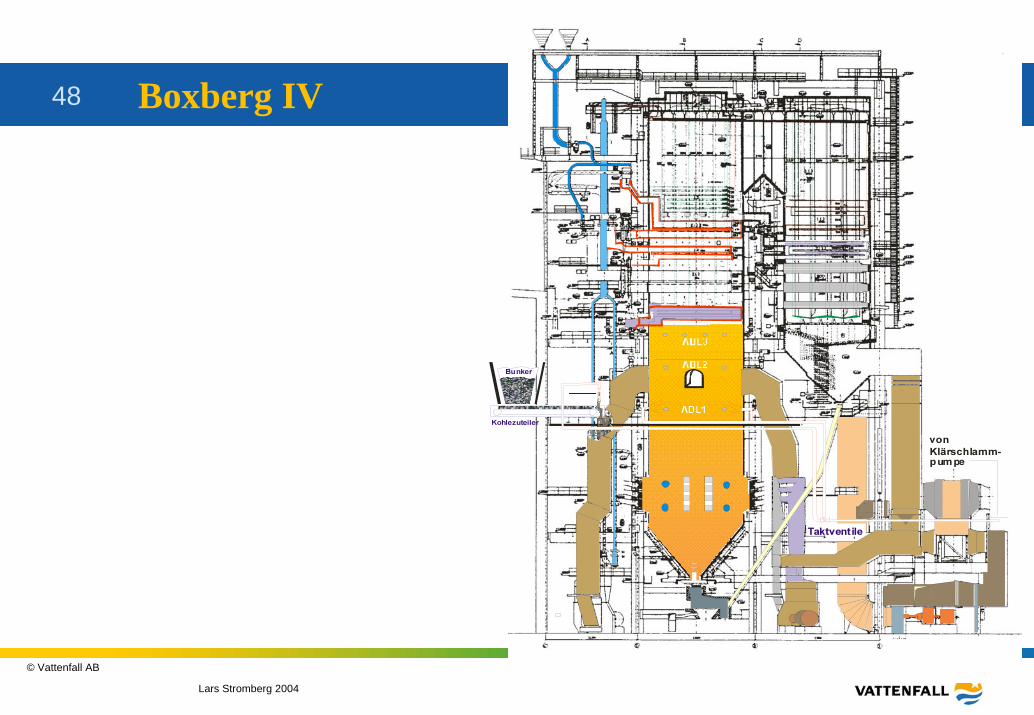
48 Boxberg IV

Lars Stromberg 2004
© Vattenfall AB
49 O2 /CO2 combustion – experiments and modeling
Modeling of an experimental CO2/O2 flame
23 % oxygen + CO2+H2O
1300 Celcius
Lars Stromberg 2004
© Vattenfall AB
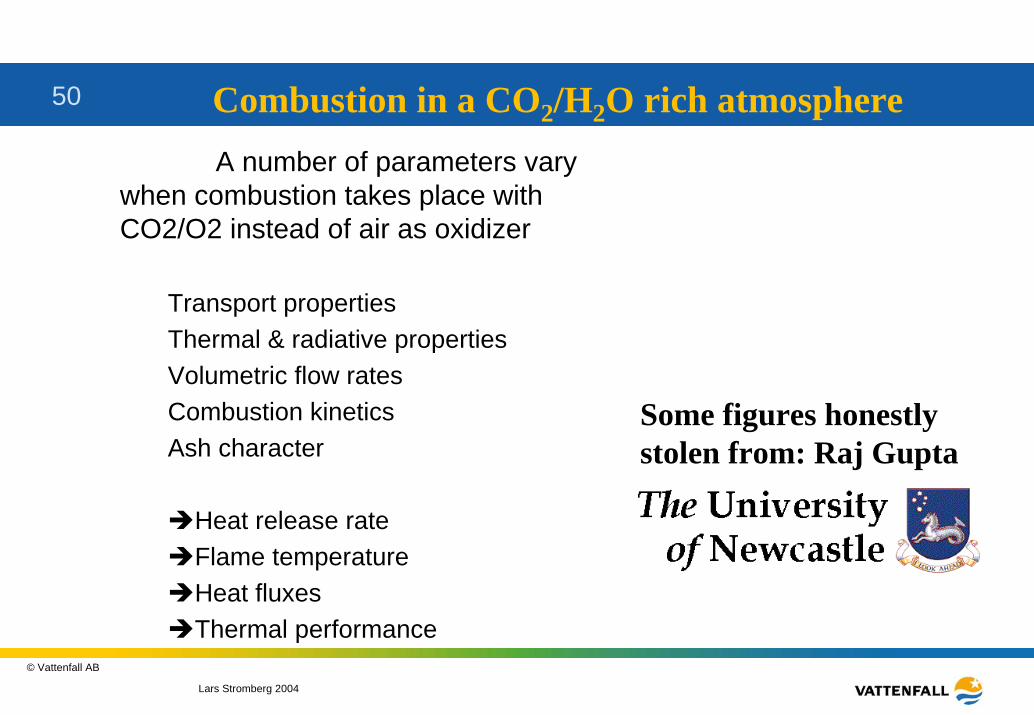
50 Combustion in a CO2/H2O rich atmosphereA number of parameters vary
when combustion takes place with CO2/O2 instead of air as oxidizer
Transport propertiesThermal & radiative propertiesVolumetric flow ratesCombustion kineticsAsh character
Heat release rateFlame temperatureHeat fluxesThermal performance
Some figures honestly stolen from: Raj Gupta

Lars Stromberg 2004
© Vattenfall AB
51 Planck’s Distribution Function – H2O & CO2 Bands
Planks Function
0
20
40
60
80
100
120
140
160
0 5 10 15Wavelength (µm)
(W/m
2 ).cm
2000 K
1500 K
1000 K
Planck’s function
Lars Stromberg 2004
© Vattenfall AB
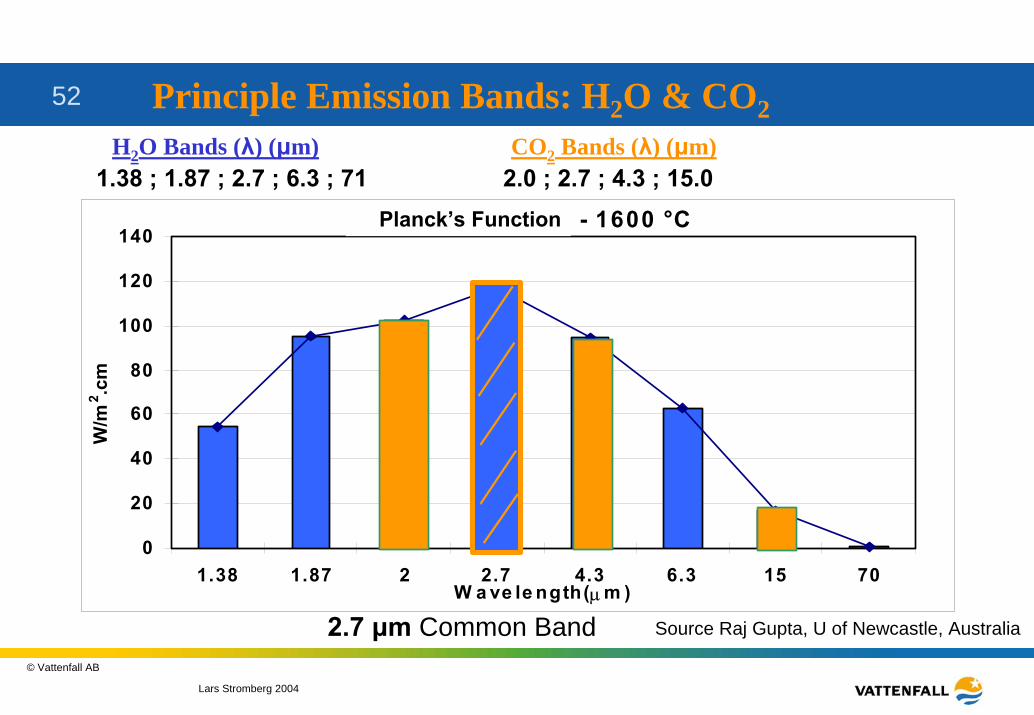
52 Principle Emission Bands: H2O & CO2H2O Bands (λ) (µm) CO Bands (λ) (µm)2
1.38 ; 1.87 ; 2.7 ; 6.3 ; 71 2.0 ; 2.7 ; 4.3 ; 15.0
2.7 µm Common Band
P lank's Function - 1600 °C
0
20
40
60
80
100
120
140
1.38 1.87 2 2.7 4.3 6.3 15 70W a ve le ngth(µm )
W/m
2 .cm
Source Raj Gupta, U of Newcastle, Australia
Planck’s Function

Lars Stromberg 2004
© Vattenfall AB
53 3-gray gas model
[ ]PSkI
ii
Total emissivity of gray gases:
Optimized values for:
i = 3 (no. of gray gases)
j = 4 (polynomial order)
1
1,,,
−
=∑= j
J
jjii Tba εε
Source Raj Gupta, U of Newcastle, Australia
Where,
[ ] ithPSk
gasabsorbingofLengthPathpressurePartialPS )*(
factorsweightingemissivitygasgrayia thi =,ε
tscoefficienpolynomialetemperaturgasemissivityb ji =,,ε
Article: T.F.Smith et al (1982)
Lars Stromberg 2004
© Vattenfall AB
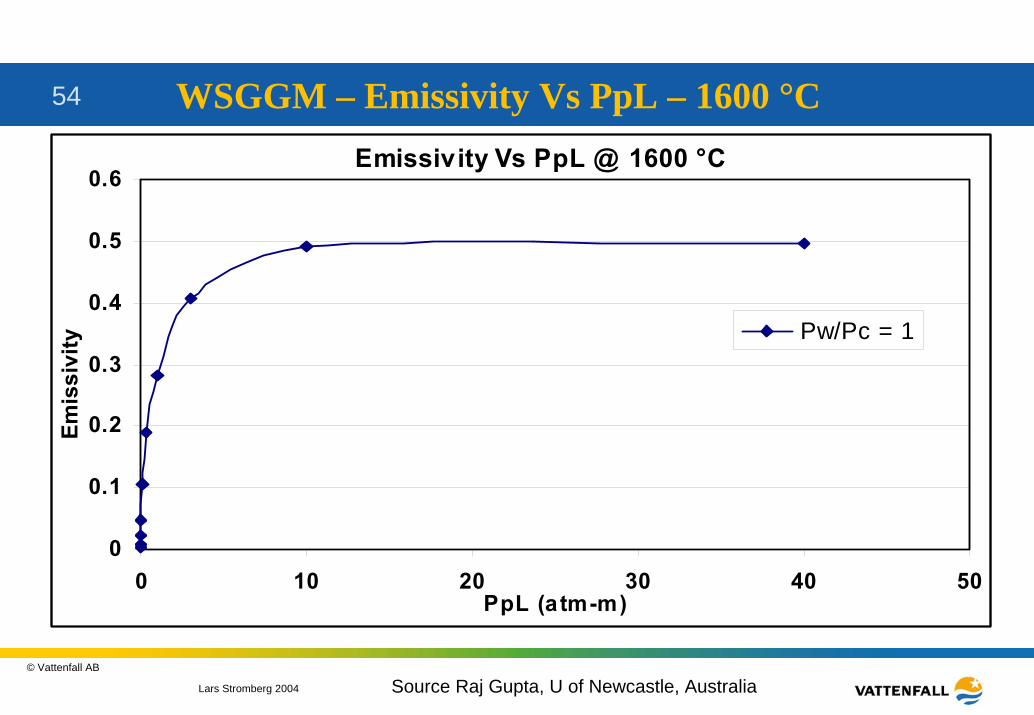
54 WSGGM – Emissivity Vs PpL – 1600 °CEmissivity Vs PpL @ 1600 °C
0
0.1
0.2
0.3
0.4
0.5
0.6
0 10 20 30 40 50PpL (atm-m)
Emis
sivi
ty Pw/Pc = 1
Source Raj Gupta, U of Newcastle, Australia
Lars Stromberg 2004
© Vattenfall AB
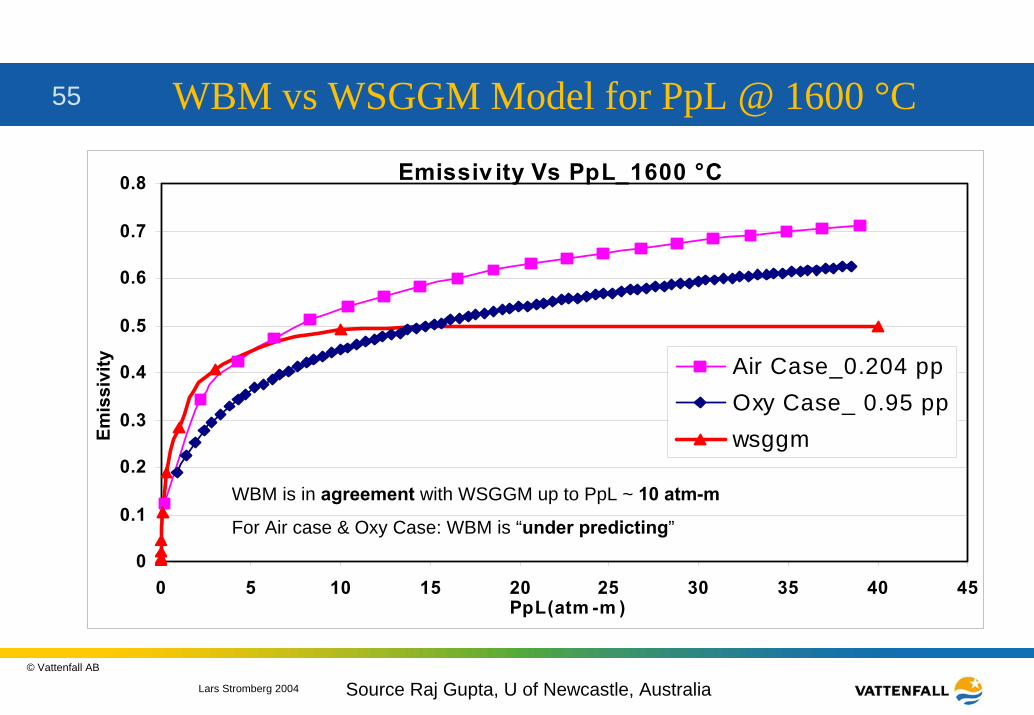
55 WBM vs WSGGM Model for PpL @ 1600 °C
Emissiv ity Vs PpL_1600 °C
0
0.1
0.2
0.3
0.4
0.5
0.6
0.7
0.8
0 5 10 15 20 25 30 35 40 45PpL(atm -m )
Emis
sivi
ty Air Case_0.204 ppOxy Case_ 0.95 ppwsggm
WBM is in agreement with WSGGM up to PpL ~ 10 atm-m
For Air case & Oxy Case: WBM is “under predicting”
Source Raj Gupta, U of Newcastle, Australia
Lars Stromberg 2004
© Vattenfall AB
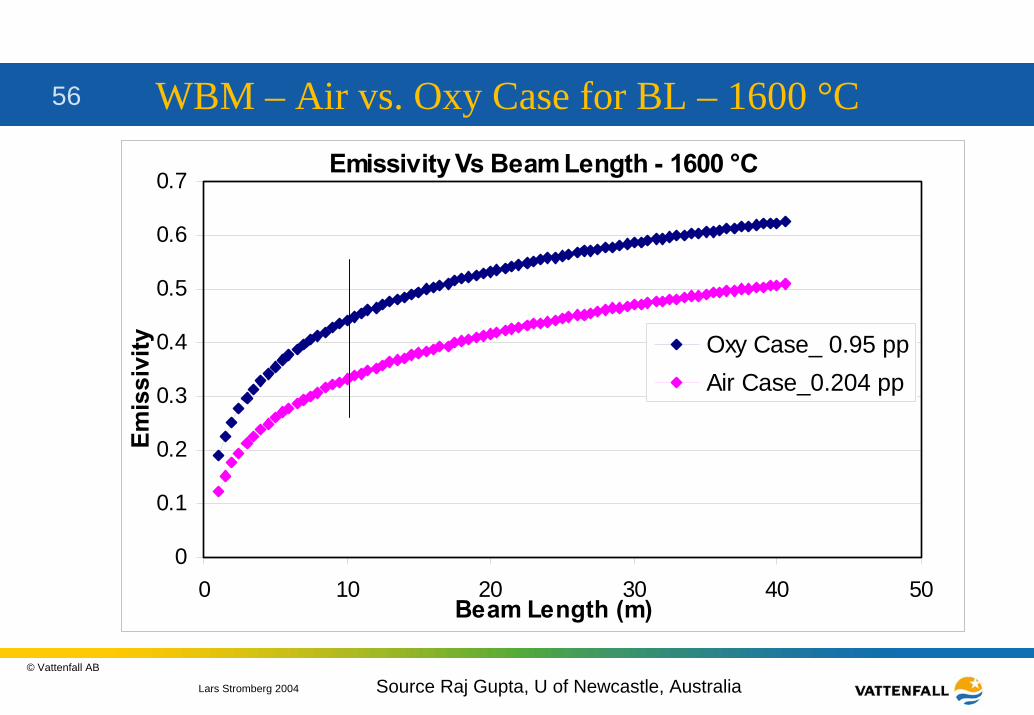
56 WBM – Air vs. Oxy Case for BL – 1600 °CEmissivity Vs Beam Length - 1600 °C
0
0.1
0.2
0.3
0.4
0.5
0.6
0.7
0 10 20 30 40 50Beam Length (m)
Emis
sivi
ty Oxy Case_ 0.95 ppAir Case_0.204 pp
Source Raj Gupta, U of Newcastle, Australia
Lars Stromberg 2004
© Vattenfall AB
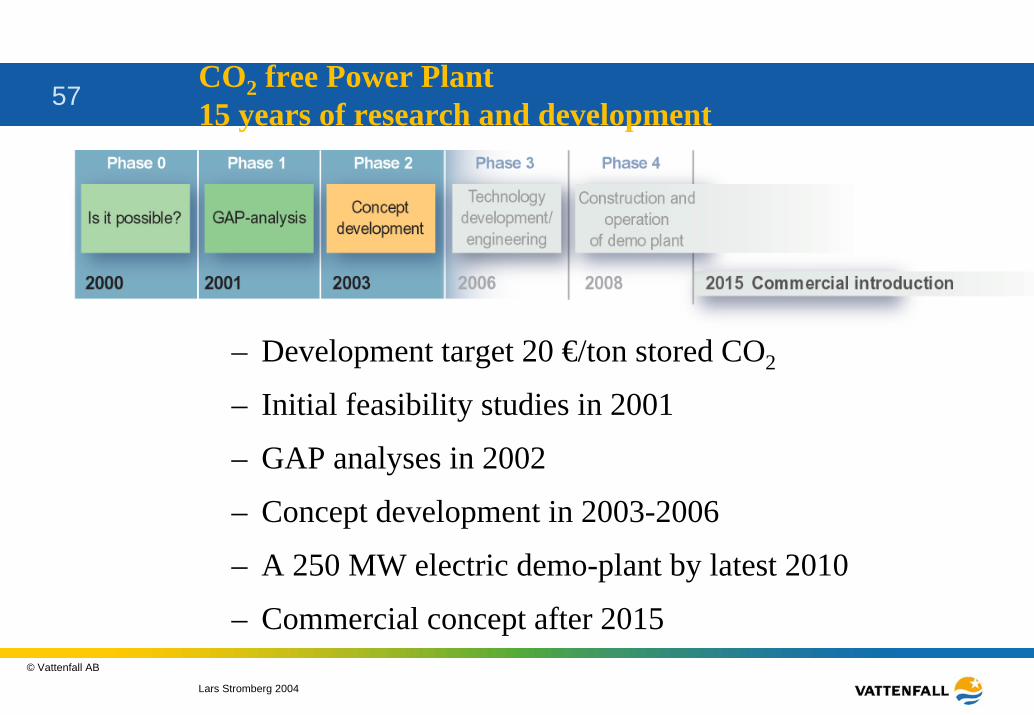
57CO2 free Power Plant 15 years of research and development
– Development target 20 €/ton stored CO2
– Initial feasibility studies in 2001
– GAP analyses in 2002
– Concept development in 2003-2006
– A 250 MW electric demo-plant by latest 2010
– Commercial concept after 2015
Lars Stromberg 2004
© Vattenfall AB
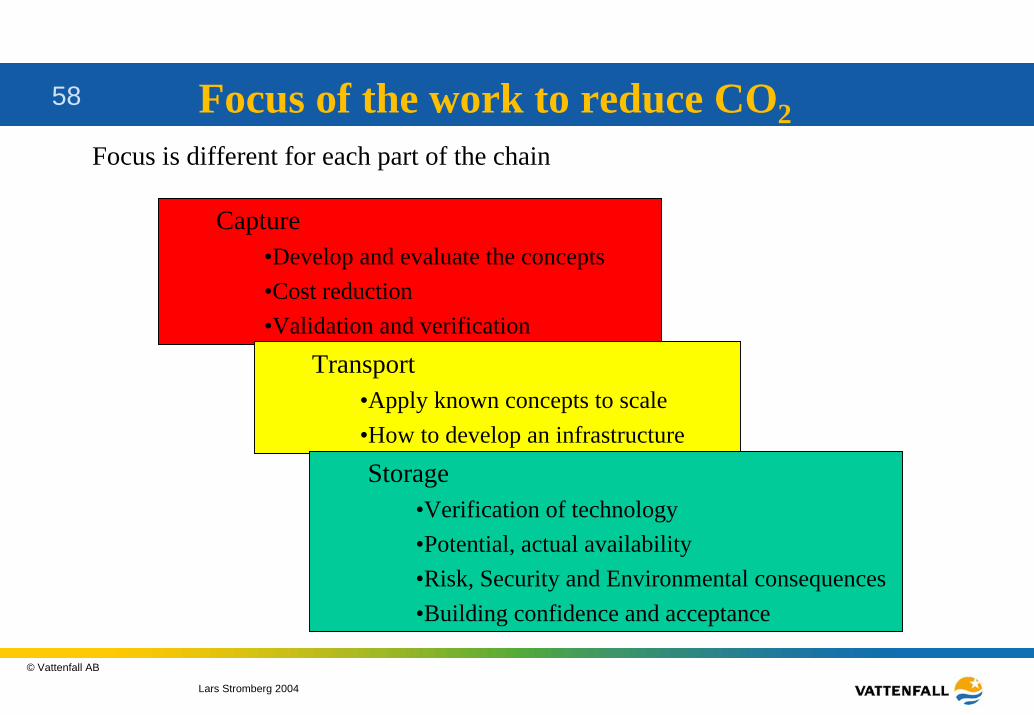
58 Focus of the work to reduce CO2Focus is different for each part of the chain
Capture•Develop and evaluate the concepts•Cost reduction•Validation and verification
Transport•Apply known concepts to scale•How to develop an infrastructure
Storage•Verification of technology•Potential, actual availability•Risk, Security and Environmental consequences •Building confidence and acceptance
Lars Stromberg 2004
© Vattenfall AB
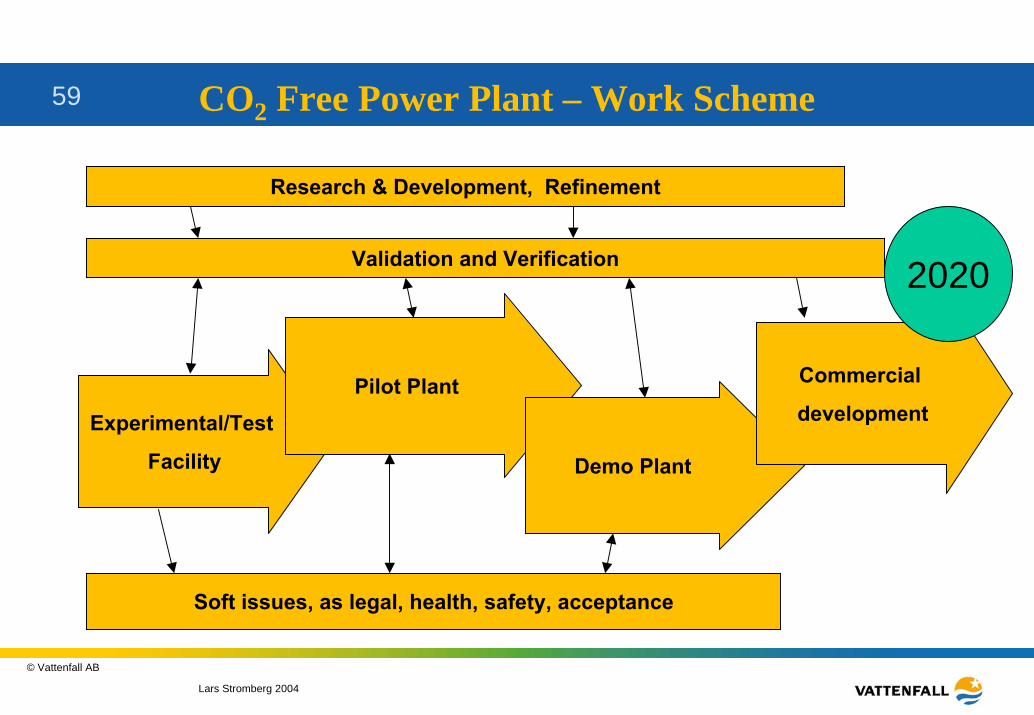
59 CO2 Free Power Plant – Work Scheme
Experimental/Test
Facility
Pilot Plant
Demo Plant
Commercial
development
Validation and Verification
Research & Development, Refinement
Soft issues, as legal, health, safety, acceptance
2020
Lars Stromberg 2004
© Vattenfall AB
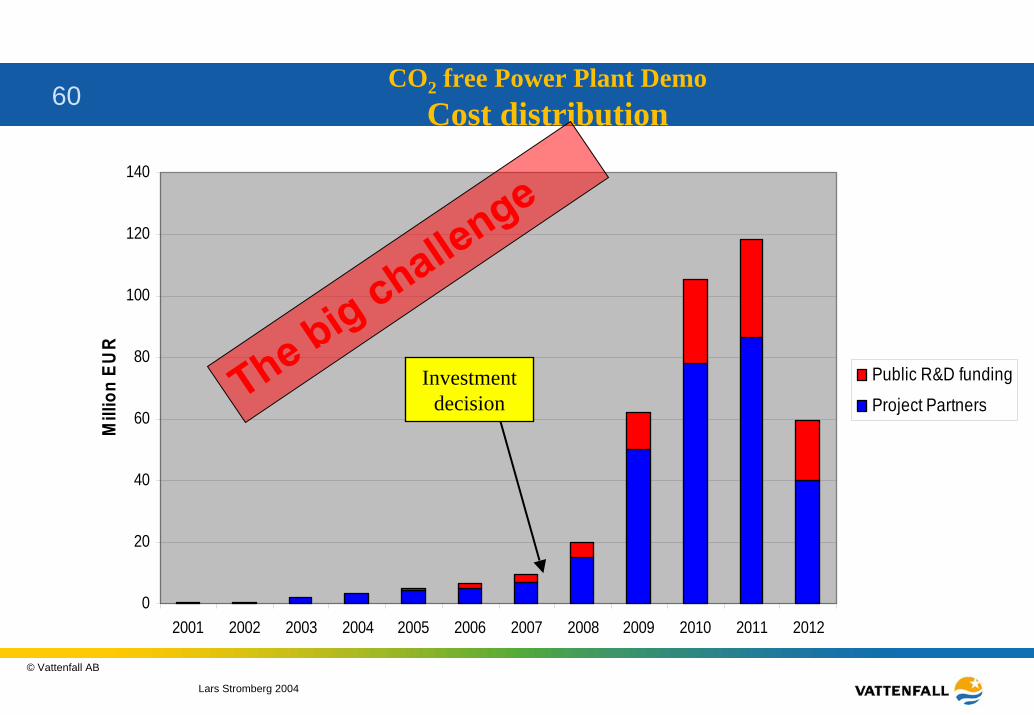
60CO2 free Power Plant Demo
Cost distribution
0
20
40
60
80
100
120
140
2001 2002 2003 2004 2005 2006 2007 2008 2009 2010 2011 2012
Mill
ion
EUR
Public R&D funding
Project PartnersInvestment
decisionThe big challenge
Lars Stromberg 2004
© Vattenfall AB
61 CO2 free power plant
Conclusions

Lars Stromberg 2004
© Vattenfall AB
62 Conclusions• Fossil fuels are needed many decades yet. There is no other option
available large enough• CO2 capture and storage can enable energy generation without CO2
emissions at a lower cost than most renewable alternatives.• The CO2 emission trading scheme sets the commercial framework for
new technology• If CO2 capture and storage is developed to a viable option with
avoidance costs down to 20 €/ton of CO2, the technology can be commercially introduced.
• ”Carbon dioxide free” energy production from fossil fuels can not be introduced at a larger scale before 2015.
• Coal is competitive with gas. The commercial alternatives will be coal with CO2 capture and storage and gas without capture, taking thepunishment from the trading system.

Lars Stromberg 2004
© Vattenfall AB
63 Schwarze Pumpe power plant