a functional perspective on the analysis of land use and
TRANSCRIPT

PERSPECTIVE
A functional perspective on the analysis of land use and land coverdata in ecology
Federico Riva , Scott E. Nielsen
Received: 27 June 2020 / Revised: 24 September 2020 / Accepted: 2 November 2020
Abstract Assessments of large-scale changes in habitat
are a priority for management and conservation.
Traditional approaches use land use and land cover data
(LULC) that focus mostly on ‘‘structural’’ properties of
landscapes, rather than ‘‘functional’’ properties related to
specific ecological processes. Here, we contend that
designing functional analyses of LULC can provide
important and complementary information to traditional,
structural analyses. We substantiate this perspective with
an example of functional changes in habitat due to
industrial anthropogenic footprints in Alberta’s boreal
forest, where there has been little overall forest loss
(* 6% structural change), but high levels of functional
change (up to 93% functional change) for species’ habitat,
biodiversity, and wildfire ignition. We discuss the methods
needed to achieve functional LULC analyses, when they
are most appropriate to add to structural assessments, and
conclude by providing recommendations for analyses of
LULC in a future of increasingly high-resolution, dynamic
remote sensing data.
Keywords Functional landscape analyses �Geographic information systems � Remote sensing �Scale of analysis � Scale of phenomenon �Scale of sampling
INTRODUCTION
Understanding the consequences of human activities is one
of the most pressing challenges to protecting and managing
natural resources in the twenty-first century (Soule 1985;
Kareiva and Marvier 2012). Today, anthropogenic distur-
bances dominate ecosystems, eroding biodiversity and
affecting several other ecosystem services (Newbold et al.
2015; Crooks et al. 2017; Daskalova et al. 2020). As a
result, ecologists, managers, and policy makers are often
required to evaluate changes in habitat across large regions
of the Earth. This has been traditionally achieved by
assessing changes in land use and land cover data (LULC),
using remote sensing tools (O’Neill et al. 1988; Riitters
et al. 2004).
Owing to technological and statistical developments,
LULC are now available at unprecedented broad scales
(e.g., global; Tuanmu and Jetz 2014) and high resolutions
(e.g., 1-m resolution; Wickham and Riitters 2019). Use of
these products has revealed important patterns and trends:
for instance, deforestation occurs consistently across the
tropics (Taubert et al. 2018), taxa inhabiting fragmented
regions suffer increased extinction risks (Crooks et al.
2017), and most of the world’s forests are proximal to
edges (Haddad et al. 2015). While increasing availability
and quality of LULC data contributed to the establishment
of landscape ecology, macroecology, and conservation
planning as cornerstones in the environmental sciences
(Gustafson 2018), developing meaningful analyses of
LULC can be complex, and these analyses are not exempt
from those limitations (Coops and Wulder 2019; Riva and
Nielsen 2020).
Assessments of LULC generally evaluate ‘‘structural’’
properties of landscapes, i.e., properties that are not rep-
resentative of specific ecological processes (Tischendorf
and Fahrig 2000). Indeed, while landscape properties
sampled with remote sensing usually bear broad ecological
relevance, not all ecological processes respond to the same
landscape characteristics (Tischendorf and Fahrig 2000).
Electronic supplementary material The online version of thisarticle (https://doi.org/10.1007/s13280-020-01434-5) contains sup-plementary material, which is available to authorized users.
� Royal Swedish Academy of Sciences 2020
www.kva.se/en 123
Ambio
https://doi.org/10.1007/s13280-020-01434-5

Access to finished products where different LULC cate-
gories are defined prior to the analysis also limit their
application for ecologists (e.g., satellite images classified
based upon spectral signatures, Borra et al. 2019). There-
fore, structural properties of LULC might not be repre-
sentative of the ‘‘functional’’ changes in habitat of interest
in different regions or studies.
Analyses of LULC have become common in manage-
ment and conservation given widespread availability of
these data and their intuitiveness (Riva and Nielsen 2020).
For instance, Ambio published within the past 5 years 600
articles related to ‘‘land use’’ and 132 articles related to
‘‘land use AND geographic information system’’, or 434
and 98 related to ‘‘land cover’’ and ‘‘land cover AND
geographic information system’’ (search conducted June
19th 2020). Since these analyses are often structural (e.g.,
Cousins et al. 2015; Mendoza-Ponce et al. 2019), it is
important to recognize the benefits and limitations of this
approach. Essentially, structural analyses of LULC assess
coarse-filter, top-down patterns of changes in habitat across
landscapes, thereby broadly evaluating a variety of pro-
cesses. Yet, these analyses miss fine-filter, bottom-up
responses to changes in habitat, overlooking specific eco-
logical processes or species that typically respond to
changes in habitat idiosyncratically, and in a context- and
scale-dependent fashion. Appropriate management and
conservation actions require an understanding of both
facets, and understanding these nuances is especially
important when the goal is to protect landscapes in a
holistic fashion, e.g., to manage biodiversity and ecosystem
services (Nielsen et al. 2007; Tingley et al. 2014).
In this perspective, we advocate that functional LULC
analyses can provide important and complementary infor-
mation to traditional, structural analyses of LULC. We
discuss the benefits and framework for adapting LULC to
represent functional responses to changes in habitat based
on relationships between geospatial data and ecological
phenomena, suggesting a formal distinction between
structural and functional analyses of LULC data. We show
how a functional perspective can influence our under-
standing of changes in habitat using a case study of inter-
national relevance—the anthropogenic industrial footprint
of Alberta’s boreal forest in western Canada. Contrasting
structural and functional quantifications of habitat change
in Alberta’s forests, we demonstrate how the information
provided by functional and structural assessments is dis-
tinct and complementary. We conclude by discussing when
and how it will be appropriate to conduct functional anal-
yses of LULC in the future of high-resolution, continuous,
and dynamic data.
WHAT IS A FUNCTIONAL PERSPECTIVE,
AND WHY IS IT IMPORTANT TO PURSUE IT?
The idea of contrasting ‘‘structural’’ and ‘‘functional’’
approaches is recurring in the ecological literature. For
instance, Tischendorf and Fahrig (2000) defined structural
vs. functional landscape connectivity, whereas McGarigal
(2014) defined structural vs. functional landscape metrics.
Defining a more general paradigm, Riva and Nielsen
(2020) proposed that functional landscape analyses be
defined as assessments of patterns in spatial heterogeneity
that are explicitly related to ecological processes, as
opposed to structural assessments where there is an implicit
link between geospatial data and ecological processes. A
‘‘functional perspective’’ is therefore the upfront and
explicit evaluation of all the characteristics of geospatial
analyses in relation to ecological process of interest in a
study (e.g., spatial, thematic, and temporal resolution,
conceptual model employed, or metrics used to assess the
geospatial data). This framework applies to the analysis of
LULC, where functional analyses are those that evaluate
how LULC represent specific ecological processes,
whereas structural analyses are those that explore general
patterns assuming that LULC represent broad ecological
processes. While both approaches have their merits, a focus
on ecological processes might be the key to tackle long-
term, unsolved questions in ecology and conservation
(Fahrig 2020; Riva and Nielsen 2020).
One could argue that all LULC analyses are functional,
because all LULC assume that geospatial data are appro-
priate to describe ecologically relevant patterns in envi-
ronmental heterogeneity. However, many concepts related
to species’ habitats are dependent on life history traits, are
inherently idiosyncratic, and are scale-dependent, yet
structural LULC analyses do not usually account for these
differences. For instance, the simple question of ‘what is
habitat’ depends on the resources necessary for a species to
persist (Dennis et al. 2003), while the question of ‘how
diverse is a landscape’ depends on the taxa examined
(Fahrig et al. 2011), and the question of ‘how connected is
a landscape’ depends on the characteristics of the ecolog-
ical process assessed, as well as countless context-depen-
dent factors (Tischendorf and Fahrig 2000). There is,
therefore, value in explicitly defining how LULC relate to
the processes of interest. A functional perspective is
important because it forces the authors to define clear study
objectives and to measure relevant landscape properties,
thereby reducing the risk of making spurious inferences
(Lechner et al. 2012; Riva and Nielsen 2020), and because
it strengthens the application of ‘‘day science’’, the sys-
tematic process of testing hypotheses through structured
and rational studies (Jacob 1988). Since original values of
LULC data can rarely represent all the ecological process
123� Royal Swedish Academy of Sciences 2020
www.kva.se/en
Ambio
of interest in a study, evaluating if a functional perspective
is needed should be a critical and explicit step when
evaluating patterns of landscape change using LULC.
LINKING LULC AND ECOLOGICAL PROCESSES
TO PROMOTE A FUNCTIONAL PERSPECTIVE
To achieve a functional perspective in the context of LULC
analyses, it is necessary to assess LULC that appropriately
represent landscape properties hypothesized to condition
an ecological process of interest. Different phenomena are
structured and interact with the environment at different
scales (phenomenon scale), which should define appropri-
ate units to acquire information about ecological processes
(sampling scale) and units to analyze them (analysis scale)
(Dungan et al. 2002; Riva and Nielsen 2020; Fig. 1). Fur-
thermore, even when affected by similar phenomenon,
sampling, and analysis scales, different ecological pro-
cesses can respond to different landscape patterns, and
measuring different patterns can further exacerbate
discrepancies between structural and functional assess-
ments (Riva and Nielsen 2020).
A functional perspective often requires manipulating the
original LULC data to match the characteristic of a given
ecological phenomenon (e.g., thematic resolution, spatial
resolution, or temporal resolution). In the past, limited
availability of high-resolution remote sensing data has been
an important limitation because the resolution of LULC
was often coarser than the scales necessary to represent
many natural phenomena (Fig. 1). Indeed, scales of anal-
ysis and sampling tend to be inversely correlated, with
large-scale analyses typically conducted at coarser resolu-
tions. However, since we are entering a new era of large-
scale, high-resolution remote sensing and biodiversity data
(Jetz et al. 2019; Wickham and Riitters 2019), this trend is
bound to change and the time is ripe to recognize the
benefits of a functional perspective when assessing LULC.
In the coming years, a focus on integrating biodiversity and
remote sensing data will allow for a greater understanding
of the human impacts on natural habitats (Jetz et al. 2019).
This revolution will benefit the analysis of LULC espe-
cially in relation to functional analyses (e.g., allowing the
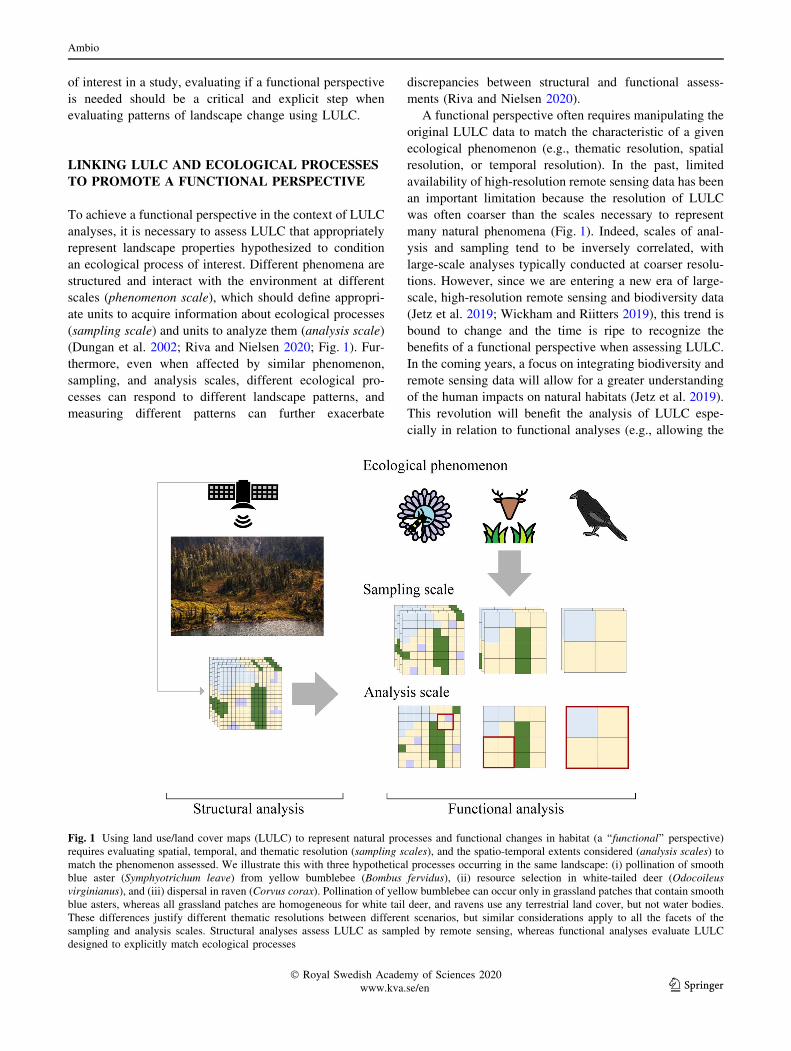
Fig. 1 Using land use/land cover maps (LULC) to represent natural processes and functional changes in habitat (a ‘‘functional’’ perspective)
requires evaluating spatial, temporal, and thematic resolution (sampling scales), and the spatio-temporal extents considered (analysis scales) to
match the phenomenon assessed. We illustrate this with three hypothetical processes occurring in the same landscape: (i) pollination of smooth
blue aster (Symphyotrichum leave) from yellow bumblebee (Bombus fervidus), (ii) resource selection in white-tailed deer (Odocoileusvirginianus), and (iii) dispersal in raven (Corvus corax). Pollination of yellow bumblebee can occur only in grassland patches that contain smooth
blue asters, whereas all grassland patches are homogeneous for white tail deer, and ravens use any terrestrial land cover, but not water bodies.
These differences justify different thematic resolutions between different scenarios, but similar considerations apply to all the facets of the
sampling and analysis scales. Structural analyses assess LULC as sampled by remote sensing, whereas functional analyses evaluate LULC
designed to explicitly match ecological processes
� Royal Swedish Academy of Sciences 2020
www.kva.se/en 123
Ambio

exploration of scaling patterns (Wickham and Riitters
2019), or fine-scale requirements of different species in
determining what is habitat (Dennis et al. 2003)). Notably,
as technology progresses, continuous geospatial data are
also becoming increasingly available and relevant (Coops
and Wulder 2019). We describe in the discussion below
how categorical and continuous surfaces are complemen-
tary, and lead to advances and integration in the fields of
ecology and remote sensing.
COMPARING STRUCTURAL AND FUNCTIONAL
ANTHROPOGENIC CHANGES IN THE ALBERTA
BOREAL BIOME
Quantifying the degree to which an area is disturbed by
anthropogenic activities is a standard practice and first step
in environmental management, e.g., to inform species
distribution models, conservation prioritization, or
restoration activities. To highlight the importance of a
functional approach to LULC analyses, we use a case study
that assesses structural and functional changes associated
with anthropogenic footprints in the Alberta boreal forest.
A detailed description of the case study is provided in
Electronic Supplementary Material (ESM1).
Human activities in the Alberta boreal forest
Understanding the consequences of anthropogenic foot-
prints in Alberta is of global significance, because resource
extraction here affects more than 100 000 km2 of one of the
largest and most intact forest biomes in the world (Rosa
et al. 2017; Fisher and Burton 2018) (Fig. 2). The focus
within the Alberta boreal biome has historically been on
species or biodiversity responses to forestry (e.g., Nielsen
et al. 2004), and on the effects of habitat loss associated
with open-pit mining of oil sands (e.g., Rooney et al. 2012).
However, there has been increasing attention to the more
localized, but widespread (i.e., more than 1.8 million km of
linear features), footprint of in situ oil sands developments
(Fisher and Burton 2018; Riva et al. 2018a; Fig. 2).
Most Canadian oil sands are subterranean and thus
extracted with wells (in situ extraction), not open-pit
mining, which is limited to the area around Fort McMurray
to Fort MacKay. Consequently, hundreds of thousands of
kilometers of seismic lines have been cleared of trees and
shrubs to map oil sands deposits (Dabros et al. 2018).
Seismic lines represent only one footprint with additional
disturbances associated with well pads, pipelines, cut-
blocks, and other industrial features (Fisher and Burton
2018). Add to that an active natural wildfire regime
(Flannigan et al. 2009) and the successional dynamics and
structural patterns of these forests are being substantially
altered, resulting in long-lasting and complex interactive
responses (van Rensen et al. 2015; Mahon et al. 2019; Riva
et al. 2020).
Habitat loss is, however, quite limited in these land-
scapes compared to many regions of the world (i.e., esti-
mates to date suggest less than 15% of the native forest
cover; Rosa et al. 2017; Mahon et al. 2019), but it is
widespread in extent because of the exploration nature of
the linear features. This affects a variety of ecological
processes due to hyper-connected patches of early seral
forests and unprecedented amounts of forest edges (e.g.,
80 km of edges per km2 of forest; Stern et al. 2018),
including movements of species, alterations to the abiotic
environments, and more broadly the distribution of
resources in these forests (Fisher and Burton 2018; Riva
et al. 2018b; Roberts et al. 2018; Stern et al. 2018).
Changes in resources determine idiosyncratic responses
between taxa, with ‘‘winners or losers’’ depending on
species’ ecology and context, and key to these responses
are biotic interactions (Fisher and Burton 2018; Dickie
et al. 2019; Mahon et al. 2019; Riva et al. 2020). Despite
awareness of these phenomena, assessments of anthro-
pogenic footprints in Alberta’s boreal forest have been
primarily structural (Jordaan 2012; Rosa et al. 2017), not
functional. Furthermore, the resolution of common LULC
(C 30 m) underestimates the effect of thousands of kilo-
meters of narrow (\ 10 m) seismic lines in the area (Rosa
et al. 2017).
Analysis overview
We used high-resolution (5 m) baseline LULC data to
assess 11 anthropogenic footprint categories and a ‘‘boreal
forest’’ category (see Table S1 in Electronic Supplemen-
tary Material). Specifically, a baseline disturbance raster
was created by rasterizing a series of polygon and polyline
layers from the Alberta Biodiversity Monitoring Institute
(‘‘Wall-to-Wall Human Footprint Inventory’’, available at
https://www.abmi.ca/). Based on this raster, we first mea-
sured the total surface of the study area affected by dif-
ferent anthropogenic LULC categories, providing a
structural quantification of anthropogenic changes (i.e.,
loss of forest cover). Then, we manipulated the thematic
and spatial resolution of the baseline LULC to create
functional LULCs that match six ecological processes of
interest—diversity of woody plants, diversity of butterflies,
occurrence of American marten (Martes americana),
habitat suitability for ovenbird (Seiurus aurocapilla),
habitat use for woodland caribou (Rangifer tarandus
caribou), and wildfire ignition (Table 1). We chose these
six processes (five taxa and wildfire) because Environ-
mental Impact Assessments in northern Alberta generally
assess between * 5 and 15 taxa (Campbell et al. 2019),
123� Royal Swedish Academy of Sciences 2020
www.kva.se/en
Ambio

but certainly more species and processes can be added for a
more detailed assessment. We assessed patterns of func-
tional change for the six functional LULCs by measuring:
(i) presence of anthropogenic footprints, and (ii) proportion
of anthropogenic footprints within a moving window of
sizes representing ecologically meaningful ‘‘scale of
effects’’. We then measured these responses around 1173
systematically spaced points at distances of 10 km (dis-
tance between points selected to avoid overlapping
between moving windows at the largest analysis scale,
5 km) where values for each ecological measure were
queried. The moving window analysis summarized the
Fig. 2 Boreal forest of North America a is one of the largest and most intact biomes in the planet. In Alberta, these forests are characterized by
widespread anthropogenic footprints associated with the extraction of timber and petroleum products (b). In situ extraction of oil sands is
especially prevalent in this region, dissecting thousands of km2 of forests (b, c), primarily due to linear features necessary to locate the
underground oil sands reserve
Table 1 Phenomena informing the sampling and analysis scales for six functional LULC evaluated in this case study
Phenomenon Sampling scale (spatial
resolution) (m)
Analysis scale (moving
window size) (m)
References
Woody plant diversity decreases at sites closer than 20 m from forest
edges
5 20 Dabros et al.
(2017)
Butterfly diversity increases at sites surrounded from more disturbed
landscapes in 250 m radii
10 250 Riva et al.
(2018a)
Occurrence of American marten decreases with high densities of
anthropogenic linear features in their home range
5 1250 Tigner et al.
(2015)
Abundance of ovenbird declines at line densities higher than 15 km of
lines per km210 2000 Bayne et al.
(2005)
Woodland caribou avoid forests in a radius of 500 m from
anthropogenic footprints
10 500 Environment
Canada (2011)
Wildfire ignition increases in areas with higher road densities at 5000 m
radii
1000 5000 Arienti et al.
(2009)
� Royal Swedish Academy of Sciences 2020
www.kva.se/en 123
Ambio

proportion of footprint defined for that ecological measure
based on a binary disturbance grid (i.e., 0, boreal forest; 1,
anthropogenic footprint) at radii specific for each measure
(Table 1) by calculating their mean value. Finally, to
evaluate if patterns of functional change were similar
across the six processes evaluated, we calculated pairwise
Pearson correlation coefficients between the measures from
each scenario at each point. Low correlation coefficients
would suggest that, despite originating from the same
structural change, functional changes related to the
anthropogenic footprint differ substantially.
Functional changes largely exceed structural
changes
We documented limited structural changes, with * 94%
of the area covered by natural forests. Among different
anthropogenic LULC categories, * 3% of the study area
was affected by forestry, * 1% was affected by open-pit
mining, and * 2% was affected by energy exploration due
to seismic lines (Table S1). On the other hand, between
14% (for woody plants) and 93% (for American marten) of
the landscape was affected by anthropogenic footprints as
determined by their process scale (Fig. 3a). The proportion
of anthropogenic footprints varied substantially between
different processes (Fig. 3b; Pearson correlation coefficient
varying between 0.2 and 0.9; Appendix S1) and across
space (Fig. 4). While similar scales of sampling (spatial
resolutions) and analysis (moving window size) tended to
result in higher correlations between scenarios, the char-
acteristics of different ecological processes mediated
important differences. For instance, woody plants and
American marten respond to the same sampling scale
(5 m), but patterns in functional change between these two
processes showed the lowest Pearson correlation coeffi-
cient (r = 0.2; ESM 1, and insets ‘‘a’’ vs. ‘‘d’’ in Figs. 4, 5).
Management implications
This analysis demonstrates how structural and functional
assessments of LULC can differ substantially due to the
characteristics of different ecological processes, e.g., here
due to responses to edges in behavior, microclimate or
resources. Environmental impact assessments in Canada
focus on valued ecosystem components (e.g., species of
conservation interest or culturally important, such as
woodland caribou), and the impact to wildlife are measured
indirectly through predicted changes in habitat amount
(Campbell et al. 2019). It has been argued that these
environmental assessments need to be improved in their
efficiency and rigor (Campbell et al. 2019), requiring an
integrative management plan that explicitly defines which
processes ought to be prioritized, and which effects are
desirable or undesirable. These objectives require a func-
tional perspective: integrating structural and functional
assessments of habitat change could therefore complement
other approaches (e.g., habitat suitability surfaces, research
selection functions) in informing areas of priority for
regional development plans, as well as management, con-
servation, and restoration practices.
More broadly, when ecologists and practitioner are
required to quantify habitat change, they need to be aware
of the limitations of structural LULC analyses, and
acknowledge that it is not possible to describe the myriad
of effects of habitat changes with a single structural mea-
sure. This is especially important in areas where the effects
of habitat configuration (e.g., edge effects or connectivity/
isolation effects) play an important role in determining
species responses, such as in the dissected forests of
Alberta that we show here. Similar patterns in habitat
configuration occur worldwide, with 70% of the world
forests being within 1 km from forest edges (Haddad et al.
2015), and over 21 million km of roads on the Earth
Fig. 3 Proportion of landscapes affected by anthropogenic footprints (a), and relative amount of functional change (b) for the six ecological
processes described in Table 1. In b, each of the gray points represents one of 1173 landscape sampled, boxplots summarize the distribution of
the samples (i.e., box delimiting 25%, 50% (median) and 75% percentiles), and blue dots represent the mean proportion of functional change in
each scenario. Horizontal red lines in each graph represent the total amount of anthropogenic cover in the study area (* 6%), a measure of
structural forest changes
123� Royal Swedish Academy of Sciences 2020
www.kva.se/en
Ambio

(Meijer et al. 2018). Notably, an increase of * 3–5 million
km of roads is expected by 2050, especially within the
world’s last remaining wilderness areas (e.g., Amazon, the
Congo basin and New Guinea; Meijer et al. 2018). Here,
structural LULC assessments alone will fail to capture the
full effect of road edges on biodiversity and ecosystem
processes.
DISCUSSION
In this perspective, we discuss the benefits of taking a
functional perspective in designing and analyzing LULC.
The premise of functional analyses is to explicitly link the
characteristics of geospatial data to an ecological phe-
nomenon of interest (Riva and Nielsen 2020) and, in a
future of high-resolution remote sensing data (Jetz et al.
Fig. 4 Spatial distribution of functional changes associated with anthropogenic footprints in the Alberta boreal forest, for six processes of
interest: a diversity of woody plants, b diversity of butterflies, c habitat suitability for ovenbird, d occurrence of American marten, e habitat use
for woodland caribou, and f wildfire ignition
� Royal Swedish Academy of Sciences 2020
www.kva.se/en 123
Ambio

2019; Wickham and Riitters 2019), opportunities to con-
duct these assessments will be increasingly common.
Therefore, a clear and explicit focus on ecological pro-
cesses have high potential to enhance our understanding of
changes in habitat via analyses of LULC. We demonstrated
this by measuring environmental change within the Alberta
boreal biome, where localized anthropogenic footprints
affect many ecological processes and in different ways
(Fig. 2). As one pattern of structural change often results in
multiple patterns of functional changes, functional analyses
can provide complementary insights to structural analyses:
in our example, the functional changes associated with
Fig. 5 Functional changes associated to anthropogenic footprints (black mask) across the same landscape in relation to six ecological processes:
a diversity of woody plants, b diversity of butterflies, c habitat suitability for ovenbird, d occurrence of American marten, e habitat use for
woodland caribou, and f wildfire ignition. Color surfaces indicate functional change measured as proportion of anthropogenic footprint within
moving windows. Thematic resolution (i.e., which anthropogenic footprints where included in the black mask), spatial resolution (i.e., pixel size),
and moving window extent were tailored to the characteristics of the different phenomena as described in Table 1 and ESM1
123� Royal Swedish Academy of Sciences 2020
www.kva.se/en
Ambio

anthropogenic footprints vary by nearly one order of
magnitude (Fig. 3) and in geographic space (Figs. 4, 5).
How human activities affect the Canadian boreal biome is a
case of international relevance (Fisher and Burton 2018),
with ecological responses to anthropogenic footprints being
relatively well known (Dabros et al. 2018), but for areas
where information is scarce our results suggest that relying
solely on a structural assessment may underestimate the
effect of human activities on ecological processes.
Categorical or continuous models in functional
analyses?
LULC are one of the most commonly used sources of
geospatial information in analyses of habitat loss and
change, including analyses of habitat amount (Watling
et al. 2020), heterogeneity (Riva et al. 2018a), and con-
nectivity (Tischendorf and Fahrig 2000). Yet, LULC are
abstractions of continuous gradients in environmental
heterogeneity, and are therefore affected by well-known
limitations. For instance, LULC can be defined arbitrarily,
can differ from real environmental conditions, can be
ecologically irrelevant, and can lose variability within and
between categories (Coops and Wulder 2019; Riva and
Nielsen 2020). Furthermore, LULC may not describe
accurately temporal dynamics and landscape changes
(Coops and Wulder 2019). Given these limitations, it has
even been argued that discrete geospatial data should be
abandoned altogether, ‘‘breaking the habit’’ of relying on
LULC (Coops and Wulder 2019).
One factor that is catalyzing a transition from use of
categorical to continuous data is the increasing availability
of geospatial information at high resolutions and for the
entire planet. For instance, Sentinel-2 satellites provide
10-m resolution, multispectral images every 10 days since
2015, and the Global Ecosystem Dynamics Investigation
(GEDI) provides information on vegetation structure at a
25-m resolution. These remote sensing products may relate
to ecological processes more strongly than traditional
LULC, as demonstrated by studies relating indices of
vegetation structure and species richness in birds (Farwell
et al. 2020) or spectral–temporal metrics and species’
habitat for mammals (Oeser et al. 2020). In the light of
these facts, we agree with Coops and Wulder (2019) that
continuous maps can be biologically more meaningful, and
have significant potential in aiding studies at the interface
between ecology and remote sensing. However, it is also
true that LULC remain widely used, and have the potential
to remain a valuable tool in ecology.
We stress that we are not recommending using LULC in
every assessment of habitat change, but rather are
proposing a framework that facilitates integrating ecolog-
ical theory in their analysis. Approaches to increase the
ecological relevance of LULC have been common in the
literature, including analyses that combine LULC and
continuous data (e.g., Abdi 2013), and metrics that evaluate
specific landscape properties (e.g., habitat amount and
connectivity; Sadoti et al. 2017) or are designed to incor-
porate ecological processes (e.g., core habitat; McGarigal
2014). A functional perspective does not exclude these
approaches; rather, it is a necessary precondition to ensure
that they are applied in meaningful ways.
Ultimately, we believe that LULC will remain useful for
both applied and basic research, but the objective of a study
should dictate whether continuous or categorical surfaces
(or their combination) are the most appropriate tool to
address the question of interest. In some cases, LULC may
be the only product available for assessing changes in
habitat. For instance, defining patches can be problematic
with continuous geospatial data, and some fields in ecology
rely on the definition of patches as part of their framework
(e.g., metapopulation ecology; Hanski 1998). Additionally,
historical maps have even been digitized to compare
changes in LULC across centuries (Cousins et al. 2015;
Pindozzi et al. 2016), and there is a tradition of studies
evaluating temporal changes in land cover (e.g., the sem-
inal work of Curtis 1956). Yet, it is also true that we have
accumulated decades of continuous spectral data (e.g.,
Landsat imagery since 1972) and thus the potential to
describe more subtle dynamics in space and time, e.g., the
physiognomy of plants (Kattenborn et al. 2020). Therefore,
we stress that the focus of a study, technical limits (e.g.,
classification accuracy and sources of uncertainty in
geospatial data), and the scales of phenomenon, sampling,
and analyses should inform when LULC are adequate to
address a specific question (Lechner et al. 2014; Riva and
Nielsen 2020).
Enhancing the ecological rationale of the analysis
of LULC
Moving forward, it is crucial that scientists and practi-
tioners interested in geospatial analyses begin their study
by critically evaluating what properties of landscapes they
are interested in representing, if these properties can be
meaningfully represented with LULC and/or continuous
data, and whether a functional perspective is required. To
facilitate this task, we provide a series of questions that will
help to assess the appropriateness of LULC for a given
project:
• Are the environmental gradients of interest better
represented by continuous or categorical LULC data
for assessments of habitat change?
Continuous data better represent smooth gradients (e.g.,
canopy height), whereas categorical, LULC data better
� Royal Swedish Academy of Sciences 2020
www.kva.se/en 123
Ambio

represent abrupt environmental changes (e.g., forest vs.
grassland).
• What is the scope of the study?
Structural LULC analyses are coarse-filter, top-down
assessments that focus on broad classifications of
environmental gradients based solely on spectral prop-
erties, whereas functional LULC analyses provide fine-
filter, bottom-up assessments that focus on species or
specific ecological processes. The information provided
by the two approaches are complementary and distinct.
• What is the extent of the study area?
Structural analyses are the most reasonable approach to
larger study extents (e.g., continents), because the
ecological implications of changes in LULC often
change across biomes. Conversely, functional analyses
of LULC are appropriate at regional scales, where
ecological processes can more reasonably be assumed
to be stationary.
• Are geospatial data appropriate for conducting func-
tional LULC analyses?
LULC at resolutions coarser than the scale of phe-
nomenon are not appropriate to conduct functional
analyses. The fit of available data (e.g., resolution,
minimum mappable unit, filters, and uncertainties
associated with classification schemes, spatial scales,
and classification errors) is crucial in determining the
appropriateness of LULC for an analysis.
• Are the authors interested in testing specific hypothe-
ses?
Studies based on rigorous test of hypotheses (the ‘‘day
science’’ sphere) benefit from a functional perspective,
whereas studies that are inherently exploratory (the
‘‘night science’’ sphere) by definition do not require a
functional perspective (Jacob 1988).
• Is there reliable information to the phenomenon of
interest?
When the phenomenon of interest is poorly understood,
exploratory structural analyses may be the only viable
approach to evaluating changes in habitat.
Increasing availability and quality of geospatial data
will provide ecologists and practitioners with endless
opportunities in the twenty-first century. LULC have been
traditionally used to evaluate changes in habitat, and we
believe that in the future there will be opportunities to use
LULC in novel, exciting ways. We hope this perspective
will stimulate a constructive debate around the benefits and
limitations of the analysis of LULC, while inspiring future
work in the use of functional analyses.
Acknowledgements We thank the editors and two anonymous
reviewers for timely and constructive feedback on this perspective
paper.
REFERENCES
Abdi, A.M. 2013. Integrating open access geospatial data to map the
habitat suitability of the declining corn bunting (Miliariacalandra). ISPRS International Journal of Geo-Information 2
(4): 935–954. https://doi.org/10.3390/ijgi2040935.
Arienti, M.C., S.G. Cumming, M.A. Krawchuk, and S. Boutin. 2009.
Road network density correlated with increased lightning fire
incidence in the Canadian western boreal forest. InternationalJournal of Wildland Fire 18: 970–982. https://doi.org/10.1071/
WF08011.
Bayne, E.M., S.L. Van Wilgenburg, S. Boutin, and K.A. Hobson.
2005. Modeling and field-testing of Ovenbird (Seiurus auro-capillus) responses to boreal forest dissection by energy sector
development at multiple spatial scales. Landscape Ecology 20:
203–216. https://doi.org/10.1007/s10980-004-2265-9.
Borra, S., R. Thanki, and N. Dey. 2019. Satellite image analysis:Clustering and classification., SpringerBriefs in applied sciences
and technology Singapore: Springer. https://doi.org/10.1007/
978-981-13-6424-2.
Campbell, M.A., B. Kopach, P.E. Komers, and A.T. Ford. 2019.
Quantifying the impacts of oil sands development on wildlife:
perspectives from impact assessments. Environmental Reviews9: 1–9. https://doi.org/10.1139/er-2018-0118.
Coops, N.C., and M.A. Wulder. 2019. Breaking the habit(at). Trendsin Ecology and Evolution 34: 585–587. https://doi.org/10.1016/j.
tree.2019.04.013.
Cousins, S.A.O., A.G. Auffret, J. Lindgren, and L. Trank. 2015.
Regional-scale land-cover change during the 20th century and its
consequences for biodiversity. Ambio 44: 17–27. https://doi.org/
10.1007/s13280-014-0585-9.
Crooks, K.R., C.L. Burdett, D.M. Theobald, S.R.B. King, M. Di
Marco, C. Rondinini, and L. Boitani. 2017. Quantification of
habitat fragmentation reveals extinction risk in terrestrial mam-
mals. Proceedings of the National academy of Sciences of theUnited States of America 114: 7635–7640. https://doi.org/10.
1073/pnas.1705769114.
Curtis, J.T. 1956. The modification of mid-latitude grasslands and
forests by man. In Man’s role in changing the face of the earth,
ed. W.L. Thomas Jr., 721–736. Chicago: University of Chicago
Press.
Dabros, A., H.E. James Hammond, J. Pinzon, B. Pinno, and D.
Langor. 2017. Edge influence of low-impact seismic lines for oil
exploration on upland forest vegetation in northern Alberta
(Canada). Forest Ecology and Management 400: 278–288.
https://doi.org/10.1016/j.foreco.2017.06.030.
Dabros, A., M. Pyper, and G. Castilla. 2018. Seismic lines in the
boreal and arctic ecosystems of North America: Environmental
impacts, challenges, and opportunities. Environmental Reviews16: 1–16. https://doi.org/10.1139/er-2017-0080.
Daskalova, G.N., I.H. Myers-Smith, A.D. Bjorkman, S.A. Blowes,
S.R. Supp, A.E. Magurran, and M. Dornelas. 2020. Landscape-
scale forest loss as a catalyst of population and biodiversity
change. Science 368: 1341–1347. https://doi.org/10.1126/
science.aba1289.
Dennis, R.L.H., T.G. Shreeve, and H. Van Dyck. 2003. Towards a
functional resource-based concept for habitat: A butterfly
biology viewpoint. Oikos 102: 417–426.
Dickie, M., R.S. McNay, G.D. Sutherland, M. Cody, and T. Avgar.
2019. Corridors or risk? Movement along, and use of, linear
features vary predictably among large mammal predator and
prey species. Journal of Animal Ecology 1365–2656: 13130.
https://doi.org/10.1111/1365-2656.13130.
Dungan, J.L., J.N. Perry, M.R.T.T. Dale, P. Legendre, S. Citron-
Pousty, M.-J.J. Fortin, A. Jakomulska, M. Miriti, et al. 2002. A
123� Royal Swedish Academy of Sciences 2020
www.kva.se/en
Ambio

balanced view of scale in spatial statistical analysis. Ecography25: 626–640. https://doi.org/10.1034/j.1600-0587.2002.250510.
x.
Environment Canada. 2011. Recovery Strategy for the Woodland
Caribou, Boreal population (Rangifer tarandus caribou) in
Canada. Species at Risk Act, Recovery Strategy Series. Envi-
ronment Canada, Ottawa. xi ? 138 pp.
Fahrig, L. 2020. Why do several small patches hold more species than
few large patches? Edited by David Storch. Global Ecology andBiogeography. https://doi.org/10.1111/geb.13059.
Fahrig, L., J. Baudry, L. Brotons, F.G. Burel, T.O. Crist, R.J. Fuller,
C. Sirami, G.M. Siriwardena, et al. 2011. Functional landscape
heterogeneity and animal biodiversity in agricultural landscapes.
Ecology Letters 14: 101–112. https://doi.org/10.1111/j.1461-
0248.2010.01559.x.
Farwell, L.S., P.R. Elsen, E. Razenkova, A.M. Pidgeon, and V.C.
Radeloff. 2020. Habitat heterogeneity captured by 30-m resolu-
tion satellite image texture predicts bird richness across the
United States. Ecological Applications In Press. https://doi.org/
10.1002/eap.2157.
Fisher, J.T., and A.C. Burton. 2018. Wildlife winners and losers in an
oil sands landscape. Frontiers in Ecology and the Environment16: 323–328. https://doi.org/10.1002/fee.1807.
Flannigan, M.D., M.A. Krawchuk, W.J. de Groot, M.B. Wotton, and
L.M. Gowman. 2009. Implications of changing climate for
global wildland fire. International Journal of Wildland Fire 18:
483–507. https://doi.org/10.1071/WF08187.
Gustafson, E.J. 2018. How has the state-of-the-art for quantification
of landscape pattern advanced in the twenty-first century?
Landscape Ecology. https://doi.org/10.1007/s10980-018-0709-x.
Haddad, N.M., L.A. Brudvig, J. Clobert, K.F. Davies, A. Gonzalez,
R.D. Holt, T.E. Lovejoy, J.O. Sexton, et al. 2015. Habitat
fragmentation and its lasting impact on Earth’s ecosystems.
Science Advances 1: 1–10. https://doi.org/10.1126/sciadv.
1500052.
Hanski, I. 1998. Metapopulation dynamics. Nature 396: 41–49.
https://doi.org/10.1016/0169-5347(89)90061-X.
Jacob, F. 1988. The statue within: An autobiography. New York: Cold
Spring Harbor Laboratory Press.
Jetz, W., M.A. McGeoch, R. Guralnick, S. Ferrier, J. Beck, M.J.
Costello, M. Fernandez, G.N. Geller, et al. 2019. Essential
biodiversity variables for mapping and monitoring species
populations. Nature Ecology and Evolution 3: 539–551. https://
doi.org/10.1038/s41559-019-0826-1.
Jordaan, S.M. 2012. Land and water impacts of oil sands production
in Alberta. Environmental Science and Technology 46:
3611–3617. https://doi.org/10.1021/es203682m.
Kareiva, P., and M. Marvier. 2012. What is conservation science?
BioScience 62: 962–969. https://doi.org/10.1525/bio.2012.62.11.
5.
Kattenborn, T., F.E. Fassnacht, and S. Schmidtlein. 2019. Differen-
tiating plant functional types using reflectance: Which traits
make the difference? Remote Sensing in Ecology and Conser-vation 5: 5–19. https://doi.org/10.1002/rse2.86.
Lechner, A.M., W.T. Langford, S.D. Jones, S.A. Bekessy, and A.
Gordon. 2012. Investigating species–environment relationships
at multiple scales: Differentiating between intrinsic scale and the
modifiable areal unit problem. Ecological Complexity 11:
91–102. https://doi.org/10.1016/j.ecocom.2012.04.002.
Lechner, A.M., C.M. Raymond, V.M. Adams, M. Polyakov, A.
Gordon, J.R. Rhodes, M. Mills, A. Stein, et al. 2014. Charac-
terizing spatial uncertainty when integrating social data in
conservation planning. Conservation Biology 28: 1497–1511.
https://doi.org/10.1111/cobi.12409.
Mahon, C.L., G.L. Holloway, E.M. Bayne, and J.D. Toms. 2019.
Additive and interactive cumulative effects on boreal landbirds:
Winners and losers in a multi-stressor landscape. EcologicalApplications. https://doi.org/10.1002/eap.1895.
McGarigal, K. 2014. Landscape Pattern Metrics. In Wiley StatsRef:Statistics Reference Online, ed. J.N. Rao. Chichester: Wiley.
Meijer, J.R., M.A.J. Huijbregts, K.C.G.J. Schotten, and A.M.
Schipper. 2018. Global patterns of current and future road
infrastructure. Environmental Research Letters 13: 1–10. https://
doi.org/10.1088/1748-9326/aabd42.
Mendoza-Ponce, A., R.O. Corona-Nunez, L. Galicia, and F. Kraxner.
2019. Identifying hotspots of land use cover change under
socioeconomic and climate change scenarios in Mexico. Ambio48: 336–349. https://doi.org/10.1007/s13280-018-1085-0.
Newbold, T., L.N. Hudson, S.L.L. Hill, S. Contu, I. Lysenko, R.A.
Senior, L. Borger, D.J. Bennett, et al. 2015. Global effects of
land use on local terrestrial biodiversity. Nature 520: 45–50.
https://doi.org/10.1038/nature14324.
Nielsen, S.E., M.S. Boyce, and G.B. Stenhouse. 2004. Grizzly bears
and forestry: I. Selection of clearcuts by grizzly bears in west-
central Alberta, Canada. Forest Ecology and Management.https://doi.org/10.1016/j.foreco.2004.04.014.
Nielsen, S.E., E.M. Bayne, J. Schieck, J. Herbers, and S. Boutin.
2007. A new method to estimate species and biodiversity
intactness using empirically derived reference conditions. Bio-logical Conservation 137: 403–414. https://doi.org/10.1016/j.
biocon.2007.02.024.
Oeser, J., M. Heurich, C. Senf, D. Pflugmacher, E. Belotti, and T.
Kuemmerle. 2020. Habitat metrics based on multi-temporal
Landsat imageryfor mapping large mammal habitat. RemoteSensing in Ecology and Conservation 6: 52–69. https://doi.org/
10.1002/rse2.122.
O’Neill, R.V., J.R. Krummel, R.H. Gardner, G. Sugihara, B. Jackson,
D.L. DeAngelis, B.T. Milne, M.G. Turner, et al. 1988. Indices of
landscape pattern. Landscape Ecology 1: 153–162. https://doi.
org/10.1007/BF00162741.
Pindozzi, S., E. Cervelli, A. Capolupo, C. Okello, and L. Boccia.
2016. Using historical maps to analyze two hundred years of
land cover changes: Case study of Sorrento peninsula (south
Italy). Cartography and Geographic Information Science 43:
250–265. https://doi.org/10.1080/15230406.2015.1072736.
Sadoti, G., A.L. Jones, W.G. Shriver, and P.D. Vickery. 2017.
Employing landscape metrics in an open population model to
estimate demographic parameters of a grassland bird. LandscapeEcology 32: 1553–1562. https://doi.org/10.1007/s10980-017-
0535-6.
Riitters, K.H., J.D. Wickham, and J.W. Coulston. 2004. A preliminary
assessment of Montreal process indicators of forest fragmenta-
tion for the United States. Environmental Monitoring andAssessment 91: 257–276. https://doi.org/10.1023/B:EMAS.
0000009240.65355.92.
Riva, F., and S.E. Nielsen. 2020. Six key steps for functional
landscape analyses of habitat change. Landscape Ecology.
https://doi.org/10.1007/s10980-020-01048-y.
Riva, F., J.H. Acorn, and S.E. Nielsen. 2018a. Localized disturbances
from oil sands developments increase butterfly diversity and
abundance in Alberta’s boreal forests. Biological Conservation217: 173–180. https://doi.org/10.1016/j.biocon.2017.10.022.
Riva, F., J.H. Acorn, and S.E. Nielsen. 2018b. Narrow anthropogenic
corridors direct the movement of a generalist boreal butterfly.
Biology Letters. https://doi.org/10.1098/rsbl.2017.0770.
Riva, F., J. Pinzon, J.H. Acorn, and S.E. Nielsen. 2020. Composite
effects of cutlines and wildfire result in fire refuges for plants and
butterflies in boreal treed peatlands. Ecosystems 23: 485–497.
https://doi.org/10.1007/s10021-019-00417-2.
Roberts, D., S. Ciuti, Q.E. Barber, C. Willier, and S.E. Nielsen. 2018.
Accelerated seed dispersal along linear disturbances in the
� Royal Swedish Academy of Sciences 2020
www.kva.se/en 123
Ambio

Canadian oil sands region. Scientific Reports. https://doi.org/10.
1038/s41598-018-22678-y.
Rooney, R.C., S.E. Bayley, and D.W. Schindler. 2012. Oil sands
mining and reclamation cause massive loss of peatland and
stored carbon. Proceedings of the National academy of Sciencesof the United States of America 109: 4933–4937. https://doi.org/
10.1073/pnas.1.
Rosa, L., K.F. Davis, M.C. Rulli, and P. D’Odorico. 2017. Environ-
mental consequences of oil production from oil sands. Earth’sFuture 5: 158–170. https://doi.org/10.1002/2016EF000484.
Soule, M.E. 1985. What is Conservation Biology? A new synthetic
discipline addresses the dynamics and problems of perturbed
species, communities, and ecosystems. BiosSience. https://doi.
org/10.2307/1310054.
Stern, E., F. Riva, and S. Nielsen. 2018. Effects of narrow linear
disturbances on light and wind patterns in fragmented boreal
forests in Northeastern Alberta. Forests 9: 486. https://doi.org/
10.3390/f9080486.
Taubert, F., R. Fischer, J. Groeneveld, S. Lehmann, M.S. Muller, E.
Rodig, T. Wiegand, and A. Huth. 2018. Global patterns of
tropical forest fragmentation. Nature 554: 519–522. https://doi.
org/10.1038/nature25508.
Tigner, J., E.M. Bayne, and S. Boutin. 2015. American Marten
respond to seismic lines in Northern Canada at two spacial
scales. PLoS ONE 10: e0118720. https://doi.org/10.1371/journal.
pone.0118720.
Tingley, M.W., E.S. Darling, and D.S. Wilcove. 2014. Fine- and
coarse-filter conservation strategies in a time of climate change.
Annals of the New York Academy of Sciences 1322: 92–109.
https://doi.org/10.1111/nyas.12484.
Tischendorf, L., and L. Fahrig. 2000. On the usage and measurement
of landscape connectivity. Oikos 90: 7–19. https://doi.org/10.
1034/j.1600-0706.2000.900102.x.
Tuanmu, M.N., and W. Jetz. 2014. A global 1-km consensus land-
cover product for biodiversity and ecosystem modelling. GlobalEcology and Biogeography 23: 1031–1045. https://doi.org/10.
1111/geb.12182.
van Rensen, C.K., S.E. Nielsen, B. White, T. Vinge, and V.J. Lieffers.
2015. Natural regeneration of forest vegetation on legacy seismic
lines in boreal habitats in Alberta’s oil sands region. BiologicalConservation 184: 127–135. https://doi.org/10.1016/j.biocon.
2015.01.020.
Watling, J.I., V. Arroyo-Rodrıguez, M. Pfeifer, L. Baeten, C. Banks-
Leite, L.M. Cisneros, R. Fang, A.C. Hamel-Leigue, et al. 2020.
Support for the habitat amount hypothesis from a global
synthesis of species density studies. Ecology Letters 23:
674–681. https://doi.org/10.1111/ele.13471.
Wickham, J., and K.H. Riitters. 2019. Influence of high-resolution
data on the assessment of forest fragmentation. LandscapeEcology. https://doi.org/10.1007/s10980-019-00820-z.
Publisher’s Note Springer Nature remains neutral with regard to
jurisdictional claims in published maps and institutional affiliations.
AUTHOR BIOGRAPHIES
Federico Riva (&) is a postdoctoral fellow at the University of
Alberta. He is interested in Conservation Biology, Landscape Ecol-
ogy, and Community Ecology.
Address: Department of Renewable Resources, University of Alberta,
751 GSB 9007 - 116 St NW, Edmonton, AB T6G 2H1, Canada.
e-mail: [email protected]
Scott E. Nielsen is a Professor of Conservation Biology at the
University of Alberta. He is interested in Terrestrial Ecology and its
Applications to the Field of Conservation Biogeography.
Address: Department of Renewable Resources, University of Alberta,
751 GSB 9007 - 116 St NW, Edmonton, AB T6G 2H1, Canada.
Address: University of Alberta, 701 General Services Building 9007 -
116 St NW, Edmonton, ABAB T6G 2H1, Canada.
e-mail: [email protected]
123� Royal Swedish Academy of Sciences 2020
www.kva.se/en
Ambio