a fully redundant on-line mass spectrometer system used to … · launch on the mobile launcher...
TRANSCRIPT
A Fully Redundant On-Line Mass Spectrometer System Used To Monitor
Cryogenic Fuel Leaks on the Space Shuttle
Timothy P. Griffin, Guy R. Naylor, William D. Haskell
DNX-14, Dynacs Inc., Kennedy Space Center, FL 32899
Greg S. Breznik, Carolyn A. Mizell, and William R. Helms
NASA, Kennedy Space Center, FL 32899
Address reprint requests to Timothy P. Griffin, DNX-14, Kennedy Space Center,
FL 32899, (321) 867-6755, [email protected]
https://ntrs.nasa.gov/search.jsp?R=20020051130 2020-05-16T02:11:41+00:00Z

Abstract
An on-line gas monitoring system was developed to replace the older systems
used to monitor for cryogenic leaks on the Space Shuttles before launch. The
system uses a mass spectrometer to monitor multiple locations in the process,
which allows the system to monitor all gas constituents of interest in a nearly
simultaneous manner. The system is fully redundant and meets all requirements
for ground support equipment (GSE). This includes ruggedness to withstand
launch on the Mobile Launcher Platform (MLP), ease of operation, and minimal
operator intervention. The system can be fully automated so that an operator is
notified when an unusual situation or fault is detected. User inputs are through
personal computer using mouse and keyboard commands. The graphical user
interface is very intuitive and easy to operate. The system has successfully
supported four launches to date. It is currently being permanently installed as the
primary system monitoring the Space Shuttles during ground processing and
launch operations. Time and cost savings will be substantial over the current
systems when it is fully implemented in the field. Tests were performed to
demonstrate the performance of the system. Low limits-of-detection, small drift,
and improvements in the sample delivery system make the system a major
enhancement over the current systems. Though this system is currently optimized

for detectingcryogenicleaks,manyothergasconstituentscouldbemonitored
usingtheHazardousGasDetectionSystem(HGDS)2000.
Key Words: on-linemassspectrometry,real-timemonitoring,SpaceShuttle,gasmonitoring,leakmonitoring,processmassspectrometry

6
Introduction
The main engines of the Space Shuttles use cryogenic fuel (liquid hydrogen -
LH2) and oxidizer (liquid oxygen - LO2). The fuel and oxidizer are stored in the
external tank and feed to the engines during launch. To help ensure that no
hazardous leaks are present in the Orbiters, the cryogenic systems are thoroughly
leak tested before each launch. Because of the inherent hazards associated with
large quantities of liquid hydrogen and liquid oxygen, the leak tests are performed
with helium (He). This requires that helium in an air background be monitored
during a large portion of the prelaunch testing. The limit-of-detection for helium
is in the range of 1 part per million (ppm). After the external tank is filled with
the cryogenic commodities, the levels of hydrogen (H2), oxygen (02), and argon
(Ar) in a nitrogen background are monitored. A new system was designed to
monitor all of these gases (H2, He, N2, 02, and Ar) and is called the Hazardous
Gas Detection Systems (HGDS) 2000 [1,2].
There are currently a number of systems being used for each launch. The two that
are the most critical are the Prime HGDS and Backup HGDS. These systems
have proven to be invaluable in helping to ensure safe launches. The systems
have their own sample delivery subsystems, including transport pumps and
selector valves. In addition, both systems use mass spectrometers as the detector.

ThePrimeHGDSusesalinearquadrupolewhile theBackupHGDSincorporates
afixed sector.Bothsystemsutilizedion pumpsto generatethenecessaryhigh
vacuums.Thesystemsweredevelopedandinstalledin the1970's. Sincethen
two additionalsystemsutilizing fixedsectorshavebeendeveloped.Theyarethe
HydrogenUmbilical MassSpectrometer(HUMS) [3] andPortableAft Mass
Spectrometer(PAMS)[4]. TheHUMS andPAMSsystemsenabledmonitoring
of cryogenicgasesin a heliumbackgroundandtheability to monitorlow levelsof
heliumin anairbackground,respectively.Thenewon-linemassspectrometer
wasdesignedto incorporatetherequirementsof all existingsystems.
Themajorsystemsusedfor monitoringcryogenicfuel leaksbeforelaunchhave
beenin servicefor over20 years.Forthis reasontheoperatorsarestartingto
haveproblemskeepingtheunitsin operatingorder. While thesystemsarestill
supportinglaunches,theyarebecomingmoredifficult to keepoperationalfor the
durationof thelaunch. An additionaloperationalproblemis theageof the
controlelectronics;it isbecomingimpossibleto buysparesfor manycomponents.
Thecurrentsystemsalsofail to takeadvantageof massspecandhigh-vacuum
technologydevelopmentsover thepastfew decades.Becauseit is crucialto
continuemonitoringthesegasesin supportof ShuttleOperations,it wasdeemed
that anewintegratedsystemshouldbedeveloped.

Thenewsystem,namelyHazardousGasDetectionSystem(HGDS)2000,has
manyfeaturesnot incorporatedin thecurrentsystems.Thenewsystemusesthe
latesthigh-vacuumandmassspectrometrytechnologyfor detectingthe
componentsof interest.Thesenewtechnologiesincludeanewlinearquadmpole,
turbo-dragpump,scrollpump,alongwith the latestsoftwarecontrolsavailable.
Advancesin computersandelectronicswill makemoreinformationavailableto
theoperatorsthanwith theoldersystems.In addition,stepsweretakento ensure
thesystemsareeasyto maintainandrepair. It is alsoexpectedthatthereliability
of thesystemswill begreatlyincreased.Thenew systemshaveincorporated
redundancyonall majorcomponents.Theonly partof thesystemthatwill not be
redundantis thesamplelinesthatprovidesampletransportfrom theareasof
concernto themassspectrometersystem.Onesampleline will feedboth
detectionsystems.All thesystemsusetransportlines(1/4 inchstainlesssteel
tubing250to400feetlong) to bringsamplesfrom theOrbiterto themass
spectrometer.Themostimportantof thesamplelocationsis theAft
Compartmentthatcontainsthemainengines.A depictionof thetransportlines
•currentlyin useis shownin Figurela. Noticethateachsystemcanmonitor
multiple locations,thismethodnecessitiesaround-robinapproachwhereeach
line is monitoredfor asettimebeforecyclingto thenext in thesequence.A
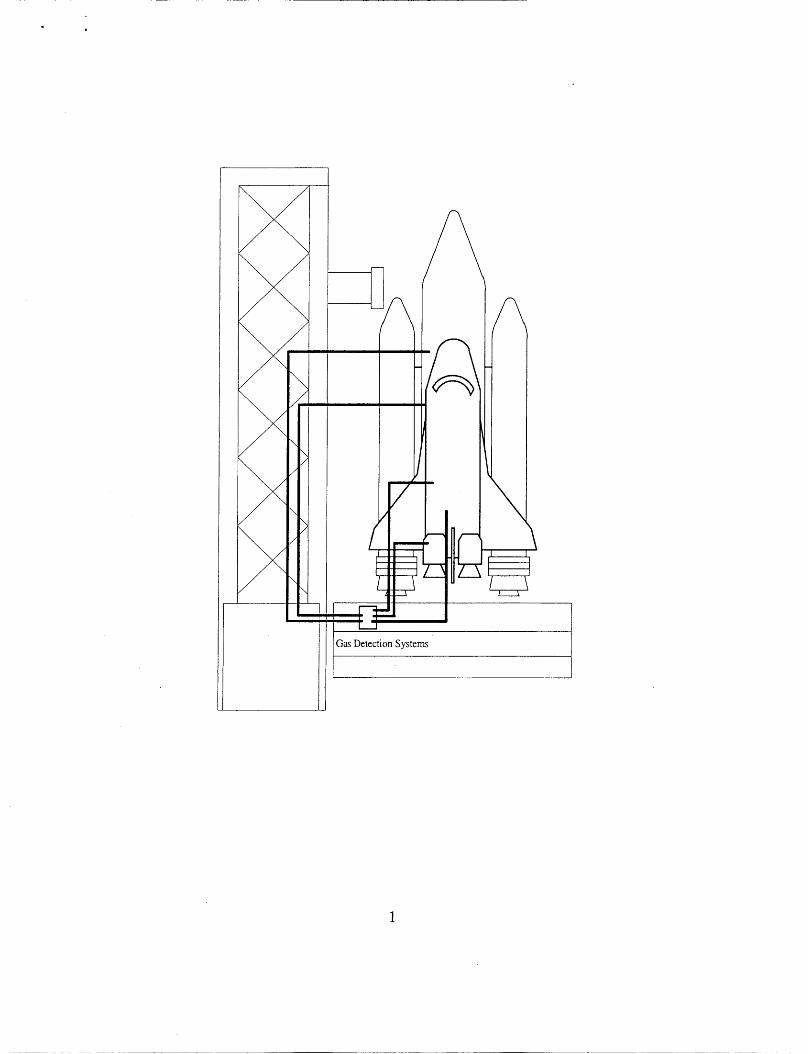
photographdepictingtheactuallocationof thesystemduringalaunchisshownin

Figurelb. Muchof theshockandvibrationis absorbedby themobilelaunch
platform(MLP); however,theHGDS2000still mustwithstandlargeshocks
duringlaunch.
Experimental
SystemDesign
Theoverall systemis composedof twoindependentdetectorscapableof
monitoringall of thecomponentsof interest(i.e.,H2,He,N2, 02, and Ar). In
addition to these five compounds the system has to be easily expanded to include
additional compounds when needed. The system will use one set of sample lines
while all major components will either be redundant or have backup systems
(referred to in this document as redundancy). This redundancy helps ensure the
system is operational for the highest amount of time.
A sketch of the overall system is shown in Figure 2. The system will be made up
of three parts - the sample delivery subsystem, detector subsystem, and control
computer subsystem. This design is new because it is the first system to
incorporate two detectors into one complete package. The design uses one
transport pump to continuously draw samples from the points of interest. The

detectorsthendrawoff theamountof thesamplethattheyneedfor detection.
Thismethodletseitherdetectormonitoranysampleline,eventhesameline.
Becauseof theexportcontrolregulationstheauthorscannotgointo moredetails
thanoutlinedin thispaper.If moreinformationis wantedNASA/KSC
TechnologyTransferOffice shouldbecontactedREF WW.
DetectorSubsystem
It wasnecessaryfor thedetectorsto notonly monitorthegasesthatareof current
interest(H2,He,N2,02,Ar) but it is alsoimportantthatthedetectorsystembe
abletobeexpandableto look at additionalcompounds.This flexibility will help
ensurethenewsystemwill meetthechangingneedsof thecustomer.This is
extremelyimportantwith thedevelopmentof newspacevehiclessuchasthe
VentureStar.
After takinginto accountall of thefactorsassociatedwith differentdetectors,the
StanfordResearchSystems(SRS)RGA 100wasdeemedthebestcandidatefor
theHGDS2000. It wasfoundthatthequadrupolemassspectrometerbestmeets
all of theneedsfor thisapplication.While mostof thelatestlinearquadrupole
massspectrometerscouldmeetmanyof therequirementstheSRShadtheeasiest
interfaceinto theHGDS2000. While theSRSgivesall of thenecessary
commandsin theoperatorsmanualmostothervendorschosenot to makesuch
informationreadilyavailable. In addition,theSRSwasdesignedto be
incorporatedinto othersystemsby theendcustomer;thiswasnotseenby other
manufactures.Thesereasons,coupledwith thebestcost/performance,madethe
SRSthemostfavorablemassspectrometerfor this system.
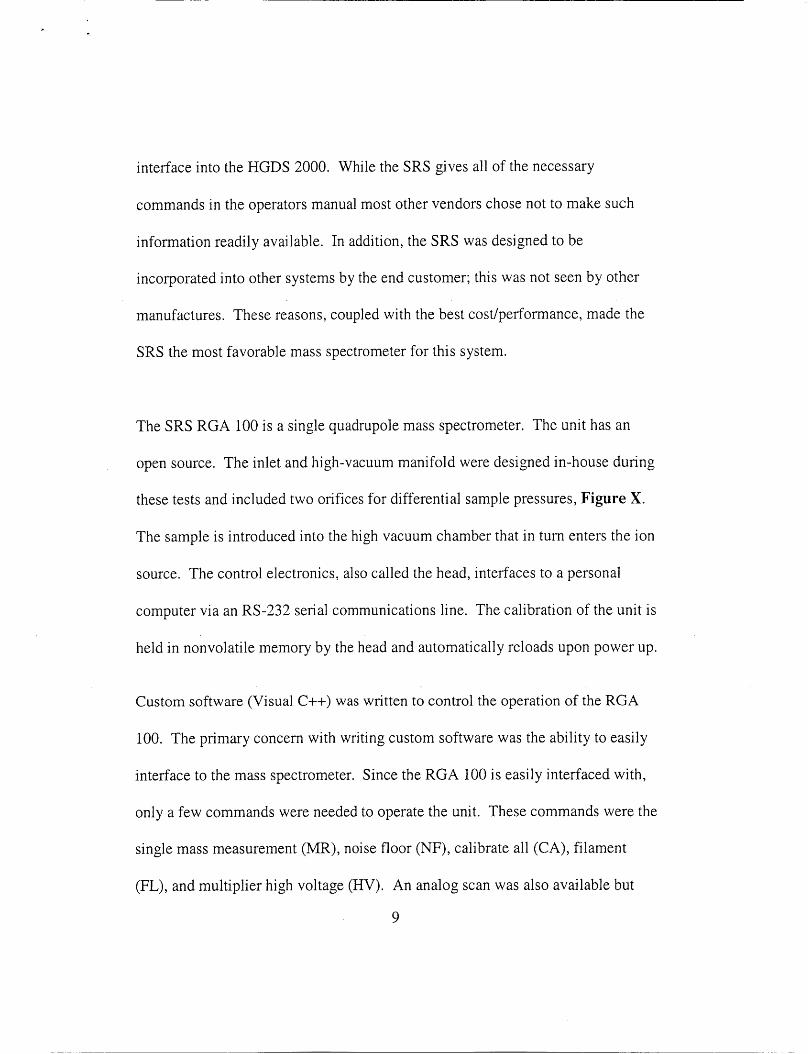
TheSRSRGA 100is a singlequadrupolemassspectrometer.Theunit hasan
opensource.Theinlet andhigh-vacuummanifoldweredesignedin-houseduring
thesetestsandincludedtwo orificesfor differentialsamplepressures,Figure X.
Thesampleis introducedinto thehighvacuumchamberthatin turnentersthe ion
source.Thecontrolelectronics,alsocalledthehead,interfacesto apersonal
computervia anRS-232serialcommunicationsline. Thecalibrationof theunit is
held in nonvolatilememoryby theheadandautomaticallyreloadsuponpowerup.
Customsoftware(VisualC++)waswritten to controltheoperationof theRGA
100.Theprimaryconcernwith writing customsoftwarewastheability to easily
interfaceto themassspectrometer.SincetheRGA 100is easilyinterfacedwith,
only afew commandswereneededto operatetheunit. Thesecommandswerethe
singlemassmeasurement(MR), noisefloor (NF), calibrateall (CA), filament
(FL), andmultiplier highvoltage(HV). An analogscanwasalsoavailablebut

notusedfor thesetests.A verygoodexplanationof thecommandscanbe found
in theSRSRGA 100operatingmanualREF #. Tuningof themassspectrometer
wasperformedfollowing themanufacturer'sprocedures.TheNF parameteris
inverselyrelatedto theamountof timethattheion signalis integrated;a lower
NF correspondsto anincreasedintegrationtime.
SampleDeliverySubsystem
Thesampledeliverysubsystemis thepartof theunit thatdrawsthesampleto the
detectors.It canbeseenasthecirculatorysystemof theoverallunit. A detailed
drawingof thesampledeliverysubsystemis shownin Figure3. Noticethatthe
final designhasincluded8continuouslypumpedlinesand7 linesthatareonly
pumpedwhenmonitored. In addition,thedesignincludesaprimarytransport
pumpandabackuptransportpump.TheTransportpumphasthecapacityto pull
9 standardlitersperminute(L/min)downall 8 samplelinessimultaneously.The
flow downeachsampleline canbeadjustedby meansof verniervalvesplaced
upstreamof thetransportpumpbutdownstreamof theanalyzer.
Thesamplesaretransporteddownthe8 samplelinesbythetransportpump. A
singleline to bemonitoredis selectedusingsamplevalvesthat allowaportionof
10

thetransportflow to bedrawnoff tothemassspectrometersubsystem.The
samplepumpdrawsthis samplepasttheinlet of themassspectrometer.All of the
exhaustportsaretied togetherandplumbedoutsideof therack.
Thedesignalsoincludescalibrationlinesfor nitrogenandheliumbackground
gases.Two extralinesof each(niirogenandhelium)areincludedfor future
expansion.
Thepressureto theinlet of themassspectrometeris controlledvia afeedback
loopbetweenamassflow controllerandpressuretransducer.Thispressure
controlis activefor all sampleandcalibrationlines. In thismanorthe
concentrationreadingsareensuredto bethesamenomatterwherethesample
location.
Control Computer/Electronics
The entire system is controlled via a remote computer operating custom software
written in Visual C++. The software enables the user to input all desired
commands and to monitor the health and status of the system. Figure ¥ depicts
the electronics control system including the computer and all devices. A local
VME computer controls the system. This unit interfaces with various controllers
11

in thesystemviaSerialRS-232communications.TheControllerinterfaceswith
userseitherthroughalocal laptopterminalor aremotelylocateddesktop
terminal. TheseconnectionsareEthernet100BaseT.The usercomputers
communicatewith the localcontrolcomputerthatcommandsall of thenecessary
valves,pumps,andmassspectrometers.Theconnectionbetweenthecomputers
is anindependent,fully redundantnetwork.
ExperimentalDesign
Testswererun to examinetheperformanceof thesystem.Thesetestsexamined
theaccuracy,limits-of-detection,drift, responsetime, andrecoverytime of the
system.Beforeeachsetof experimentswasrun, themassspectrometerwas
calibratedto giveconcentrationreadingsin ppm.
Calibration
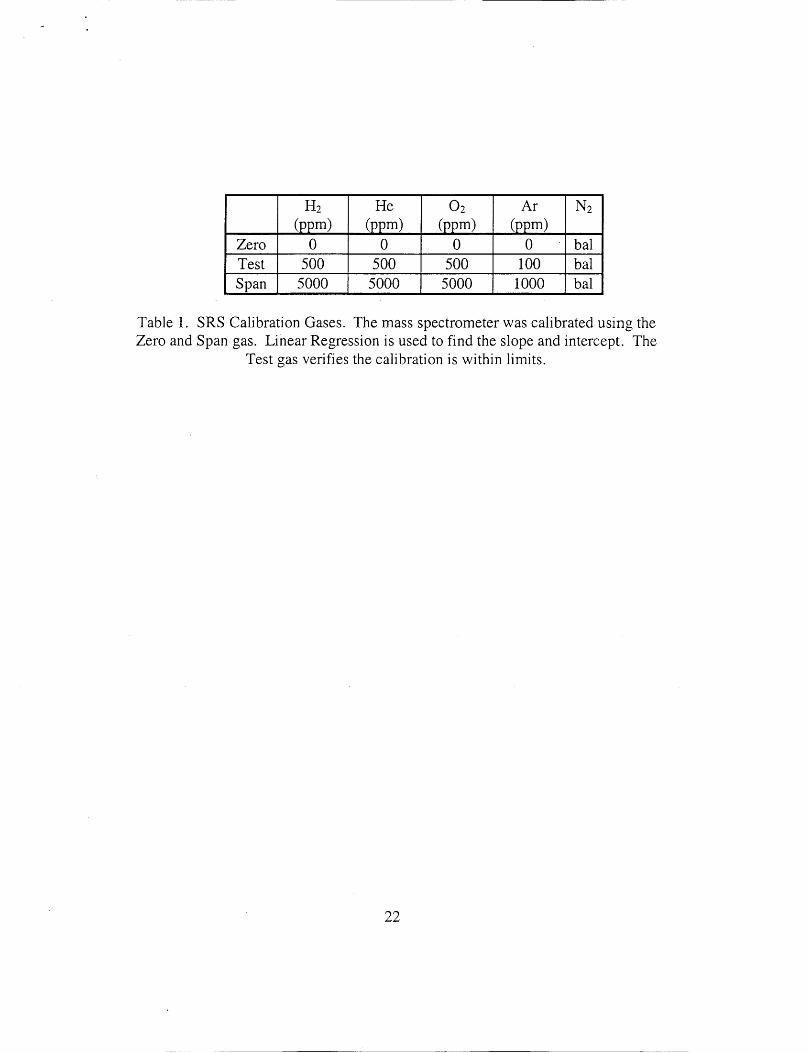
Threecalibrationgaseswereusedto performthecalibrationof theunit. Thegas
concentrationsarelistedin Table1. TheRGA 100wassetupasperthetests
procedurebeforecalibrationof theunit. Theprocedurefor thecalibrationwasto
selectthezerogas,testgas,andthenspangas. Eachgaswasallowedto flush the
sampledeliverysystemfor 5 minutes.After flushingthesystem,theion currents
12

weremeasuredandtheaverageof 10readingswasrecordedfor theionsof
interest(i.e.,H2,He,02, andAr). Theslopeandoffsetwerecalculatedusingleast
squaresfit of theZeroandSpangases.Theconcentrationsfor theexperiments
werecalculatedby usingtheslopeandoffset. Thecalculatedconcentrationfor
thetestgaswasmeasuredduringthecalibrationto ensuretheunitwas
functioningproperly.
Accuracy,Limit-of-Detection
Thesystemwascalibratedprior to thesetests.Thegaseswereintroducedinto the
systemfrom lowestconcentrationto highestconcentration(exceptAr). Thegas
wasthenallowedto flush thesystemfor 10minutesbeforemeasuringthe
concentration.Calibrationgaseswith theconcentrationmixtureslistedin Table2
wereusedfor thetests.TheRGA wassetupasfollows: NF=2,SIM=2,4, 32,40
Da,FaradayCup.
Drift
Thesystemwascalibrated;noothercalibrationswereperformedduringthetest.
TheZerogaswascontinuouslyselectedfor 12hours. At theendof the 1,2, 6,
13

and 12hours,anaverageof 25concentrationreadingswasrecorded.TheTest
gaswasthenselectedfor 5 minutes.Theaverageof 25concentrationreadings
wasthenaveragedandrecorded.Zerogaswasthenselecteduntil thenext time
sequence.
ResponseTimes
ResponsetimesweremeasuredbyselectingZerogasandthenselectingTestgas.
Thetimefor theconcentrationreadingto reach95% of theactualvalueswasthe
responsetime.
RecoveryTime
Recoverytimewasmeasuredby selectingSpangasthenselectingTestgas. The
timerequiredfor theconcentrationreadingto measurewithin 5 %of actualwas
calledtheRecoveryTime.
StabilizationTime andPressureDeviation
14

Theeffectof changingthetransportline beingmonitoredis of importance
becausethedesignof theHGDS2000usestwo massspectrometersmonitoring
onetransportline. If largechangesareseenwhenlinesarechangedthenthetwo
massspectrometerswouldnotbefully independent.This wouldbeavery
unfavorableeventbecauseeachmassspectrometermustbeableto monitorany
line atanytime duringthelaunchsequence.
Theprocedurefor thetime studieswasasfollows:
1) Setbothunitsto monitorline 1.
2) Wait until bothhavestablereadings.
3) Changeunit 2 to line7.
4) Monitor maximumpressureandtimenecessaryfor pressureof unit 1 to
stabilize.
5) Changeunit 2 to line 1.
6) Monitor maximumpressureandtimenecessaryfor pressureof unit 1 to
stabilize.
ResultsandDiscussion
15

Theresultsof thetestswereverypositive. TheHGDS2000provedto bevery
stable.Manyof thetestsdid notrequireanewcalibrationto beperformedbefore
running. Theunitwasfoundto beableto becalibratedonceperdaywithout
majordeviations.
LinearityTest
Theresultsof thelinearity testsarelistedin Table3 andareplottedin Figure Z.
Thetablelists theresultsfor eachof theindividualtests.Theaverageand
standarddeviationof thetestsarealsolistedin thetable. Theactual
(manufacturerstated)levelsareincludedfor comparison.Noticethatall of the
valuesfall within 10% of readingexceptfor the100-ppmvaluesfor oxygenand
helium. Thehigherrorsfor oxygenareattributedto air andwaterin the lines.
Thelinesweretygontubingfor gaseswith concentrationsgreaterthan25ppm;
stainlesssteellineswhereusedfor gaseswith concentrationsequalto 25ppm. It
hasbeenshownthat air andwaterdiffusethroughthetygonandinterferewith 02
readings.REF #2. Obtaininglow-levelmixtureshasprovento beamajor
challengein performingtheseexperiments.Thesetwo factorscombinedmaking
low-levelvaluesdifficult to accuratelymonitor. Thedashes(-) indicatewhereno
datawerecollected.Thehigherthanexpectedreadingsfor heliumarecouldbe
16

dueto thebottlenothavingthestatedconcentration.It hasbeenseenthrough
yearsof experienceat KSCthatvendorsoftenhavedifficulties determiningthe
concentrationof gasesin thisrange.
Fromtheseresultsit is clearthatthesystemhastheoreticaldetectionlimits of less
than25ppmof hydrogenandoxygen.However,becauseof thedifficulties in
obtainingknownvaluesatlower levels,noexperimentswhererunwith values
lessthan25ppm. In orderto meetthedetectionlimits for H2 an 02 close
attention had to be paid to mass-to-charge tuning of the instrument. When the
peak height was too large (lower limit-of-detection) high-end linearity suffered.
However, when the peak height was decreased for better linearity the limits-of-
detection worsened. This interaction necessitated tuning, which was not optimal
for either case (low-level detection or high degree of linearity). It was found that
with minimal practice the tuning could be accomplished without any major
difficulty.
Drift
The data obtained for the zero drift are listed in Table 4 and plotted in Figure ZZ.
The table includes the data obtained for the tests along with the average and the
17

acceptabledrift tolerancesfor eachtest. Noticethattheonly valuesthat are
problematicareassociatedwith H2 and 02. Again, this is attributed to water in
the system. Notice that the values all drift down with time, which corresponds to
the water concentration. The dashes (-) indicate where no data were collected.
The data obtained for the test drift study are listed in Table 5 and plotted in
Figure ZX. The table includes the data for each test along with the averages.
Notice that all the values are extremely small.
Response Time
The response time was measured to be less than 10 seconds for each component.
Recovery Time
The recovery time was measured to be less than 20 seconds for He, 02, and Ar
while being less than 2 minutes for H2. It was expected that the recovery time
would be greatest for H2 because of the decrease in compression ratio of the
turbo-drag pumps for the lighter gases. There are two orders of magnitude
difference in the compression ratios between nitrogen and hydrogen. Steps are
18

beingtakento help improvetheconductancethroughthehigh-vacuumregionand
thusimprovingtherecoverytimeof hydrogen.
StabilizationTimeandPressureDeviation
Thetime necessaryfor thesamplepressureto stabilizewhenthesecondunit left
thesameline arelistedin Table6.
Theinformationin Table6 wasrepeated,only thepressureof Unit 2 was
monitored(seeTable7).
Unit 1washeldconstanton line 1whileUnit 2 waschangedfrom line 1to 7 then
backto line 1. Theresultsarein Table8.
From looking atthedatain Tables7- 8 it is clearthatlittle or noeffectis seen
whenonemassspectrometerchangeslines. Themaximumdeviationseeis 21
Torr (Table8) thatis only 5.25%changeof thebasepressure.This is sucha
smallchangein pressurethatthemassspectrometerreadingswouldseeonly
smallchangesin readings.Eventhesesmallchangeswouldstabilizeafteronly 8
seconds.
19

Conclusions
Themassspectrometerwasdeemedto bethebestmethodfor detectionof the
compoundsnecessaryfor theHGDS2000. In addition,scanningmass
spectrometersenablefutureexpansionof thesystemswith minimal modifications.
Themassspectrometerthatis beingdesignedinto theHGDS2000is theSRS
RGA 100with anin-housedesignvacuummanifold. Thesystemgave
outstandingperformancein theareasof accuracyandlimits-of-detection.In
addition,thesystemwasextremelystableandrequiredminimal calibration.
Thesampledeliverysystemworkedextremelywell. Theresponsetimesfor the
systemarelessthen10secondsaftera line is selected.Minimal effectswereseen
whilemonitoringa line whenthesecondunit is cycledonor off of themonitored
line. Theunit asdesignedhasredundancy/backupcapabilitiesfor all critical
componentsincludingpowersupplies.While thesampledeliverysystemwas
designedasacompletesystem,asinglesidecanbeusedat atime. Thisability
enablestheunit to berun in caseof completefailure of asystem.
TheprototypeHGDS2000hassupportedfour SpaceShuttlelaunchesworking in
parallelwith theoldersystems.A datacomparisonbetweenthenew systemand
theold systemshasprovenveryfavorable.Modificationsto theMLP's areunder
2O

way for thepermanentinstallationof theHGDS2000to betheprimary launch
supportequipmentin thespringof 2002.
Acknowledgments
Thefundingon this projectwasprovidedundertheEngineeringandDevelopmentContractat KennedySpaceCenter,FL.
References
1. T.P. Griffin, G.R.Naylor,W.D.Haskell,C. Curley,R.J.t-Lritz,G.S.Breznik,andC. Mizell, Hazardousgasdetection2000. NASA TechnicalBriefs2001.
2. T.P. Griffin, G.R.Naylor, andC.Mizell, A multipledetectorsamplesystemfor remotegasmonitoring. NASA TechnicalBriefs 1999.
3. HUMS NTR.4. T.P.Griffin, G.R.Naylor,L. Lingvay,F.W.Adams,andC. Mizell, Portable
aft massspectrometer.NASA TechnicalBriefs 1999.5. HGDS2000FabricationandAssemblyDocumentation(DrawingTree),KSC-
SK-2000-3480,March2002.
21
ZeroTestSpan
H2
(ppm)
0
He
(ppm)0
02
(ppm)0
Ar
(ppm)
0
500 500 500 100
5000 5000 5000 1000
N2
bal
bal
bal
Table 1. SRS Calibration Gases. The mass spectrometer was calibrated using the
Zero and Span gas. Linear Regression is used to find the slope and intercept. The
Test gas verifies the calibration is within limits.
22

Bottle H2 He N2 02 Ar
1 0 0 Balance 0 0
2 25 Balance 25
3 100 100 Balance 100 500
4 500 500 Balance 500 100
5 1000 1000 Balance 1000 5000
6 5000 5000 Balance 5000 1000
7 10000 1000 Balance 10000 10000
All data are ppm.
Table 2. SRS Linearity Calibration Bottle Values (ppm). Each of the seven
gases bottles used for these experiments. Mixtures were used to enable tests
of multiple components to be performed concurrently.
23

Hz 02 H 2 He 02
Run 1 21.9 23.0 91.5 79.4 -
Run 2 24.2 23.1 93.0 78.1 70.0
Run3 24.0 23.3 98.6 102 91.7
Average 23.4 23.1 94.4 86.4 80.8
Sigma 1.25 0.12 3.8 13 15.3Actual 25.0 25.0 101 101 96
A -1.6 -1.9 6.6 14.6 -15.2
Ar H2
493.6 494.9
493.4 496.0
427.6 521.9
471.5 504.3
38 15.3
500 503
-28.5 1.3
He 02
472 456.8
473.8 459.4
512.0 461.15
485.93 459.1
22.6 2.2
501 501
-15.1 -41.9
H2 He Oz Ar
Run 1 898 947 889 4948
Run 2 1038 1007 929 5130
Run3 1069 1036 931 4421
Average 1001 997 916 4833
Sigma 91 45 23 368Actual 1000 1020 972 5000
A 1 -23 -56 -167
H2 He
5074 5121
5029 5163
5052 5142
32 30
4923 5056
123 86
All data are ppm.
02 Ar H2 He
5087 1014 11108 10674
5021 1008 11064 10748
- 9909 9333
5054 1011 10694 10252
47 4 680 796
4965 1000 10100 9910
89 11 594 342
Table 3. Linearity Data. The table lists the results for three runs for linearity.
No data is denoted by a (-). The actual values refer to the factory certified
concentrations for the bottle. % error is ([measured] - [actual])/[actual] * 100.
Ar
98.1
101.5
101.7
100.4
2.0
101
-0.6
02
10877
10804
9612
10431
710
9990
441
AF
10398
10719
8509
9775
1096
10200
-425
24

Run H2 He 02 Ar Run H2 He 02 Ar Run H2 He 02 Ar Run H2 He 02 Ar
1 -1.8 -16.2 -2.2 -0.3 1 0.5 3.5 -5.7 -0.6 1 1.8 -15.0 8.5 1.8 1 -3.4 0.6 -15.9 -2.1
2 1.2 0.0 -4.0 -0.1 2 -2.3 -1.6 -14.3 -2.1 2 0.4 1.6 -7.0 -2.3 2
3 -2.5 0.8 -13.0 -0.0 3 - 3 -2.0 1.0 -14.3 -0.3 3 -
aver -1.0 -5.1 -6.4 -0.2 aver -0.9 0.9 -10.0 -1.3 aver 0.0 -4.1 -4.3 -0.3 aver -3.4 0.6 -15.9 -2.1
All data are ppm.
Table 4. SRS Zero Drift Data. The table lists the drift data obtained for
monitoring pure nitrogen gas for the times listed in the table. No data is denoted
by a (-).
25

Run H2 He 02 Ar Run H2 He 02 Ar Run H2 He 02 Ar Run H2 He 02 Ar i
1 -3.9 -10.0 -7.0 0.0 1 -1.0 -3.7 -6.7 0.0 1 -21.0-11.5 -9.8 4.0 1 1.5 21.5 18.5 4.7
2 -12.6 1.7 -11.0 1.1 2 -13.4 6.5 -12.2 2.1 2 -2.9 19.8 -17.5 3.7 2 - -
3 -7.3 -3.1 - 3 -7.9 -2.3 - 3 13.5 23.2 5.0 3.6 3 - -
4 .... 4 - - 4 -6.8 -2.3 - 4 - -
aver -7.9 -3.8 -9.0 0.6 aver -7.4 0.2 -9.5 1.1 aver -4.3 7.3 -7.4 3.8 aver 1.5 21.5 18.5 4.7
All data are ppm.
Table 5. SRS Test (500 ppm) Drift Data. The table lists the drift data obtained for
monitoring the bottle denoted as Test gas for the times listed in the table. No data
is denoted by a (-).
26

Run Time (s) Time (s)Line 1to Line 7 Line 7 to Line 1
1 6 82 7 93 6 9
Average 6.33 8.67
Table6. SDSSettleTimesData. Thetimenecessaryfor thepressuresto stabilizeaftertheothersystemchangedlines. This testshowstheshorttimenecessaryforthepressureto stabilizebeforeconcentrationreadingswouldbestable.Both unitsweresetat400Torr andline 1wasselectedfor both. Unit 2 changedlines. Unit
1wasmonitored.
27

Run Time(s) Time(s)Line 1to Line 7 Line7 to Line 1
1 8 62 7 73 8 6
Average 7.67 6.33
Table7. SDSMaximumStabilizationTimeData. Thetime necessaryfor theunitto stabilizeaftertheadjacentsystemchangedsamplelines..This testshowstheshorttimenecessaryfor thepressureto stabilizebeforeconcentrationreadings
wouldbestable.
28

Run Press(Torr) Press(Torr)Line 1to 7 Line 7 to 1
1 20 172 21 173 21 17
Average 20.67 17
Table8. SDSMaximumPressureDeviationsData. Themaximumpressuredeviationdetectedduring linechanges.Thepressurelow enoughthatonly a few
ppmchangewouldbeseenin theconcentrations.
29

FigureCaptions
Figure la. Depictionof TransportLinesmonitoredby HGDS2000. Therearecurrentlyfive locationsmonitoredduringprelaunchactivities.Thelocationsare(a)aft, (b)midbody,(c) payloadbay,(d) externaltank/intertank(ET/IT), and(e)H2tail servicemast(TSM)
Figurelb. Locationof HGDS2000duringthespaceshuttlelaunch. TheHGDS2000is locatedon themobilelaunchplatform(MLP). Thesystemdoesnot haveto monitorduringlaunch;however,thesystemmustbeonduringlaunchandreceivenodamage.
Figure2. OverallBlockDiagramof theHGDS2000. Thesystemcontainstwoindependentsubsystemswith acommonsampledeliverysubsystem.Eachsubsystemhasamassspectrometerandassociatedcontrolcomputer.Thesampledeliverysubsystemincludesall pumpsandcontrolsto bring thesampleto themassspectrometer.A constantpressureis maintainedatthe inlet of themassspectrometersfor all calibrationandsamplegasesvia anactivecontrolloop.
Figure3. SampleDeliverySubsystemof theHGDS2000. Thesamplesaredrawndownthetransportline via thetransportpumps(Varian300Triscrolls).Thepressuresat thetees(nominally400Torr) aresuchto draw6 - 8 sLpmdowneachtransportline. Thesamplesarethendrawnpastthemassspectrometerinlet.Thepressureatthemassspectrometerinlet is setto 50Torr lessthanat thetransporttees. Thispressuredifferencehelpsto ensureadequateflow (> 300sccm)reachesthemassspectrometerinlet.
Figure4. Block diagramof themassspectrometersubsystem.Thesamplesareanalyzedby (A) theSRSRGA 100linearquadrupole,thehighvacuumismaintainedby (B) thealcatel30+turbo-dragpumpand(C) controller,using a (E)VacuuBrand2ZDdiaphragmroughpump. Thesamplesareintroducedinto themassspectrometervacuumchamberthroughtwo orifices(H) 0.009" and(I)0.002". Thesamplepressureis keptconstantvia afeedbackcontrolloop usingamassflow controller,pressuregauge,and(D) MKS 146controller. Thesampleisdrawnthroughtheinlet by (F) aVarian300TriScroll pump. A (G) Granville-Phillips pressurecontrollermonitorsthepressuresto theinlet, roughingpump,andhighvacuumchamber.
3O
t
/
\\
/
\\
//
\
I
I
m
Gas Detection Systems


_SUBSYSTEM A
VME Chassis
_" tl_l_ _ _Sp_ete !.
I NetworkHub1
ContinuouslyPum )ed
Sam;)le Lines
From Orbiter
i
i
Extra Lines
From Orbiter
ii ii "
ii ii
! } Calibration Gases
-@-@-DSUBSYSTEM B It
II
II _/ VME Chassis
Spectrometer J L_ lfffl t_]_f
"! J
J J
Local Laptop
Vlobile Launcher Platform (MLP)
©©Sample Delivery System(Including Calibration Gases)
i r,,,,
IiiII
Network
I
Remote PC
........ i
l Network Hub
Local Laptop IsI
Remote PC
J
Firing Room -
Legend
Gas Lines
Electronic Lines

He Cal
N2 Cal LinesLines
Transport Lines
Extra Samploe LinesHe Cal
Lines N2 CalLines
}
£] }
£] }
ICalibration
LSubassembly A
J Mass Spec AInlet-
IEx_ au_'t
iIII
Control Valves J
II
_ I
III Sample
Subassembly A
Transport
Subassembly
Exhaust Plenum
Legend
_-'_ Pump
[_ Vacuum Regulato_
[] Solenoid Valve
FIo'wmeter
L_ Hand Valve
[] Filter
_] Control Valve
_MKS Control Loop

Sample In
A
Quadrupole Source
C Convectron Gauge
Gas Fluid Lines
-- Electrical Lines
Mass Flow Controller
D
Hot Cathode
C
C