a fruit and vegetable nutrition education intervention in northeast
TRANSCRIPT
A FRUIT AND VEGETABLE NUTRITION EDUCATION INTERVENTION IN
NORTHEAST GEORGIA OLDER AMERICANS ACT NUTRITION PROGRAMS
IMPROVES INTAKE, KNOWLEDGE, AND BARRIERS RELATED TO
CONSUMPTION
By
JACY C. WADE
(Under the direction of JOAN G. FISCHER, PhD)
ABSTRACT
The purpose was to improve fruit and vegetable intake in older adults participating in Title III congregate meal programs. Older adults in northeast Georgia completed the pre-test (n=54), nutrition education series, post-test (n=47), and sensory test (n=41). At baseline, 40% of participants reported inadequate income to spend on fruits and vegetables, and 15-20% reported other barriers, including taste and preparation difficulty. Intakes of several fruit and vegetable items improved after the intervention (p<0.05), including mean intakes of total fruit and vegetable items (from 22.8 + 1.5 to 25.2 + 2.0 servings/week) and total fruit items (from 9.0 + 0.9 to 10.9 + 1.3 servings/week). Additionally, more participants reported knowledge of the Five a Day recommendation. In conclusion, this intervention improved consumption of selected fruits and vegetables, identified barriers, and improved behaviors, attitudes, and knowledge related to fruit and vegetable intake. The curriculum is available for download at www.arches.uga.edu/~noahnet.
INDEX WORDS: Older Americans Act Nutrition program, congregate meal
program, senior center, older adults, fruit, vegetable, nutrition education, nutrition intervention

A FRUIT AND VEGETABLE NUTRITION EDUCATION INTERVENTION IN
NORTHEAST GEORGIA OLDER AMERICANS ACT NUTRITION PROGRAMS
IMPROVES INTAKE, KNOWLEDGE, AND BARRIERS RELATED TO
CONSUMPTION
by
JACY C. WADE
B.S.F.C.S., The University of Georgia, 2001
A Thesis Submitted to the Graduate Faculty of The University of Georgia in Partial
Fulfillment of the Requirements for the Degree
MASTER OF SCIENCE
ATHENS, GEORGIA
2003

© 2003
Jacy C. Wade
All Rights Reserved
A FRUIT AND VEGETABLE NUTRITION EDUCATION INTERVENTION IN
NORTHEAST GEORGIA OLDER AMERICANS NUTRITION ACT PROGRAMS
IMPROVES INTAKE, KNOWLEDGE, AND BARRIERS RELATED TO
CONSUMPTION
by
JACY C. WADE
Approved:
Major Professor: Dr. Joan G. Fischer Committee: Dr. Mary Ann Johnson
Dr. James Hargrove
Electronic Version Approved: Maureen Grasso Dean of the Graduate School The University of Georgia August 2003

iv
ACKNOWLEDGEMENTS
This project was made possible only through the help and support of many others.
First, I would like to express my deep appreciation to my major professor, Joan Fischer,
whose expertise, experience, and guidance were instrumental in the completion and
success of this project. Your encouragement, advisement, patience, and kindness will
long be remembered. I would also like to thank Mary Ann Johnson for her expert advice
and encouragement, and Dr. Swanson for her interest and ideas for this project. Thank
you to everyone else who contributed to the development, implementation, and overall
success of this project: Mary Ann Johnson’s staff, Dr. Hargrove, fellow graduate
students, and other faculty, staff, and students in the Department of Foods and Nutrition.
A very special thanks to my family, my boyfriend Joey, and my friends: your unwavering
love, understanding, and faith in me have been a constant source of strength and
encouragement. Finally, I want to thank my Lord and Savior, Jesus Christ, for bringing
me to and through this point in my life.
v
TABLE OF CONTENTS
Page
ACKNOWLEDGEMENTS……………..………………………………………………..iv
LIST OF TABLES……….………………………………………………………….…...vii
LIST OF FIGURES…….……………………………………………………………….viii
LIST OF APPENDICES…..……………………………………………………………...ix
CHAPTER
I INTRODUCTION………………………………………………………………..1
II LITERATURE REVIEW………………………………………………………....5
Older Adult Population……...………………………………………………….....5
Nutritional Risk Factors and Nutrient Intakes of OANP Participants….………....7
Benefits of Fruit and Vegetable Intake....................................................................9
Barriers to Fruit and Vegetable Consumption….……....……………………..…12
Fruit and Vegetable Intervention Studies..............................................................16
Fruit and Vegetable Studies in Georgia OANPs…………………………...……23
Sensory Changes in Older Adults………….……........................................…….23
Health Belief Model......................................................................................……26
Ratonale, Specific Aims, and Hypotheses………………………………………27
vi
III A FRUIT AND VEGETABLE NUTRITION EDUCATION INTERVENTION
IN NORTHEAST GEORGIA OLDER AMERICANS ACT NUTRITION PROGRAMS IMPROVES INTAKE, KNOWLEDGE, AND BARRIERS RELATED TO CONSUMPTION……………………………………………….31
Introduction……………………………………………………………………...31
Methods………………………………………………………………………….34
Statistical Analysis………………………………………………………………39
Results…………………………………………………………………………...39
Discussion……………………………………………………………………….47
Acknowledgements……………………………………………………………...57
IV CONCLUSIONS………………………………………………………………...118
REFERENCES…………………………………………………………………………123
APPENDICES…………………………………………………………………………129
vii
LIST OF TABLES
Page
Table 1. Participant Characteristics at Time 1……………………...……...…………....58
Table 2. Participant Responses on Pre-Test Questionnaires ……...……...….………….59
Table 3. Participant Responses on Post-Test Questionnaires…………...…...……….…73
Table 4. Time 1, Time 2, and Mean Change in Fruit and Vegetable Intake and Change
in Barrier Items 32-36 by Time…...……………………………….………………….....84
Table 5. Mean Change in Fruit and Vegetable Intake from Time 1 to Time 2……….…87
Table 6. Participant Responses to Open-Ended Questions, Number of Prescription
Medications, and Sensory Test Results at Time 2……………………………...….…....91
Table 7. Medication and Sensory Barriers to Fruit and Vegetable Consumption at
Time 2……………………………...……………………..………………………….....94
Table 8. Barriers to Increasing Mean Fruit and Vegetable Intake…………….………..96
Table 9. Spearman Correlations among Fruit and Vegetable Intake and Time 1
Barriers…….………………………………………………..……..…………………..99
Table 10. Spearman Correlations among Fruit and Vegetable Intake and Time 2
Barriers……………………………………………..……………………………..….108
viii
LIST OF FIGURES
Page
Figure 1. The Health Belief Model……………………………………………….……..30
ix
LIST OF APPENDICES
Page
Appendix A. Consent Form for Fruit and Vegetable Study…………………………....130
Appendix B. Pre-Test Questionnaire. ……………………………………………….…132
Appendix C. Post-Test Questionnaire ………………………………………………….135
Appendix D. Consent Form for Sensory Testing ……………………………....………138
Appendix E. Taste & Smell Test Forms …………………………………….…………140
Appendix F. Vitamin C, Vitamin A, and Carotenoid Content of Selected Foods ……..142
Appendix G. Summary Score Categories Defined…………………………….…….....147
Appendix H. Barriers Associated with Fruit and Vegetable Consumption Frequency
At Time 1…………………………………………………………………………….…148
Appendix J. Responses to Open-Ended Questions at Time 2…………….…………….155
1
CHAPTER I
INTRODUCTION
The older adult population in the United States is growing rapidly, and is
projected to more than double to 70 million by the year 2030 (CDC, 2001). Roughly 1 in
5 persons will be aged 65 or older. Georgia has the fourth fastest-growing elderly
population in the United States (GA DHR, 2002). Chronic disease, increasingly
prevalent with age, often translates into functional limitations, disability and overall
compromised health and nutritional status in the older adult population (Drewnowski &
Evans, 2001). For example, 81% of heart disease and 71% of cancer victims are 65 and
older. However, disease and disability are not inevitable consequences of aging, even
though the likelihood clearly increases with age (Chernoff, 2001). Effective prevention
strategies for chronic disease and associated risk factors have been established through
research, epidemiology, and surveillance. Poor diet is a significant risk factor for many
chronic diseases associated with aging, but is modifiable, unlike genetic predisposition
(Steinmetz & Potter, 1996). Numerous epidemiological studies have shown that diets
low in fat, high in fiber, and high in fruits and vegetables may reduce the risk of many
chronic diseases, including cancer, heart disease, diabetes, osteoporosis, arthritis,
cataract, and age-related macular degeneration (Steinmetz & Potter, 1996; Joshipura et
al., 2001; Johnston et al., 2000). The Older Americans Act Nutrition Program (OANP) it
is the largest U.S. community nutrition program for adults aged 60 years and older and
their spouses (AoA, 2001). The OANP serves over 3 million lunch meals daily across
2
the U.S.; over 38,000 meals are served daily in Georgia (GA DHR, 2002). This nutrient-
dense meal, served five days a week in community senior centers or delivered to home-
bound clients, meets over one-third of a senior’s daily nutritional need. The OANP
sponsors nutrition education and other health-related services for all participating older
adults. These preventive nutrition services are vital to improving overall health and
quality of life of a population with a broad scope of significant health problems.
Previous research in the Department of Foods and Nutrition at the University of
Georgia has shown similar compromised health and nutrition status in Georgia OANP
participants. Studies suggested that more than 50 percent of participants are at nutritional
risk as measured by Nutrition Screening Initiative (NSI) scores, more than 30 percent
have self-reported diabetes and/or poor glucose control, more than 30 percent are obese,
and many have difficulty performing one or more ADLs (Accettura 2000; Aspinwall
2001; Brackett 1999). Over two-thirds had low intakes (less than five a day) of fruits and
vegetables, particularly of brightly-colored, high-phytochemical fruits and vegetables
associated with reduced chronic disease risk, in a study by Aspinwall (2001). Data from
these studies in Georgia, as well as national OANP evaluation data, strongly indicate the
high nutritional risk and overall poor health of this population.
Health care professionals at the community level must strive to promote optimal
health and functioning in OANP clients (AoA, 2001). Focused nutrition interventions are
needed to target particular behavior changes, such as increasing consumption of specific
fruits and vegetables, to maximize benefits in nutritional status, overall health, and
quality of life (Aspinwall 2001; McCamey et al., 2003). An intervention was designed to
increase consumption of fruits and vegetables consumed in particularly low amounts in

3
this population. These fruits and vegetables were selected based on serum carotenoid
analyses and food intake data showing low consumption when compared to national data
(Aspinwall, 2001), as well as similar findings of other studies (Johnston et al., 2000;
Steinmetz & Potter, 1996; Joshipura et al., 2001). It was determined that intakes of citrus
fruits, cruciferous and dark green leafy vegetables, and tomatoes and tomato products
need to be promoted within this population; these fruits and vegetables have been most
closely associated with reduced risk of chronic disease.
This study evaluated the ability of a focused nutrition education intervention to
improve fruit and vegetable intake, knowledge related to benefits of fruit and vegetable
consumption, and barriers to consumption in an underserved elderly population. Ten
educational modules were developed for this intervention and were delivered over a
seven month period in the five participating counties. The curriculum consisted of: 1.
Cruciferous Vegetables, 2. Citrus Fruits, 3. Berries, 4. Onions and Garlic, 5. Leafy
Greens, 6. Beans, 7. Canned and Frozen Produce, 8. Squash, Zucchini, and Pumpkin, 9.
Tomatoes and Tomato Products, and 10. (Supplemental) Medication Interactions and
Fruit and Vegetable Intake. Several significant barriers to fruit and vegetable
consumption were identified at baseline. Forty percent reported not having enough
money to spend on fruits and vegetables, and 15-20% did not like the taste of most
vegetables, had difficulty using kitchen tools in vegetable preparation, and did not plan or
cook their own meals. Following the nutrition education intervention, mean intakes of
total fruit and vegetable items (from 22.8 + 1.5 to 25.2 + 2.0 servings/week) and total
fruit items (from 9.0 + 0.9 to 10.9 + 1.3 servings/week) increased significantly from Time
1 to Time 2 (p<0.05). Knowledge of the recommendation to eat five fruits and
4
vegetables daily and of the relationship of high fruit and vegetable consumption to
reduced risk of heart disease and cancer also improved, but these changes were not
significant. However, the percentage of African American participants who responded
correctly that 5 fruits and vegetables are recommended daily increased from 13% at
baseline to 41% post- intervention. An additional finding was that participants who took
> 4 medications per day or were identified as supertasters were more likely to have
significantly lower mean intakes of several fruits and vegetables, especially those high in
vitamin C.

5
CHAPTER II
LITERATURE REVIEW
Older Adult Population The elderly population is growing larger, both globally and nationally. Currently,
the number of older adults (those aged 65 and older) in the United States is 33.9 million
(CDC, 2001). That number is projected to more than double to 70 million by the year
2030; 20% of the total population will be aged 65 or older. By comparison, older
Americans living in 1900 numbered a mere three million. The oldest old (those aged 85
and older) is the fastest growing age group in the U.S. and in all developed countries.
Georgia has the fourth fastest-growing elderly population in the United States (GA DHR,
2002). Georgia’s elderly population increased by 20 % from 1990 to 2000, and the
current population of older adults in Georgia is 12% higher than the United States total
(AoA, 2002).
Growth of the elderly population will lead to increased demands on health care
systems (WHO, 2001). Chronic disease, particularly taxing on health care systems, is
more prevalent with age. Of the top ten leading causes of death in the United States for
all populations, heart disease and cancer hold the number one and number two positions,
respectively, and together account for 50% of all deaths (CDC, 2001). Eighty-four
percent of heart disease and 71% of cancer victims are 65 and older. Chronic disease
sometimes translates into functional limitations, disability and need for assistance
(Drewnowski & Evans, 2001). In 1997, over 4.5 million elderly (14%) experienced
difficulty performing activities of daily living (ADLs), including bathing, dressing,
6
eating, and moving around their home (AoA, 2002). Further, 6.9 million (22%) reported
difficulties with instrumental activities of daily living (IADLs), including meal
preparation, shopping, and taking medication. Disease and disability are not inevitable
consequences of aging, even though the likelihood clearly increases with age (Chernoff,
2001). Effective prevention strategies for chronic disease and associated risk factors
have been established through research, epidemiology, and surveillance.
Poor diet is a significant risk factor for many chronic diseases associated with
aging, but is modifiable, unlike genetic predisposition (Steinmetz & Potter, 1996).
Numerous epidemiological studies have shown that diets low in fat, high in fiber, and
high in fruits and vegetables may reduce the risk of many chronic diseases, including
cancer, heart disease, diabetes, osteoporosis, arthritis, cataract, and age-related macular
degeneration (Steinmetz & Potter, 1996; Joshipura et al., 2001; Johnston et al., 2000).
Research has also shown that individuals seeking healthy lifestyles, such as engaging in
regular physical activity, avoiding tobacco, and following a healthy diet, have red
uced risk of chronic disease and cut their chances of disability by one-half,
regardless of genetic predisposition (CDC, 2001). Benefits of seeking a healthy lifestyle
can be seen at any age. Unfortunately, these prevention strategies, as well as others such
as screening and surveillance, have not been widely applied in the health care arena with
the older adult population.
Recognizing that nutrition is a major modifiable risk factor for chronic disease
and related complications in an older population, the U.S. Department of Health and
Human Services, Administration on Aging developed the Older Americans Act Nutrition
Program (OANP) in 1972 (Millen et al., 2002; Ponza et al., 1996). Also known as the
7
Title III Nutrition Program, it is the largest U.S. community nutrition program for adults
aged 60 years and older and their spouses (AoA, 2001). The OANP serves over 3 million
lunch meals daily across the U.S.; over 38,000 meals are served daily in Georgia (GA
DHR, 2002). This nutrient-dense meal, served five days a week in community senior
centers or delivered to home-bound clients, meets over one-third of a senior’s daily
nutritional need. Congregate daily meals provide community-dwelling, ambulatory
seniors the opportunity to participate in activities, socialize, and receive education
programs. Although the program's purpose is to offer preventive nutrition and health-
related services to all elderly persons, due to funding limitations, OANP projects are
placed primarily in communities where elderly people are at increased nutritional risk
(Millen et al., 2002). Characteristics of these communities include poor, minority, rural,
and frail elderly. An Executive Summary of the OANP reported significant health and
health-related problems in program participants, including an average of two to three
diagnosed chronic health conditions per participant (Ponza et al., 1996). Both
community and home-based preventive nutrition services are vital to improving overall
health and quality of life of a population with a broad scope of significant health
problems.
Nutritional Risk Factors and Nutrient Intakes of OANP Participants
Preventive nutrition services are an essential component of home and community-
based services for elders. The elderly are at increased nutritional risk because of
vulnerability to chronic disease and other health problems, and physical and cognitive
limitations. A national evaluation of the OANP provides the most recent and
comprehensive profiles of participants (Ponza et al., 1996). Eighty to 90 percent of
8
OANP participants have incomes below 200% of the DHHS poverty level – twice as
many compared to the overall U.S. elderly population (Ponza et al., 1996). In the
Southern U.S., those aged 65 and older have the highest poverty rates of all elderly
Americans (U.S. Census Bureau, 2000). Ponza et al. (1996) also reported that 10 % of
OANP participants experienced food insecurity. Participants are also twice as likely as
older adult non-participant counterparts to live alone and have functional limitations that
interfere with performance of everyday tasks. Two-thirds are either under- or
overweight, further increasing their risk for nutrition and health problems.
Other common nutritional risk factors in this population include lower educational
attainment, higher incidence of chronic disease, more than three prescribed medications,
and older age (four to six years on average; Millen et al., 2002; Ponza et al., 1996).
These factors tend to co-exist in multiple combinations and severely elevate the
nutritional risk and overall poor health of this population.
Elderly residents of Southern states are more likely than their Northeast
counterparts to consume less calories, protein, vitamin C, vitamin B-6, phosphorus, and
magnesium (Weimer 1998). Research conducted by Accettura (2000), Aspinwall (2001),
Brackett (1999), and McCamey et al. (2003), Department of Foods and Nutrition,
University of Georgia, mirror those of other regional and national OANP evaluations.
Several nutrient deficiencies were identified, including vitamin D, vitamin B6, and
vitamin B12; common nutritional risk factors included obesity, use of multiple
prescription medications, and physical and functional limitations. Low intakes of fruits,
vegetables and dairy products associated with reduced chronic disease risk were also
reflective of national data.
9
Participants who receive daily meals, both congregate and home-delivered, are
more likely to have higher intakes of key nutrients than non-participants (Ponza et al.,
1996). OANP meals provide 40 to 50 percent of daily requirements for most nutrients.
However, over one-third of participants save part of their meal to eat as a full or partial
second meal or a snack, which may reflect some level of food insecurity.
Benefits of Fruit and Vegetable Intake
Epidemiologic evidence supports the relationship between high fruit and
vegetable intake and reduced risk for many chronic diseases. The evidence is particularly
strong for cardiovascular disease and cancer, the leading causes of death in the elderly.
In a 2001 epidemiological study of cardiovascular disease risk and fruit and vegetable
intake, subjects ranged in age from 34 to 75 and were free of cardiovascular disease,
cancer, and diabetes at baseline (n= 84,251 females, 42,148 males; Joshipura et al.,
2001). After an 8 to 14 year follow-up period, and adjustment for standard
cardiovascular risk factors, total fruit intake and total vegetable intake were both
associated with decreased risk for cardiovascular disease. The lowest risks were
observed in individuals with high intakes of cruciferous and green leafy vegetables and
vitamin C–rich vegetables and fruits. A prospective study of female health professionals
by Liu et al. (2000) also suggested an inverse relationship between fruit and vegetable
intake and cardiovascular disease.
Several studies have acknowledged that 35% of cancer may be attributed to
unhealthy diets (Steinmetz and Potter, 1996; Havas et al., 1998). Epidemiological studies
examining cancer and fruit and vegetable consumption concur that an inverse relationship
exists and that the same fruits and vegetables are responsible for the protective effect –
10
cruciferous and dark green vegetables, tomatoes, and citrus fruits (Johnston et al., 2000).
A review of vegetables, fruit, and cancer prevention by Steinmetz and Potter (1996)
highlighted fruits and vegetables most often found (in 70% or more studies) to have an
inverse association with cancer at any anatomical site. These included allium vegetables
and carrots in addition to those previously mentioned. Block et al. (1992) reported that
persons consuming one or less servings of fruits and vegetables a day had twice the risk
of cancer compared with persons consuming at least four servings a day.
As a result of the research supporting high fruit and vegetable consumption and
reduced risk of heart disease, cancer, and other health conditions, several large
government agencies have promoted this relationship through publications and
campaigns. Healthy People 2010 included separate objectives for the consumption of five
or more fruits and vegetables daily and, within the vegetable category, added a specific
aim for dark green and deep yellow vegetables (US DHHS, 2000; Krebs-Smith and
Kantor, 2001). A massive health promotion campaign, Five a Day for Better Health, was
launched in 1991 by the National Cancer Institute in conjunction with the Produce for
Better Health Foundation (NCI, 2000) to increase awareness; the Dietary Guidelines for
Americans (2000) also recommend at least five servings a day of fruits and vegetables
(Krebs-Smith and Kantor, 2001).
National surveillance and epidemiological studies have been useful in assessing
the frequency and types of fruits and vegetables consumed by Americans. According to
BRFSS 2000 prevalence data, only 23 percent of Americans consumed the recommended
five or more servings per day. Although this was an improvement from the 19 percent
reported in 1990, it has changed little since 1994 (Liu et al., 2000), despite the massive

11
public health campaign launched by Five a Day. This percentage was even lower in the
Five a Day research trials, where adults aged 18 and older consumed an ove rall mean of
3.6 servings a day; only 17 percent consumed the recommended number of servings
(Thompson et al., 1999). In a study examining baseline and follow-up results of the Five
a Day for Better Health Program, the slight increase in total consumption was due to
higher fruit, not vegetable, consumption (Stables et al., 2002). According to Continuing
Survey of Food Intakes by Individuals (CSFII) 1994–1996 surveillance, white potatoes
alone accounted for one-third of vegetables consumed. Based on data collected from two
nonconsecutive 24-hour dietary recalls, U.S. adults aged 25-75 years consumed over
three times as many white potatoes and starchy vegetables as dark green and deep yellow
vegetables, and fewer than one in five adults surveyed consumed a cruciferous vegetable
in either recall interview (Johnston et al., 2000).
Knowledge of the relationship of fruit and vegetable consumption to chronic
disease risk and of current dietary recommendations may serve as one explanation for
low consumption patterns of some fruits and vegetables. Although a modest number of
individuals are aware of the diet and cancer relationship, they may lack the knowledge of
fruits and vegetables that decrease cancer risk (Harnack et al., 1998). Only 20 percent of
all Americans and 16 percent of those aged 65 and older are currently aware of current
recommendations to eat five or more servings of fruits and vegetables a day for better
health (NCI, 2000; Stables et al., 2002).
Adults aged 65 and older tend to consume more servings per day of fruits and
vegetables than other age groups, as indicated by BRFSS 2000 national data. Mean fruit
and vegetable intakes for adults aged 50 and older were reported at 3.7 servings per day,

12
0.1 servings higher than all adults combined (Thompson et al., 1999). However, BRFSS
2000 data indicates that 30 percent of elderly Georgians average 5 or more servings a
day, as compared with 31.7 percent of elderly Americans nationwide. Even though older
adults are more likely to consume more fruits and vegetables than the general population,
these percentages are still low and there is much need for improvement. This task is
especially important in a growing elderly population riddled with chronic disease, overall
poor health, functional limitations, and other health conditions and risks that may benefit
from dietary modification, namely increasing fruit and vegetable intakes to meet or
exceed recommendations.
Barriers to Fruit and Vegetable Consumption
Barriers often relate more closely than benefits to nutrition behaviors, therefore
identification and reduction of barriers is necessary to improve fruit and vegetable intake
(Dittus et al., 1995). A review of 22 fruit and vegetable behavioral intervention studies
observed that underserved and minority elderly populations are often at greatest risk for
chronic disease and health problems and tend to experience more obstacles to adopting
dietary change; encouragingly, interventions targeted at individuals with elevated disease
risk were found to be most effective (Ammerman et al., 2002).
Lack of knowledge and negative attitudes and beliefs related to fruit and
vegetable consumption are barriers that have the potential for improvement through
nutrition intervention (Shumaker et al.; See Figure 1). These are considered to be
modifiable barriers. However, several static barriers, or those that are unmodifiable
through nutrition invervention, are closely associated with fruit and vegetable
consumption in older adult populations, and must be identified and considered in

13
program development. For example, Donkin et al. (1998) measured fruit and vegetable
consumption using a food frequency questionnaire and dietary diary, and identified male
gender and living alone as static variables related to fruit and vegetable consumption in
community-dwelling older adults. Older males living alone consumed fruits and
vegetables much less frequently and had poorer nutrient status compared to the rest of the
sample. Additional static barriers included lower consumption of vegetables with
increasing age and less education, and lower consumption of fruit by those who had a
lower socioeconomic status. The baseline survey of the Five a Day program (Subar et al.,
1994) reported several predictors of fruit and vegetable intake. Respondents were 2,811
U.S. adults interviewed with a phone survey in 1991, with over-sampling of African
Americans and Hispanics to improve ethnicity subgroup analyses. Respondents were
asked about consumption patterns of fruits and vegetables listed on the Block Food
Frequency Questionnaire and those listed as top-selling by the produce industry, for a
total of 33 items. Portion size was not asked. Seasonal consumption of seven items from
the Block FFQ, including peaches, melons, berries, oranges, and, string beans/peas/corn
and tomatoes was also determined. Gender, ethnicity, age group, level of education, and
low socioeconomic status were identified as important predictors of fruit and vegetable
intake. Total mean fruit and vegetable intake was highest for African Americans
compared with Caucasians and Hispanics in both the youngest and the oldest age groups,
largely because of higher intakes of fruit and fruit juice. Fruit and vegetable intake
increased with education and decreased with socioeconomic status. Females had higher
median intakes than males, and those over age 65 had higher intakes than any other age
group (approximately 4.1 servings per day).
14
Male gender, older age, minority, low income, living alone, and less than 13 years of
formal education are static variables that have consistently been associated with low fruit
and vegetable consumption in these studies, as well as other surveys and intervention
studies (Laforge et al., 1994; Donkin et al., 1998; Johnson et al., 1998). Additionally,
geographic location has been associated with low fruit and vegetable consumption.
Johnson et al. (1998) found that 51 percent of rural elderly did not meet fruit and
vegetable recommendations, compared with 37 percent of their urban counterparts.
Observational studies and reports on modifiable barriers to fruit and vegetable
consumption, including knowledge, beliefs, attitudes, and self-efficacy, are discussed in
the following section. In a Five a Day national program evaluation report, investigators
found that the strongest predictors of dietary change were knowledge that 5 servings of
fruits and vegetables are recommended daily, taste preferences, and self-efficacy (NCI,
2000). Johnson et al. (1998) examined fruit and vegetable consumption patterns in 445
older adults, along with barriers to consumption. Subjects completed food frequency
questionnaires, four-day dietary diaries, and an interview examining influences on food
choices and nutrition knowledge. A major finding was lower consumption of vegetables
in older respondents; possible explanations were lowered taste acuity and being
physically unable to prepare vegetables. Further, Donkin et al. (1998) observed that
consumption of all foods decreases in individuals aged 75 and older, due in part to
lowered taste acuity. Harnack et al. (1998) used data collected for the 1992 National
Health Interview Survey Cancer Epidemiology Supplement to assess cancer prevention-
related knowledge, beliefs, and attitudes. The sample consisted of 12,005 adults aged 18
and older; African Americans and Hispanics were oversampled to achieve adequate
15
representation. Men were more likely than women to have lower knowledge levels
regarding diet and cancer, knowledge of dietary recommendations, and the current Five a
Day recommendation for fruits and vegetables, and African Americans and Hispanics
were more likely to have lower knowledge levels of these three relationships than
Caucasians. Men were more likely to report taste, ease of eating a healthy diet, and
confusion over dietary advice as attitudinal barriers to a healthy diet. Those aged 65 and
older were also more likely to report confusion over dietary advice. African American or
Hispanic subjects were more likely to report food taste, cost, and confusion over dietary
advice as barriers to consumption of a healthy diet; the same attitudes were observed in
subjects with lower socioeconomic status and lower educational attainment. One study
assessed barriers to fruit and vegetable consumption in African American public housing
residents by conducting focus groups (Shankar & Klassen, 2001). Cost was cited as the
primary barrier to fruit and vegetable consumption. Focus group participants reported
beliefs and attitudes that vegetables are less filling and more costly than other meal
components, are on sale rarely or never, and take too much time to prepare. In a
multiethnic worksite study, availability, taste preferences, and preparation time were
important predictors of fruit and vegetable intake; low education and low income were
significantly associated with perception of these barriers (Cohen et al., 1998). Only 23
percent of the population consumed the recommended number of servings daily, and
consumption of cruciferous vegetables and fruits and vegetables rich in vitamins A and C
were especially low in African Americans and persons with low education.
The relationship of static barriers, modifiable barriers, and fruit and vegetable
intake is complex. Overall findings of these studies strongly indicate the need to target
16
nutrition interventions to low-income, less educated, minority, and elderly populations,
and to tailor interventions so that modifiable barriers, including attitudes, beliefs, and
knowledge are addressed. Barriers to fruit and vegetable consumption in the context of
fruit and vegetable nutrition intervention programs are discussed in the next section.
Fruit and Vegetable Intervention Studies
Few fruit and vegetable intervention studies have specifically targeted older
adults. One home based program for community-dwelling elders in Boston (Bernstein et
al., 2002) featured a tailored intervention to increase fruit and vegetable and dairy intakes
to meet current recommendations. Seventy men and women aged 70 and older received
either a nutrition education intervention or an exercise intervention (control group). The
design was pre-and post-test. The 6-month nutrition education curriculum consisted of
an education booklet that promoted 5 servings of fruits and vegetables and 3 servings of
calcium-rich foods a day, home visits, phone contacts, letters, goal-setting, food journals,
and games. Nutrition topics included in the curriculum were the importance of good
nutrition at any age, health benefits of fruits and vegetables, grocery shopping tips,
recipes, serving sizes, and osteoporosis. The exercise control group received a 6-month
intervention to improve strength and balance, but no nutrition intervention. Both groups
were required to keep monthly progress logs in an effort to increase adherence to the
curriculum and were given program-related rewards for doing so. The nutrition
intervention was considered to be successful, improving intakes of both fruits/vegetables
and dairy products by one additional serving per day. Specifically, the nutrition
intervention group reported eating more citrus fruit, orange vegetables, tomatoes, and
other vegetables than the exercise control group. Increases in serum concentrations of

17
alpha-carotene, beta-carotene, beta-cryptoxanthin, and total carotenoids were observed in
the nutrition intervention group, which supported these findings. Implications of the
study were that dietary recommendations should be individualized to fit each person’s
lifestyle and preferences, and that record-keeping and positive reinforcement are useful
techniques in adherence and facilitation of behavior change. However, because 68 of the
70 subjects were Caucasian, and because the intervention was conducted in an individual
vs. group setting, findings may not be applicable to Georgia OANP participants.
Another fruit and vegetable intervention study used the unique approach of
nutrition education through gardening to facilitate dietary behavior change in 141 adults
aged 55 and older (Hackman & Wagner, 1990). The 5-month intervention consisted of
bi-weekly home visits to participants, bi-monthly group sessions on gardening, and bi-
monthly group sessions on nutrition. The intervention took place in three different
locations, one of which was a large, urban senior center. The curriculum focused on
seven nutritional areas for improvement: dairy products, vitamin C-rich foods, iron-rich
foods, dark green leafy vegetables, fiber from fruits and vegetables, fiber from beans and
whole grains, and water. Goal-setting, Nutrition Bingo with pictures of targeted foods, a
large-print nutrition workbook, and raised garden boxes for growing fruits and vegetables
were used to facilitate behavior change. There were significant improvements (p<0.01)
in mean intakes of vitamin C-rich foods and fiber intake from fruits and vegetables, as
well as in most of the other five nutrition categories. Improved nutrition attitudes were
also observed, including increased confidence in the ability to structure a healthy diet.
One limitation noted in the study is the seasonality of fruits and vegetables; mean intakes
may have been higher during late summer garden harvesting. However, some dietary
18
changes seemed to be independent of seasonality. This study demonstrates the
importance of creating a socially supportive environment for seniors in which they can
increase self-efficacy and physiological well-being by actively participating in an
intervention.
Another fruit and vegetable intervention targeted members of 50 black churches
in 10 North Carolina rural counties (2519 subjects, mean age=54, 98% African
American, 73% female; Campbell et al., 1999). The population had higher rates of
cancer morbidity and mortality than the state average. At baseline, a 15- item food
frequency questionnaire was used to measure fruit and vegetable consumption in an
intervention and a control group, as well as knowledge of the Five a Day
recommendation and self-efficacy for eating 5 servings a day. Fruit and vegetable items
included in the questionnaire were 100% orange or grapefruit juice, other 100% juice,
fruit, salad, fried potatoes, other potatoes, and other vegetables. For 20 months, the
intervention group received messages on barriers to consumption, monthly packets of
handouts, educational sessions, recipe tasting sessions, and were encouraged to serve
more fruit and vegetable dishes at church events. At baseline, only 23% of total
participants consumed five or more servings of fruits and vegetables a day; after a 2-year
follow-up; in the intervention group, this figure increased to 33% vs. a decrease to 21%
in the control group. The largest increases in consumption were observed in participants
aged 66 and older and with education beyond high school. Knowledge also increased
significantly from baseline in the intervention group; 36% of participants knew the five a
day recommendation compared with only 10% at baseline. In summary, fruit and
19
vegetable interventions in older adult populations, while few, demonstrate innovative
approaches and promising outcomes.
Because low socioeconomic status is prevalent among rural, underserved elderly,
it is also important to review studies in low-income populations. Treiman et al. (1996)
conducted formative research to identify fruit and vegetable consumption barriers in low-
income women for a future intervention study for Maryland WIC participants. The most
frequently cited barriers identified in focus group discussions were the dislike of specific
fruits and vegetables, preferring other foods over fruits and vegetables, time and
difficulty involved in preparation, perishability, and cost. This study suggests that
interventions may be more successful when specific behaviors are promoted, such as
having 100% fruit juice or fruit with breakfast, rather than general information about
ways to increase consumption. Five specific behaviors were identified as having the
most potential for increasing fruit and vegetable consumption: having 100% juice or fruit
in the morning, having fruit for a snack, eating a salad or other vegetables at lunch, eating
two vegetables for dinner, and eating fruit for dessert.
Havas et al. (1998) reported the final results of the Maryland WIC Five a Day
promotion program. The primary goal was increased consumption of fruits and
vegetables by at least 0.5 serving each, based on a report that this increase, if maintained,
could result in an 8% lower incidence of cancer. A multifaceted intervention program
was conducted over two years at 16 WIC sites, with surveys occurring at baseline, 2
months post- intervention, and 1 year later. Survey questions asked about barriers,
knowledge, attitudes, and behaviors related to fruit and vegetable intake; 7 summary
questions were used to assess fruit and vegetable consumption. Each participant received

20
an illustrated fruit and vegetable program book for goal setting, identifying barriers to
increasing consumption, choosing behavioral strategies to reach goals, and recording
thoughts about fruits and vegetables. Participants were guided through the program book
exercises in 4 sessions by peer educators at each WIC site. Other materials used to create
an environment conducive to change included a book of recipes submitted by
participants, colorful posters at intervention sites, and educational extenders such as
refrigerator magnets and videos. Participants also received four letters, tip sheets, and
cue cards in the mail over six months, which were tailored to their individual barriers and
goals. Post- intervention data revealed significant increases in mean daily fruit and
vegetable intakes among intervention participants when compared to controls (0.56 +
0.11 per day vs. 0.13 + 0.17 per day). There was also a linear trend among increased
consumption of fruits and vegetables and attendance. It should be noted that 46% of
participants attended 0 sessions, which may have diluted the positive changes observed in
attendees. Knowledge of Five a Day increased from 46% to 57% in the intervention
group, and other positive changes in knowledge, efficacy, and attitudes were observed.
Perceived barriers, however, did not change significantly. One year after completion of
the initial post-intervention survey, mean consumption of fruits and vegetables had
further increased by approximately 0.27 servings per day in both intervention and control
groups. Significantly higher increases in consumption were observed in white women
who were under 30 years old and high school graduates, demonstrating that interventions
designed to motivate African American and low-income women to increase fruit and
vegetable intake are needed. This study, while successful, demonstrates the numerous
21
and complex factors associated with increasing fruit and vegetable intake in low-income,
ethnically diverse populations.
Anderson et al. (2001) examined the effectiveness of using farmers’ market
coupons in combination with education to improve intake in a low-income community of
564 female WIC participants (43% African American, 49% Caucasian, mean age=30).
Participants were assigned to four groups: coupons and education, education only,
coupons only, and control (no intervention). Self-administered pre-and post-test
questionnaires assessed fruit and vegetable intakes, attitudes and beliefs related to intake,
and knowledge of the Five a Day recommendation. A follow-up was conducted after two
months. Taste of fruit, taste of vegetables, preparation knowledge, family response, and
importance for health were highly correlated with fruit and vegetable intake; while cost,
availability, preparation difficulty, and importance of increasing intakes were less
correlated with fruit and vegetable intake. Participants in the two groups receiving
education were more likely to have heard the Five a Day recommendation, and
participants in the two groups receiving coupons were more likely to visit local farmers’
markets. However, there were no significant increases in increased intake of specific
types of fruits and vegetables among groups. Overall, this study was successful in
increasing fruit and vegetable consumption by conducting a focused intervention targeted
at specific barriers, such as cost and health benefits, and providing solutions through
knowledge facilitation and coupon distribution. Life experiences of exposure to new
fruits and vegetables also helped facilitate change.
Cox et al. (1996) reported the impact of a previously published cancer
intervention on diet-related cardiovascular disease risk of 150 low-income EFNEP clients
22
(69% African American, 31% Caucasian). Three day random diet recalls were collected
pre- and post-intervention. The program consisted of an intervention group that received
education on diet-related prevention of cancer and CVD, and a control group that
received money management education but no nutrition or health information. The nine
intervention lessons were based on the Health Belief Model and covered such topics as
Cancer Prevention I and II; Diet and Cancer Overview; Fruits; Vegetables; Vitamin A,
Carotenoids, and Health; Vitamin C – Know the Facts; and Putting It All Together.
Participants in the control group received 13 lessons on money management, which did
not include specific information on food, nutrition, health, or disease prevention. Both
groups received bi-weekly sessions for six months. Baseline measures revealed that 75%
of all participants had below-recommended intakes of fruits and vegetables. The
experimental group increased intake of fruit and vegetable servings significantly more
than the control group (p<0.05), although mean intake of vegetables was still inadequate.
Possible explanations include low personal preference for vegetables, and low seasonal
availability and higher cost of vegetables at the time of post data collection (late winter
months). Although this study did not conduct a delayed post-test to assess whether or not
dietary changes were sustained, past EFNEP studies have found evidence of sustained
change at 12 to 20 months post- intervention.
Ciliska et al. (2000) conducted a review of the effectiveness of community-based
fruit and vegetable interventions in all populations over the age of four. Only six papers
in adult populations were rated as “moderate” or “strong” by reviewers and were
examined in this paper. Overall findings indicated that fruit and vegetable interventions
are most effective when they are developed from a theoretical base, take place over a
23
longer time period involving multiple sessions, contain specific and focused fruit and
vegetable messages, and are directed at changing behaviors and attitudes. Although fruit
and vegetable intervention studies in the literature are few in number, fruit and vegetable
interventions in low income, low literacy populations have the potential for success when
barriers are identified, self-efficacy is increased, knowledge and awareness of health
benefits is increased, and practical solutions for increasing intake are provided.
Fruit and Vegetable Studies in Georgia OANPs
Focused nutrition education programs with specific recommendations and
practical solutions must be implemented more frequently in underserved communities. A
study of northeast Georgia OANP participants recently found that only 25 to 33 percent
were meeting fruit and vegetable recommendations (Aspinwall, 2001). This study
identified the need for a reliable means of assessing fruit and vegetable intake, and the
need to promote consumption of green vegetables, tomato products, and citrus fruits in
this population. McCamey et al. (2003) acknowledged the need for future interventions
in Georgia OANP populations to facilitate behavior changes related to diet, and, more
specifically, to target and address the perceived barriers to fruit and vegetable intake in
this population. Participants in this region have much room for improvement and could
greatly benefit from a fruit and vegetable intervention program.
Sensory Changes in Older Adults
Numerous studies have shown that sensory losses are common, but modest, in
normal, healthy aging (Schiffman & Finkelstein, 1999). The degree of olfactory loss is
often greater than that of taste. In addition to small losses as a result of the normal aging
process, changes in sensory function are determined by certain disease states, especially

24
Alzheimer’s disease; environmental exposure; and surgery or treatment of health
conditions, such as the use of chemotherapy, radiation, or medications. Specifically, over
250 prescription medications have been reported to alter the sense of taste. This
phenomenon may be problematic in the elderly population, since the average community-
dwelling older adult over age 65 takes 2.9 to 3.7 medications per day (Schiffman &
Finkelstein, 1999). Medications are secreted into saliva, where by several mechanisms
they produce adverse tastes most commonly described as bitter, metallic, and medicinal.
Cardiovascular drugs, NSAIDS, and psychotropic agents appear to be most responsible
for taste and smell deficits, which may be due in part to their high prescription rate
(Schiffman & Zervakis, 2002). Taste and smell deficits in the elderly may lead to poor
appetite, reduced nutrient intake, inappropriate food choices, and impaired nutritional and
immune status. Chemosensory changes are thought to become apparent after age 60 and
more severe after age 70. However, many older adults are unaware of taste and smell
losses; they simply believe that food just doesn’t taste as good as when they were
younger.
A review of studies examining age-related sensory loss and food choices reported
a host of variables that may determine food choices and predict taste and smell loss,
including depression, loneliness, social isolation, socioeconomic status or income,
medication, and disease (Drewnowski 1997). However, separating the effects of sensory
function on dietary habits from those of education, socioeconomic status, and disease is
difficult. One study examining olfactory dysfunction and related nutritional risk in free-
living elderly women found that nearly 50% of subjects demonstrated losses in either
taste or smell (Duffy et al., 1995). This group reported increased food intake to
25
compensate for sensory loss, lower interest in food-related activities such as preparation,
higher intakes of sweets, and increased cardiac risk as indicated by nutrient profiles. The
most common reason for dislike of a particular food is perceived bitterness (Drewnowski
et al., 2001). Subjects with altered sensory function also had lower intakes and
preferences for foods with either a strong sour taste, especially citrus fruits, or foods with
a strong bitter taste, especially cruciferous and leafy green vegetables. When sensory
loss occurs in older adults, these factors may impair their ability to follow a diet rich in
fruits and vegetables to prevent or control chronic disease.
Sensitivity to the substance 6-n-propylthioluracil (PROP) is an inherited trait.
PROP tastes bitter to some people, while others cannot detect a taste (Drewnowski et al.,
2001). Rejection of some bitter compounds, most commonly phytochemicals found in
raw cruciferous vegetables, has been linked with the ability to taste PROP. Recent
studies recognize three taster categories for ability to detect PROP: non-tasters, medium
tasters, and super-tasters. Approximately 25% of American women are classified as
super-tasters, while 50% are medium tasters; females are more sensitive than males to the
bitter compound. Both medium tasters and super-tasters may report lower consumption
of fruits and vegetables that are rich in bitter but beneficial phytochemicals. Several
studies, using PROP-impregnated filter paper strips, have shown that PROP detection
thresholds increased with age and that older participants rated the compound as less bitter
than younger participants (Drewnowski et al., 2001). However, there are few studies that
examine PROP taster status exclusively in the elderly, and many confounding factors,
including illness, genetics, medications, socioeconomic status, and cancer therapy, may
complicate the assessment of linking PROP detection directly to avoidance of fruits and
26
vegetables high in phytochemicals (Drewnowski et al., 2001, Schiffman & Zervakis,
2002). The relationship of PROP taster status to fruit and vegetable consumption patterns
in low-income older adult populations is not fully understood and needs to be further
studied.
Health Belief Model
The Health Belief Model (HBM) served as the theoretical basis for this study (see
Figure 1). The HBM was first developed in the1950's by psychologists at the U.S. Public
Health Service, and was used to understand and explain failure of individuals to pursue
available preventive measures for disease, such as the tuberculosis vaccine, and to
provide the foundation for learning new skills and knowledge to achieve change (Caserta
1995; Coulston et al., 2001; Glanz et al., 1990; Shumaker et al., 1998). It has been used
more recently to explain dietary patterns and other health-related behaviors. The HBM
postulates that for behavior change to occur, individuals must 1) feel that their current
behavior patterns are conducive to a feared disease, condition, or specific action, 2)
believe that behavior change will be beneficial in reducing or eliminating the health
threat, and 3) believe that behavior change is attainable and feel confident in their ability
to implement change (self-efficacy; Glanz et al., 1990). These three tenets of the HBM
assume that health is a major concern for most people, and that a given health action will
result in the desired goal of eliminating or reducing the perceived serious consequences
of a health condition (Coulston et al., 2001; Shumaker et al., 1998). Behavior change
also depends heavily on existing barriers to adopting a specific health behavior, and may
be demographic, cultural, personal, physical, social, or psychological in nature
(Shumaker et al., 1998). The HBM is of limited use in primary prevention of chronic

27
disease, such as cardiovascular disease and cancer; instead, it has been shown to be most
effective for symptomatic individuals and is widely applicable in individuals with
nutrition-related risk factors for chronic disease (Coulston et al., 2001). In low-income,
rural older adult populations, a high number of participants are either diagnosed or at risk
for several chronic conditions, including high blood pressure, overweight and obesity,
high cholesterol, and diabetes, any of which may lead to further development of more
advanced conditions, such as cardiovascular disease. Dittus et al. (1995) explored the
relationship between benefits and barriers of fruit and vegetable intake to attitudes and
consumption using the HBM as the theoretical framework. Major findings were that
there were a significantly higher number of barriers in individuals with low income and
low education. Barriers were more closely related to fruit and vegetable intake than
benefits, suggesting intervention programs should focus first on identification of barriers
to change and facilitation of barrier reduction.
Rationale, Specific Aims, and Hypotheses
Effective nutrition interventions are crucial in low income, rural older adult
populations for improvement of nutrient profiles and overall health and facilitation of
independent living in the community (Ponza et al., 1996). Increased consumption of
fruits and vegetables, in particular those containing high levels of phytochemicals, have
consistently been shown to reduce risk of various health conditions and associated risk
factors in epidemiological studies and reviews (Johnston et al., 2000; Joshipura et al.,
2001; Liu et al., 2000; Steinmetz & Potter, 1996). These studies all cite particularly low
consumption of dark green and cruciferous vegetables, tomatoes, and citrus fruits in older
adults, and stress the need for increased consumption of these phytochemical-rich fruits
28
and vegetables. Studies in our own laboratory have observed similar consumption
patterns in OANP participants in Georgia (Aspinwall, 2001; Brackett, 1999; McCamey et
al., 2003).
In the literature, there are few focused fruit and vegetable interventions that target
low-income populations, and fewer interventions implemented exclusively in older adults
(Johnston et al., 2000). Intervention programs that focus on increasing the knowledge
and awareness of health benefits and disease prevention, reducing perceived and actual
barriers to adopting new behavior patterns, and providing practical, tangible solutions are
most successful at facilitating increased fruit and vegetable intake (Havas et al., 1998).
This study was implemented using the Health Belief Model to explain behavior change,
and aimed to identify consumption patterns of fruits and vegetables associated with
chronic disease risk, to identify and reduce barriers to increasing consumption, and to
promote increased consumption of fruits and vegetables.
The specific aims of this study were:
1. To determine baseline consumption patterns of selected fruit and vegetables.
2. To identify perceived and actual barriers to fruit and vegetable consumption, and
improve behaviors, attitudes, and knowledge related to fruit and vegetable intake
through disease prevention awareness, emphasis of the overall health benefits of
fruits and vegetables, increased self-efficacy, and providing practical ways to
increase intake.
3. To identify the relationship of fruit and vegetable consumption to medication use
and supertaster status.

29
4. To determine the effectiveness of a nutrition intervention program that is designed
for a low income, low literacy older adult population by assessing change in
intakes of selected fruits and vegetables.
The hypotheses of this study were:
1. Participants will increase mean intakes of > 3 of the 31 fruit and vegetable items
assessed in the intervention.
2. After completion of the curriculum, knowledge and self-efficacy related to fruit
and vegetable consumption will increase.
30
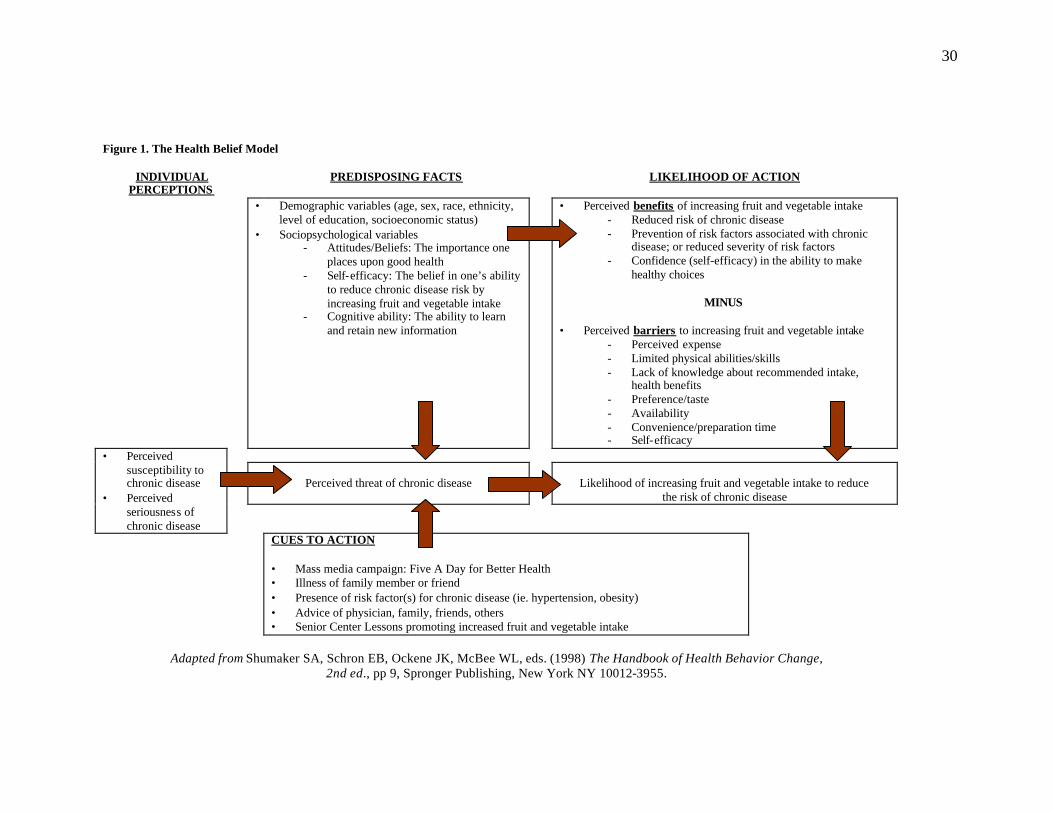
Figure 1. The Health Belief Model
INDIVIDUAL PERCEPTIONS
PREDISPOSING FACTS
LIKELIHOOD OF ACTION
• Demographic variables (age, sex, race, ethnicity, level of education, socioeconomic status)
• Sociopsychological variables - Attitudes/Beliefs: The importance one
places upon good health - Self-efficacy: The belief in one’s ability
to reduce chronic disease risk by increasing fruit and vegetable intake
- Cognitive ability: The ability to learn and retain new information
• Perceived benefits of increasing fruit and vegetable intake - Reduced risk of chronic disease - Prevention of risk factors associated with chronic
disease; or reduced severity of risk factors - Confidence (self-efficacy) in the ability to make
healthy choices
MINUS
• Perceived barriers to increasing fruit and vegetable intake - Perceived expense - Limited physical abilities/skills - Lack of knowledge about recommended intake,
health benefits - Preference/taste - Availability - Convenience/preparation time - Self-efficacy
Perceived threat of chronic disease
Likelihood of increasing fruit and vegetable intake to reduce the risk of chronic disease
• Perceived susceptibility to chronic disease
• Perceived seriousness of chronic disease
CUES TO ACTION • Mass media campaign: Five A Day for Better Health • Illness of family member or friend • Presence of risk factor(s) for chronic disease (ie. hypertension, obesity) • Advice of physician, family, friends, others • Senior Center Lessons promoting increased fruit and vegetable intake
Adapted from Shumaker SA, Schron EB, Ockene JK, McBee WL, eds. (1998) The Handbook of Health Behavior Change,
2nd ed., pp 9, Spronger Publishing, New York NY 10012-3955.

31
CHAPTER III:
A FRUIT AND VEGETABLE NUTRITION EDUCATION INTERVENTION IN
NORTHEAST GEORGIA OLDER AMERICANS ACT NUTRITION PROGRAMS
IMPROVES INTAKE, KNOWLEDGE, AND BARRIERS RELATED TO
CONSUMPTION
Introduction
Chronic disease, including heart disease and cancer, and associated risk factors
are major health threats to adults aged 65 and older, often translating into functional
limitations, disability, and overall poor health and nutrition status (Drewnowski and
Evans, 2001). However, chronic disease and disability are not inevitable consequences
of aging. Effective prevention strategies have been established, including establishment
of the recommendation to consume a diet low in fat, high in fiber, and plentiful in fruits
and vegetables (Steinmetz and Potter, 1996; Joshipura et al., 2001; Johnston et al., 2000).
The Older Americans Act Nutrition Program (OANP) is the largest U.S.
community nutrition program for adults aged 60 and older (AoA, 2001). The OANP is
usually housed in community or senior centers, serves a nutrient-dense meal five days a
week to participants, and is often used as a forum to provide nutrition education and other
health-related services. It has been estimated that more than 50% of OANP participants
in Georgia are at nutritional risk and are considered to have overall poor health
(Accettura 2000; Aspinwall 2001; Brackett 1999). Because Georgia has the fourth

32
fastest-growing elderly population in the United States (GA DHR, 2002), older adults in
Georgia would especially benefit from efforts to reduce chronic disease risk. Previous
research in our laboratory has shown that over two-thirds OANP participants in Georgia
senior centers consumed less than five servings of fruits and vegetables daily; especially
low were intakes of brightly-colored, high-phytochemical fruits and vegetables
associated with reduced chronic disease risk (Aspinwall, 2001).
Based on a review of the literature, few fruit and vegetable nutrition education
intervention programs designed to increase consumption have been conducted in low-
income, older adult populations. It has been reported that only 25 to 33 percent of
Georgia OANP participants are currently meeting fruit and vegetable recommendations
(Aspinwall, 2001). In order to promote increased intake of fruits and vegetables in
Georgia OANP participants, it has been suggested that an education program emphasize
increased consumption of the colorful fruits and vegetables associated with reduced
chronic disease risk (especially green vegetables, tomato products, and citrus fruits), and
identify perceived barriers to fruit and vegetable intake in this population (Aspinwall,
2001; McCamey et al., 2003). Thus, the focus of this study was to promote increased
intake of selected fruits and vegetables in OANP participants through a fruit and
vegetable nutrition education program.
The Department of Foods and Nutrition at the University of Georgia was funded
by the Georgia Department of Human Resources and Northeast Georgia Regional
Development Center and Area Agency on Aging to develop, implement, and evaluate a
fruit and vegetable nutrition intervention program for use in Georgia OANP programs.
The Health Belief Model was used in this study as a framework for understanding
33
barriers and attitudes that affect fruit and vegetable intake. The HBM postulates that for
behavior change to occur, individuals must feel that their current behavior patterns are
conducive to a feared disease or condition, believe that behavior change will be beneficial
in reducing or eliminating the health threat, believe that behavior change is attainable,
and feel confident in their ability to implement change (self-efficacy; Glanz et al., 1990).
This model assumes that health is a major concern for most people, and that a given
health action will result in the desired goal of eliminating or reducing the perceived
serious consequences of a health condition (Coulston et al., 2001; Shumaker et al., 1998).
We evaluated the outcomes of a focused nutrition education intervention designed to
improve fruit and vegetable intake, increase knowledge, and reduce barriers to
consumption in an underserved elderly population. Fruits and vegetables selected for this
study are commonly consumed in low amounts, as documented in studies completed
within OANP’s in Georgia (Aspinwall, 2001; McCamey at al., 2003), and as reported in
epidemiological studies and reviews (Joshipura et al., 2001; Liu et al., 2000; Steinmetz
and Potter, 1996). Ten educational modules were developed for this intervention and
were delivered over a seven month period in five participating counties. The curriculum
consisted of: 1. Cruciferous Vegetables, 2. Citrus Fruits, 3. Berries, 4. Onions and Garlic,
5. Leafy Greens, 6. Beans, 7. Canned and Frozen Produce, 8. Squash, Zucchini, and
Pumpkin, 9. Tomatoes and Tomato Products, and 10. (Supplemental) Medication
Interactions and Fruit and Vegetable Intake. The study was conducted in 2001 and 2002
and was piloted in five rural senior centers in Northeast Georgia located in Elbert,
Greene, Morgan, Oglethorpe, and Oconee Counties. The program is currently being
conducted in other senior centers in Northeast and Northwest Georgia, with future plans
34
to implement the program statewide. The program curriculum is available for download
at www.arches.uga.edu/~noahnet.
The objectives of this study were to: (1) determine baseline consumption patterns
of selected fruit and vegetables, (2) identify barriers to fruit and vegetable consumption,
and improve behaviors, attitudes, and knowledge related to fruit and vegetable intake
through disease prevention awareness, emphasis of the overall health benefits of fruits
and vegetables, increased self-efficacy, and providing practical ways to increase intake,
(3) identify the relationship of fruit and vegetable consumption to medication use and
supertaster status, and (4) determine the effectiveness of a nutrition intervention program
that is designed for a low income, low literacy older adult population by assessing change
in intakes of selected fruits and vegetables.
The hypotheses of this study were: (1) participants will increase mean intakes of > 3 of
the 31 fruit and vegetable items assessed in the intervention, and (2) after completion of
the curriculum, knowledge and self-efficacy related to fruit and vegetable consumption
will increase.
Methods
Research Participants
A convenience sample of 7 men and 47 women, aged 60–97 was recruited. All
subjects were community dwelling and congregate meal participants at senior centers in
Northeast Georgia. Participants needed to be cognitively able to comply with testing
procedures. The following five counties participated in this study based on their interest
in the project and the availability of their senior centers at the time of the intervention
program: Elbert, Greene, Morgan, Oconee, and Oglethorpe. Our sample size was limited
35
due to the small, rural nature of participating senior centers. Participants and non-
participants attending the senior center were invited to take part in the study, as part of
Title III-C Nutrition Services and Title III-F Disease Prevention and Health Promotion
Services. The purpose, procedures, content, and benefits of participation were explained,
and all subjects gave individual written informed consent. Participants were informed
that they could withdraw at any time from the study with no adverse effects on the ir
participation in the congregate meal program. All procedures were approved by the
University of Georgia and the Georgia Department of Human Resources Institutional
Review Board on Human Subjects. All questionnaires and consent forms are in the
Appendix.
All questionnaires and instructional materials were developed and reviewed by
expert faculty and staff in the Department of Foods and Nutrition at the University of
Georgia; educational extenders were developed by a graphic artist within the University.
The Health Belief Model served as the theoretical base for program development. Staff
from the Department of Foods and Nutrition at the University of Georgia were trained on
correct use of all survey tools in this study as well as administration of the intervention
program.
The Intervention Program
The first phase of the study consisted of staff training, senior center and
participant recruitment, obtaining signed consent (see Appendix A), and pre–test
administration. The second phase was a six-month fruit and vegetable education program
comprised of 10 teaching modules. The last phase consisted of administration of the
post–test, a brief sensory evaluation, and sensory tests that screened for taste acuity; this

36
phase lasted for two months. All questionnaires were read aloud individually to each
participant by trained staff, who recorded their responses.
At baseline, questionnaires were administered that collected information on
selected fruit and vegetable consumption patterns and barriers to consumption (see
Appendix B). Demographic information - age, gender, ethnicity, and county - was
recorded in the first section of the pre-test. The second section was a food frequency
questionnaire that contained 31 questions about consumption patterns of specific fruits
and vegetables (fresh, frozen, and canned). Fruits and vegetables selected had high
phytochemical content (USDA Nutrient Database, 1998; see Appendix F), have been
associated with disease risk reduction in epidemiological studies, and/or were consumed
in low amounts in previous studies in this population (Aspinwall, 2001; McCamey et al.,
2003). Frequency categories used in the questionnaire included: less than 1 serving per
week, 1 per week, 2 per week, 3 per week, 4 per week, 5 per week, 6 per week, 1 per day,
2 per day, and missing/don’t know. The third section inquired about potential barriers to
fruit and vegetable consumption in this population. Barriers were selected based on the
findings of previous intervention studies. Yes/no questions were used to assess
knowledge, physical limitations, attitudes, socioeconomic status, and preferences. The
final section of the questionnaire contained five questions about current or past disease
conditions. After collecting baseline data on all participants, the fruit and vegetable
education intervention was implemented.
Ten educational modules were developed for this intervention and were delivered
over a seven month period in the five participating counties. A written script lasting no
more than 30 minutes served as the guide for each lesson. Fruits and vegetables in each

37
module were grouped by similar nutrient content and characteristics. The curriculum
consisted of: 1. Cruciferous Vegetables, 2. Citrus Fruits, 3. Berries, 4. Onions and Garlic,
5. Leafy Greens, 6. Beans, 7. Canned and Frozen Produce, 8. Squash, Zucchini, and
Pumpkin, 9. Tomatoes and Tomato Products, and 10. (Supplemental) Medication
Interactions and Fruit and Vegetable Intake. The program curriculum is available for
download at the Nutrition for Older Adults’ Health (NOAHnet) website:
http://www.fcs.uga.edu/~noahnet.
At each session, participants received a packet consisting of three to four
handouts and three to four recipes. The handouts were brief, in size 14 font, and
contained bulleted main points covered in each session, including health benefits
(particularly protection against chronic disease), innovative ideas to increase
consumption, easy preparation methods, and selection and storage tips. Fresh, frozen,
and canned fruits and vegetables were promoted equally because fresh produce is often
perceived as more expensive and may not be available year-round in rural communities.
Recipes generally contained five or fewer ingredients and had short preparation times.
Fruit and vegetable cartoon characters were used as educational extenders and were
displayed at each lesson. Each lesson ended with taste-testing of a recipe included in the
corresponding lesson packet that was prepared beforehand by the instructor. All sessions
were informal, audience interaction was encouraged, and key concepts were repeated
during recipe tasting. Attendance was recorded at each session, and number of sessions
attended by each participant was totaled.
After completion of the curriculum in all participating senior centers, post-test
questionnaires were administered to assess change in fruit and vegetable consumption,
38
change in knowledge and attitudes, and program satisfaction. Eleven open-ended
questions were added to the post-test to allow participants to further describe changes in
consumption and knowledge since baseline (see Appendix C).
A brief sensory questionnaire, developed by staff in the Department of Foods and
Nutrition at the University of Georgia, and a taste and smell test to screen for sensory loss
were also administered in conjunction with the post-test (The Pocket Smell Test™,
Sensonics Inc., PO Box 112, Haddon Heights, NJ 08035, phone 856-547-7702). A
separate consent form was used for the sensory component, and individual written
informed consent was obtained (see Appendix D). The sensory questionnaire was
administered, followed by taste and smell screening tests (see Appendix E). Taste tests
were administered using two litmus paper strips placed in the participant’s mouth for 15
seconds. The first was a control strip with no detectable taste, and the second was a 6-n
propylthioluracil (PROP)- impregnated test strip. Detection of this chemical produces a
bitter sensation that mimics the response of the taste buds to certain fruits and vegetables
that contain high levels of bitter phytochemicals. It has been theorized that individuals
who are able to detect this bitter taste (called supertasters) may avoid fruits and
vegetables that produce a similar sensory response, including cruciferous vegetables and
fruits and vegetables high in vitamin C. Because over 250 prescription medications may
affect taste perception (Schiffman & Finkelstein, 1999), the number of daily prescription
medications taken by participants was recorded on the sensory questionnaire. Protocol
for the taste test is described in further detail in the Appendix. Due to time limitations of
this study, only taste acuity test results and the sensory questionnair e item inquiring about
medication use were included in analyses.
39
Statistical Analysis
The data were analyzed using the Statistical Analysis System, Version 6.1 (SAS
Institute, Cary, NC). Only one person coded all questionnaires and entered all data to
ensure consistency. Data files were checked twice for accuracy by the investigator and a
staff member before the analyses were performed. In order to generate summary scores
by nutrient content of fruit and vegetable items, cut-off values were assigned: > 777 IU
vitamin A, > 25 mg vitamin C (both values are approximately one-third of the
Recommended Dietary Allowance for females > 19 years), and > 4000 µg carotenoids
(USDA Nutrient Database, 1998; see Appendix F, G). Descriptive statistics, including
frequencies, means and standard errors were generated at Time 1 (pre-test) and Time 2
(post-test). Data from pre- and post-tests were compared using paired T-tests and Chi-
Square Analyses to identify changes that were either statistically significant (p value <
0.05) or trends (p value= 0.05 – 0.15). Analyses were conducted by ethnicity (Caucasian
and African American participants), and age (participants < 80 years old and participants
> 80 years old). Open-ended questions at Time 2 provided qualitative and quantitative
information used to assess participants’ self-reported changes and satisfaction with the
program. Correlation analyses were used to identify possible predictors of change in fruit
and vegetable consumption.
Results
Of the 59 participants who enrolled in the study, 54 completed pre-test measures,
47 completed post-test measures, and 41 completed the taste acuity questionnaire and
test. Questionnaires were not completed for the following reasons: cognitive inability to
answer all questions (n=5), died (n=1), did not attend the Senior Center for any post-test

40
sessions (n=2), no longer attended the Senior Center due to personal or health reasons
(n=10). When appropriate, participants who were unable to attend the Senior Center
were interviewed over the telephone (n=6) to obtain post-test responses.
Participant characteristics at baseline are shown in Table 1. The mean age was
77.9 + 1.2 years in participants who completed baseline measures (n=54). The sample
was predominantly female (87%) and African American (57%). The following health
conditions were self- reported: hypertension (57%), high cholesterol (46%), diabetes
(35%), heart disease or heart attack (19%), and cancer (17%).
Participant responses on the pre-test questionnaire are shown in Table 2.
Baseline frequency analyses of fruit and vegetable intake revealed low consumption
patterns for several variables. The following were reported as being consumed once a
week or less by > 50% of the population: 100% cranberry, apple, or purple grape juice
(58%), berries (79%), nectarines, peaches, or apricots (54%), cruciferous vegetables
(50%), cantaloupe or honeydew (74%), corn (67%), tomato products (56%), squash or
zucchini (78%), spinach (80%), sweet potatoes or yams (64%), carrots (60%), beans
(66%), vegetables eaten as a snack (80%), and frozen or canned vegetables (50%).
African American participants’ average intakes of orange juice, leafy green vegetables,
and spinach were at least twice as high as those of Caucasian participants. African
American participants also consumed more spaghetti or lasagna and sweet potatoes, but
fewer servings of onions per week than Caucasian participants. Age had little effect on
consumption patterns, although those aged 60-79 ate corn more frequently than those
aged 80 and older. Summary score means also showed that African American
participants consumed, on average, 6.5 more servings per week of all fruit and vegetables
41
included in the questionnaire; 6.4 more servings per week of items high in vitamin C; 5
more servings per week of all fruit items; and 3 more servings per week of items high in
vitamin A and carotenoids than Caucasian participants.
Approximately 70% of participants thought that increasing fruit and vegetable
intake would reduce their risk of both heart disease and cancer, but only 24% knew that
five fruits and vegetables are recommended daily. However, Caucasian participants were
more likely than African American participants (39% vs. 13%) to know that five servings
of fruits and vegetables are recommended daily (p=0.11) at baseline. Forty percent
reported not having enough money to spend on fruits and vegetables, and 15-20% did not
like the taste of most vegetables, had difficulty using kitchen tools in vegetable
preparation, and did not plan or cook their own meals. Older participants were more
likely to report several perceived and actual barriers to consumption, including having
less interest in learning new preparation methods for vegetables and in receiving healthy
recipe handouts, and being less likely to shop for their own groceries or plan their meals.
See Appendix H for a completed table of barriers associated with fruit and vegetable
consumption frequency at Time 1.
Frequencies and mean intakes of targeted fruits and vegetables and behavioral and
knowledge questions for the post-test questionnaire are shown in Table 3. The following
were reported as being consumed once a week or less by > 50% of the population at Time
2: 100% cranberry, apple, or purple grape juice (52%), berries (71%), cruciferous
vegetables (50%), cantaloupe or honeydew (61%), corn (66%), tomato products (5%),
squash or zucchini (72%), spinach (76%), sweet potatoes or yams (65%), carrots (50%),
42
beans (55%), fruit as dessert (61%), vegetables eaten as a snack (67%), and frozen
vegetables (60%).
Pre- and post-test comparisons of mean fruit and vegetable intake are shown in
Table 4. Of the 31 variables of fruit and vegetable intake, mean intakes of 5 items
increased significantly from Time 1 to Time 2, including cranberry, apple, or purple
grape juice; peaches, nectarines, and apricots; beans; vegetables consumed as a snack;
and canned vegetables. Mean intakes of summary score variables that increased
significantly included total fruit and vegetable items (from 22.8 + 1.5 to 25.2 + 2.0
servings/week) and total fruit items (from 9.0 + 0.9 to 10.9 + 1.3 servings/week). Trends
toward increased mean intakes were found for squash or zucchini, and carrots.
Changes in mean intakes from Time 1 to Time 2 were affected by age and
ethnicity (Table 5). For example, compared with Caucasians, African American
participants had greater mean increases in consumption of cranberry, apple, or purple
grape juice; berries; and frozen vegetables, even though at baseline the mean weekly
intake of these items by African American participants was about the same or higher than
Caucasian participants. Caucasian participants had greater mean increases in
consumption of carrots, even though their mean weekly intake was slightly higher at
baseline than African Americans. Participants aged 80 and older reported greater
increases in consumption of fresh vegetables than participants under age 80, even though
they consumed an average of 1.2 servings more per week at baseline than their younger
counterparts. Trends towards increased consumption by age and ethnicity may be viewed
in Table 5.

43
Responses to five items assessing barriers to fruit and vegetable consumption
were included on both pre- and post-test questionnaires (Table 4). Three items pertained
to knowledge, one to availability of fruits and vegetables, and one to self-efficacy. There
was a trend for increased knowledge that high fruit and vegetable intake is protective
against cancer (from 70% to 83% of participants). The percentage of participants who
responded correctly that 5 fruits and vegetables are recommended daily increased from
only 34% to 38% from Time 1 to Time 2. However, when Time 2 responses were
compared with Time 1 responses for the population, the percentage of African Americans
who responded correctly increased from 13% to 41%, while the percentage of Caucasians
who responded correctly decreased from 39% to 35%.
Responses to open-ended questions at Time 2 provided further details of self-
reported change (Table 6; data on individual responses not shown; see Appendix J).
Sixty-six percent reported increased overall consumption of fruit or fruit juice, while 53%
reported increased overall vegetable intake. African American participants were more
likely to respond that they had increased intakes of these items. The most common
responses to increased fruit or fruit juice intake were: cranberry, apple, or grape juice,
100 percent orange juice, peaches, berries, apples, and bananas. The most common
responses to increased vegetable intake were: cabbage, collard or turnip greens, beans,
peas, and corn. Twenty-eight percent reported trying a fruit or vegetable that they never
liked before, including spinach, beans, and broccoli; 54% reported increased
consumption of dark green vegetables since baseline, including collards and turnips,
cabbage, spinach, and broccoli, with Caucasians being more likely to report this change.
Forty-eight percent reported using different methods to prepare vegetables, including
44
cooking with butter or margarine instead of fatback; steaming, baking, or boiling more
and frying less; eating more raw vegetables; and using less salt as seasoning. Fifty-five
percent were able to name disease risks that may be lowered by a diet high in fruits and
vegetables, including cancer, heart disease, high blood pressure, and diabetes.
Participants were asked if they had increased their fruit and vegetable consumption due to
perceived health benefits; 80% responded yes. Seventy-eight percent responded that,
since the intervention, they felt more strongly about the health benefits of fruits and
vegetables; 63% have tried to follow a healthier diet by eating more fruits and vegetables
and eating fewer sweets and high-fat foods. Several responses were significantly affected
by ethnicity (p<0.05). African American participants reported overall increases in
consumption of fruit or fruit juice (85% vs. 40% Caucasian), vegetables (70% vs. 30%
Caucasian), and dark green vegetables (67% vs. 37% Caucasian).
Additional barriers were identified at Time 2 (Table 6). Fifty-six percent of all
participants reported taking > 4 medications per day (self-reported). Eighty percent of
Caucasian participants reported taking > 4 medications every day, compared with 42% of
African American participants (p=0.04). Fifty-one percent of participants were identified
as super-tasters, and there were no significant differences in super-taster status when
ethnicity and age were examined. Table 7 depicts how medication and sensory barriers
(taking > 4 medications daily and being classified as a super-taster) negatively affected
mean intakes of specific fruits and vegetables at Time 2. Taking > 4 medications daily
was associated with lower consumption of leafy greens, frozen fruit, and total items high
in vitamin C. In addition, participants who tested positively for heightened taste acuity
(supertaster) ate more fresh vegetables, but there were trends (p=0.05-0.15) towards
45
lower consumption of cruciferous vegetables, tomato products, and total items high in
vitamin C.
There was a relationship between mean change in fruit and vegetable intake and
some Time 2 barriers (Table 8). Participants with the knowledge that five servings of
fruits and vegetables are recommended daily consumed approximately five additional
servings of fruit per week than participants without knowledge of the recommendation
(p=0.09). Knowledge of the recommendation was also associated with increases in
consumption of 100 % orange juice (p=0.11), cantaloupe (p=0.047), and frozen
vegetables (p=0.05). Participants who felt that improved eating habits would not
improve their health reported mean decreases in several variables, including fresh
vegetables (-3.2 + 1.6), frozen vegetables (-0.4 + 0.4), and onions (-0.9 + 0.9);
participants who felt that improving eating habits would result in better health reported
small increases (fewer than 1 serving per week). Participants who took 0 to 3
medications per day reported higher increases in mean intake of several items than
participants taking > 4 medications daily, including total fruit and vegetable items (8.3 +
3.5 vs. 3.3 +2.5) and total items high in vitamin C (3.6 + 2.3 vs. -0.4 + 1.3), although
these increases were not significant. Non-supertaster participants also reported higher
increases in mean intake of several items than supertasters, including total fruit and
vegetable items (8.8 + 3.3 vs. 1.9 + 2.5, p=0.11) and total items high in vitamin C (3.6 +
1.6 vs. -1.4 + 1.4, p<0.05), as well as peaches, nectarines, and apricots; tomato products;
and canned fruit (p<0.05). Attendance was significantly associated with increased mean
intake of two items: vegetables consumed as a snack and fresh fruit consumption.
Changes in mean intakes were also examined by barriers to fruit and vegetable
46
consumption reported at time 1. Participants who had difficulty using a can opener were
less likely to increase mean intake of total vegetable items per week, and participants
who did not shop for their own groceries were less likely to increase mean intake of
vegetables as a snack and frozen vegetables per week. Participants who reported
cardiovascular disease were more likely to increase mean intakes of cranberry, apple or
grape juice and total fruit and vegetable items per week. Reported lack of money to
spend on fruits and vegetables was not significantly associated with fruit and vegetable
intake at time 1 or change in fruit and vegetable consumption from time 1 to time 2.
Correlations among fruit and vegetable intake and Time 1 barriers are shown in
Table 9. Reported lack of money to spend on fruits and vegetables was not significantly
correlated with any single fruit and vegetable item or summary score. Knowledge of the
relationship between high fruit and vegetable intake and reduced risk of cancer was
significantly correlated with intake of cantaloupe or honeydew (p<0.05); knowledge of
the relationship between high fruit and vegetable intake and reduced risk of heart disease
was significantly correlated with fresh fruit intake (p<0.05). Knowledge of the Five a
Day recommendation was significantly correlated with intake of broccoli, cabbage, and
cauliflower (p<0.05). Correlations among fruit and vegetable intake and Time 2 barriers
are shown in Table 10. Knowledge of the relationship of either heart disease or cancer
risk and fruit and vegetable intake was not significantly correlated with any single fruit
and vegetable item or summary score. Knowledge of the Five a Day recommendation
was significantly correlated with intake of 100% orange juice, cantaloupe or honeydew,
and fresh vegetables (p<0.05). Eating more fruits and vegetables due to perceived health
benefits (open-ended question) was significantly correlated with intake of beans, fruit as
47
a snack, and fresh fruit. Feeling that canned and frozen fruits and vegetables are just as
good as their fresh counterparts was significantly correlated with consumption of frozen
vegetables (p<0.05). Reported increases in overall fruit consumption were significantly
correlated with total fruit and vegetable items, total fruit items, and total items high in
vitamin C, while reported increases in overall vegetable consumption were significantly
correlated with total items high in lutein and zeaxanthin (p<0.05).
Discussion
Programs and facilities that support Older Americans Nutrition Act Programs are
recognized as ideal settings for delivery of nutrition and other health promotion
programs, particularly for low-income, minority, and frail elderly (Millen et al., 2002).
However, few evaluations of fruit and vegetable intervention programs provided in
OANP frameworks have been reported in the literature. Thus, this evaluation is
important for promotion of overall health in older adults and for investigators who wish
to provide focused nutrition intervention programs to OANP clients. This nutrition
intervention was unique in its exploration of intakes of a number of fruits and vegetables
recognized for their potential in chronic disease risk reduction, barriers to fruit and
vegetable consumption in a low-income older adult population, and in its examination of
the effect of both taste acuity and number of prescribed medications on changes in fruit
and vegetable intake. Major outcomes were 1) significantly increased mean intakes of 5
of the 31 fruit and vegetable items studied, total fruits and vegetables, and total fruit, 2)
improved behaviors, attitudes, and knowledge related to fruit and vegetable consumption,
and 3) identification of chemosensory barriers to increasing fruit and vegetable intake.

48
One major finding was that at baseline, over 50% of the total population reported
intakes of < 1 serving per week for approximately half of all fruits and vegetables
assessed (14 of 31), including cruciferous vegetables, carrots, leafy greens, tomato
products, and vitamin C-rich fruits and vegetables. This finding is consistent with the
findings of a previous study conducted by this laboratory (Aspinwall, 2001), and those of
epidemiological studies examining fruit and vegetable intake and chronic disease risk
(Steinmetz & Potter, 1996; Joshipura et al., 2001; Johnston et al., 2000). Also at
baseline, only 13% of participants reported eating > 5 servings per day of the fruits and
vegetables assessed in the intervention. Other studies have reported that 23-26% of
subjects consumed the recommended number of servings per day at baseline (Campbell
et al., 1999; Cohen et al., 1998). However, both studies used a common 7- item fruit and
vegetable screener that included two questions about consumption of fried potatoes and
baked, boiled, or mashed potatoes, and two general questions on consumption frequency
of all fruits and all vegetables. The FFQ used in this study asked about intake of sweet
potatoes but not white potatoes, as well as intake of specific fruits and vegetables. This
may explain why fewer participants in the current study appeared to consume > 5
servings of fruits and vegetables daily when compared with the results of Campbell et al.
(1999) and Cohen et al. (1998). After the intervention, increases in mean intake of total
fruit items accounted for most of the observed change in this population (consumption of
total fruit items increased by 3 servings/week, while consumption of total fruit and
vegetable items together increased by 3.9 servings/week). Possible reasons for larger
increases in fruit intake include the ready-to-eat convenience of fruit and wider appeal of
fruit to personal tastes and preferences. Cohen et al. (1998) reported that taste
49
preferences and preparation time were important predictors of fruit and vegetable intake
in an adult multiethnic worksite population, and that intakes of cruciferous vegetables
and vegetables rich in vitamins A and C were particularly low.
The two most frequent barriers to consumption reported by participants at
baseline were lack of knowledge that five fruits and vegetables are recommended daily
(76%), and inadequate income to spend on fruits and vegetables (40%). Similarly, in an
observational study of African American public housing residents (Shankar & Klassen,
2001), cost was cited as the primary barrier to fruit and vegetable consumption.
However, in our study, inadequate income did not significantly affect intake of any fruits
and vegetable items at Time 1 or change in fruit and vegetable consumption from Time 1
to Time 2. Cohen et al. (1998) also found no association among the expense barrier and
fruit and vegetable intake in an adult multiethnic worksite population, even though cost is
often highlighted as a barrier to fruit and vegetable consumption in other studies.
Since the cost barrier was reported by almost half of the population we studied,
fresh, frozen, and canned vegetables were promoted equally throughout the series and
were discussed exclusively in one lesson. It has been reported that canned and frozen
vegetables, often less expensive than fresh, offer similar health benefits, although
consumers tend to think that health benefits of fresh produce greatly outweigh those of
their canned and frozen counterparts (NCI, 2000). We also asked participants to consider
the many health benefits of fruits and vegetables relative to cost. A past study reported
that the distribution of coupons improved the affordability of fruits and vegetables in
low-income women (Cohen et al., 1998). Since the intervention, our staff has helped
50
facilitate food stamp application in OANP participants and encouraged participants to use
awards to purchase fruits and vegetables.
Harnack et al. (1998) and Shankar & Klassen (2001) observed that perceived high
cost of fruits and vegetables was more frequent in African Americans than in Caucasians.
In the current study, while African American participants (48%) were also more likely to
report inadequate income than Caucasian participants, they made more positive changes
in mean total fruit and vegetable intake than Caucasian participants from Time 1 to Time
2. In addition to increasing total fruit and vegetable intake, African American
participants reported significantly (p<0.05) higher mean intakes of 100% orange juice;
100% cranberry, apple, or grape juice; cruciferous vegetables, leafy greens, spinach, total
fruit and vegetable items, total fruit items; and total vitamin C-rich fruits and vegetables
at Time 2 than Caucasians.
Another barrier that may have influenced intake was lack of knowledge that five
servings of fruits and vegetables are recommended daily. Knowledge of the
recommendation was low in the total population, and was not related to fruit and
vegetable intake. Further, African American participants in this study tended to be even
less likely than Caucasian participants to report knowledge of the Five a Day
recommendation. Harnack et al. (1998) also reported lower knowledge in African
Americans about the health benefits of fruits and vegetables than Caucasians in a study of
the cancer prevention-related nutrition knowledge, beliefs, and attitudes of U.S. adults.
Correct responses to knowledge of the Five a Day recommendation only increased from
34% to 38% in the total population, but improvement was different among Caucasian and
African American participants. The percentage of African Americans who responded
51
correctly increased from 13% at baseline to 41% post- intervention, while the percentage
of correct responses by Caucasian participants decreased slightly. Because baseline
knowledge of the Five a Day recommendation was lower in African Americans than
Caucasians (13% vs. 39%), African Americans may have been more likely to absorb and
retain new concepts taught in the intervention. A larger overall change in knowledge of
the recommendation may not have been observed due to the lack of short, repetitive
messages in all lessons that link five servings of fruits and vegetables a day directly to
increased health benefits. To further increase knowledge of this recommendation, clear,
concise, and repetitive Five a Day messages have been incorporated into every lesson.
Our findings that African American participants reported a higher frequency of
barriers at baseline, and reported a lower frequency of barriers and higher increases in
mean intakes of fruits and vegetables post- intervention than Caucasian participants are
supported by Ammerman et al. (2002). They reported that minority older adult
populations are often at greatest risk for chronic disease and health problems and tend to
experience more obstacles to adopting dietary change. However, interventions targeted
at individuals with elevated disease risk and a higher prevalence of barriers were reported
to be more effective at achieving goals set forth in dietary interventions than those with
fewer obstacles.
Participants aged 80 and older were more likely than their younger counterparts to
report barriers to fruit and vegetable consumption, including less interest in learning new
vegetable preparation methods and receiving recipe handouts, less belief that improving
eating habits would improve health, less likely to shop for their own groceries, less likely
to plan their meals (p<0.05); and less likely to like the taste of most vegetables, less
52
likely to prepare their own meals, more limitations with kitchen appliances and
cookware, and more likely to have high blood pressure (p=0.05-0.15). It was expected
that older participants would experience more barriers to fruit and vegetable intake.
Several studies have acknowledged a decrease in functional ability and increase in health
problems with age (Drewnowski et al., 2001; Millen et al., 2002; Ponza et al., 1996). In
the current study, at baseline, participants aged 80 and older reported lower mean intakes
of several fruit and vegetable items, did not have significantly higher mean intakes of any
fruit or vegetable item, and reported a greater number of barriers to consumption than
participants younger than 80. However, participants aged 80 and older reported higher
mean increases in four fruit and vegetable items from Time 1 to Time 2 compared to
younger participants, even though most increases were nutritionally small. A possible
explanation is that older participants who experienced more barriers, health problems, or
felt more at risk for health conditions, were more motivated to change behavior (Coulston
et al., 2001; Dittus et al., 1995). This explanation supports the perceived susceptibility
and perceived severity tenets of the Health Belief Model in predicting behavior change.
There were few observed differences in intake among participants who had any of
the five self-reported health conditions, but participants with self-reported heart disease
or heart attacks were more likely to increase intakes of cranberry, apple, or purple grape
juice; and total fruit and vegetable items from Time 1 to Time 2. Perhaps participants
who had experienced heart attacks - an outward, physical, and often frightening
manifestation of a health condition - were more receptive to the health benefits of fruits
and vegetables. This possible phenomenon further supports the perceived severity tenet
of the HBM.
53
The number of medications taken daily had a significant impact on intakes of
several fruit and vegetable measures and summary scores at Time 2, especially fruits and
vegetables high in vitamin C. Studies have shown that over 250 medications negatively
alter the taste of fruits and vegetables (Finkelstein & Schiffman, 1999). In addition, older
adults taking multiple medications often have extensive health problems that may
cognitively and functionally limit their ability to purchase and prepare fruits and
vegetables.
Fifty-one percent of participants were identified as supertasters, and supertasters
reported fewer changes in fruit and vegetable consumption following the intervention.
The percentage of supertasters (51%) seen in this population is approximately twice as
high as estimates of supertaster prevalence in the elderly reported in other studies
(Finkelstein & Schiffman, 1999). Alteration of sensory function is common in the
elderly, and it is unclear to what degree these changes are caused by the normal aging
process, medications, disease states (especially Alzheimer’s), cognitive status, and other
environmental factors (Finkelstein & Schiffman, 1999). Further research is needed to
determine the biochemical mechanisms of and reasons for altered taste acuity in older
adults, which may cause aversion to fruits and vegetables with high amounts of bitter-
tasting phytochemicals.
After the intervention, there was an increase in consumption of total fruit and
vegetable items by 3.9 servings per week, as well as consumption of five of the 31 fruit
and vegetable items assessed: cranberry, apple, or purple grape juice; peaches, nectarines,
and apricots; beans; vegetables consumed as a snack; and canned vegetables.
Additionally, the percentage of participants who reported consuming > 5 servings a day
54
of fruits and vegetables assessed in the intervention increased from 13% to 21%. Havas
et al. (1998) reported that increased consumption of fruits and vegetables by at least 0.5
serving each per day, if maintained, could result in an 8% lower incidence of cancer. Our
results show similar gains, therefore the observed positive increases in intake hold both
promise and challenge for future fruit and vegetable intervention studies in this
population.
There were several limitations in this study. First, the questionnaire used in this
intervention was not validated, although it was adapted from the Block food frequency
questionnaire, a widely used assessment tool. However, other similar FFQs have been
assessed for validity. The Health Habits and History questionnaire, a 36-item FFQ
similar to the Block FFQ, was assessed for validity by Resnicow et al. (2001). Subjects
were 1,000 African American adults from 15 churches in Atlanta. The 36- item FFQ was
found to correlate more closely with serum levels of lycopene, lutein, zeaxanthin,
cryptoxanthin, alpha-carotene, and beta-carotene than a seven-item and two-item
instrument previously used in the population, suggesting that it has merit in fruit and
vegetable interventions. In contrast, the baseline Five a Day survey researchers reported
that their assessment tool, a 33-item fruit and vegetable questionnaire, appeared to
generate inflated estimates of intake (Subar et al., 1994). Possible overestimation is
attributed to cognitive difficulties in recalling consumption frequencies for a lengthy list
of fruits and vegetables. This effect could be amplified or reversed in our population,
where cognitive abilities vary. The second limitation was that attendance was
encouraged but not mandatory. Although participants who were absent received
handouts, they missed hearing important information and key messages on the health

55
benefits of specific fruits and vegetables, which may have negatively impacted change in
intake and behavior. Third, participant responses were self-reported. Studies have
shown that people tend to misreport the amount of fruits and vegetables they are
consuming, so fruit and vegetable intake may have actually been higher or lower than
reported (Thompson et al., 1999; Subar et al., 1994). Fourth, cognitive abilities were not
formally examined in this study. Folstein’s Mini-Mental State Examination or a
comparable assessment would have been useful in determining the prevalence of
cognitive disabilities for data analysis and for curriculum development. All education
materials were evaluated and modified prior to the intervention to account for possible
differences in cognitive abilities. Education level was not assessed; however, the
curriculum was designed using an eighth grade reading level as the mean education level
based on a report by Bracket (1999). Fifth, seasonality may have affected the results of
this study (Ciliska et al., 2001). Although this pilot study was useful in establishing
information about general fruit and vegetable intake patterns, future studies should
address seasonal variation in reported intake. Sixth, the sample size was small and was
composed primarily of women and African Americans. Our findings may not be
applicable to OANP participants with different cultural, ethnic, gender, or age
characteristics. However, our findings can serve as a general guide for future
interventions and evaluations in low-income, low-literacy older adult populations.
Our goal was to facilitate the ability of older Americans to live independently in
the community through dietary practices that will support adequate nutrition and increase
overall health. This study was successful in helping to achieve that goal. Ninety-one
percent of participants rated the program as good, very good, or excellent, supporting the
56
continuation and expansion of this project. It is encouraging that African Americans and
adults aged 80 and older demonstrated increased self-efficacy by making positive
changes in fruit and vegetable intake and behaviors, given that these are identified as
high-risk groups within the older adult population (Millen et al., 2002; Ponza et al.,
1996), and that these groups reported more barriers to fruit and vegetable intake at Time
1 than their Caucasian and younger counterparts. Future studies are needed to explore
the long-term impact of fruit and vegetable educational interventions in the elderly, and
to explore cultural and generation norms in older adults to determine differences in
behaviors and attitudes that may further explain fruit and vegetable consumption patterns.
Also unclear is the extent to which age-related changes in chemosensory function caused
by prescription medications, changes in taste acuity, and other factors interact with
individual barriers, health beliefs, and knowledge to determine fruit and vegetable intake.
The fruit and vegetable nutrition education curriculum is available to other
educators at our website, Nutrition for Older Adults’ Health or NOAHnet:
www.arches.uga.edu/~noahnet. Lesson handouts for participants, scripts for educators,
assessment questionnaires, fruit and vegetable references, and educational extenders
(fruit and vegetable characters) are included in the online curriculum.

57
Acknowledgements This study was funded by the USDA-Food Stamp Nutrition Education Program, Georgia Department of Human Resources, and Northeast Georgia Regional Development Center and Area Agency on Aging.

58
Table 1. Participant Characteristics at Time 1 ( n=54) n % Age
60s 14 26 70s 12 22 80s 23 43 90s 5 9 Mean age 77.9 + 1.2 Gender
Male 7 13 Female 47 87 Ethnicity
Caucasian 23 43 African American 31 57 A52 – A56. Do you have or have you had any of the following diseases or conditions? (% yes)
Cancer 9 17 Heart disease/ heart attack 10 19 Diabetes 19 35 High cholesterol 25 46 Hypertension 31 57
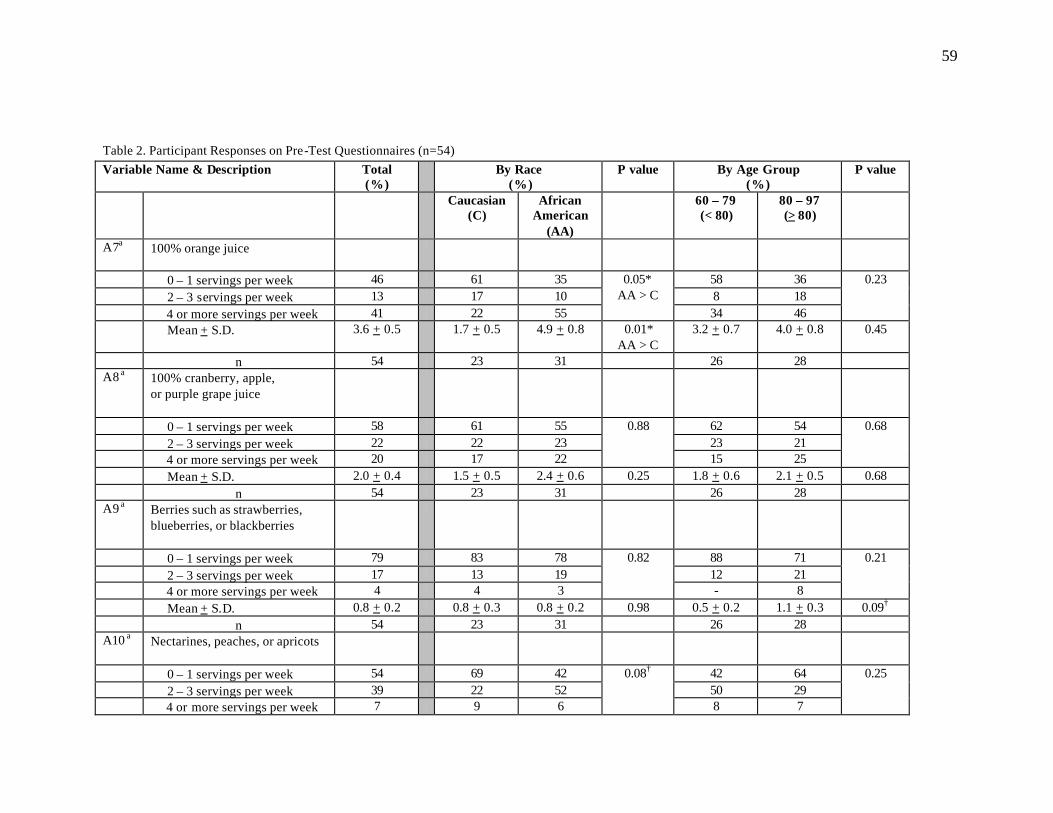
59
Table 2. Participant Responses on Pre-Test Questionnaires (n=54) Variable Name & Description
Total (%)
By Race (%)
P value By Age Group (%)
P value
Caucasian (C)
African American
(AA)
60 – 79 (< 80)
80 – 97 (> 80)
A7a 100% orange juice
0 – 1 servings per week 46 61 35 58 36 2 – 3 servings per week 13 17 10 8 18 4 or more servings per week 41 22 55
0.05* AA > C
34 46
0.23
Mean + S.D. 3.6 + 0.5 1.7 + 0.5 4.9 + 0.8 0.01* AA > C
3.2 + 0.7 4.0 + 0.8 0.45
n 54 23 31 26 28 A8 a 100% cranberry, apple,
or purple grape juice
0 – 1 servings per week 58 61 55 62 54 2 – 3 servings per week 22 22 23 23 21 4 or more servings per week 20 17 22
0.88
15 25
0.68
Mean + S.D. 2.0 + 0.4 1.5 + 0.5 2.4 + 0.6 0.25 1.8 + 0.6 2.1 + 0.5 0.68 n 54 23 31 26 28 A9 a Berries such as strawberries,
blueberries, or blackberries
0 – 1 servings per week 79 83 78 88 71 2 – 3 servings per week 17 13 19 12 21 4 or more servings per week 4 4 3
0.82
- 8
0.21
Mean + S.D. 0.8 + 0.2 0.8 + 0.3 0.8 + 0.2 0.98 0.5 + 0.2 1.1 + 0.3 0.09† n 54 23 31 26 28 A10 a Nectarines, peaches, or apricots
0 – 1 servings per week 54 69 42 42 64 2 – 3 servings per week 39 22 52 50 29 4 or more servings per week 7 9 6
0.08†
8 7
0.25
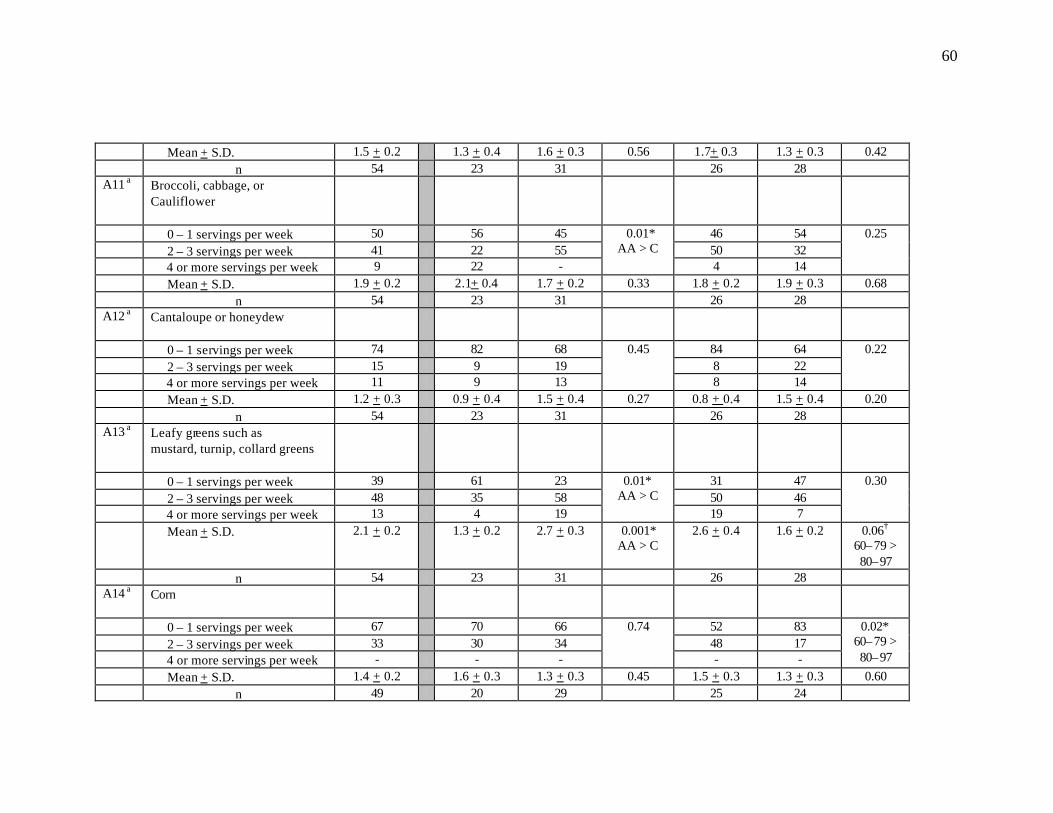
60
Mean + S.D. 1.5 + 0.2 1.3 + 0.4 1.6 + 0.3 0.56 1.7+ 0.3 1.3 + 0.3 0.42 n 54 23 31 26 28 A11 a Broccoli, cabbage, or
Cauliflower
0 – 1 servings per week 50 56 45 46 54 2 – 3 servings per week 41 22 55 50 32 4 or more servings per week 9 22 -
0.01* AA > C
4 14
0.25
Mean + S.D. 1.9 + 0.2 2.1+ 0.4 1.7 + 0.2 0.33 1.8 + 0.2 1.9 + 0.3 0.68 n 54 23 31 26 28 A12 a Cantaloupe or honeydew
0 – 1 servings per week 74 82 68 84 64 2 – 3 servings per week 15 9 19 8 22 4 or more servings per week 11 9 13
0.45
8 14
0.22
Mean + S.D. 1.2 + 0.3 0.9 + 0.4 1.5 + 0.4 0.27 0.8 + 0.4 1.5 + 0.4 0.20 n 54 23 31 26 28 A13 a Leafy greens such as
mustard, turnip, collard greens
0 – 1 servings per week 39 61 23 31 47 2 – 3 servings per week 48 35 58 50 46 4 or more servings per week 13 4 19
0.01* AA > C
19 7
0.30
Mean + S.D. 2.1 + 0.2 1.3 + 0.2 2.7 + 0.3 0.001* AA > C
2.6 + 0.4 1.6 + 0.2 0.06† 60–79 > 80–97
n 54 23 31 26 28 A14 a Corn
0 – 1 servings per week 67 70 66 52 83 2 – 3 servings per week 33 30 34 48 17 4 or more servings per week - - -
0.74
- -
0.02* 60–79 > 80–97
Mean + S.D. 1.4 + 0.2 1.6 + 0.3 1.3 + 0.3 0.45 1.5 + 0.3 1.3 + 0.3 0.60 n 49 20 29 25 24
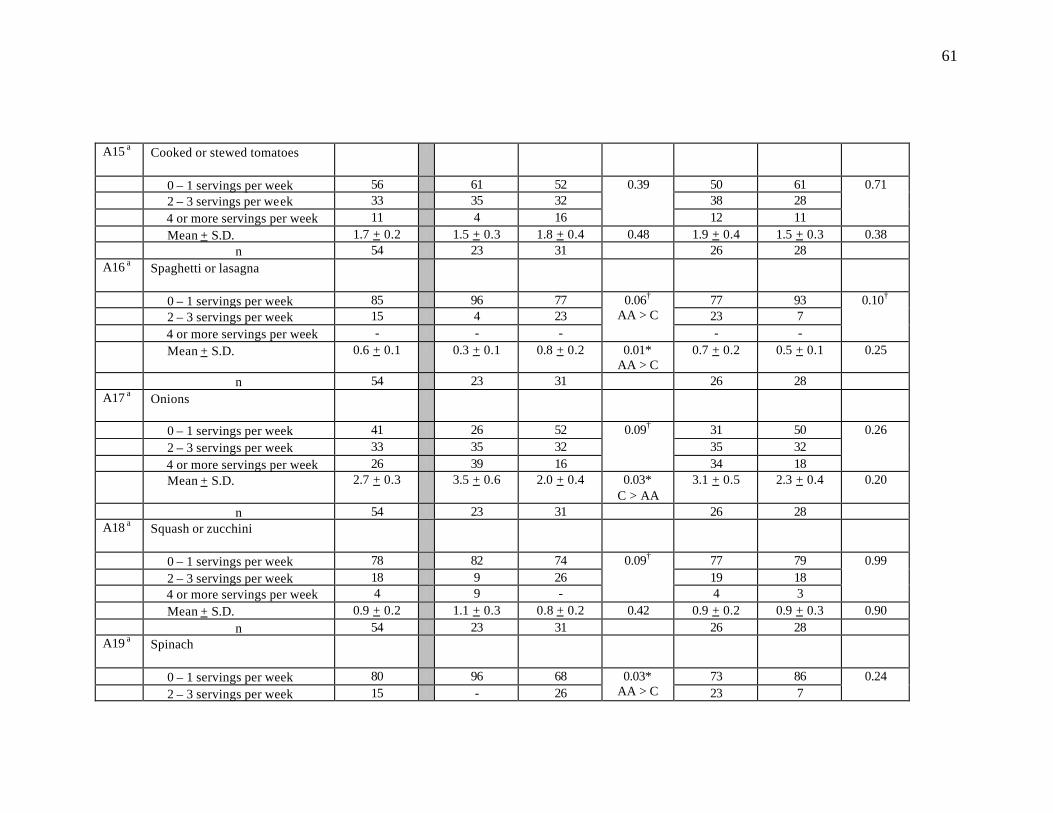
61
A15 a Cooked or stewed tomatoes
0 – 1 servings per week 56 61 52 50 61 2 – 3 servings per week 33 35 32 38 28 4 or more servings per week 11 4 16
0.39
12 11
0.71
Mean + S.D. 1.7 + 0.2 1.5 + 0.3 1.8 + 0.4 0.48 1.9 + 0.4 1.5 + 0.3 0.38 n 54 23 31 26 28 A16 a Spaghetti or lasagna
0 – 1 servings per week 85 96 77 77 93 2 – 3 servings per week 15 4 23 23 7 4 or more servings per week - - -
0.06† AA > C
- -
0.10†
Mean + S.D. 0.6 + 0.1 0.3 + 0.1 0.8 + 0.2 0.01* AA > C
0.7 + 0.2 0.5 + 0.1 0.25
n 54 23 31 26 28 A17 a Onions
0 – 1 servings per week 41 26 52 31 50 2 – 3 servings per week 33 35 32 35 32 4 or more servings per week 26 39 16
0.09†
34 18
0.26
Mean + S.D. 2.7 + 0.3 3.5 + 0.6 2.0 + 0.4 0.03* C > AA
3.1 + 0.5 2.3 + 0.4 0.20
n 54 23 31 26 28 A18 a Squash or zucchini
0 – 1 servings per week 78 82 74 77 79 2 – 3 servings per week 18 9 26 19 18 4 or more servings per week 4 9 -
0.09†
4 3
0.99
Mean + S.D. 0.9 + 0.2 1.1 + 0.3 0.8 + 0.2 0.42 0.9 + 0.2 0.9 + 0.3 0.90 n 54 23 31 26 28 A19 a Spinach
0 – 1 servings per week 80 96 68 73 86 2 – 3 servings per week 15 - 26
0.03* AA > C 23 7
0.24

62
4 or more servings per week 5 4 6 4 7 Mean + S.D. 0.9 + 0.2 0.4 + 0.2 1.2 + 0.3 0.02*
AA > C 0.9 + 0.2 0.9 + 0.3 0.94
n 54 23 31 26 28 A20 a Sweet potatoes or yams
0 – 1 servings per week 64 82 52 62 67 2 – 3 servings per week 32 14 45 38 26 4 or more servings per week 4 4 3
0.053† AA > C
- 7
0.27
Mean + S.D. 1.3 + 0.2 1.0 + 0.2 1.5 + 0.2 0.07† 1.2 + 0.2 1.4 + 0.2 0.56 n 53 22 31 26 27 A21 a Carrots
0 – 1 servings per week 60 56 61 58 61 2 – 3 servings per week 33 35 32 34 32 4 or more servings per week 7 9 7
0.92
8 7
0.97
Mean + S.D. 1.6 + 0.2 1.7 + 0.3 1.5 + 0.3 0.70 1.5 + 0.3 1.6 + 0.3 0.67 n 54 23 31 26 28 A22 a Baked beans, pintos, black-eyed
peas, other beans
0 – 1 servings per week 66 61 71 69 64 2 – 3 servings per week 30 35 26 31 29 4 or more servings per week 4 4 3
0.74
- 7
0.38
Mean + S.D. 1.3 + 0.2 1.5 + 0.3 1.1 + 0.2 0.23 1.2 + 0.2 1.3 + 0.3 0.71 n 54 23 31 26 28 A23 a How often do you eat fruit as a
snack?
0 – 1 servings per week 20 26 16 15 25 2 – 3 servings per week 30 30 29 35 25 4 or more servings per week 50 43 55
0.61
50 50
0.60
Mean + S.D. 4.3 + 0.5 4.0 + 0.7 4.5 + 0.6 0.59 4.7 + 0.7 4.0 + 0.6 0.51 n 54 23 31 26 28
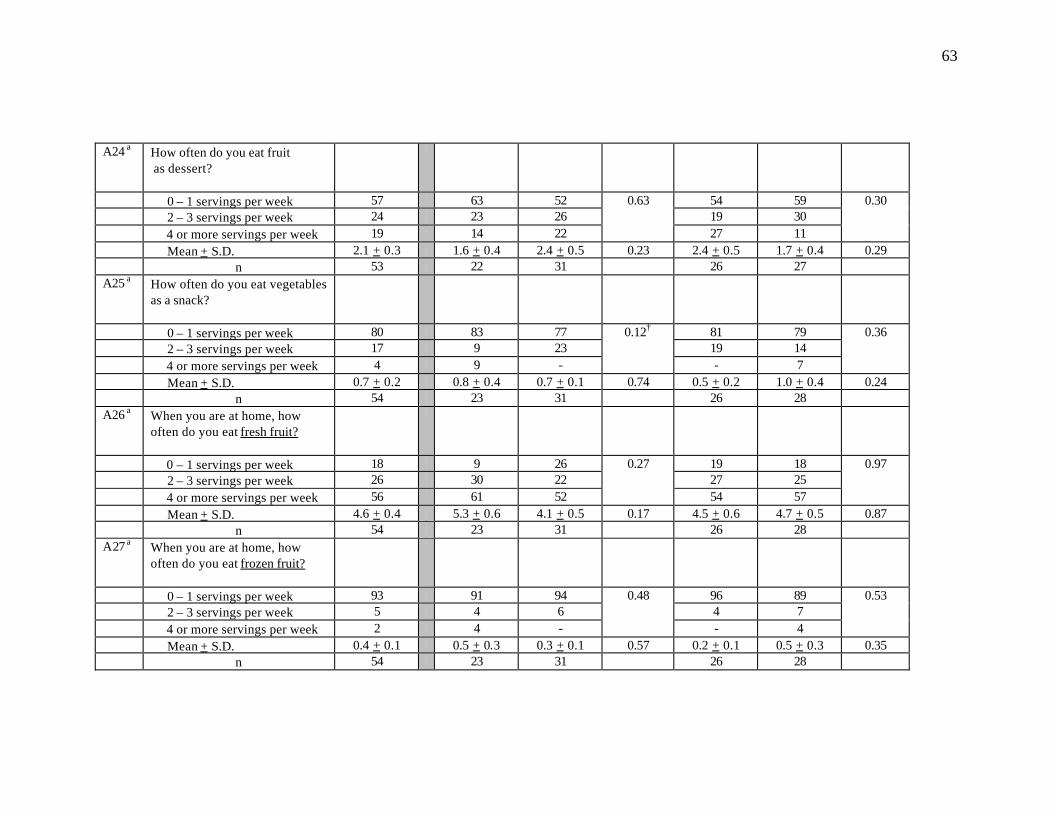
63
A24 a How often do you eat fruit as dessert?
0 – 1 servings per week 57 63 52 54 59 2 – 3 servings per week 24 23 26 19 30 4 or more servings per week 19 14 22
0.63
27 11
0.30
Mean + S.D. 2.1 + 0.3 1.6 + 0.4 2.4 + 0.5 0.23 2.4 + 0.5 1.7 + 0.4 0.29 n 53 22 31 26 27 A25 a How often do you eat vegetables
as a snack?
0 – 1 servings per week 80 83 77 81 79 2 – 3 servings per week 17 9 23 19 14 4 or more servings per week 4 9 -
0.12†
- 7
0.36
Mean + S.D. 0.7 + 0.2 0.8 + 0.4 0.7 + 0.1 0.74 0.5 + 0.2 1.0 + 0.4 0.24 n 54 23 31 26 28 A26 a When you are at home, how
often do you eat fresh fruit?
0 – 1 servings per week 18 9 26 19 18 2 – 3 servings per week 26 30 22 27 25 4 or more servings per week 56 61 52
0.27
54 57
0.97
Mean + S.D. 4.6 + 0.4 5.3 + 0.6 4.1 + 0.5 0.17 4.5 + 0.6 4.7 + 0.5 0.87 n 54 23 31 26 28 A27 a When you are at home, how
often do you eat frozen fruit?
0 – 1 servings per week 93 91 94 96 89 2 – 3 servings per week 5 4 6 4 7 4 or more servings per week 2 4 -
0.48
- 4
0.53
Mean + S.D. 0.4 + 0.1 0.5 + 0.3 0.3 + 0.1 0.57 0.2 + 0.1 0.5 + 0.3 0.35 n 54 23 31 26 28
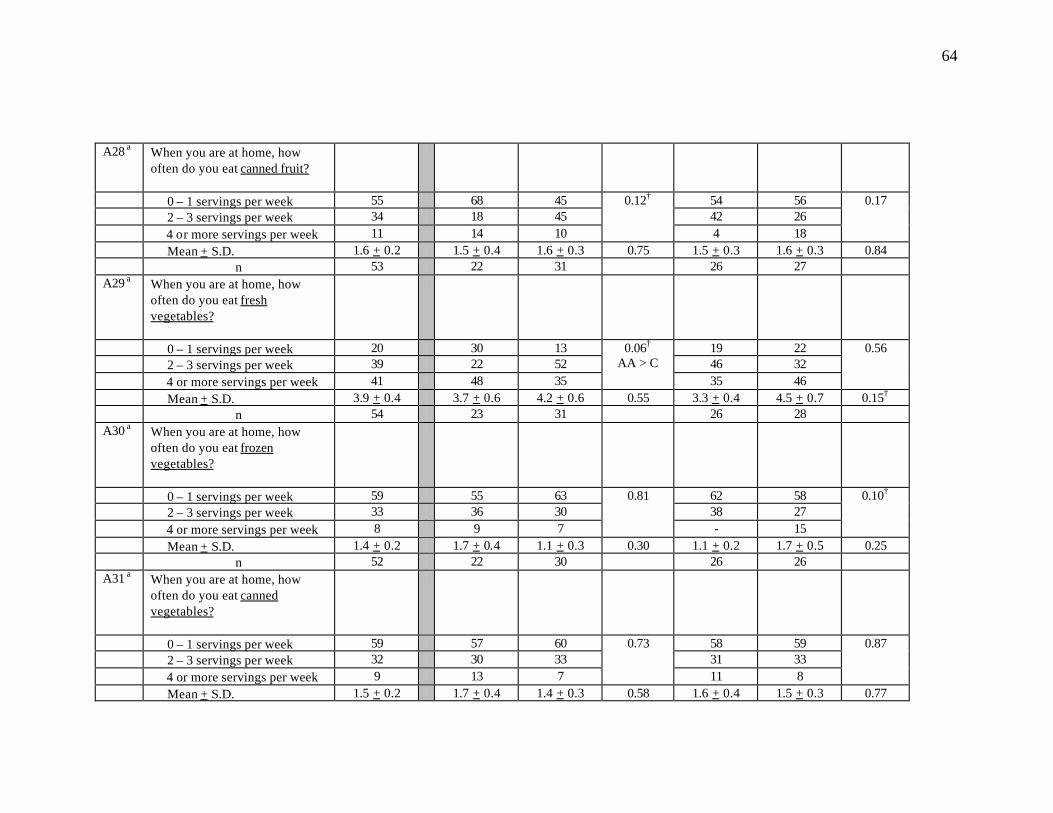
64
A28 a When you are at home, how often do you eat canned fruit?
0 – 1 servings per week 55 68 45 54 56 2 – 3 servings per week 34 18 45 42 26 4 or more servings per week 11 14 10
0.12†
4 18
0.17
Mean + S.D. 1.6 + 0.2 1.5 + 0.4 1.6 + 0.3 0.75 1.5 + 0.3 1.6 + 0.3 0.84 n 53 22 31 26 27 A29 a When you are at home, how
often do you eat fresh vegetables?
0 – 1 servings per week 20 30 13 19 22 2 – 3 servings per week 39 22 52 46 32 4 or more servings per week 41 48 35
0.06† AA > C
35 46
0.56
Mean + S.D. 3.9 + 0.4 3.7 + 0.6 4.2 + 0.6 0.55 3.3 + 0.4 4.5 + 0.7 0.15† n 54 23 31 26 28 A30 a When you are at home, how
often do you eat frozen vegetables?
0 – 1 servings per week 59 55 63 62 58 2 – 3 servings per week 33 36 30 38 27 4 or more servings per week 8 9 7
0.81
- 15
0.10†
Mean + S.D. 1.4 + 0.2 1.7 + 0.4 1.1 + 0.3 0.30 1.1 + 0.2 1.7 + 0.5 0.25 n 52 22 30 26 26 A31 a When you are at home, how
often do you eat canned vegetables?
0 – 1 servings per week 59 57 60 58 59 2 – 3 servings per week 32 30 33 31 33 4 or more servings per week 9 13 7
0.73
11 8
0.87
Mean + S.D. 1.5 + 0.2 1.7 + 0.4 1.4 + 0.3 0.58 1.6 + 0.4 1.5 + 0.3 0.77
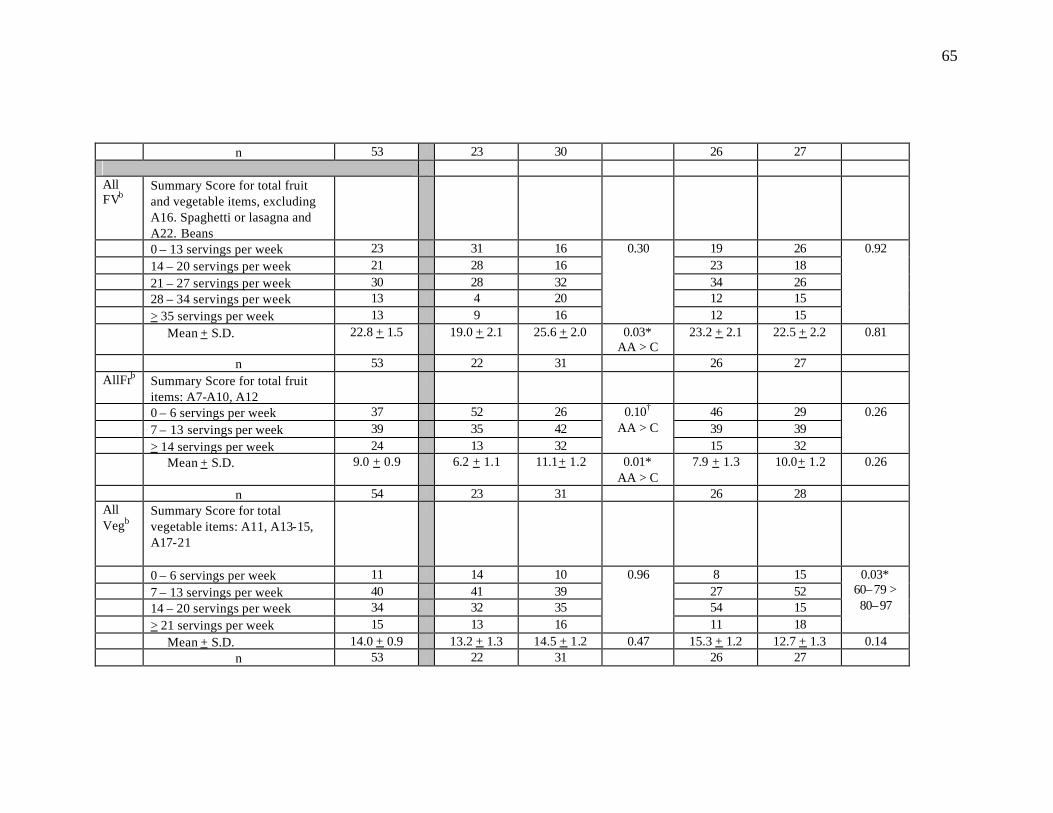
65
n 53 23 30 26 27
All FVb
Summary Score for total fruit and vegetable items, excluding A16. Spaghetti or lasagna and A22. Beans
0 – 13 servings per week 23 31 16 19 26 14 – 20 servings per week 21 28 16 23 18 21 – 27 servings per week 30 28 32 34 26 28 – 34 servings per week 13 4 20 12 15 > 35 servings per week 13 9 16
0.30
12 15
0.92
Mean + S.D. 22.8 + 1.5 19.0 + 2.1 25.6 + 2.0 0.03* AA > C
23.2 + 2.1 22.5 + 2.2 0.81
n 53 22 31 26 27 AllFrb Summary Score for total fruit
items: A7-A10, A12
0 – 6 servings per week 37 52 26 46 29 7 – 13 servings per week 39 35 42 39 39 > 14 servings per week 24 13 32
0.10† AA > C
15 32
0.26
Mean + S.D. 9.0 + 0.9 6.2 + 1.1 11.1+ 1.2 0.01* AA > C
7.9 + 1.3 10.0+ 1.2 0.26
n 54 23 31 26 28 All Vegb
Summary Score for total vegetable items: A11, A13-15, A17-21
0 – 6 servings per week 11 14 10 8 15 7 – 13 servings per week 40 41 39 27 52 14 – 20 servings per week 34 32 35 54 15 > 21 servings per week 15 13 16
0.96
11 18
0.03* 60–79 > 80–97
Mean + S.D. 14.0 + 0.9 13.2 + 1.3 14.5 + 1.2 0.47 15.3 + 1.2 12.7 + 1.3 0.14 n 53 22 31 26 27

66
Hi VitACar
Summary Score for total items high in vitamin A and/or carotenoids: A13, A19, A20, A21
0 – 6 servings per week 68 91 52 62 74 > 7 servings per week 32 9 48
0.001* AA > C 38 26
0.33
Mean + S.D. 5.7 + 0.5 4.0 + 0.6 6.9 + 0.6 0.001* AA > C
6.1 + 0.7 5.3 + 0.7 0.43
n 53 22 31 26 27 HVitACarCru
Summary Score for total items high in vitamin A/carotenoids and cruciferous vegetables:A13, A19, A20, A21, A11
0 – 6 servings per week 55 68 45 46 63 > 7 servings per week 45 32 55
0.10† 54 37
0.22
Mean + S.D. 7.5 + 0.6 6.0 + 0.9 8.6 + 0.7 0.03* AA > C
7.9 + 0.8 7.1 + 0.8 0.53
n 53 22 31 26 27 Hi VitC
Summary Score for total fruit and vegetable items high in vitamin C: A7, A9, A11-13, A15, A20
0 – 6 servings per week 26 45 13 23 30 > 7 servings per week 74 55 87
0.01* AA > C 77 70
0.59
Mean + S.D. 12.2 + 1.0 8.5 + 1.3 14.9 + 1.2 0.001* AA > C
11.9 + 1.3 12.6 + 1.4 0.72
n 53 22 31 26 27 HiLutZea
Summary Score for total items high in lutein and zeaxanthin: A13, A19
< 2 servings per week 54 74 39 0.001* 50 57 0.60
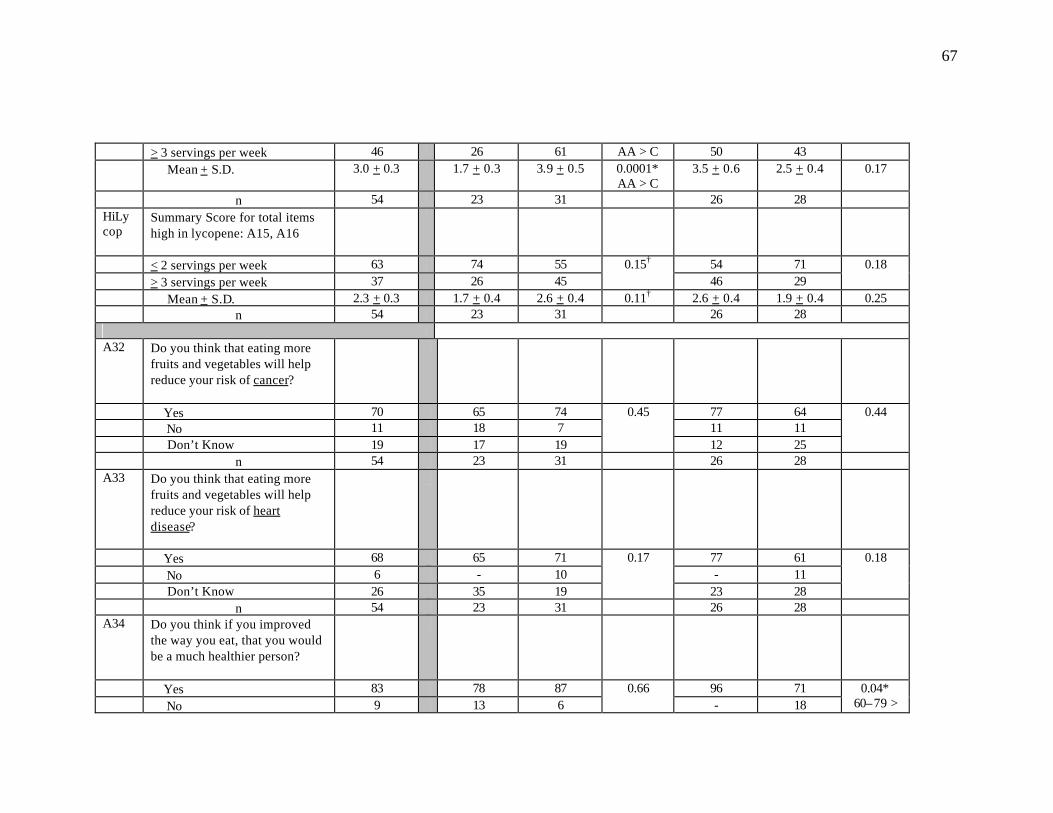
67
> 3 servings per week 46 26 61 AA > C 50 43 Mean + S.D. 3.0 + 0.3 1.7 + 0.3 3.9 + 0.5 0.0001*
AA > C 3.5 + 0.6 2.5 + 0.4 0.17
n 54 23 31 26 28 HiLycop
Summary Score for total items high in lycopene: A15, A16
< 2 servings per week 63 74 55 54 71 > 3 servings per week 37 26 45
0.15† 46 29
0.18
Mean + S.D. 2.3 + 0.3 1.7 + 0.4 2.6 + 0.4 0.11† 2.6 + 0.4 1.9 + 0.4 0.25 n 54 23 31 26 28 A32 Do you think that eating more
fruits and vegetables will help reduce your risk of cancer?
Yes 70 65 74 77 64 No 11 18 7 11 11 Don’t Know 19 17 19
0.45
12 25
0.44
n 54 23 31 26 28 A33 Do you think that eating more
fruits and vegetables will help reduce your risk of heart disease?
Yes 68 65 71 77 61 No 6 - 10 - 11 Don’t Know 26 35 19
0.17
23 28
0.18
n 54 23 31 26 28 A34 Do you think if you improved
the way you eat, that you would be a much healthier person?
Yes 83 78 87 96 71 No 9 13 6
0.66 - 18
0.04* 60–79 >
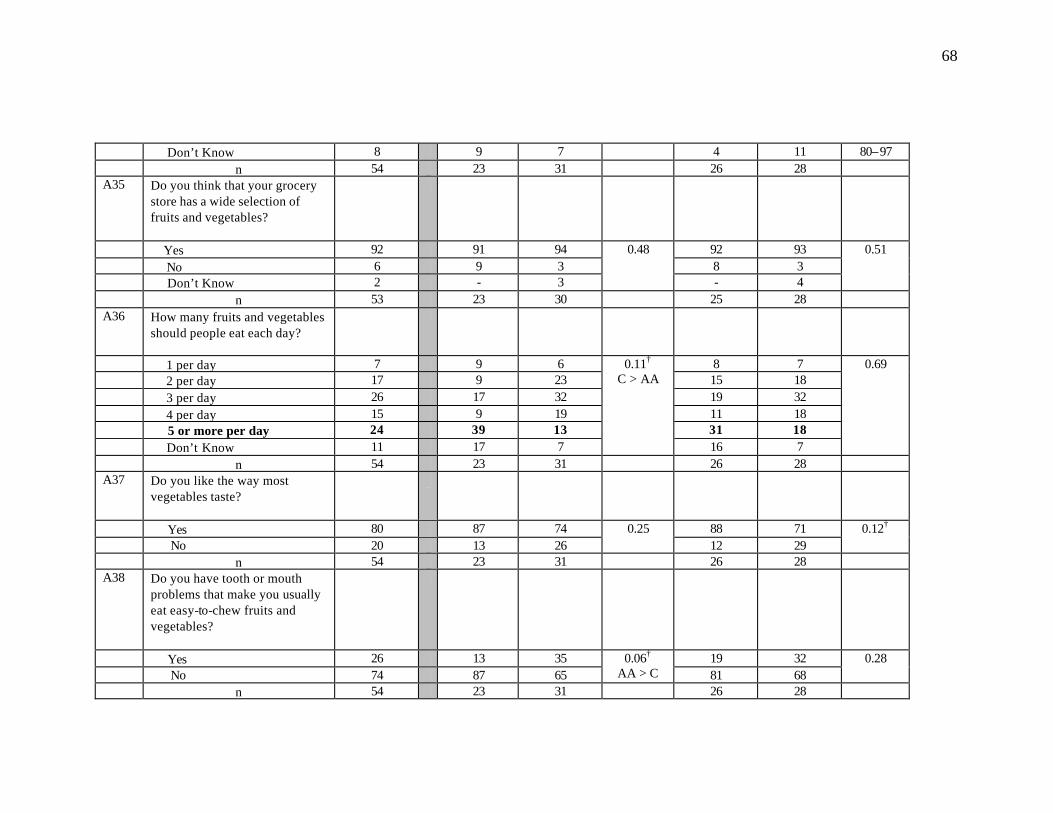
68
Don’t Know 8 9 7 4 11 80–97 n 54 23 31 26 28 A35 Do you think that your grocery
store has a wide selection of fruits and vegetables?
Yes 92 91 94 92 93 No 6 9 3 8 3 Don’t Know 2 - 3
0.48
- 4
0.51
n 53 23 30 25 28 A36 How many fruits and vegetables
should people eat each day?
1 per day 7 9 6 8 7 2 per day 17 9 23 15 18 3 per day 26 17 32 19 32 4 per day 15 9 19 11 18 5 or more per day 24 39 13 31 18 Don’t Know 11 17 7
0.11†
C > AA
16 7
0.69
n 54 23 31 26 28 A37 Do you like the way most
vegetables taste?
Yes 80 87 74 88 71 No 20 13 26
0.25 12 29
0.12†
n 54 23 31 26 28 A38 Do you have tooth or mouth
problems that make you usually eat easy-to-chew fruits and vegetables?
Yes 26 13 35 19 32 No 74 87 65
0.06† AA > C 81 68
0.28
n 54 23 31 26 28
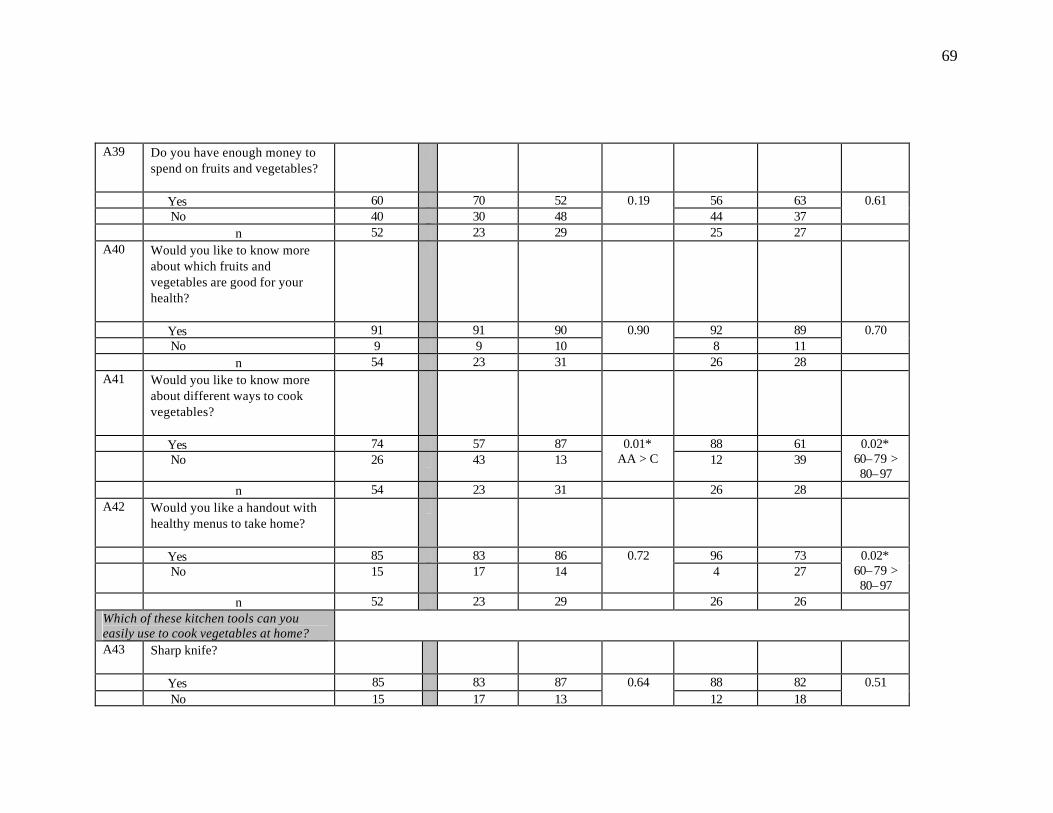
69
A39 Do you have enough money to spend on fruits and vegetables?
Yes 60 70 52 56 63 No 40 30 48
0.19 44 37
0.61
n 52 23 29 25 27 A40 Would you like to know more
about which fruits and vegetables are good for your health?
Yes 91 91 90 92 89 No 9 9 10
0.90 8 11
0.70
n 54 23 31 26 28 A41 Would you like to know more
about different ways to cook vegetables?
Yes 74 57 87 88 61 No 26 43 13
0.01* AA > C 12 39
0.02* 60–79 > 80–97
n 54 23 31 26 28 A42 Would you like a handout with
healthy menus to take home?
Yes 85 83 86 96 73 No 15 17 14
0.72 4 27
0.02* 60–79 > 80–97
n 52 23 29 26 26 Which of these kitchen tools can you easily use to cook vegetables at home?
A43 Sharp knife?
Yes 85 83 87 88 82 No 15 17 13
0.64 12 18
0.51
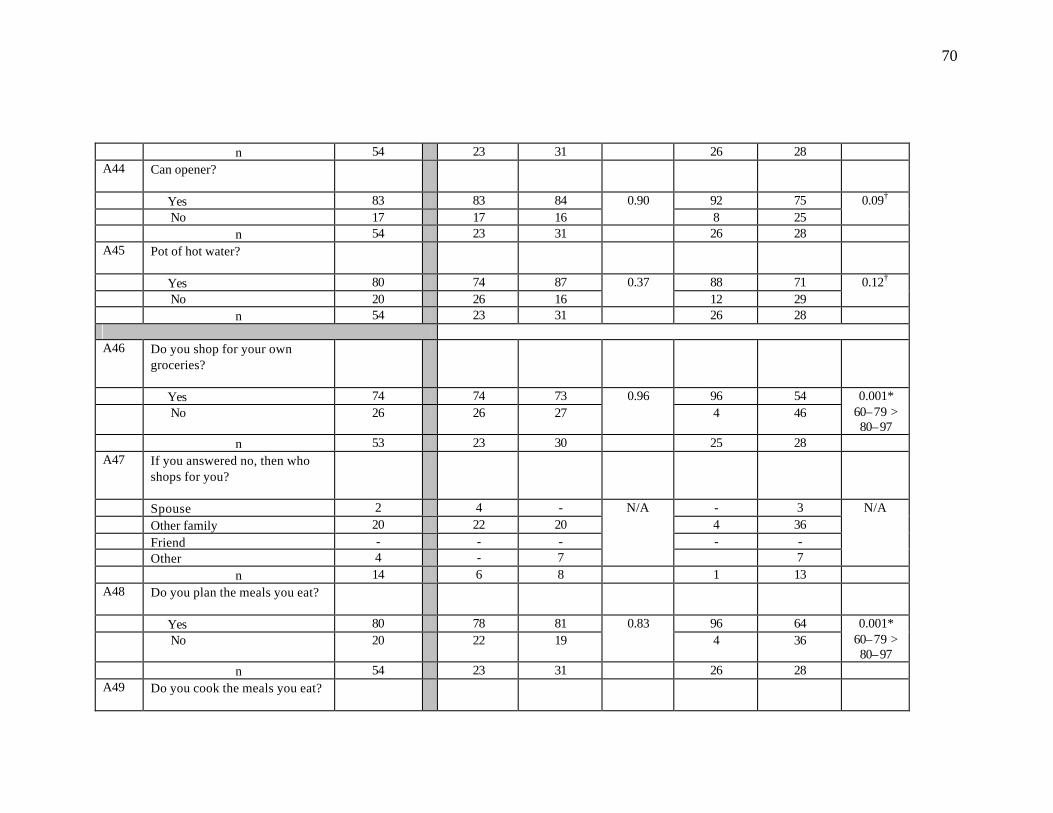
70
n 54 23 31 26 28 A44 Can opener?
Yes 83 83 84 92 75 No 17 17 16
0.90 8 25
0.09†
n 54 23 31 26 28 A45 Pot of hot water?
Yes 80 74 87 88 71 No 20 26 16
0.37 12 29
0.12†
n 54 23 31 26 28
A46 Do you shop for your own groceries?
Yes 74 74 73 96 54 No 26 26 27
0.96 4 46
0.001* 60–79 > 80–97
n 53 23 30 25 28 A47 If you answered no, then who
shops for you?
Spouse 2 4 - - 3 Other family 20 22 20 4 36 Friend - - - - - Other 4 - 7
N/A
7
N/A
n 14 6 8 1 13 A48 Do you plan the meals you eat?
Yes 80 78 81 96 64 No 20 22 19
0.83 4 36
0.001* 60–79 > 80–97
n 54 23 31 26 28 A49 Do you cook the meals you eat?
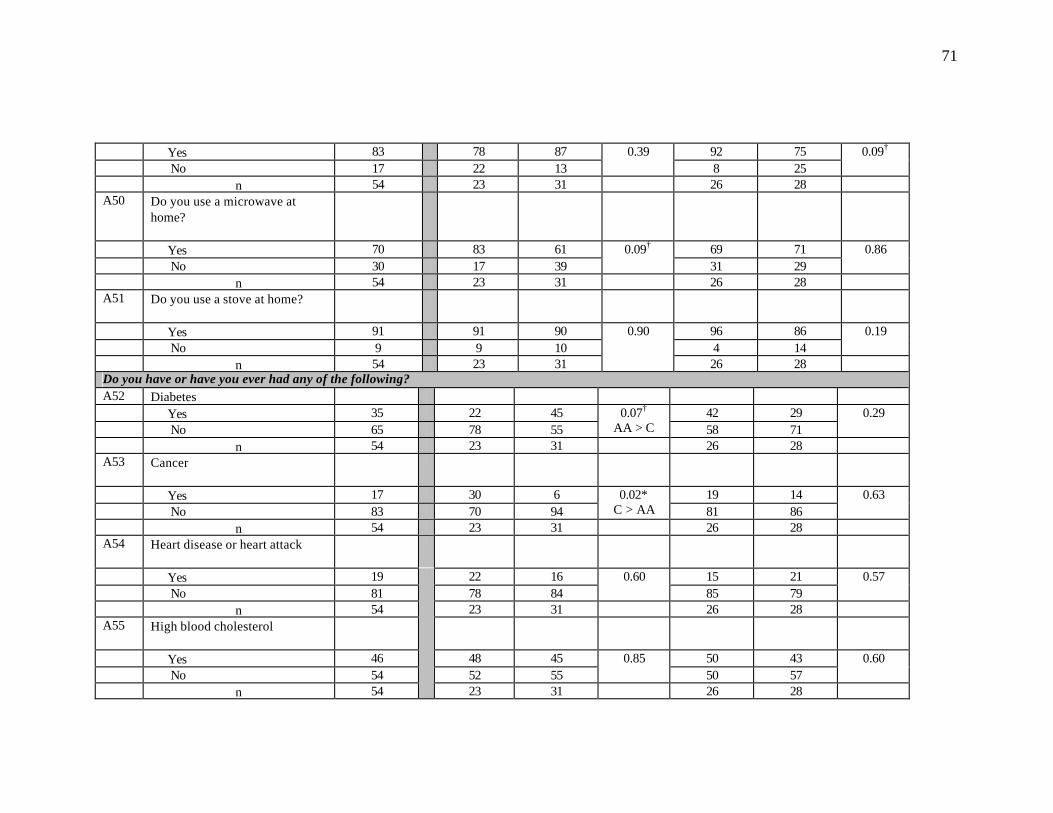
71
Yes 83 78 87 92 75 No 17 22 13
0.39 8 25
0.09†
n 54 23 31 26 28 A50 Do you use a microwave at
home?
Yes 70 83 61 69 71 No 30 17 39
0.09† 31 29
0.86
n 54 23 31 26 28 A51 Do you use a stove at home?
Yes 91 91 90 96 86 No 9 9 10 4 14
0.19
n 54 23 31
0.90
26 28 Do you have or have you ever had any of the following? A52 Diabetes Yes 35 22 45 42 29 No 65 78 55
0.07†
AA > C 58 71 0.29
n 54 23 31 26 28 A53 Cancer
Yes 17 30 6 19 14 No 83 70 94
0.02* C > AA 81 86
0.63
n 54 23 31 26 28 A54 Heart disease or heart attack
Yes 19 22 16 15 21 No 81 78 84
0.60 85 79
0.57
n 54 23 31 26 28 A55 High blood cholesterol
Yes 46 48 45 50 43 No 54 52 55
0.85 50 57
0.60
n 54
23 31 26 28
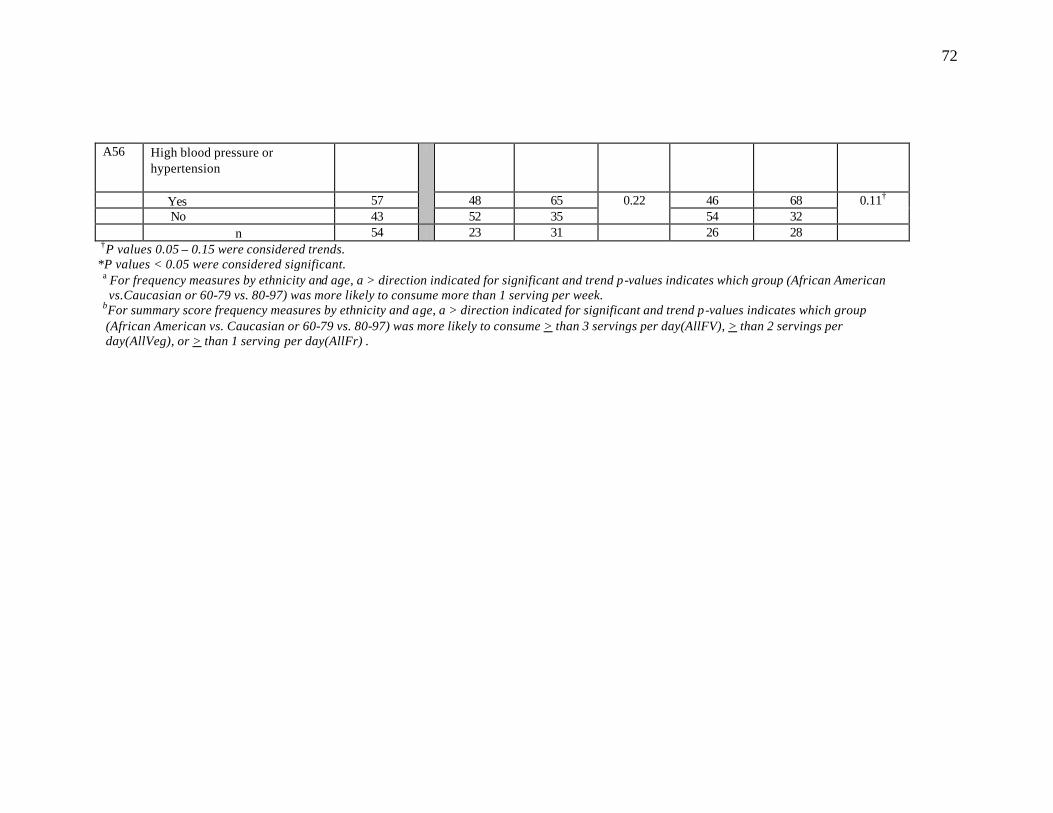
72
A56 High blood pressure or hypertension
Yes 57 48 65 46 68 No 43
52 35 0.22
54 32 0.11†
n 54 23 31 26 28
†P values 0.05 – 0.15 were considered trends. * *P values < 0.05 were considered significant.
a For frequency measures by ethnicity and age, a > direction indicated for significant and trend p-values indicates which group (African American vs.Caucasian or 60-79 vs. 80-97) was more likely to consume more than 1 serving per week. bFor summary score frequency measures by ethnicity and age, a > direction indicated for significant and trend p-values indicates which group (African American vs. Caucasian or 60-79 vs. 80-97) was more likely to consume > than 3 servings per day(AllFV), > than 2 servings per day(AllVeg), or > than 1 serving per day(AllFr) .
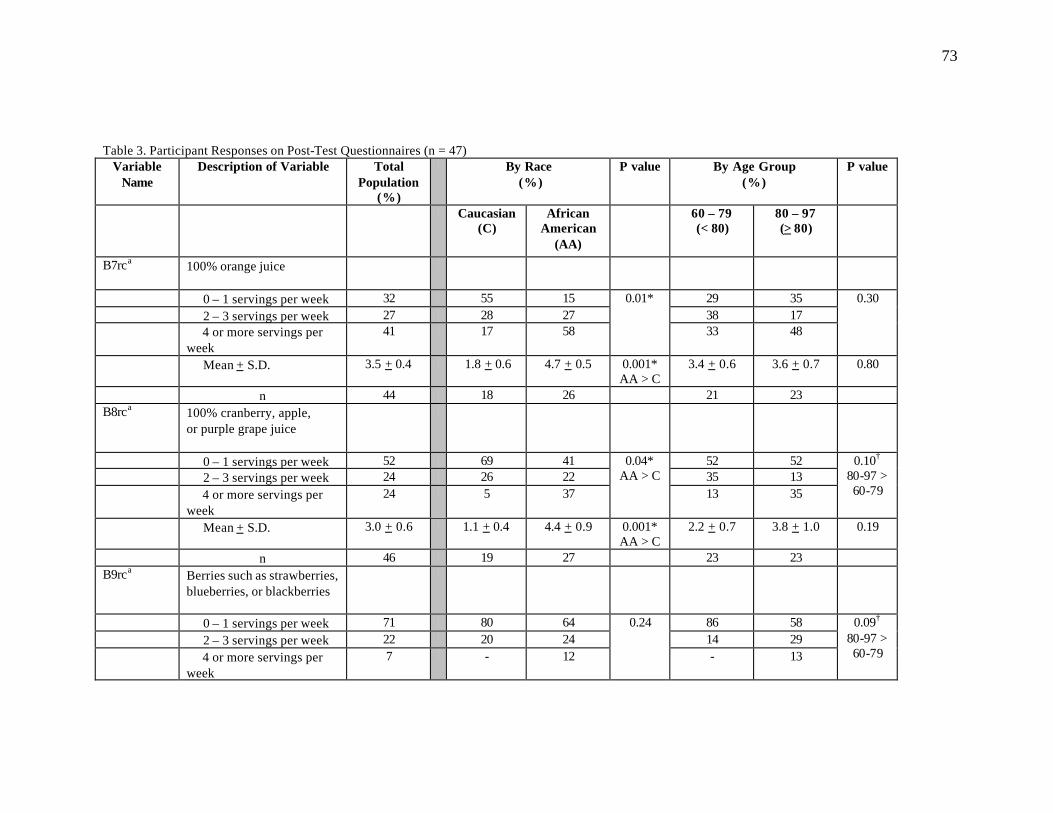
73
Table 3. Participant Responses on Post-Test Questionnaires (n = 47) Variable
Name Description of Variable
Total
Population (%)
By Race (%)
P value By Age Group (%)
P value
Caucasian (C)
African American
(AA)
60 – 79 (< 80)
80 – 97 (> 80)
B7rca 100% orange juice
0 – 1 servings per week 32 55 15 29 35 2 – 3 servings per week 27 28 27 38 17 4 or more servings per
week 41 17 58
0.01*
33 48
0.30
Mean + S.D. 3.5 + 0.4 1.8 + 0.6 4.7 + 0.5 0.001* AA > C
3.4 + 0.6 3.6 + 0.7 0.80
n 44 18 26 21 23 B8rca 100% cranberry, apple,
or purple grape juice
0 – 1 servings per week 52 69 41 52 52 2 – 3 servings per week 24 26 22 35 13 4 or more servings per
week 24 5 37
0.04* AA > C
13 35
0.10†
80-97 > 60-79
Mean + S.D. 3.0 + 0.6 1.1 + 0.4 4.4 + 0.9 0.001* AA > C
2.2 + 0.7 3.8 + 1.0 0.19
n 46 19 27 23 23 B9rca Berries such as strawberries,
blueberries, or blackberries
0 – 1 servings per week 71 80 64 86 58 2 – 3 servings per week 22 20 24 14 29 4 or more servings per
week 7 - 12
0.24
- 13
0.09†
80-97 > 60-79

74
Mean + S.D. 1.1 + 0.3 0.6 + 0.2 1.6 + 0.4 0.04*
AA > C 0.6 + 0.2 1.5 + 0.4 0.08†
80-97 > 60-79
n 45 20 25 21 24 B10rca Nectarines, peaches, or
apricots
0 – 1 servings per week 42 58 31 36 48 2 – 3 servings per week 40 32 46 46 35 4 or more servings per
week 18 10 23
0.18
18 17
0.71
Mean + S.D. 2.2 + 0.3 1.6 + 0.4 2.7 + 0.5 0.08†
AA > C 2.1 + 0.4 2.3 + 0.5 0.80
n 45 19 26 22 23 B11rca Broccoli, cabbage, or
Cauliflower
0 – 1 servings per week 50 70 35 44 57 2 – 3 servings per week 39 25 50 52 26 4 or more servings per
week 11 5 15
0.06†
AA > C 4 17
0.12†
60-79 > 80-97
Mean + S.D. 1.8 + 0.2 1.3 + 0.2 2.2 + 0.4 0.04* AA > C
1.7 + 0.2 1.9 + 0.4 0.64
n 46 20 26 23 23 B12rca Cantaloupe or honeydew
0 – 1 servings per week 61 65 58 65 57 2 – 3 servings per week 30 30 31 22 39 4 or more servings per
week 9 5 11
0.72
13 4
0.32
Mean + S.D. 1.6 + 0.3 1.4 + 0.4 1.8 + 0.4 0.46 1.8 + 0.5 1.3 + 0.3 0.41 n 46 20 26 23 23

75
B13rca Leafy greens such as mustard, turnip, collard greens
0 – 1 servings per week 50 63 41 36 63 2 – 3 servings per week 46 37 52 59 33 4 or more servings per
week 4 - 7
0.21
5 4
0.20
Mean + S.D. 1.7 + 0.2 1.1 + 0.2 2.0 + 0.3 0.02*
AA > C 2.0 + 0.3 1.4 + 0.3 0.19
n 46 19 27 22 24 B14rca Corn
0 – 1 servings per week 66 65 59 61 62 2 – 3 servings per week 34 35 41 39 38 4 or more servings per
week - - -
0.69
- -
0.91
Mean + S.D. 1.4 + 0.2 1.4 + 0.4 1.4 + 0.3 0.99 1.4 + 0.3 1.4 + 0.3 0.90 n 47 20 27 23 24 B15rca Cooked or stewed tomatoes
0 – 1 servings per week 52 60 46 45 58 2 – 3 servings per week 35 30 39 41 29 4 or more servings per
week 13 10 15
0.64
14 13
0.66
Mean + S.D. 1.9 + 0.3 1.5 + 0.3 2.2 + 0.5 0.18 1.9 + 0.4 1.9 + 0.4 0.98 n 46 20 26 22 24 B16rca Spaghetti or lasagna
0 – 1 servings per week 73 90 58 76 70 2 – 3 servings per week 27 10 42 24 30 4 or more servings per
week - - -
0.02* AA > C
- -
0.62
Mean + S.D. 0.7 + 0.1 0.4 + 0.2 0.9 + 0.2 0.09† AA > C
0.6 + 0.2 0.7 + 0.2 0.56
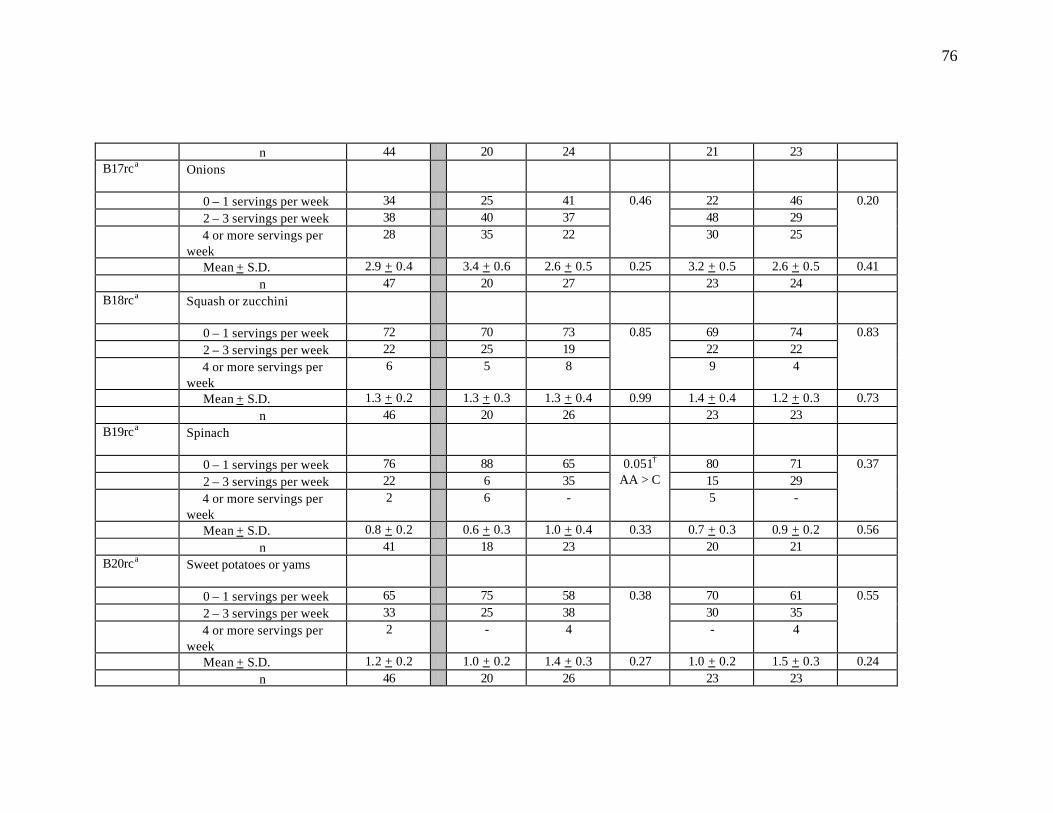
76
n 44 20 24 21 23 B17rca Onions
0 – 1 servings per week 34 25 41 22 46 2 – 3 servings per week 38 40 37 48 29 4 or more servings per
week 28 35 22
0.46
30 25
0.20
Mean + S.D. 2.9 + 0.4 3.4 + 0.6 2.6 + 0.5 0.25 3.2 + 0.5 2.6 + 0.5 0.41 n 47 20 27 23 24 B18rca Squash or zucchini
0 – 1 servings per week 72 70 73 69 74 2 – 3 servings per week 22 25 19 22 22 4 or more servings per
week 6 5 8
0.85
9 4
0.83
Mean + S.D. 1.3 + 0.2 1.3 + 0.3 1.3 + 0.4 0.99 1.4 + 0.4 1.2 + 0.3 0.73 n 46 20 26 23 23 B19rca Spinach
0 – 1 servings per week 76 88 65 80 71 2 – 3 servings per week 22 6 35 15 29 4 or more servings per
week 2 6 -
0.051† AA > C
5 -
0.37
Mean + S.D. 0.8 + 0.2 0.6 + 0.3 1.0 + 0.4 0.33 0.7 + 0.3 0.9 + 0.2 0.56 n 41 18 23 20 21 B20rca Sweet potatoes or yams
0 – 1 servings per week 65 75 58 70 61 2 – 3 servings per week 33 25 38 30 35 4 or more servings per
week 2 - 4
0.38
- 4
0.55
Mean + S.D. 1.2 + 0.2 1.0 + 0.2 1.4 + 0.3 0.27 1.0 + 0.2 1.5 + 0.3 0.24 n 46 20 26 23 23
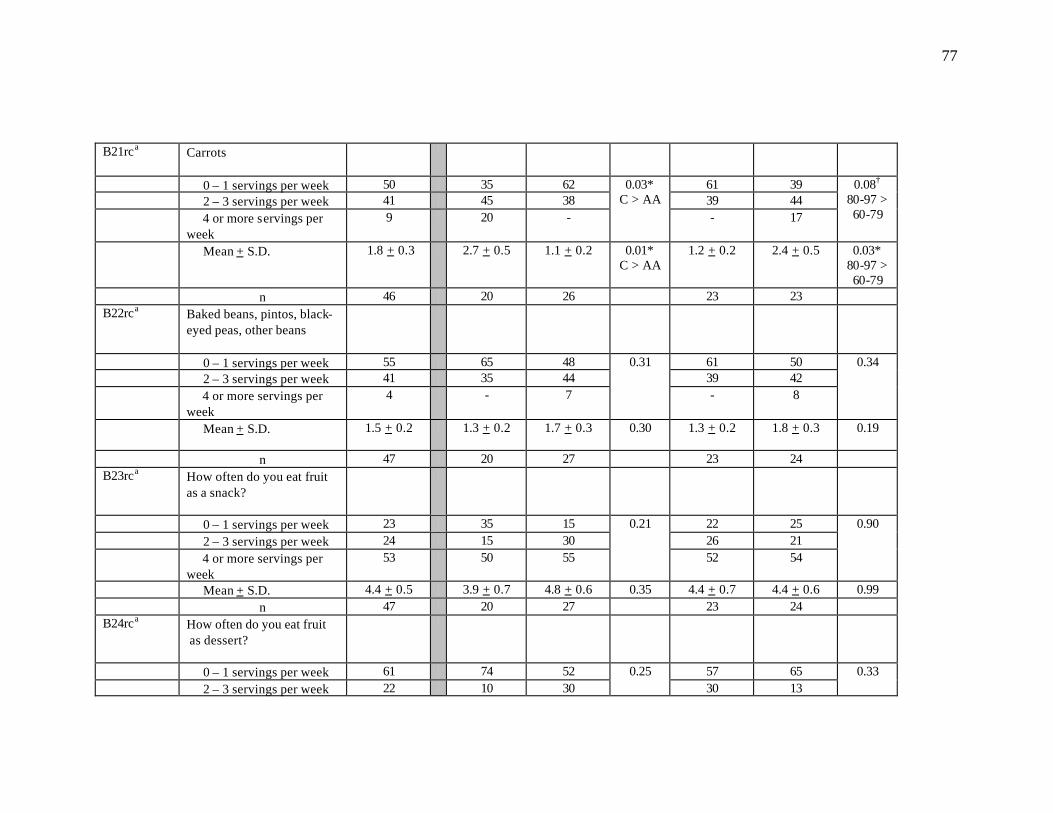
77
B21rca Carrots
0 – 1 servings per week 50 35 62 61 39 2 – 3 servings per week 41 45 38 39 44 4 or more servings per
week 9 20 -
0.03* C > AA
- 17
0.08†
80-97 > 60-79
Mean + S.D. 1.8 + 0.3 2.7 + 0.5 1.1 + 0.2 0.01* C > AA
1.2 + 0.2 2.4 + 0.5 0.03* 80-97 > 60-79
n 46 20 26 23 23 B22rca Baked beans, pintos, black-
eyed peas, other beans
0 – 1 servings per week 55 65 48 61 50 2 – 3 servings per week 41 35 44 39 42 4 or more servings per
week 4 - 7
0.31
- 8
0.34
Mean + S.D. 1.5 + 0.2 1.3 + 0.2 1.7 + 0.3 0.30
1.3 + 0.2 1.8 + 0.3 0.19
n 47 20 27 23 24 B23rca How often do you eat fruit
as a snack?
0 – 1 servings per week 23 35 15 22 25 2 – 3 servings per week 24 15 30 26 21 4 or more servings per
week 53 50 55
0.21
52 54
0.90
Mean + S.D. 4.4 + 0.5 3.9 + 0.7 4.8 + 0.6 0.35 4.4 + 0.7 4.4 + 0.6 0.99 n 47 20 27 23 24 B24rca How often do you eat fruit
as dessert?
0 – 1 servings per week 61 74 52 57 65 2 – 3 servings per week 22 10 30
0.25 30 13
0.33
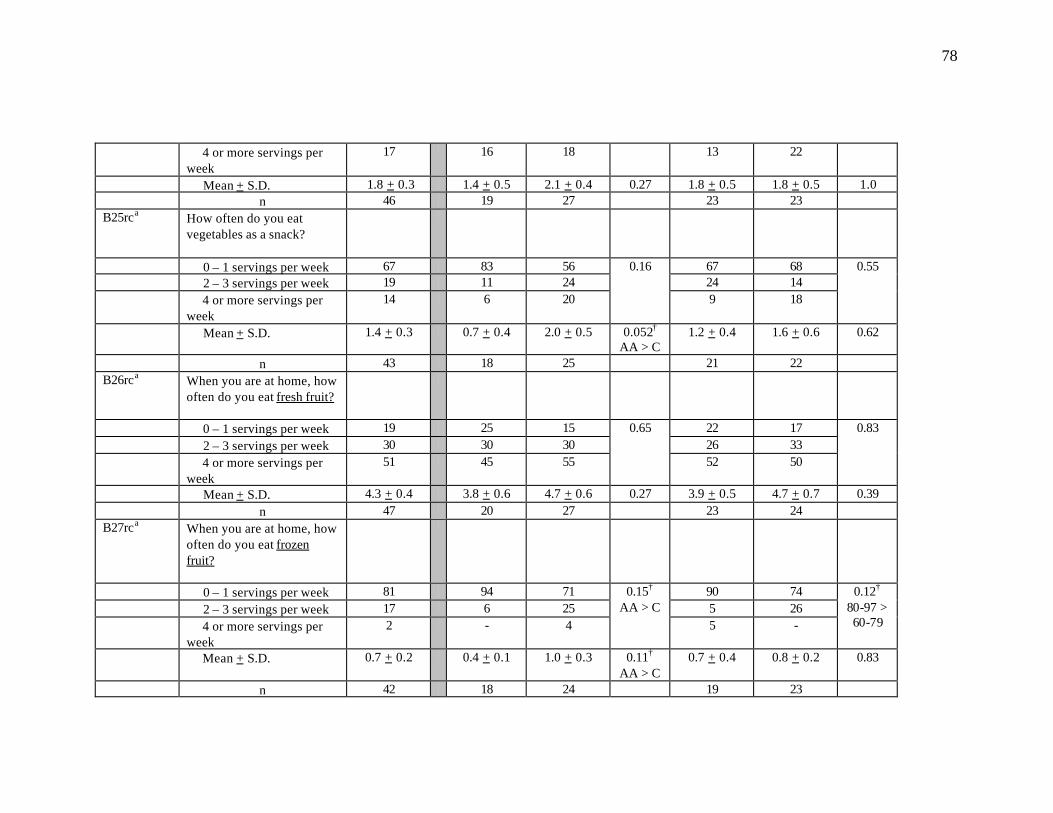
78
4 or more servings per week
17 16 18 13 22
Mean + S.D. 1.8 + 0.3 1.4 + 0.5 2.1 + 0.4 0.27 1.8 + 0.5 1.8 + 0.5 1.0 n 46 19 27 23 23 B25rca How often do you eat
vegetables as a snack?
0 – 1 servings per week 67 83 56 67 68 2 – 3 servings per week 19 11 24 24 14 4 or more servings per
week 14 6 20
0.16
9 18
0.55
Mean + S.D. 1.4 + 0.3 0.7 + 0.4 2.0 + 0.5 0.052† AA > C
1.2 + 0.4 1.6 + 0.6 0.62
n 43 18 25 21 22 B26rca When you are at home, how
often do you eat fresh fruit?
0 – 1 servings per week 19 25 15 22 17 2 – 3 servings per week 30 30 30 26 33 4 or more servings per
week 51 45 55
0.65
52 50
0.83
Mean + S.D. 4.3 + 0.4 3.8 + 0.6 4.7 + 0.6 0.27 3.9 + 0.5 4.7 + 0.7 0.39 n 47 20 27 23 24 B27rca When you are at home, how
often do you eat frozen fruit?
0 – 1 servings per week 81 94 71 90 74 2 – 3 servings per week 17 6 25 5 26 4 or more servings per
week 2 - 4
0.15†
AA > C 5 -
0.12†
80-97 > 60-79
Mean + S.D. 0.7 + 0.2 0.4 + 0.1 1.0 + 0.3 0.11† AA > C
0.7 + 0.4 0.8 + 0.2 0.83
n 42 18 24 19 23

79
B28rca When you are at home, how often do you eat canned fruit?
0 – 1 servings per week 42 55 33 39 46 2 – 3 servings per week 47 30 59 57 37 4 or more servings per
week 11 15 8
0.14†
AA > C 4 17
0.26
Mean + S.D. 2.0 + 0.4 1.8 + 0.5 2.2 + 0.5 0.55 1.6 + 0.2 2.5 + 0.6 0.23 n 47 20 27 23 24 B29rca When you are at home, how
often do you eat fresh vegetables?
0 – 1 servings per week 26 40 15 22 29 2 – 3 servings per week 40 35 44 35 46 4 or more servings per
week 34 25 41
0.14†
AA > C 43 25
0.41
Mean + S.D. 3.7 + 0.5 2.9 + 0.6 4.3 + 0.7 0.12†
AA > C 4.6 + 0.8 2.8 + 0.5 0.07
n 47 20 27 23 24 B30rca When you are at home, how
often do you eat frozen vegetables?
0 – 1 servings per week 60 67 55 55 65 2 – 3 servings per week 27 22 30 36 17 4 or more servings per
week 13 11 15
0.76
9 18
0.31
Mean + S.D. 1.8 + 0.3 1.4 + 0.5 2.0 + 0.5 0.47 1.8 + 0.4 1.7 + 0.5 0.96 n 45 18 27 22 23 B31rca When you are at home, how
often do you eat canned vegetables?
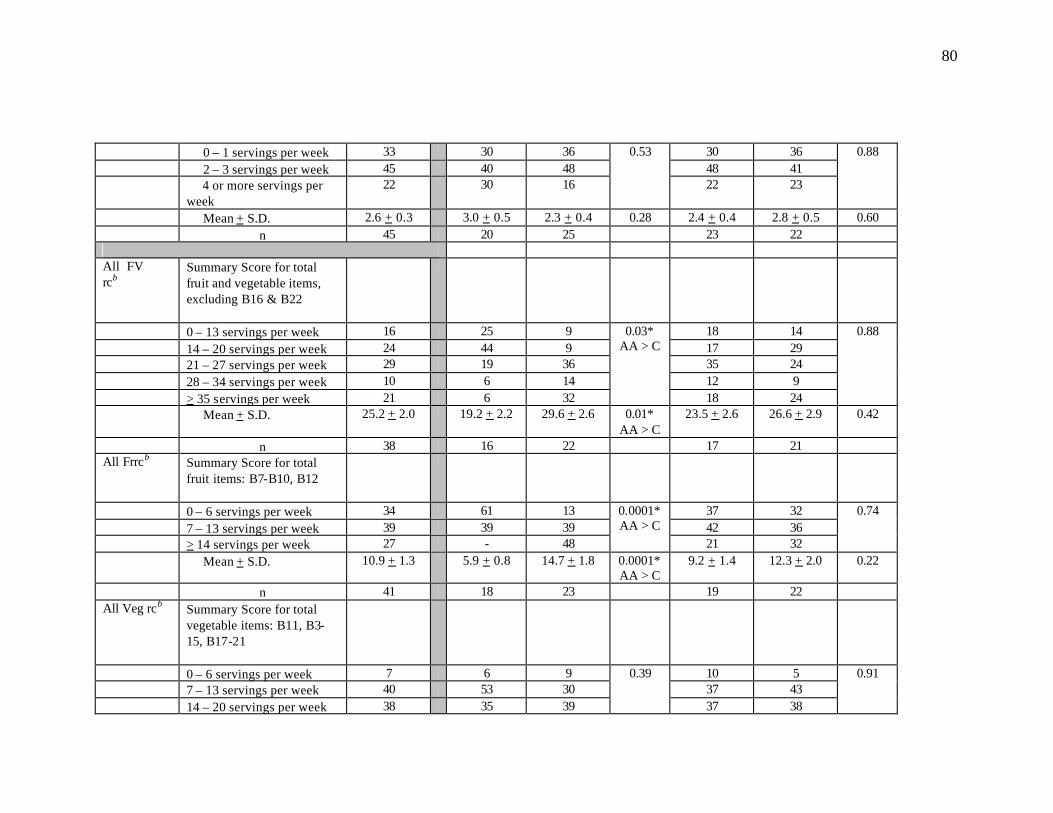
80
0 – 1 servings per week 33 30 36 30 36 2 – 3 servings per week 45 40 48 48 41 4 or more servings per
week 22 30 16
0.53
22 23
0.88
Mean + S.D. 2.6 + 0.3 3.0 + 0.5 2.3 + 0.4 0.28 2.4 + 0.4 2.8 + 0.5 0.60 n 45 20 25 23 22 All FV rcb
Summary Score for total fruit and vegetable items, excluding B16 & B22
0 – 13 servings per week 16 25 9 18 14 14 – 20 servings per week 24 44 9 17 29 21 – 27 servings per week 29 19 36 35 24 28 – 34 servings per week 10 6 14 12 9 > 35 servings per week 21 6 32
0.03* AA > C
18 24
0.88
Mean + S.D. 25.2 + 2.0 19.2 + 2.2 29.6 + 2.6 0.01* AA > C
23.5 + 2.6 26.6 + 2.9 0.42
n 38 16 22 17 21 All Frrcb Summary Score for total
fruit items: B7-B10, B12
0 – 6 servings per week 34 61 13 37 32 7 – 13 servings per week 39 39 39 42 36 > 14 servings per week 27 - 48
0.0001* AA > C
21 32
0.74
Mean + S.D. 10.9 + 1.3 5.9 + 0.8 14.7 + 1.8 0.0001* AA > C
9.2 + 1.4 12.3 + 2.0 0.22
n 41 18 23 19 22 All Veg rcb Summary Score for total
vegetable items: B11, B3-15, B17-21
0 – 6 servings per week 7 6 9 10 5 7 – 13 servings per week 40 53 30 37 43 14 – 20 servings per week 38 35 39
0.39
37 38
0.91
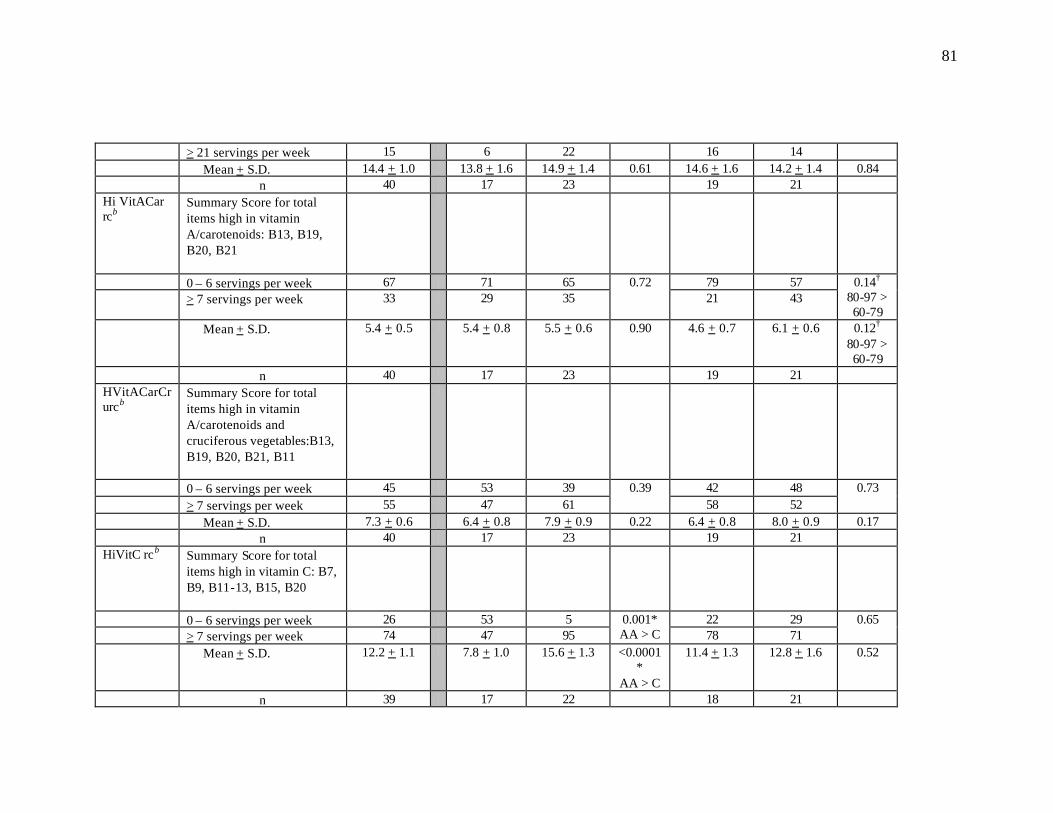
81
> 21 servings per week 15 6 22 16 14 Mean + S.D. 14.4 + 1.0 13.8 + 1.6 14.9 + 1.4 0.61 14.6 + 1.6 14.2 + 1.4 0.84 n 40 17 23 19 21 Hi VitACar rcb
Summary Score for total items high in vitamin A/carotenoids: B13, B19, B20, B21
0 – 6 servings per week 67 71 65 79 57 > 7 servings per week 33 29 35
0.72 21 43
0.14†
80-97 > 60-79
Mean + S.D. 5.4 + 0.5 5.4 + 0.8 5.5 + 0.6 0.90 4.6 + 0.7 6.1 + 0.6 0.12†
80-97 > 60-79
n 40 17 23 19 21 HVitACarCrurcb
Summary Score for total items high in vitamin A/carotenoids and cruciferous vegetables:B13, B19, B20, B21, B11
0 – 6 servings per week 45 53 39 42 48 > 7 servings per week 55 47 61
0.39 58 52
0.73
Mean + S.D. 7.3 + 0.6 6.4 + 0.8 7.9 + 0.9 0.22 6.4 + 0.8 8.0 + 0.9 0.17 n 40 17 23 19 21 HiVitC rcb Summary Score for total
items high in vitamin C: B7, B9, B11-13, B15, B20
0 – 6 servings per week 26 53 5 22 29 > 7 servings per week 74 47 95
0.001* AA > C 78 71
0.65
Mean + S.D. 12.2 + 1.1 7.8 + 1.0 15.6 + 1.3 <0.0001*
AA > C
11.4 + 1.3 12.8 + 1.6 0.52
n 39 17 22 18 21
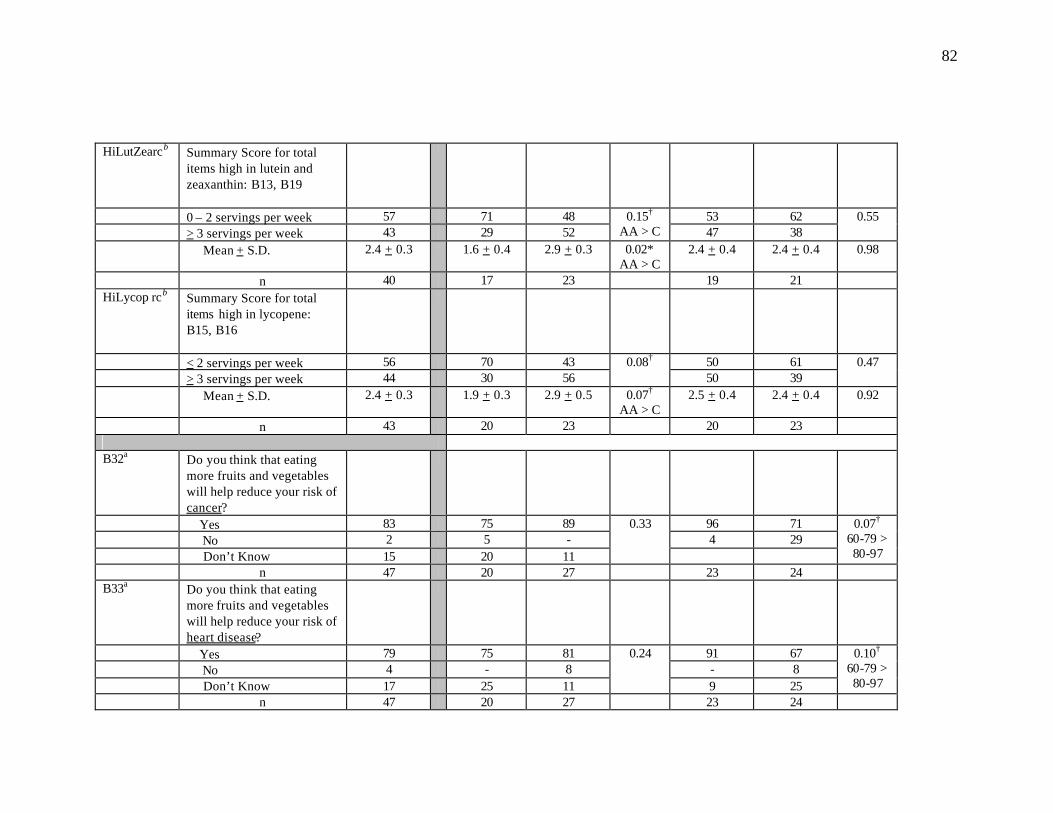
82
HiLutZearcb Summary Score for total items high in lutein and zeaxanthin: B13, B19
0 – 2 servings per week 57 71 48 53 62 > 3 servings per week 43 29 52
0.15†
AA > C 47 38 0.55
Mean + S.D. 2.4 + 0.3 1.6 + 0.4 2.9 + 0.3 0.02* AA > C
2.4 + 0.4 2.4 + 0.4 0.98
n 40 17 23 19 21 HiLycop rcb Summary Score for total
items high in lycopene: B15, B16
< 2 servings per week 56 70 43 50 61 > 3 servings per week 44 30 56
0.08† 50 39
0.47
Mean + S.D. 2.4 + 0.3 1.9 + 0.3 2.9 + 0.5 0.07†
AA > C 2.5 + 0.4 2.4 + 0.4 0.92
n 43 20 23 20 23 B32a Do you think that eating
more fruits and vegetables will help reduce your risk of cancer?
Yes 83 75 89 96 71 No 2 5 - 4 29 Don’t Know 15 20 11
0.33
0.07†
60-79 > 80-97
n 47 20 27 23 24 B33a Do you think that eating
more fruits and vegetables will help reduce your risk of heart disease?
Yes 79 75 81 91 67 No 4 - 8 - 8 Don’t Know 17 25 11
0.24
9 25
0.10† 60-79 > 80-97
n 47 20 27 23 24
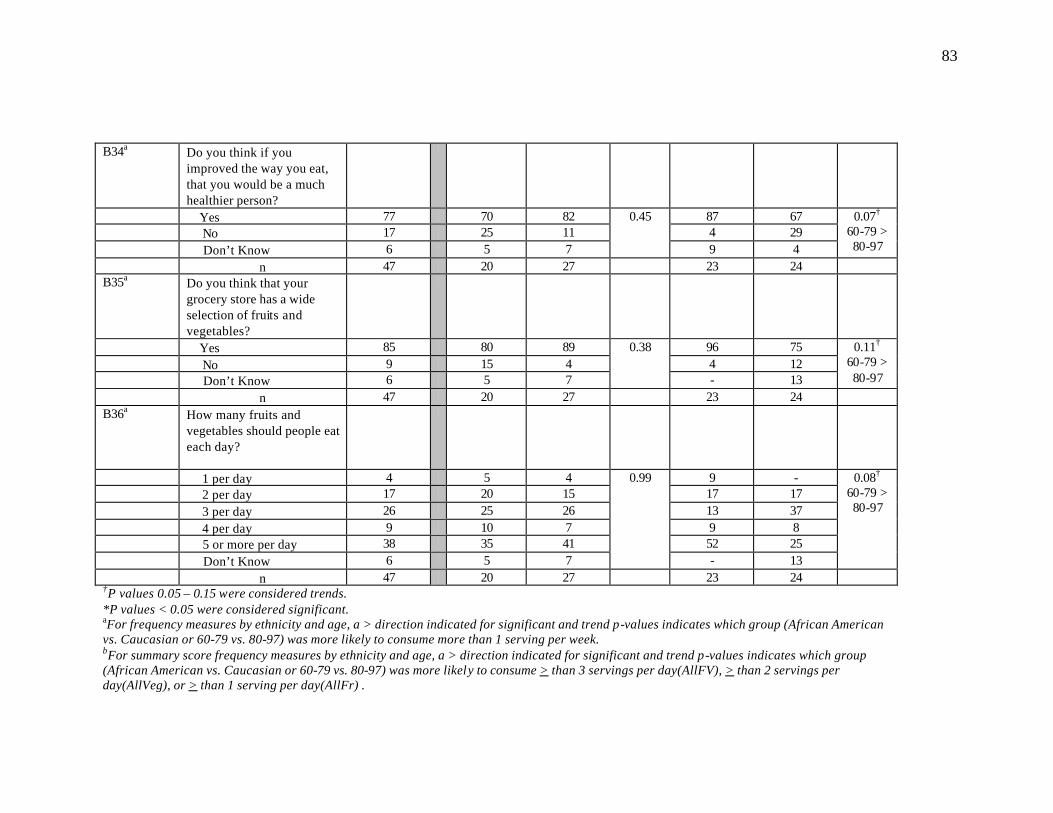
83
B34a Do you think if you improved the way you eat, that you would be a much healthier person?
Yes 77 70 82 87 67 No 17 25 11 4 29 Don’t Know 6 5 7
0.45
9 4
0.07† 60-79 > 80-97
n 47 20 27 23 24 B35a Do you think that your
grocery store has a wide selection of fruits and vegetables?
Yes 85 80 89 96 75 No 9 15 4 4 12 Don’t Know 6 5 7
0.38
- 13
0.11†
60-79 > 80-97
n 47 20 27 23 24 B36a How many fruits and
vegetables should people eat each day?
1 per day 4 5 4 9 - 2 per day 17 20 15 17 17 3 per day 26 25 26 13 37 4 per day 9 10 7 9 8 5 or more per day 38 35 41 52 25 Don’t Know 6 5 7
0.99
- 13
0.08†
60-79 > 80-97
n 47 20 27 23 24 †P values 0.05 – 0.15 were considered trends. *P values < 0.05 were considered significant. aFor frequency measures by ethnicity and age, a > direction indicated for significant and trend p-values indicates which group (African American vs. Caucasian or 60-79 vs. 80-97) was more likely to consume more than 1 serving per week. bFor summary score frequency measures by ethnicity and age, a > direction indicated for significant and trend p-values indicates which group (African American vs. Caucasian or 60-79 vs. 80-97) was more likely to consume > than 3 servings per day(AllFV), > than 2 servings per day(AllVeg), or > than 1 serving per day(AllFr) .
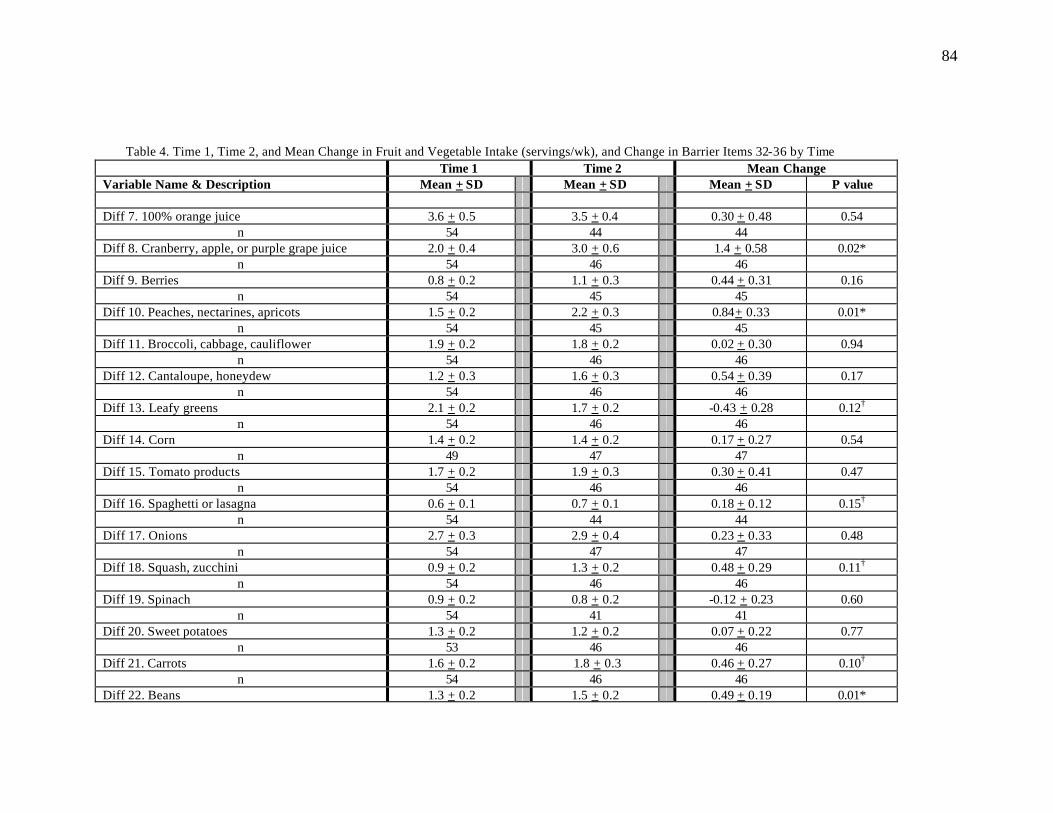
84
Table 4. Time 1, Time 2, and Mean Change in Fruit and Vegetable Intake (servings/wk), and Change in Barrier Items 32-36 by Time
Time 1 Time 2 Mean Change Variable Name & Description Mean + SD Mean + SD Mean + SD P value
Diff 7. 100% orange juice 3.6 + 0.5 3.5 + 0.4 0.30 + 0.48 0.54
n 54 44 44 Diff 8. Cranberry, apple, or purple grape juice 2.0 + 0.4 3.0 + 0.6 1.4 + 0.58 0.02*
n 54 46 46 Diff 9. Berries 0.8 + 0.2 1.1 + 0.3 0.44 + 0.31 0.16
n 54 45 45 Diff 10. Peaches, nectarines, apricots 1.5 + 0.2 2.2 + 0.3 0.84+ 0.33 0.01*
n 54 45 45 Diff 11. Broccoli, cabbage, cauliflower 1.9 + 0.2 1.8 + 0.2 0.02 + 0.30 0.94
n 54 46 46 Diff 12. Cantaloupe, honeydew 1.2 + 0.3 1.6 + 0.3 0.54 + 0.39 0.17
n 54 46 46 Diff 13. Leafy greens 2.1 + 0.2 1.7 + 0.2 -0.43 + 0.28 0.12†
n 54 46 46 Diff 14. Corn 1.4 + 0.2 1.4 + 0.2 0.17 + 0.27 0.54
n 49 47 47 Diff 15. Tomato products 1.7 + 0.2 1.9 + 0.3 0.30 + 0.41 0.47
n 54 46 46 Diff 16. Spaghetti or lasagna 0.6 + 0.1 0.7 + 0.1 0.18 + 0.12 0.15†
n 54 44 44 Diff 17. Onions 2.7 + 0.3 2.9 + 0.4 0.23 + 0.33 0.48
n 54 47 47 Diff 18. Squash, zucchini 0.9 + 0.2 1.3 + 0.2 0.48 + 0.29 0.11†
n 54 46 46 Diff 19. Spinach 0.9 + 0.2 0.8 + 0.2 -0.12 + 0.23 0.60
n 54 41 41 Diff 20. Sweet potatoes 1.3 + 0.2 1.2 + 0.2 0.07 + 0.22 0.77
n 53 46 46 Diff 21. Carrots 1.6 + 0.2 1.8 + 0.3 0.46 + 0.27 0.10†
n 54 46 46 Diff 22. Beans 1.3 + 0.2 1.5 + 0.2 0.49 + 0.19 0.01*
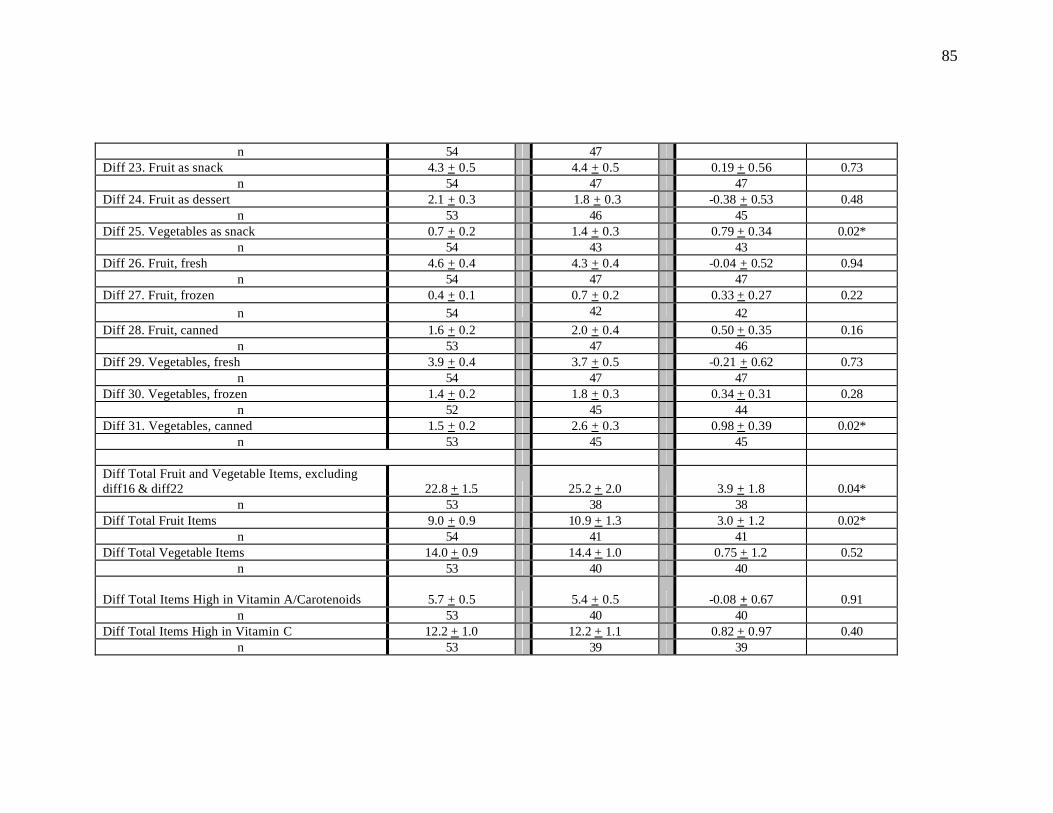
85
n 54 47 Diff 23. Fruit as snack 4.3 + 0.5 4.4 + 0.5 0.19 + 0.56 0.73
n 54 47 47 Diff 24. Fruit as dessert 2.1 + 0.3 1.8 + 0.3 -0.38 + 0.53 0.48
n 53 46 45 Diff 25. Vegetables as snack 0.7 + 0.2 1.4 + 0.3 0.79 + 0.34 0.02*
n 54 43 43 Diff 26. Fruit, fresh 4.6 + 0.4 4.3 + 0.4 -0.04 + 0.52 0.94
n 54 47 47 Diff 27. Fruit, frozen 0.4 + 0.1 0.7 + 0.2 0.33 + 0.27 0.22
n 54 42 42 Diff 28. Fruit, canned 1.6 + 0.2 2.0 + 0.4 0.50 + 0.35 0.16
n 53 47 46 Diff 29. Vegetables, fresh 3.9 + 0.4 3.7 + 0.5 -0.21 + 0.62 0.73
n 54 47 47 Diff 30. Vegetables, frozen 1.4 + 0.2 1.8 + 0.3 0.34 + 0.31 0.28
n 52 45 44 Diff 31. Vegetables, canned 1.5 + 0.2 2.6 + 0.3 0.98 + 0.39 0.02*
n 53 45 45
Diff Total Fruit and Vegetable Items, excluding diff16 & diff22 22.8 + 1.5
25.2 + 2.0 3.9 + 1.8 0.04*
n 53 38 38 Diff Total Fruit Items 9.0 + 0.9 10.9 + 1.3 3.0 + 1.2 0.02*
n 54 41 41 Diff Total Vegetable Items 14.0 + 0.9 14.4 + 1.0 0.75 + 1.2 0.52
n 53 40 40
Diff Total Items High in Vitamin A/Carotenoids 5.7 + 0.5
5.4 + 0.5 -0.08 + 0.67 0.91 n 53 40 40
Diff Total Items High in Vitamin C 12.2 + 1.0 12.2 + 1.1 0.82 + 0.97 0.40 n 53 39 39
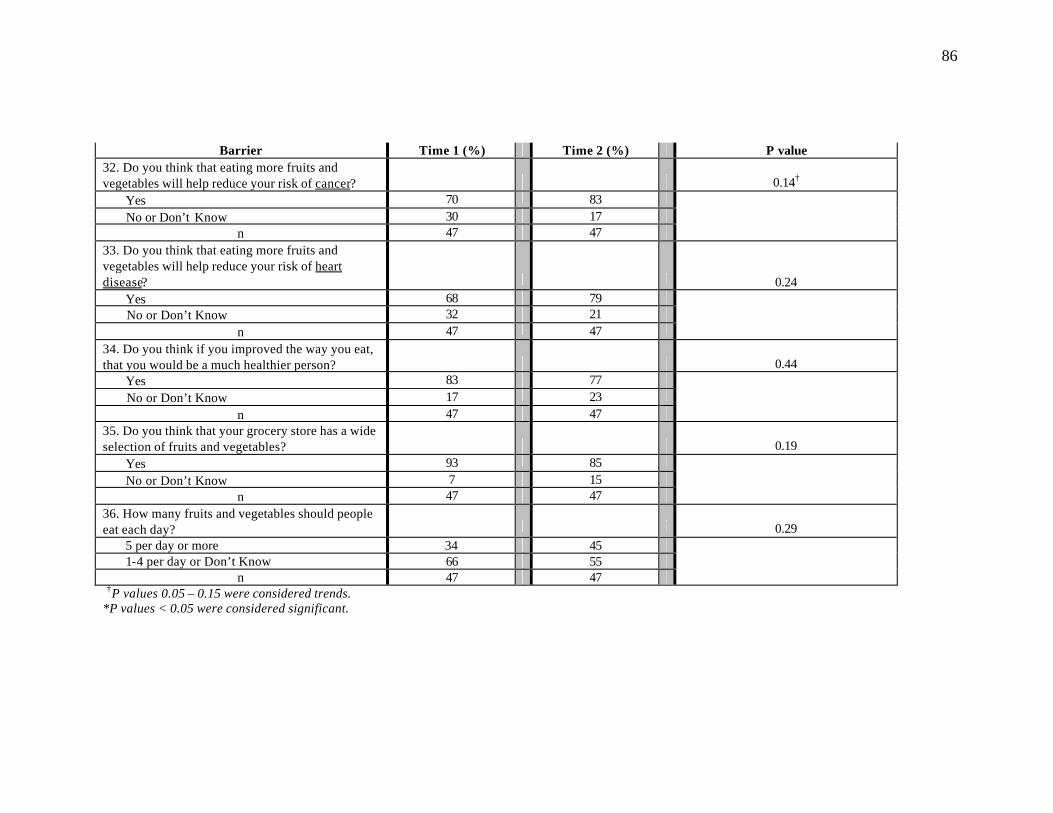
86
Barrier Time 1 (%) Time 2 (%) P value 32. Do you think that eating more fruits and vegetables will help reduce your risk of cancer?
0.14†
Yes 70 83 No or Don’t Know 30 17
n 47 47 33. Do you think that eating more fruits and vegetables will help reduce your risk of heart disease?
0.24 Yes 68 79 No or Don’t Know 32 21
n 47 47 34. Do you think if you improved the way you eat, that you would be a much healthier person?
0.44
Yes 83 77 No or Don’t Know 17 23
n 47 47 35. Do you think that your grocery store has a wide selection of fruits and vegetables?
0.19
Yes 93 85 No or Don’t Know 7 15
n 47 47 36. How many fruits and vegetables should people eat each day?
0.29
5 per day or more 34 45 1-4 per day or Don’t Know 66 55
n 47 47 †P values 0.05 – 0.15 were considered trends. *P values < 0.05 were considered significant.
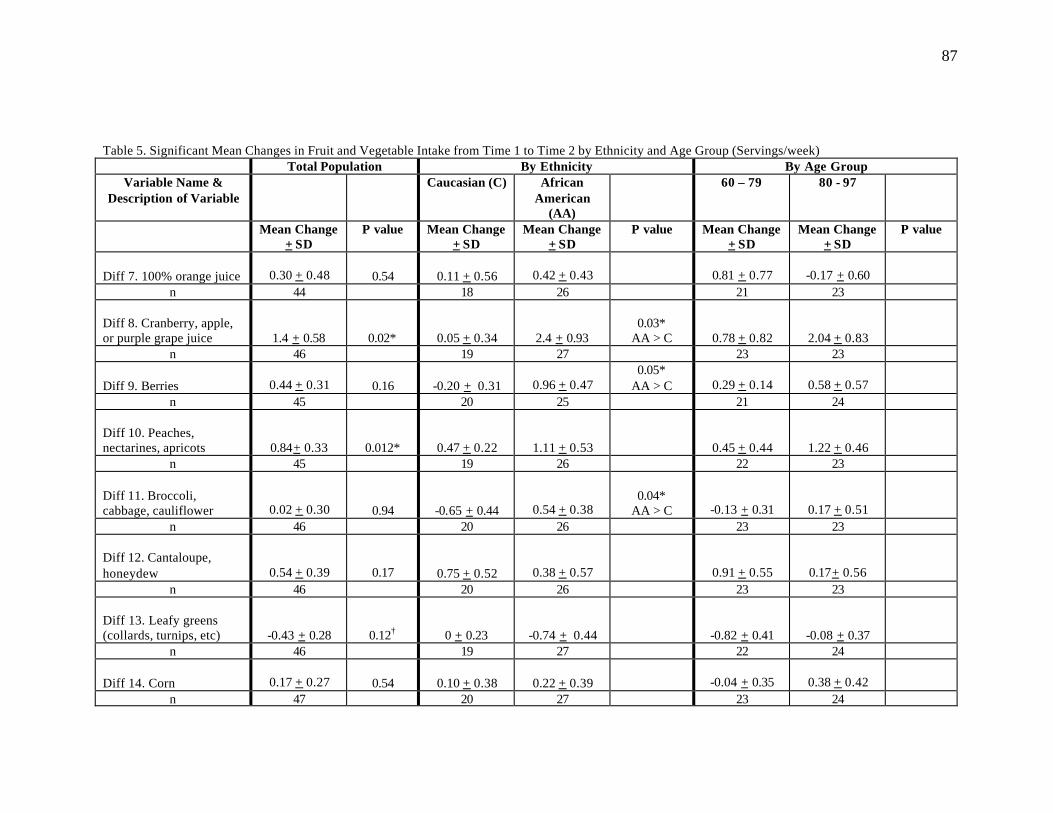
87
Table 5. Significant Mean Changes in Fruit and Vegetable Intake from Time 1 to Time 2 by Ethnicity and Age Group (Servings/week) Total Population By Ethnicity By Age Group
Variable Name & Description of Variable
Caucasian (C) African American
(AA)
60 – 79 80 - 97
Mean Change + SD
P value
Mean Change + SD
Mean Change + SD
P value
Mean Change + SD
Mean Change + SD
P value
Diff 7. 100% orange juice 0.30 + 0.48
0.54
0.11 + 0.56 0.42 + 0.43 0.81 + 0.77 -0.17 + 0.60
n 44 18 26 21 23 Diff 8. Cranberry, apple, or purple grape juice 1.4 + 0.58
0.02*
0.05 + 0.34 2.4 + 0.93
0.03* AA > C 0.78 + 0.82 2.04 + 0.83
n 46 19 27 23 23 Diff 9. Berries 0.44 + 0.31
0.16
-0.20 + 0.31 0.96 + 0.47
0.05* AA > C 0.29 + 0.14 0.58 + 0.57
n 45 20 25 21 24 Diff 10. Peaches, nectarines, apricots 0.84+ 0.33
0.012*
0.47 + 0.22 1.11 + 0.53 0.45 + 0.44 1.22 + 0.46
n 45 19 26 22 23 Diff 11. Broccoli, cabbage, cauliflower 0.02 + 0.30
0.94
-0.65 + 0.44 0.54 + 0.38
0.04*
AA > C -0.13 + 0.31 0.17 + 0.51 n 46 20 26 23 23
Diff 12. Cantaloupe, honeydew 0.54 + 0.39
0.17
0.75 + 0.52 0.38 + 0.57 0.91 + 0.55 0.17+ 0.56 n 46 20 26 23 23
Diff 13. Leafy greens (collards, turnips, etc)
-0.43 + 0.28
0.12†
0 + 0.23 -0.74 + 0.44 -0.82 + 0.41 -0.08 + 0.37
n 46 19 27 22 24 Diff 14. Corn 0.17 + 0.27
0.54
0.10 + 0.38
0.22 + 0.39 -0.04 + 0.35 0.38 + 0.42
n 47 20 27 23 24

88
Diff 15. Tomato products 0.30 + 0.41
0.47 0.30 + 0.31 0.31 + 0.70 -0.05 + 0.58 0.63 + 0.59
n 46 20 26 22 24
Diff 16. Spaghetti or lasagna 0.18 + 0.12
0.15† 0.30 + 0.15 0.08 + 0.19 -0.05 + 0.15 0.39+ 0.19
0.07† 80-97 > 60-
79
n 44 20 24 21 23
Diff 17. Onions 0.23 + 0.33
0.48 0.10 + 0.55 0.33 + 0.41 0.17 + 0.29 0.29 + 0.59
n 47 20 27 23 24 Diff 18. Squash, zucchini 0.48 + 0.29
0.11† 0.25 + 0.50 0.65 + 0.35 0.48 + 0.48 0.48 + 0.35
n 46 20 26 23 23 Diff 19. Spinach -0.12 + 0.23
0.60 0.33 + 0.28 -0.48 + 0.33
0.07† AA > C -0.15 + 0.37 -0.10 + 0.28
n 41 18 23 20 21 Diff 20. Sweet potatoes 0.07 + 0.22
0.77 0.20 + 0.28 -0.04 + 0.33 -0.09 + 0.21 0.22 + 0.39
n 46 20 26 23 23
Diff 21. Carrots 0.46 + 0.27
0.10† 1.15 + 0.52 -0.08 + 0.21
0.04* C > AA -0.17 + 0.23 1.09 + 0.45
0.02* 80-97 > 60-79
n 46 20 26 23 23
Diff 22. Beans 0.49 + 0.19
0.01* 0.15 + 0.22 0.74 + 0.28 0.17 + 0.21 0.79 + 0.29
0.10† 80-97 > 60-
79 n 47 20 27 23 24
Diff 23. Fruit as snack 0.19 + 0.56 0.73 -0.05 + 0.84 0.37 + 0.75 0.09 + 0.82 0.29 + 0.77
n 47 20 27 23 24 Diff 24. Fruit as dessert
-0.38 + 0.53
0.48
-0.33 + 0.70
-0.41 + 0.75
-0.87 + 0.70 0.14+ 0.79
n 45 18 27 23 22
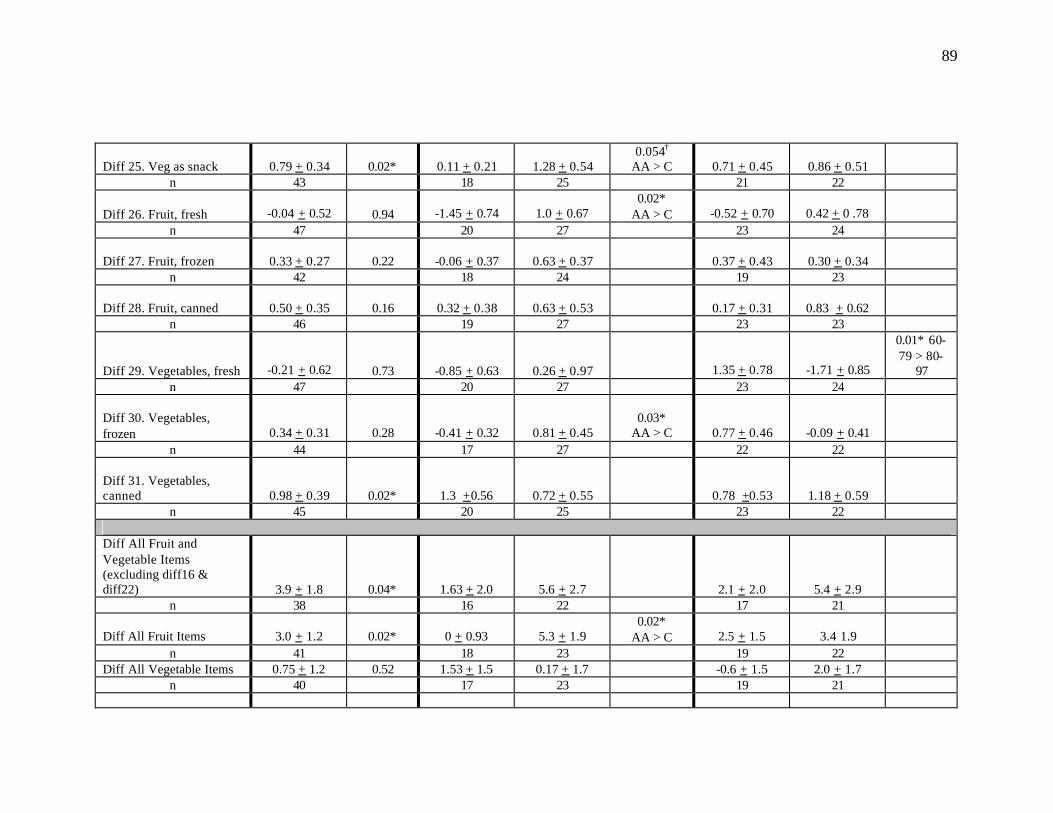
89
Diff 25. Veg as snack 0.79 + 0.34 0.02* 0.11 + 0.21 1.28 + 0.54
0.054† AA > C 0.71 + 0.45
0.86 + 0.51
n 43 18 25 21 22 Diff 26. Fruit, fresh -0.04 + 0.52
0.94 -1.45 + 0.74 1.0 + 0.67
0.02* AA > C -0.52 + 0.70 0.42 + 0 .78
n 47 20 27 23 24 Diff 27. Fruit, frozen 0.33 + 0.27
0.22 -0.06 + 0.37 0.63 + 0.37 0.37 + 0.43 0.30 + 0.34
n 42 18 24 19 23 Diff 28. Fruit, canned 0.50 + 0.35
0.16
0.32 + 0.38 0.63 + 0.53 0.17 + 0.31 0.83 + 0.62
n 46 19 27 23 23
Diff 29. Vegetables, fresh -0.21 + 0.62
0.73
-0.85 + 0.63
0.26 + 0.97 1.35 + 0.78 -1.71 + 0.85
0.01* 60-79 > 80-
97 n 47 20 27 23 24
Diff 30. Vegetables, frozen 0.34 + 0.31
0.28 -0.41 + 0.32 0.81 + 0.45
0.03* AA > C 0.77 + 0.46 -0.09 + 0.41
n 44 17 27 22 22 Diff 31. Vegetables, canned 0.98 + 0.39
0.02* 1.3 +0.56 0.72 + 0.55 0.78 +0.53 1.18 + 0.59
n 45 20 25 23 22
Diff All Fruit and Vegetable Items (excluding diff16 & diff22) 3.9 + 1.8 0.04* 1.63 + 2.0 5.6 + 2.7 2.1 + 2.0 5.4 + 2.9
n 38 16 22 17 21
Diff All Fruit Items 3.0 + 1.2 0.02* 0 + 0.93 5.3 + 1.9 0.02*
AA > C 2.5 + 1.5 3.4 1.9 n 41 18 23 19 22
Diff All Vegetable Items 0.75 + 1.2 0.52 1.53 + 1.5 0.17 + 1.7 -0.6 + 1.5 2.0 + 1.7 n 40 17 23 19 21
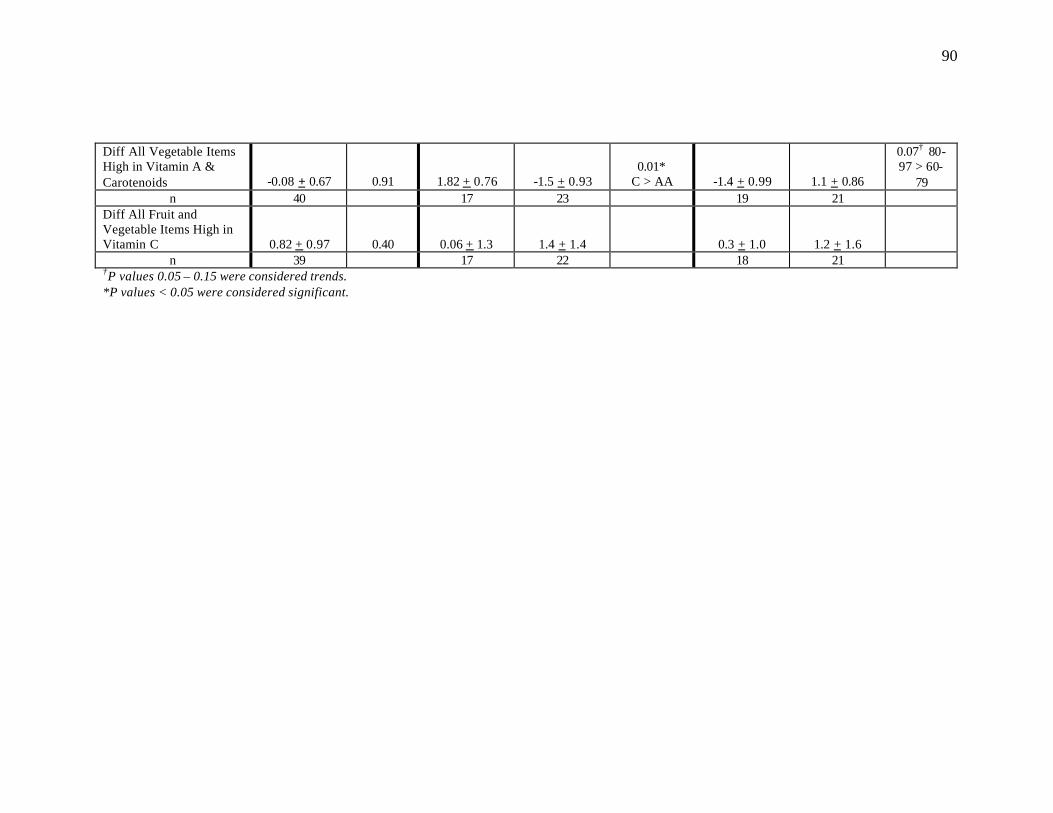
90
Diff All Vegetable Items High in Vitamin A & Carotenoids -0.08 + 0.67 0.91 1.82 + 0.76 -1.5 + 0.93
0.01* C > AA -1.4 + 0.99 1.1 + 0.86
0.07† 80-97 > 60-
79 n 40 17 23 19 21
Diff All Fruit and Vegetable Items High in Vitamin C 0.82 + 0.97 0.40 0.06 + 1.3 1.4 + 1.4 0.3 + 1.0 1.2 + 1.6
n 39 17 22 18 21 †P values 0.05 – 0.15 were considered trends. *P values < 0.05 were considered significant.
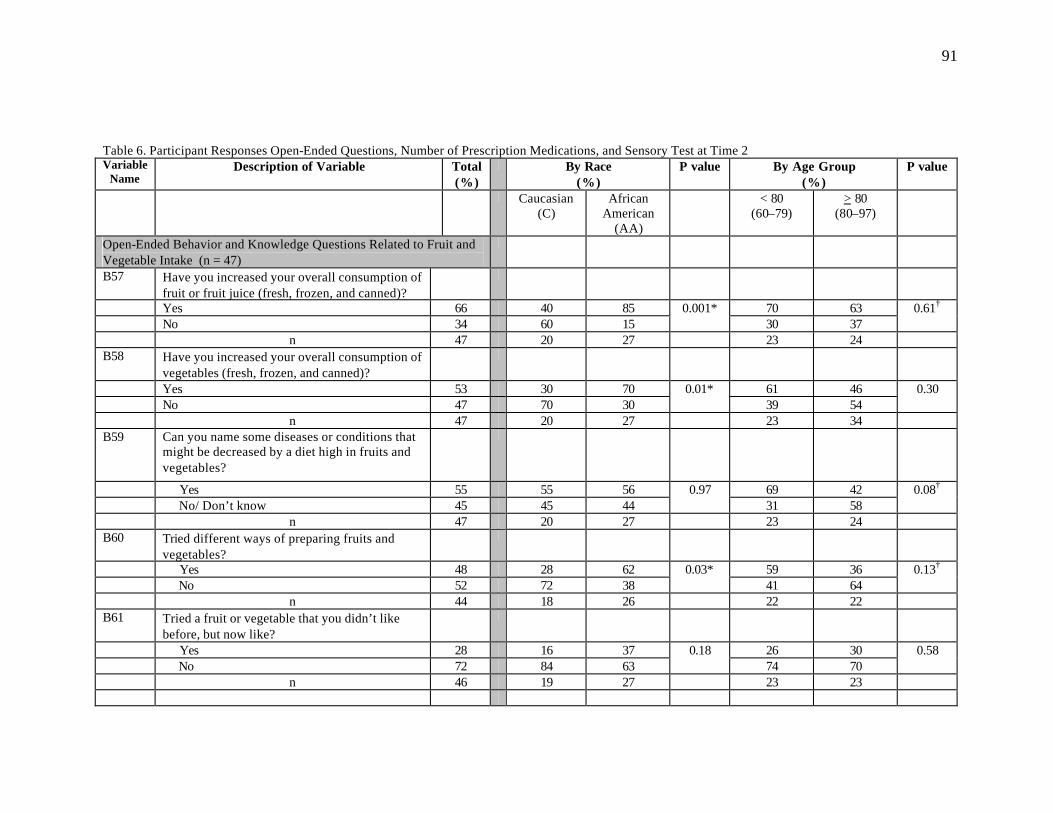
91
Table 6. Participant Responses Open-Ended Questions, Number of Prescription Medications, and Sensory Test at Time 2 Variable
Name Description of Variable
Total (%)
By Race (%)
P value
By Age Group (%)
P value
Caucasian (C)
African American
(AA)
< 80 (60–79)
> 80 (80–97)
Open-Ended Behavior and Knowledge Questions Related to Fruit and Vegetable Intake (n = 47)
B57 Have you increased your overall consumption of fruit or fruit juice (fresh, frozen, and canned)?
Yes 66 40 85 70 63 No 34 60 15
0.001* 30 37
0.61†
n 47 20 27 23 24 B58 Have you increased your overall consumption of
vegetables (fresh, frozen, and canned)?
Yes 53 30 70 61 46 No 47 70 30
0.01* 39 54
0.30
n 47 20 27 23 34 B59 Can you name some diseases or conditions that
might be decreased by a diet high in fruits and vegetables?
Yes 55 55 56 69 42 No/ Don’t know 45 45 44
0.97 31 58
0.08†
n 47 20 27 23 24 B60 Tried different ways of preparing fruits and
vegetables?
Yes 48 28 62 59 36 No 52 72 38
0.03* 41 64
0.13†
n 44 18 26 22 22 B61 Tried a fruit or vegetable that you didn’t like
before, but now like?
Yes 28 16 37 26 30 No 72 84 63
0.18 74 70
0.58
n 46 19 27 23 23
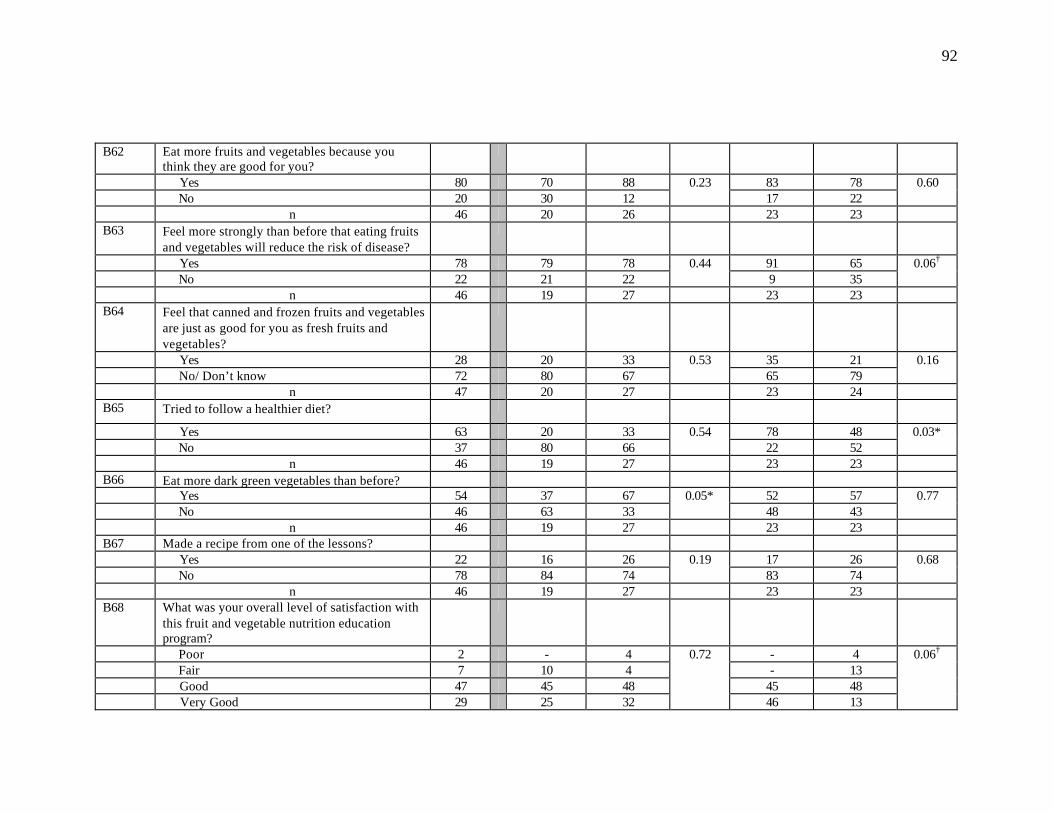
92
B62 Eat more fruits and vegetables because you think they are good for you?
Yes 80 70 88 83 78 No 20 30 12
0.23 17 22
0.60
n 46 20 26 23 23 B63 Feel more strongly than before that eating fruits
and vegetables will reduce the risk of disease?
Yes 78 79 78 91 65 No 22 21 22
0.44 9 35
0.06†
n 46 19 27 23 23 B64 Feel that canned and frozen fruits and vegetables
are just as good for you as fresh fruits and vegetables?
Yes 28 20 33 35 21 No/ Don’t know 72 80 67
0.53 65 79
0.16
n 47 20 27 23 24 B65 Tried to follow a healthier diet?
Yes 63 20 33 78 48 No 37 80 66
0.54 22 52
0.03*
n 46 19 27 23 23 B66 Eat more dark green vegetables than before? Yes 54 37 67 52 57 No 46 63 33
0.05* 48 43
0.77
n 46 19 27 23 23 B67 Made a recipe from one of the lessons? Yes 22 16 26 17 26 No 78 84 74
0.19 83 74
0.68
n 46 19 27 23 23 B68 What was your overall level of satisfaction with
this fruit and vegetable nutrition education program?
Poor 2 - 4 - 4 Fair 7 10 4 - 13 Good 47 45 48 45 48 Very Good 29 25 32
0.72
46 13
0.06†

93
Excellent 15 20 12 9 22 n 45 20 25 23 23 B69 How many sessions of the fruit and vegetable
nutrition education program did the participant attend?
0 4 5 4 - 9 1 4 5 4 9 - 2 8 20 - 13 4 3 11 15 7 17 4 4 11 5 15 13 8 0 – 4 sessions 38 50 30 52 25 5 4 5 4 - 8 6 13 5 18 8 17 7 8 5 11 9 8 8 13 20 7 9 17 9 13 10 15 13 12 10 11 5 15 9 13 5 – 10 sessions 62 50 70
0.16
48 75
0.06†
n 47 20 27 23 24 Selected Sensory Variables (n = 41) B71rc How many medications do you routinely take
each day?
0 – 1 per day 12 - 19 15 10 2 – 3 per day 32 20 39 30 33 4 or more per day 56 80 42 55 57
0.86
n 41 15 26 20 21 B72rc (Taste test using PTC–Impregnated Strip) Are
you able to detect a taste? Intensity?
0.04*
No 22 33 15 25 19 Yes; Don’t know or slight‡ 12 13 12 10 14 Yes; moderate 15 7 19 20 10 Yes; strong 51 47 54
0.47
45 57
0.71
n 41 15 26 20 21 †P values 0.05 – 0.15 were considered trends. *P values < 0.05 were considered significant. ‡Participants who were unsure of the intensity were grouped with “slight”.
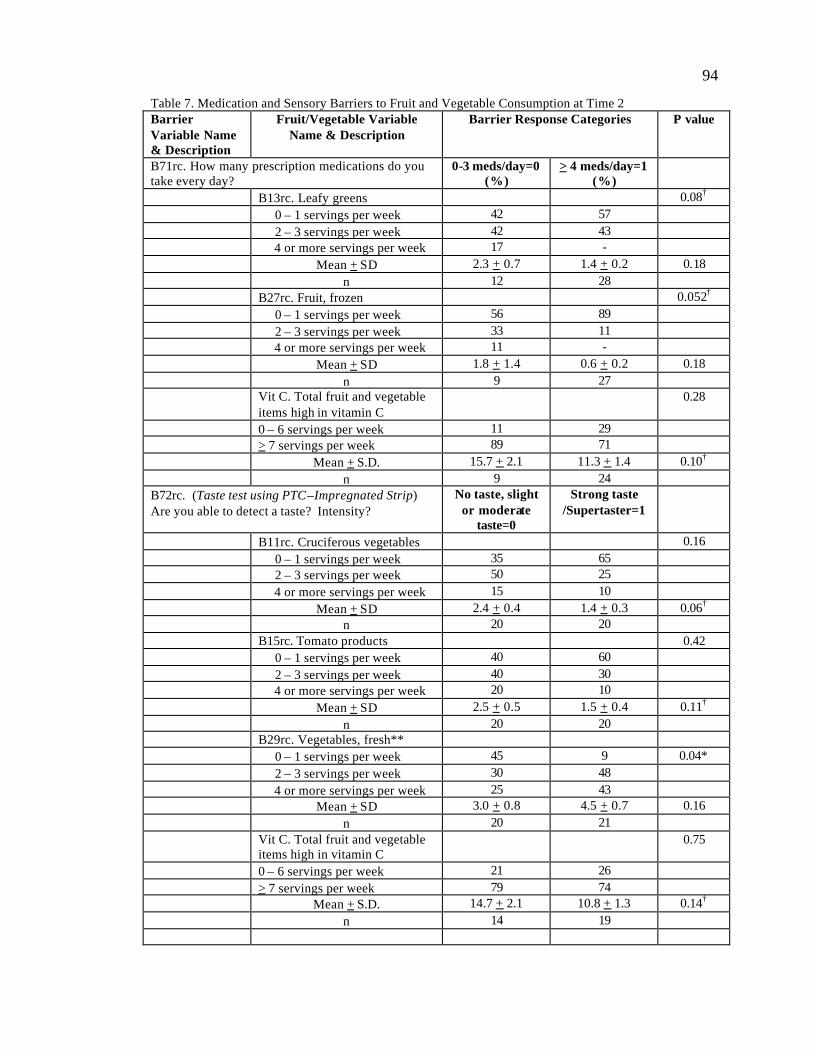
94
Table 7. Medication and Sensory Barriers to Fruit and Vegetable Consumption at Time 2 Barrier Variable Name & Description
Fruit/Vegetable Variable Name & Description
Barrier Response Categories P value
B71rc. How many prescription medications do you take every day?
0-3 meds/day=0 (%)
> 4 meds/day=1 (%)
B13rc. Leafy greens 0.08† 0 – 1 servings per week 42 57 2 – 3 servings per week 42 43 4 or more servings per week 17 - Mean + SD 2.3 + 0.7 1.4 + 0.2 0.18 n 12 28 B27rc. Fruit, frozen 0.052† 0 – 1 servings per week 56 89 2 – 3 servings per week 33 11 4 or more servings per week 11 - Mean + SD 1.8 + 1.4 0.6 + 0.2 0.18 n 9 27 Vit C. Total fruit and vegetable
items high in vitamin C 0.28
0 – 6 servings per week 11 29 > 7 servings per week 89 71 Mean + S.D. 15.7 + 2.1 11.3 + 1.4 0.10† n 9 24
B72rc. (Taste test using PTC–Impregnated Strip) Are you able to detect a taste? Intensity?
No taste, slight or moderate
taste=0
Strong taste /Supertaster=1
B11rc. Cruciferous vegetables 0.16 0 – 1 servings per week 35 65 2 – 3 servings per week 50 25 4 or more servings per week 15 10 Mean + SD 2.4 + 0.4 1.4 + 0.3 0.06† n 20 20 B15rc. Tomato products 0.42 0 – 1 servings per week 40 60 2 – 3 servings per week 40 30 4 or more servings per week 20 10 Mean + SD 2.5 + 0.5 1.5 + 0.4 0.11† n 20 20 B29rc. Vegetables, fresh** 0 – 1 servings per week 45 9 0.04* 2 – 3 servings per week 30 48 4 or more servings per week 25 43 Mean + SD 3.0 + 0.8 4.5 + 0.7 0.16 n 20 21 Vit C. Total fruit and vegetable
items high in vitamin C 0.75
0 – 6 servings per week 21 26 > 7 servings per week 79 74 Mean + S.D. 14.7 + 2.1 10.8 + 1.3 0.14† n 14 19
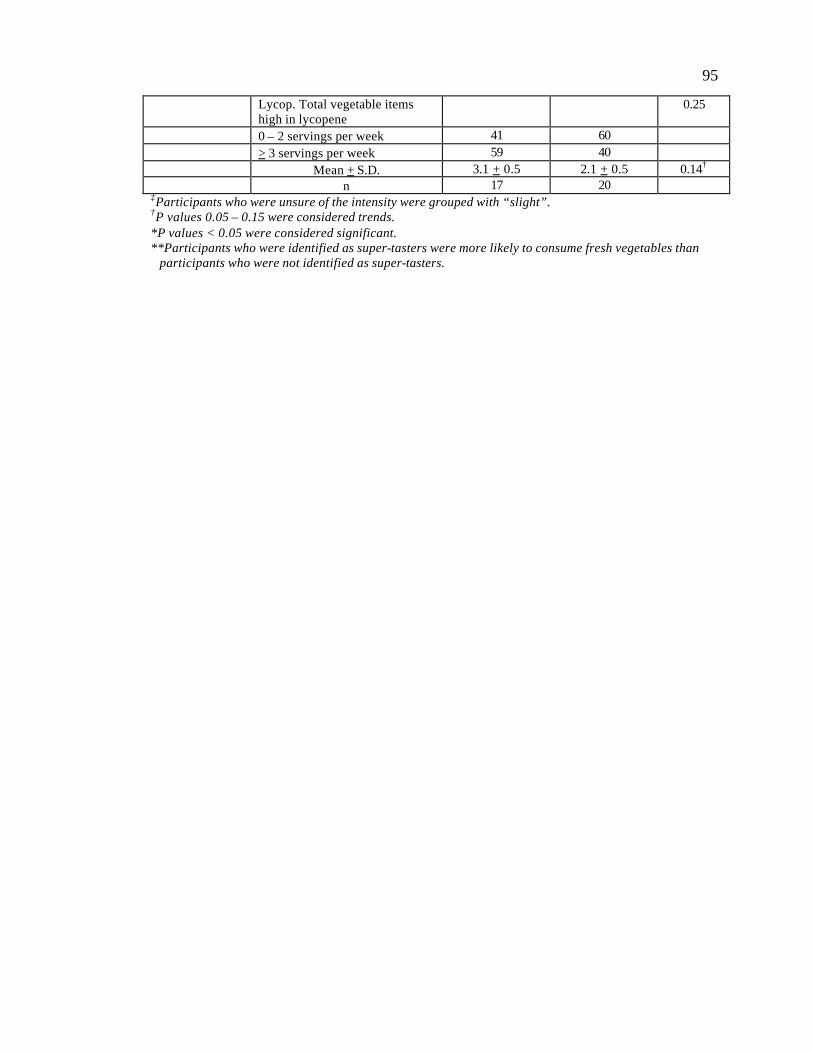
95
Lycop. Total vegetable items high in lycopene
0.25
0 – 2 servings per week 41 60 > 3 servings per week 59 40 Mean + S.D. 3.1 + 0.5 2.1 + 0.5 0.14† n 17 20 ‡Participants who were unsure of the intensity were grouped with “slight”. †P values 0.05 – 0.15 were considered trends. *P values < 0.05 were considered significant. **Participants who were identified as super-tasters were more likely to consume fresh vegetables than participants who were not identified as super-tasters.
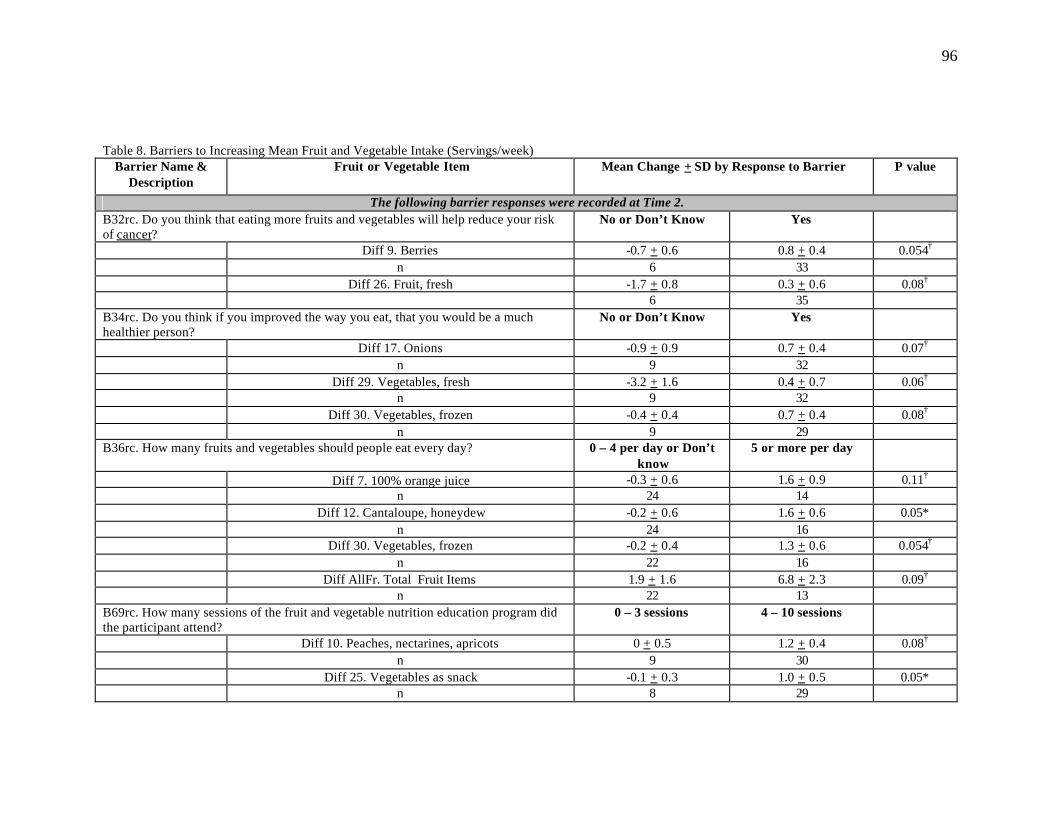
96
Table 8. Barriers to Increasing Mean Fruit and Vegetable Intake (Servings/week) Barrier Name &
Description Fruit or Vegetable Item Mean Change + SD by Response to Barrier P value
The following barrier responses were recorded at Time 2. B32rc. Do you think that eating more fruits and vegetables will help reduce your risk of cancer?
No or Don’t Know Yes
Diff 9. Berries -0.7 + 0.6 0.8 + 0.4 0.054† n 6 33 Diff 26. Fruit, fresh -1.7 + 0.8 0.3 + 0.6 0.08† 6 35 B34rc. Do you think if you improved the way you eat, that you would be a much healthier person?
No or Don’t Know Yes
Diff 17. Onions -0.9 + 0.9 0.7 + 0.4 0.07† n 9 32 Diff 29. Vegetables, fresh -3.2 + 1.6 0.4 + 0.7 0.06† n 9 32 Diff 30. Vegetables, frozen -0.4 + 0.4 0.7 + 0.4 0.08† n 9 29 B36rc. How many fruits and vegetables should people eat every day? 0 – 4 per day or Don’t
know 5 or more per day
Diff 7. 100% orange juice -0.3 + 0.6 1.6 + 0.9 0.11† n 24 14 Diff 12. Cantaloupe, honeydew -0.2 + 0.6 1.6 + 0.6 0.05* n 24 16 Diff 30. Vegetables, frozen -0.2 + 0.4 1.3 + 0.6 0.054† n 22 16 Diff AllFr. Total Fruit Items 1.9 + 1.6 6.8 + 2.3 0.09† n 22 13 B69rc. How many sessions of the fruit and vegetable nutrition education program did the participant attend?
0 – 3 sessions 4 – 10 sessions
Diff 10. Peaches, nectarines, apricots 0 + 0.5 1.2 + 0.4 0.08† n 9 30 Diff 25. Vegetables as snack -0.1 + 0.3 1.0 + 0.5 0.05* n 8 29
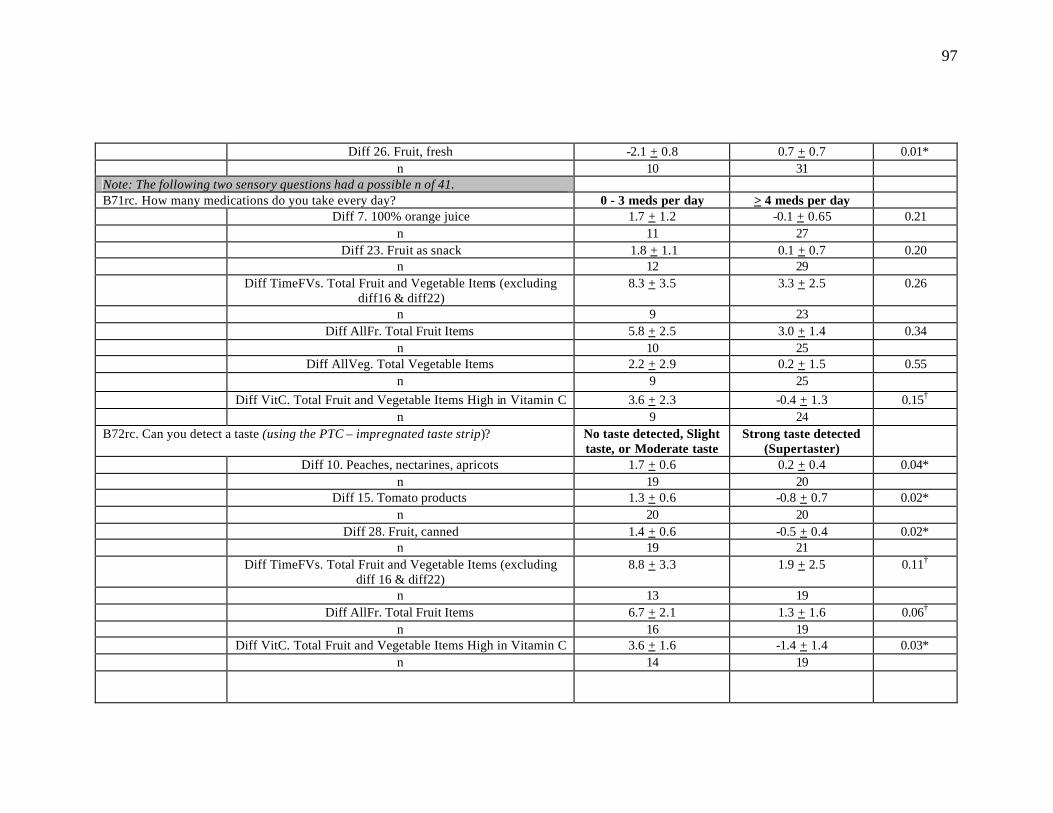
97
Diff 26. Fruit, fresh -2.1 + 0.8 0.7 + 0.7 0.01* n 10 31 Note: The following two sensory questions had a possible n of 41. B71rc. How many medications do you take every day? 0 - 3 meds per day > 4 meds per day Diff 7. 100% orange juice 1.7 + 1.2 -0.1 + 0.65 0.21 n 11 27 Diff 23. Fruit as snack 1.8 + 1.1 0.1 + 0.7 0.20 n 12 29 Diff TimeFVs. Total Fruit and Vegetable Items (excluding
diff16 & diff22) 8.3 + 3.5 3.3 + 2.5 0.26
n 9 23 Diff AllFr. Total Fruit Items 5.8 + 2.5 3.0 + 1.4 0.34 n 10 25 Diff AllVeg. Total Vegetable Items 2.2 + 2.9 0.2 + 1.5 0.55 n 9 25
Diff VitC. Total Fruit and Vegetable Items High in Vitamin C 3.6 + 2.3 -0.4 + 1.3 0.15† n 9 24 B72rc. Can you detect a taste (using the PTC – impregnated taste strip)? No taste detected, Slight
taste, or Moderate taste Strong taste detected
(Supertaster)
Diff 10. Peaches, nectarines, apricots 1.7 + 0.6 0.2 + 0.4 0.04* n 19 20 Diff 15. Tomato products 1.3 + 0.6 -0.8 + 0.7 0.02* n 20 20 Diff 28. Fruit, canned 1.4 + 0.6 -0.5 + 0.4 0.02* n 19 21 Diff TimeFVs. Total Fruit and Vegetable Items (excluding
diff 16 & diff22) 8.8 + 3.3 1.9 + 2.5 0.11†
n 13 19 Diff AllFr. Total Fruit Items 6.7 + 2.1 1.3 + 1.6 0.06† n 16 19 Diff VitC. Total Fruit and Vegetable Items High in Vitamin C 3.6 + 1.6 -1.4 + 1.4 0.03* n 14 19
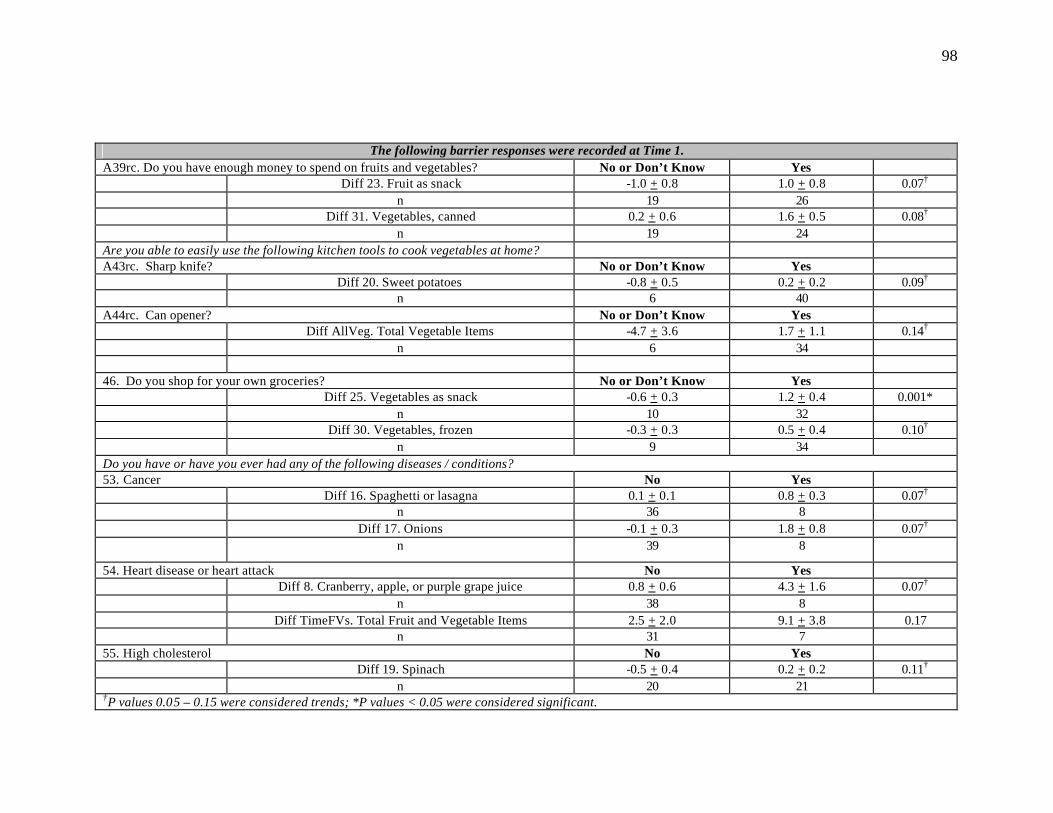
98
The following barrier responses were recorded at Time 1. A39rc. Do you have enough money to spend on fruits and vegetables? No or Don’t Know Yes Diff 23. Fruit as snack -1.0 + 0.8 1.0 + 0.8 0.07† n 19 26 Diff 31. Vegetables, canned 0.2 + 0.6 1.6 + 0.5 0.08† n 19 24 Are you able to easily use the following kitchen tools to cook vegetables at home? A43rc. Sharp knife? No or Don’t Know Yes Diff 20. Sweet potatoes -0.8 + 0.5 0.2 + 0.2 0.09† n 6 40 A44rc. Can opener? No or Don’t Know Yes Diff AllVeg. Total Vegetable Items -4.7 + 3.6 1.7 + 1.1 0.14† n 6 34 46. Do you shop for your own groceries? No or Don’t Know Yes Diff 25. Vegetables as snack -0.6 + 0.3 1.2 + 0.4 0.001* n 10 32 Diff 30. Vegetables, frozen -0.3 + 0.3 0.5 + 0.4 0.10† n 9 34 Do you have or have you ever had any of the following diseases / conditions? 53. Cancer No Yes Diff 16. Spaghetti or lasagna 0.1 + 0.1 0.8 + 0.3 0.07† n 36 8 Diff 17. Onions -0.1 + 0.3 1.8 + 0.8 0.07† n 39 8
54. Heart disease or heart attack No Yes Diff 8. Cranberry, apple, or purple grape juice 0.8 + 0.6 4.3 + 1.6 0.07† n 38 8 Diff TimeFVs. Total Fruit and Vegetable Items 2.5 + 2.0 9.1 + 3.8 0.17 n 31 7 55. High cholesterol No Yes Diff 19. Spinach -0.5 + 0.4 0.2 + 0.2 0.11† n 20 21 †P values 0.05 – 0.15 were considered trends; *P values < 0.05 were considered significant.
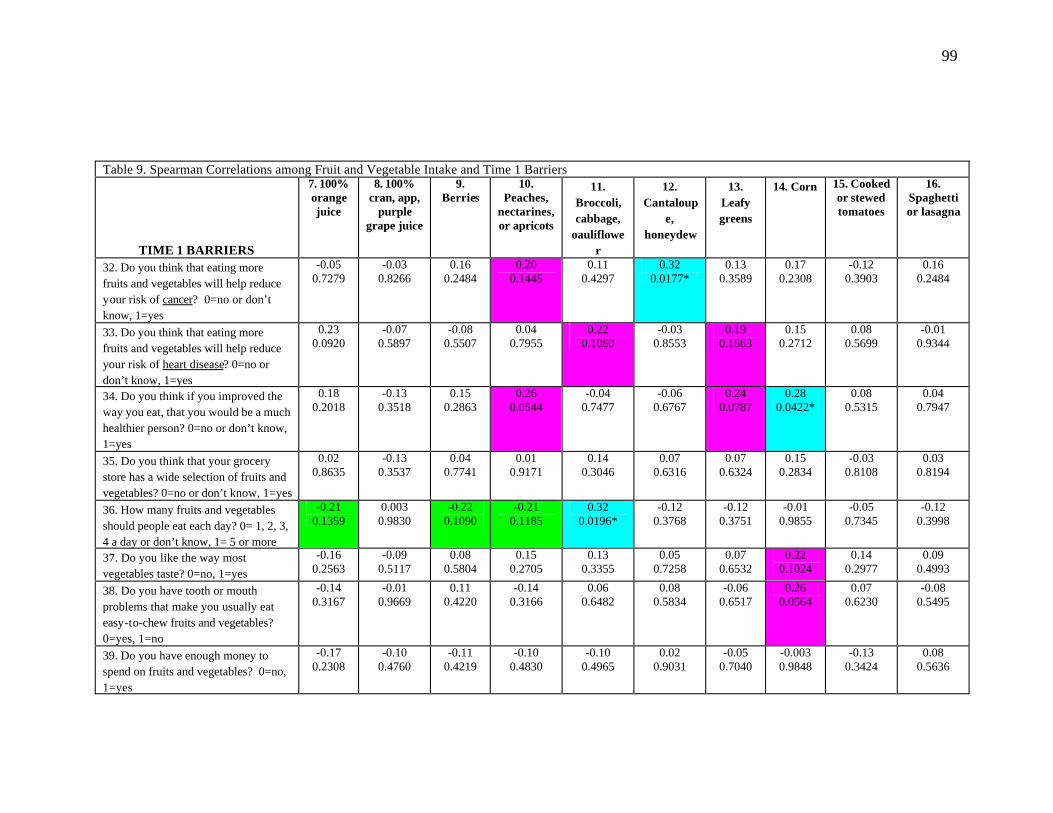
99
Table 9. Spearman Correlations among Fruit and Vegetable Intake and Time 1 Barriers
TIME 1 BARRIERS
7. 100% orange juice
8. 100% cran, app,
purple grape juice
9. Berries
10. Peaches,
nectarines, or apricots
11. Broccoli, cabbage,
oauliflower
12. Cantaloup
e, honeydew
13. Leafy greens
14. Corn 15. Cooked or stewed tomatoes
16. Spaghetti or lasagna
32. Do you think that eating more fruits and vegetables will help reduce your risk of cancer? 0=no or don’t know, 1=yes
-0.05 0.7279
-0.03 0.8266
0.16 0.2484
0.20 0.1445
0.11 0.4297
0.32 0.0177*
0.13 0.3589
0.17 0.2308
-0.12 0.3903
0.16 0.2484
33. Do you think that eating more fruits and vegetables will help reduce your risk of heart disease? 0=no or don’t know, 1=yes
0.23 0.0920
-0.07 0.5897
-0.08 0.5507
0.04 0.7955
0.22 0.1060
-0.03 0.8553
0.19 0.1663
0.15 0.2712
0.08 0.5699
-0.01 0.9344
34. Do you think if you improved the way you eat, that you would be a much healthier person? 0=no or don’t know, 1=yes
0.18 0.2018
-0.13 0.3518
0.15 0.2863
0.26 0.0544
-0.04 0.7477
-0.06 0.6767
0.24 0.0787
0.28 0.0422*
0.08 0.5315
0.04 0.7947
35. Do you think that your grocery store has a wide selection of fruits and vegetables? 0=no or don’t know, 1=yes
0.02 0.8635
-0.13 0.3537
0.04 0.7741
0.01 0.9171
0.14 0.3046
0.07 0.6316
0.07 0.6324
0.15 0.2834
-0.03 0.8108
0.03 0.8194
36. How many fruits and vegetables should people eat each day? 0= 1, 2, 3, 4 a day or don’t know, 1= 5 or more
-0.21 0.1359
0.003 0.9830
-0.22 0.1090
-0.21 0.1185
0.32 0.0196*
-0.12 0.3768
-0.12 0.3751
-0.01 0.9855
-0.05 0.7345
-0.12 0.3998
37. Do you like the way most vegetables taste? 0=no, 1=yes
-0.16 0.2563
-0.09 0.5117
0.08 0.5804
0.15 0.2705
0.13 0.3355
0.05 0.7258
0.07 0.6532
0.22 0.1024
0.14 0.2977
0.09 0.4993
38. Do you have tooth or mouth problems that make you usually eat easy-to-chew fruits and vegetables? 0=yes, 1=no
-0.14 0.3167
-0.01 0.9669
0.11 0.4220
-0.14 0.3166
0.06 0.6482
0.08 0.5834
-0.06 0.6517
0.26 0.0564
0.07 0.6230
-0.08 0.5495
39. Do you have enough money to spend on fruits and vegetables? 0=no, 1=yes
-0.17 0.2308
-0.10 0.4760
-0.11 0.4219
-0.10 0.4830
-0.10 0.4965
0.02 0.9031
-0.05 0.7040
-0.003 0.9848
-0.13 0.3424
0.08 0.5636
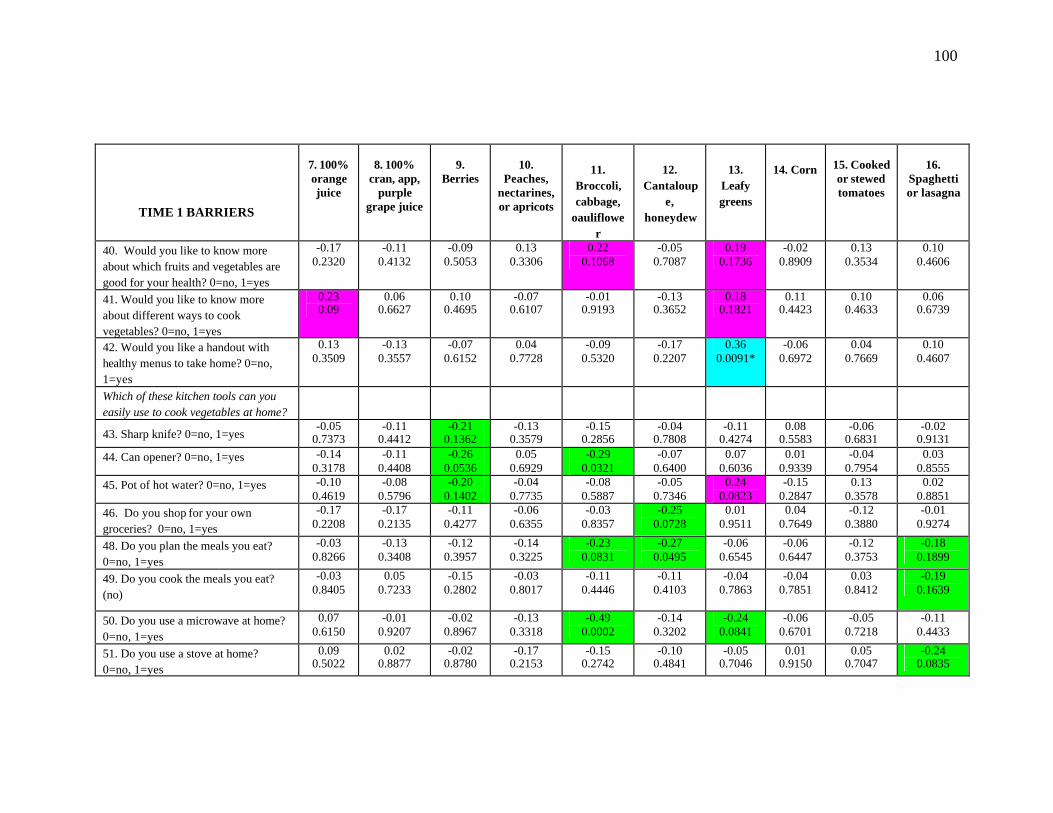
100
TIME 1 BARRIERS
7. 100% orange juice
8. 100%
cran, app, purple
grape juice
9.
Berries
10.
Peaches, nectarines, or apricots
11.
Broccoli, cabbage,
oauliflower
12.
Cantaloupe,
honeydew
13.
Leafy greens
14. Corn
15. Cooked or stewed tomatoes
16.
Spaghetti or lasagna
40. Would you like to know more about which fruits and vegetables are good for your health? 0=no, 1=yes
-0.17 0.2320
-0.11 0.4132
-0.09 0.5053
0.13 0.3306
0.22 0.1068
-0.05 0.7087
0.19 0.1736
-0.02 0.8909
0.13 0.3534
0.10 0.4606
41. Would you like to know more about different ways to cook vegetables? 0=no, 1=yes
0.23 0.09
0.06 0.6627
0.10 0.4695
-0.07 0.6107
-0.01 0.9193
-0.13 0.3652
0.18 0.1821
0.11 0.4423
0.10 0.4633
0.06 0.6739
42. Would you like a handout with healthy menus to take home? 0=no, 1=yes
0.13 0.3509
-0.13 0.3557
-0.07 0.6152
0.04 0.7728
-0.09 0.5320
-0.17 0.2207
0.36 0.0091*
-0.06 0.6972
0.04 0.7669
0.10 0.4607
Which of these kitchen tools can you easily use to cook vegetables at home?
43. Sharp knife? 0=no, 1=yes -0.05
0.7373 -0.11
0.4412 -0.21
0.1362 -0.13
0.3579 -0.15
0.2856 -0.04
0.7808 -0.11
0.4274 0.08
0.5583 -0.06
0.6831 -0.02
0.9131 44. Can opener? 0=no, 1=yes -0.14
0.3178 -0.11
0.4408 -0.26
0.0536 0.05
0.6929 -0.29
0.0321 -0.07
0.6400 0.07
0.6036 0.01
0.9339 -0.04
0.7954 0.03
0.8555 45. Pot of hot water? 0=no, 1=yes -0.10
0.4619 -0.08
0.5796 -0.20
0.1402 -0.04
0.7735 -0.08
0.5887 -0.05
0.7346 0.24
0.0823 -0.15
0.2847 0.13
0.3578 0.02
0.8851 46. Do you shop for your own groceries? 0=no, 1=yes
-0.17 0.2208
-0.17 0.2135
-0.11 0.4277
-0.06 0.6355
-0.03 0.8357
-0.25 0.0728
0.01 0.9511
0.04 0.7649
-0.12 0.3880
-0.01 0.9274
48. Do you plan the meals you eat? 0=no, 1=yes
-0.03 0.8266
-0.13 0.3408
-0.12 0.3957
-0.14 0.3225
-0.23 0.0831
-0.27 0.0495
-0.06 0.6545
-0.06 0.6447
-0.12 0.3753
-0.18 0.1899
49. Do you cook the meals you eat? (no)
-0.03 0.8405
0.05 0.7233
-0.15 0.2802
-0.03 0.8017
-0.11 0.4446
-0.11 0.4103
-0.04 0.7863
-0.04 0.7851
0.03 0.8412
-0.19 0.1639
50. Do you use a microwave at home? 0=no, 1=yes
0.07 0.6150
-0.01 0.9207
-0.02 0.8967
-0.13 0.3318
-0.49 0.0002
-0.14 0.3202
-0.24 0.0841
-0.06 0.6701
-0.05 0.7218
-0.11 0.4433
51. Do you use a stove at home? 0=no, 1=yes
0.09 0.5022
0.02 0.8877
-0.02 0.8780
-0.17 0.2153
-0.15 0.2742
-0.10 0.4841
-0.05 0.7046
0.01 0.9150
0.05 0.7047
-0.24 0.0835
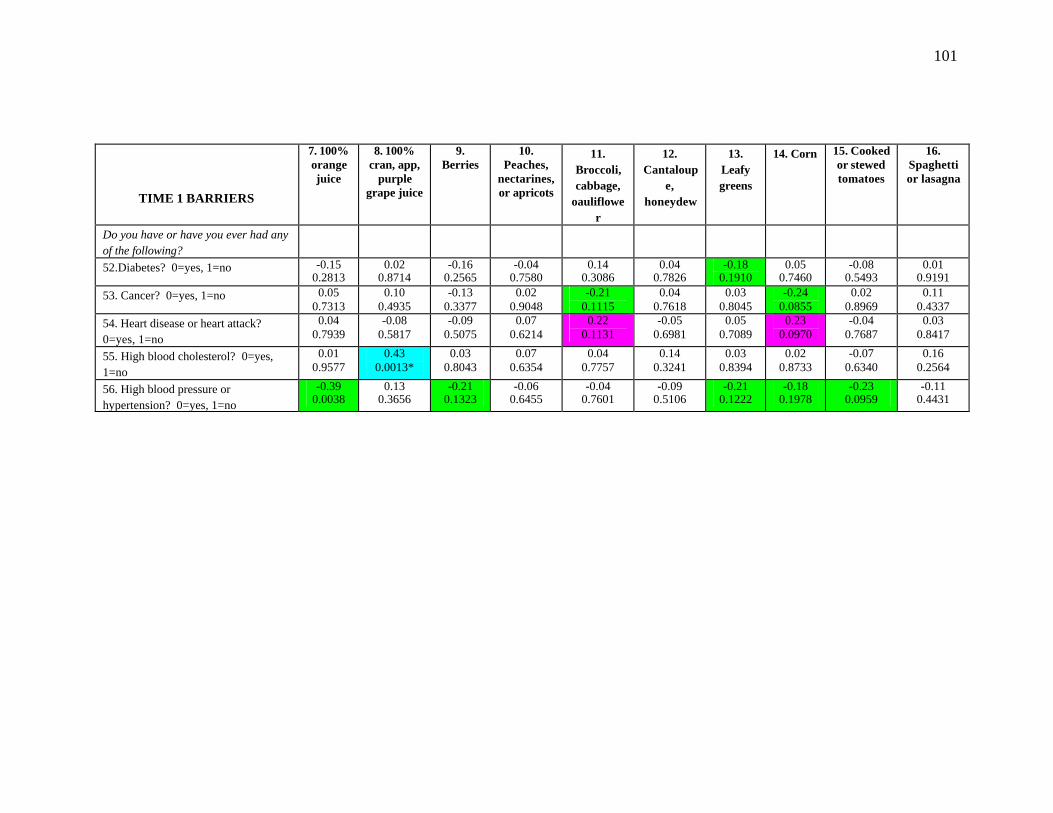
101
TIME 1 BARRIERS
7. 100% orange juice
8. 100% cran, app,
purple grape juice
9. Berries
10. Peaches,
nectarines, or apricots
11. Broccoli, cabbage,
oauliflower
12. Cantaloup
e, honeydew
13. Leafy greens
14. Corn 15. Cooked or stewed tomatoes
16. Spaghetti or lasagna
Do you have or have you ever had any of the following?
52.Diabetes? 0=yes, 1=no -0.15 0.2813
0.02 0.8714
-0.16 0.2565
-0.04 0.7580
0.14 0.3086
0.04 0.7826
-0.18 0.1910
0.05 0.7460
-0.08 0.5493
0.01 0.9191
53. Cancer? 0=yes, 1=no 0.05 0.7313
0.10 0.4935
-0.13 0.3377
0.02 0.9048
-0.21 0.1115
0.04 0.7618
0.03 0.8045
-0.24 0.0855
0.02 0.8969
0.11 0.4337
54. Heart disease or heart attack? 0=yes, 1=no
0.04 0.7939
-0.08 0.5817
-0.09 0.5075
0.07 0.6214
0.22 0.1131
-0.05 0.6981
0.05 0.7089
0.23 0.0970
-0.04 0.7687
0.03 0.8417
55. High blood cholesterol? 0=yes, 1=no
0.01 0.9577
0.43 0.0013*
0.03 0.8043
0.07 0.6354
0.04 0.7757
0.14 0.3241
0.03 0.8394
0.02 0.8733
-0.07 0.6340
0.16 0.2564
56. High blood pressure or hypertension? 0=yes, 1=no
-0.39 0.0038
0.13 0.3656
-0.21 0.1323
-0.06 0.6455
-0.04 0.7601
-0.09 0.5106
-0.21 0.1222
-0.18 0.1978
-0.23 0.0959
-0.11 0.4431
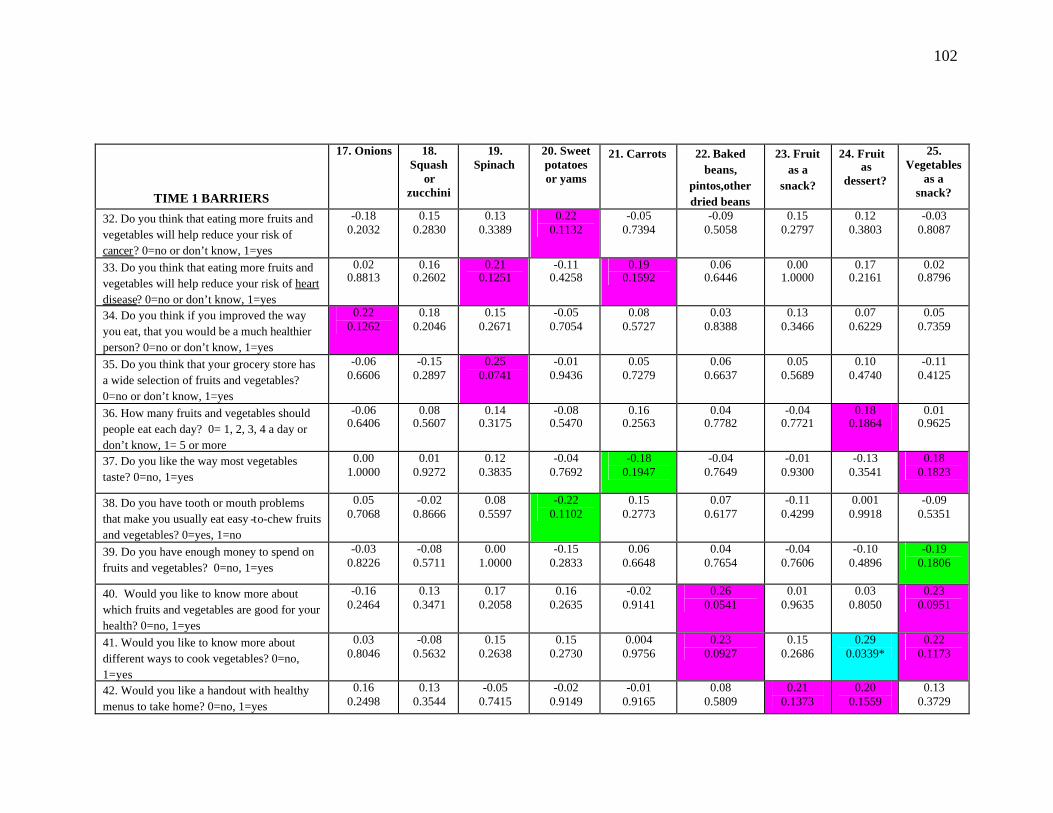
102
TIME 1 BARRIERS
17. Onions 18. Squash
or zucchini
19. Spinach
20. Sweet potatoes or yams
21. Carrots 22. Baked beans,
pintos,other dried beans
23. Fruit as a
snack?
24. Fruit as
dessert?
25. Vegetables
as a snack?
32. Do you think that eating more fruits and vegetables will help reduce your risk of cancer? 0=no or don’t know, 1=yes
-0.18 0.2032
0.15 0.2830
0.13 0.3389
0.22 0.1132
-0.05 0.7394
-0.09 0.5058
0.15 0.2797
0.12 0.3803
-0.03 0.8087
33. Do you think that eating more fruits and vegetables will help reduce your risk of heart disease? 0=no or don’t know, 1=yes
0.02 0.8813
0.16 0.2602
0.21 0.1251
-0.11 0.4258
0.19 0.1592
0.06 0.6446
0.00 1.0000
0.17 0.2161
0.02 0.8796
34. Do you think if you improved the way you eat, that you would be a much healthier person? 0=no or don’t know, 1=yes
0.22 0.1262
0.18 0.2046
0.15 0.2671
-0.05 0.7054
0.08 0.5727
0.03 0.8388
0.13 0.3466
0.07 0.6229
0.05 0.7359
35. Do you think that your grocery store has a wide selection of fruits and vegetables? 0=no or don’t know, 1=yes
-0.06 0.6606
-0.15 0.2897
0.25 0.0741
-0.01 0.9436
0.05 0.7279
0.06 0.6637
0.05 0.5689
0.10 0.4740
-0.11 0.4125
36. How many fruits and vegetables should people eat each day? 0= 1, 2, 3, 4 a day or don’t know, 1= 5 or more
-0.06 0.6406
0.08 0.5607
0.14 0.3175
-0.08 0.5470
0.16 0.2563
0.04 0.7782
-0.04 0.7721
0.18 0.1864
0.01 0.9625
37. Do you like the way most vegetables taste? 0=no, 1=yes
0.00 1.0000
0.01 0.9272
0.12 0.3835
-0.04 0.7692
-0.18 0.1947
-0.04 0.7649
-0.01 0.9300
-0.13 0.3541
0.18 0.1823
38. Do you have tooth or mouth problems that make you usually eat easy -to-chew fruits and vegetables? 0=yes, 1=no
0.05 0.7068
-0.02 0.8666
0.08 0.5597
-0.22 0.1102
0.15 0.2773
0.07 0.6177
-0.11 0.4299
0.001 0.9918
-0.09 0.5351
39. Do you have enough money to spend on fruits and vegetables? 0=no, 1=yes
-0.03 0.8226
-0.08 0.5711
0.00 1.0000
-0.15 0.2833
0.06 0.6648
0.04 0.7654
-0.04 0.7606
-0.10 0.4896
-0.19 0.1806
40. Would you like to know more about which fruits and vegetables are good for your health? 0=no, 1=yes
-0.16 0.2464
0.13 0.3471
0.17 0.2058
0.16 0.2635
-0.02 0.9141
0.26 0.0541
0.01 0.9635
0.03 0.8050
0.23 0.0951
41. Would you like to know more about different ways to cook vegetables? 0=no, 1=yes
0.03 0.8046
-0.08 0.5632
0.15 0.2638
0.15 0.2730
0.004 0.9756
0.23 0.0927
0.15 0.2686
0.29 0.0339*
0.22 0.1173
42. Would you like a handout with healthy menus to take home? 0=no, 1=yes
0.16 0.2498
0.13 0.3544
-0.05 0.7415
-0.02 0.9149
-0.01 0.9165
0.08 0.5809
0.21 0.1373
0.20 0.1559
0.13 0.3729

103
TIME 1 BARRIERS
17. Onions 18. Squash
or zucchini
19. Spinach
20. Sweet potatoes or yams
21. Carrots 22. Baked beans,
pintos,other dried beans
23. Fruit as a
snack?
24. Fruit as
dessert?
25. Vegetables
as a snack?
Which of these kitchen tools can you easily use to cook vegetables at home?
43. Sharp knife? 0=no, 1=yes -0.17
0.2190 0.05
0.7265 0.08
0.5843 0.05
0.7456 -0.05
0.7247 -0.002 0.9900
-0.01 0.9603
-0.09 0.5132
-0.02 0.8764
44. Can opener? 0=no, 1=yes 0.15 0.2872
0.16 0.2532
-0.04 0.7513
-0.10 0.4972
-0.08 0.5645
-0.06 0.6751
0.03 0.8309
-0.14 0.3051
-0.17 0.2269
45. Pot of hot water? 0=no, 1=yes -0.16 0.2332
0.17 0.2098
0.04 0.7513
0.01 0.9255
0.06 0.6814
0.09 0.5272
0.13 0.3430
0.12 0.3986
0.11 0.4305
46. Do you shop for your own groceries? 0=no, 1=yes
-0.04 0.7616
0.03 0.8057
0.16 0.2553
-0.17 0.2279
-0.09 0.5450
0.03 0.8269
0.08 0.5765
0.08 0.5767
-0.20 0.1443
48. Do you plan the meals you eat? 0=no, 1=yes
0.14 0.3197
0.06 0.6475
0.04 0.7513
-0.06 0.6480
-0.03 0.8331
-0.13 0.3333
0.26 0.0623
0.08 0.5717
-0.22 0.1058
49. Do you cook the meals you eat? 0=no, 1=yes
0.00 1.0000
-0.03 0.8434
0.17 0.2058
0.01 0.9287
0.06 0.6572
-0.11 0.4213
0.19 0.1762
-0.06 0.6682
-0.02 0.9034
50. Do you use a microwave at home? 0=no, 1=yes
0.24 0.0795
-0.04 0.7547
-0.28 0.0438
-0.15 0.2790
0.18 0.1930
0.12 0.3994
0.06 0.6487
-0.07 0.6093
-0.10 0.4734
51. Do you use a stove at home? 0=no, 1=yes
0.18 0.2055
-0.02 0.8739
0.17 0.2058
-0.02 0.78633
0.14 0.3142
0.14 0.3142
0.14 0.3043
-0.11 0.4209
-0.06 0.6645
Do you have or have you ever had any of the following?
52.Diabetes? 0=yes, 1=no 0.10 0.4835
-0.02 0.8624
-0.22 0.1112
-0.20 0.1482
-0.04 0.7862
0.17 0.2074
-0.16 0.2402
-0.12 0.3853
-0.24 0.0780
53. Cancer? 0=yes, 1=no -0.13 0.3321
0.09 0.5365
-0.05 0.6940
-0.21 0.1272
-0.07 0.5975
-0.23 0.0942
0.07 0.6263
-0.16 0.2434
0.08 0.5892
54. Heart disease or heart attack? 0=yes, 1=no
-0.22 0.1138
0.01 0.9151
0.16 0.2549
0.12 0.3916
-0.29 0.0324
0.25 0.0652
0.06 0.6734
-0.05 0.7468
0.16 0.2575
55. High blood cholesterol? 0=yes, 1=no
-0.11 0.4224
-0.05 0.7051
-0.02 0.8795
0.13 0.2513
0.07 0.5905
0.19 0.1617
0.09 0.5399
-0.12 0.3891
-0.01 0.9357
56. High blood pressure or hypertension? 0=yes, 1=no
0.09 0.5043
-0.12 0.3751
-0.22 0.0977
-0.06 0.6912
-0.03 0.8425
0.06 0.6453
-0.05 0.6938
-0.16 0.2574
-0.20 0.1420
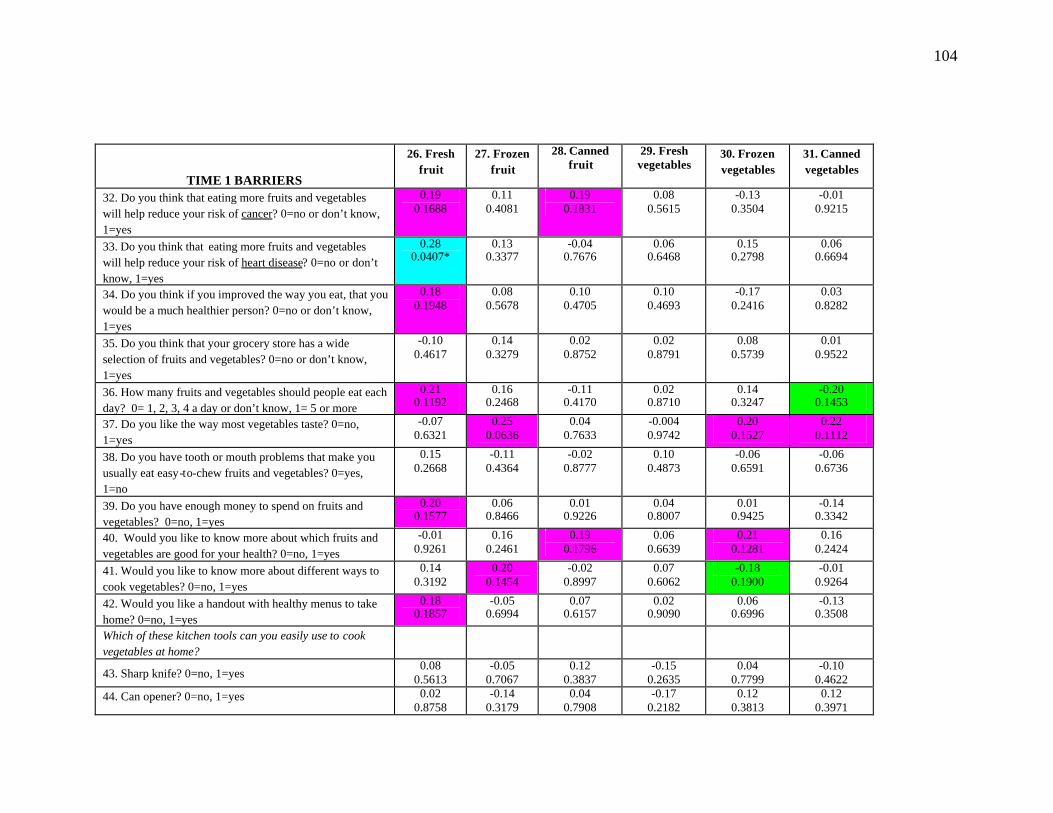
104
TIME 1 BARRIERS
26. Fresh fruit
27. Frozen fruit
28. Canned fruit
29. Fresh vegetables
30. Frozen vegetables
31. Canned vegetables
32. Do you think that eating more fruits and vegetables will help reduce your risk of cancer? 0=no or don’t know, 1=yes
0.19 0.1688
0.11 0.4081
0.19 0.1831
0.08 0.5615
-0.13 0.3504
-0.01 0.9215
33. Do you think that eating more fruits and vegetables will help reduce your risk of heart disease? 0=no or don’t know, 1=yes
0.28 0.0407*
0.13 0.3377
-0.04 0.7676
0.06 0.6468
0.15 0.2798
0.06 0.6694
34. Do you think if you improved the way you eat, that you would be a much healthier person? 0=no or don’t know, 1=yes
0.18 0.1948
0.08 0.5678
0.10 0.4705
0.10 0.4693
-0.17 0.2416
0.03 0.8282
35. Do you think that your grocery store has a wide selection of fruits and vegetables? 0=no or don’t know, 1=yes
-0.10 0.4617
0.14 0.3279
0.02 0.8752
0.02 0.8791
0.08 0.5739
0.01 0.9522
36. How many fruits and vegetables should people eat each day? 0= 1, 2, 3, 4 a day or don’t know, 1= 5 or more
0.21 0.1192
0.16 0.2468
-0.11 0.4170
0.02 0.8710
0.14 0.3247
-0.20 0.1453
37. Do you like the way most vegetables taste? 0=no, 1=yes
-0.07 0.6321
0.25 0.0636
0.04 0.7633
-0.004 0.9742
0.20 0.1527
0.22 0.1112
38. Do you have tooth or mouth problems that make you usually eat easy-to-chew fruits and vegetables? 0=yes, 1=no
0.15 0.2668
-0.11 0.4364
-0.02 0.8777
0.10 0.4873
-0.06 0.6591
-0.06 0.6736
39. Do you have enough money to spend on fruits and vegetables? 0=no, 1=yes
0.20 0.1577
0.06 0.8466
0.01 0.9226
0.04 0.8007
0.01 0.9425
-0.14 0.3342
40. Would you like to know more about which fruits and vegetables are good for your health? 0=no, 1=yes
-0.01 0.9261
0.16 0.2461
0.19 0.1796
0.06 0.6639
0.21 0.1281
0.16 0.2424
41. Would you like to know more about different ways to cook vegetables? 0=no, 1=yes
0.14 0.3192
0.20 0.1454
-0.02 0.8997
0.07 0.6062
-0.18 0.1900
-0.01 0.9264
42. Would you like a handout with healthy menus to take home? 0=no, 1=yes
0.18 0.1857
-0.05 0.6994
0.07 0.6157
0.02 0.9090
0.06 0.6996
-0.13 0.3508
Which of these kitchen tools can you easily use to cook vegetables at home?
43. Sharp knife? 0=no, 1=yes 0.08
0.5613 -0.05
0.7067 0.12
0.3837 -0.15
0.2635 0.04
0.7799 -0.10
0.4622 44. Can opener? 0=no, 1=yes 0.02
0.8758 -0.14
0.3179 0.04
0.7908 -0.17
0.2182 0.12
0.3813 0.12
0.3971

105
TIME 1 BARRIERS
26. Fresh fruit
27. Frozen fruit
28. Canned fruit
29. Fresh vegetables
30. Frozen vegetables
31. Canned vegetables
45. Pot of hot water? 0=no, 1=yes 0.20 0.1505
0.02 0.8682
0.20 0.1545
0.01 0.9570
0.25 0.0747
0.11 0.4267
46. Do you shop for your own groceries? 0=no, 1=yes -0.08 0.5928
-0.15 0.2776
0.10 0.4910
-0.16 0.2537
0.05 0.7119
-0.003 0.9828
48. Do you plan the meals you eat? 0=no, 1=yes 0.08 0.5700
-0.21 0.1312
0.02 0.8715
-0.03 0.8462
-0.11 0.4407
-0.21 0.1253
49. Do you cook the meals you eat? 0=no, 1=yes 0.03 0.8287
-0.05 0.7321
0.04 0.7617
-0.10 0.4765
-0.08 0.5662
-0.19 0.1763
50. Do you use a microwave at home? 0=no, 1=yes 0.29 0.0363*
-0.09 0.5224
-0.05 0.7177
0.06 0.6896
-0.17 0.2169
-0.22 0.1198
51. Do you use a stove at home? 0=no, 1=yes 0.21 0.1256
-0.01 0.9166
-0.17 0.2209
-0.004 0.9761
-0.22 0.1257
-0.19 0.1832
Do you have or have you ever had any of the following?
52.Diabetes? 0=yes, 1=no -0.20 0.1445
-0.002 0.9899
0.03 0.8578
-0.19 0.1577
0.07 0.6131
-0.05 0.7127
53. Cancer? 0=yes, 1=no 0.02 0.9139
-0.02 0.8577
0.14 0.3286
-0.14 0.3201
-0.01 0.9684
0.20 0.1616
54. Heart disease or heart attack? 0=yes, 1=no -0.23 0.0995
0.24 0.0810
0.07 0.5946
-0.18 0.1838
-0.12 0.3886
0.07 0.6432
55. High blood cholesterol? 0=yes, 1=no -0.12 0.3868
0.01 0.9514
0.18 0.2045
0.02 0.8618
0.15 0.2912
-0.14 0.3118
56. High blood pressure or hypertension? 0=yes, 1=no -0.08 0.5863
-0.15 0.2716
-0.20 0.1508
-0.20 0.1411
0.13 0.3471
0.11 0.4417

106
SUMMARY SCORES
TIME 1 BARRIERS AllFV AllFr AllVeg HiVitACar HiVitC HiLutZea HiLycop 32. Do you think that eating more fruits and vegetables will help reduce your risk of cancer? 0=no or don’t know, 1=yes
0.10 0.4722
0.11 0.4471
0.04 0.7888
0.16 0.2534
0.13 0.3464
0.15 0.2654
-0.07 0.5944
33. Do you think that eating more fruits and vegetables will help reduce your risk of heart disease? 0=no or don’t know, 1=yes
0.13 0.3498
0.07 0.6253
0.17 0.2144
0.20 0.1436
0.16 0.2440
0.26 0.0610
0.05 0.7437
34. Do you think if you improved the way you eat, that you would be a much healthier person? 0=no or don’t know, 1=yes
0.28 0.0401*
0.12 0.3816
0.28 0.0401*
0.17 0.2224
0.17 0.2160
0.26 0.0625
0.08 0.5680
35. Do you think that your grocery store has a wide selection of fruits and vegetables? 0=no or don’t know, 1=yes
0.08 0.5525
0.07 0.5940
0.05 0.7346
0.13 0.3736
0.19 0.5186
0.17 0.2361
-0.03 0.8526
36. How many fruits and vegetables should people eat each day? 0= 1, 2, 3, 4 a day or don’t know, 1= 5 or more
-0.24 0.0887
-0.27 0.0505
-0.08 0.5705
-0.07 0.7919
-0.22 0.1086
-0.07 0.6272
-0.10 0.4830
37. Do you like the way most vegetables taste? 0=no, 1=yes
-0.02 0.8795
-0.10 0.4760
0.06 0.6726
-0.10 0.4713
-0.03 0.8201
0.09 0.5260
0.18 0.1853
38. Do you have tooth or mouth problems that make you usually eat easy-to-chew fruits and vegetables? 0=yes, 1=no
-0.03 0.8266
-0.15 0.2941
0.11 0.4360
-0.01 0.9361
-0.10 0.5100
-0.01 0.9215
0.04 0.7665
39. Do you have enough money to spend on fruits and vegetables? 0=no, 1=yes
-0.22 0.1169
-0.22 0.1064
-0.15 0.3053
-0.08 0.5616
-0.24 0.0899
-0.02 0.8741
-0.06 0.6945
40. Would you like to know more about which fruits and vegetables are good for your health? 0=no, 1=yes
-0.17 0.2322
-0.22 0.1172
0.01 0.9641
0.04 0.7510
-0.12 0.3736
0.22 0.1063
0.17 0.2223
41. Would you like to know more about different ways to cook vegetables? 0=no, 1=yes
0.11 0.4243
0.06 0.6604
0.07 0.6394
0.17 0.2222
0.16 0.2448
0.20 0.1575
0.10 0.4751
Which of these kitchen tools can you easily use to cook vegetables at home?
43. Sharp knife? 0=no, 1=yes -0.04
0.7754 -0.12
0.3913 -0.02
0.8763 -0.004 0.9792
-0.03 0.8154
-0.08 0.5836
-0.11 0.4190
44. Can opener? 0=no, 1=yes -0.01 0.9707
-0.13 0.3569
0.09 0.5390
-0.01 0.9508
-0.09 0.5308
0.01 0.9538
-0.05 0.7182
45. Pot of hot water? 0=no, 1=yes -0.04 0.7448
-0.18 0.1881
0.11 0.4509
0.20 0.1576
0.02 0.9106
0.19 0.1796
0.08 0.5899

107
SUMMARY SCORES TIME 1 BARRIERS AllFV AllFr AllVeg HiVitACar HiVitC HiLutZea HiLycop
46. Do you shop for your own groceries? 0=no, 1=yes
-0.07 0.6017
-0.22 0.1131
0.02 0.8675
-0.01 0.9415
-0.12 0.4143
0.04 0.7548
-0.12 0.3936
48. Do you plan the meals you eat? 0=no, 1=yes -0.005 0.9732
-0.17 0.2070
0.06 0.6778
0.02 0.8656
-0.07 0.6210
-0.06 0.6676
-0.18 0.2004
49. Do you cook the meals you eat? 0=no, 1=yes 0.06 0.6497
-0.08 0.5502
0.14 0.3243
0.14 0.3094
0.02 0.8636
0.06 0.6677
-0.04 0.7889
50. Do you use a microwave at home? 0=no, 1=yes
-0.17 0.2363
-0.16 0.2624
-0.13 0.3617
-0.20 0.1504
-0.23 0.0993
-0.28 0.0427
-0.06 0.6758
51. Do you use a stove at home? 0=no, 1=yes 0.07 0.5987
-0.04 0.7567
0.09 0.5373
0.08 0.5860
0.04 0.7523
0.04 0.7884
-0.04 0.7533
Do you have or have you ever had any of the following? 52.Diabetes? 0=yes, 1=no -0.21
0.1363 -0.13
0.3406 -0.09
0.5089 -0.26
0.0624 -0.25
0.0681 -0.23
0.0879 -0.04
0.7783 53. Cancer? 0=yes, 1=no -0.01
0.9219 0.05
0.6964 -0.13
0.3688 -0.07
0.5954 0.01
0.9511 0.01
0.9169 0.07
0.6082 54. Heart disease or heart attack? 0=yes, 1=no 0.00
1.0000 0.02
0.9037 -0.04
0.7876 -0.03
0.8039 0.03
0.8136 0.10
0.4617 -0.03
0.8146 55. High blood cholesterol? 0=yes, 1=no 0.14
0.3254 0.17
0.2169 0.10
0.4739 0.19
0.1736 0.08
0.5538 0.06
0.6583 0.03
0.8551 56. High blood pressure or hypertension? 0=yes, 1=no
-0.21 0.1255
-0.26 0.0551
-0.08 0.5582
-0.13 0.3616
-0.30 0.0268
-0.25 0.0647
-0.22 0.1121
Correlation Color Key
Correlation & p-value
BLUE
Positive; p < 0.05
PINK
Positive; p=0.05-0.19
GREEN
Negative; p < 0.05 & p=0.05-0.19

108
Table 10. Spearman Correlations among Fruit and Vegetable Intake and Time 2 Barriers
TIME 2 BARRIERS
7. 100% orange juice
8. 100% cran, app,
purple grape juice
9. Berries
10. Peaches,
nectarines, or apricots
11. Broccoli, cabbage,
oauliflower
12. Cantaloup
e, honeydew
13. Leafy greens
14. Corn 15. Cooked or stewed tomatoes
16. Spaghett
i or lasagna
32. Do you think that eating more fruits and vegetables will help reduce your risk of cancer? 0=no or don’t know, 1=yes
-0.05 0.7431
-0.06 0.7317
0.19 0.2421
0.29 0.0684
0.22 0.1630
-0.02 0.9081
-0.03 0.8614
-0.07 0.6518
-0.08 0.6326
0.17 0.2961
33. Do you think that eating more fruits and vegetables will help reduce your risk of heart disease? 0=no or don’t know, 1=yes
0.14 0.3871
-0.29 0.0726
-0.12 0.4769
0.05 0.7660
0.08 0.6443
0.05 0.7572
0.13 0.4240
-0.03 0.8348
-0.06 0.7315
0.03 0.8588
34. Do you think if you improved the way you eat, that you would be a much healthier person? 0=no or don’t know, 1=yes
-0.12 0.4699
0.11 0.4930
0.07 0.6573
-0.10 0.5339
-0.16 0.3315
-0.13 0.4184
-0.19 0.2346
0.01 0.9489
0.14 0.3936
-0.06 0.7367
35. Do you think that your grocery store has a wide selection of fruits and vegetables? 0=no or don’t know, 1=yes
0.26 0.1124
0.25 0.1271
0.10 0.5454
0.11 0.4944
0.26 0.1076
0.07 0.6510
0.21 0.1842
0.41 0.0079*
0.04 0.8295
0.17 0.2961
36. How many fruits and vegetables should people eat each day? 0= 1, 2, 3, 4 a day or don’t know, 1= 5 or more
0.33 0.0449*
0.18 0.2755
-0.06 0.7009
0.05 0.7603
-0.02 0.9112
0.32 0.0423*
0.25 0.1271
-0.13 0.4201
-0.17 0.2938
0.18 0.2748
57. Have you increased your overall consumption of fruit or fruit juice (fresh, frozen, and canned)? 0=no or don’t know, 1=yes
0.48 0.0026*
0.27 0.0935
0.20 0.2202
0.08 0.6148
0.27 0.0888
-0.09 0.5993
0.15 0.3538
0.17 0.2766
0.29 0.0704
0.36 0.0275*
58. Have you increased your overall consumption of vegetables (fresh, frozen, and canned)? 0=no or don’t know, 1=yes
0.21 0.1988
0.25 0.1134
0.41 0.0088*
0.17 0.2881
0.26 0.0990
-0.30 0.0644
0.16 0.3167
0.38 0.0144*
0.26 0.1058
0.12 0.4658
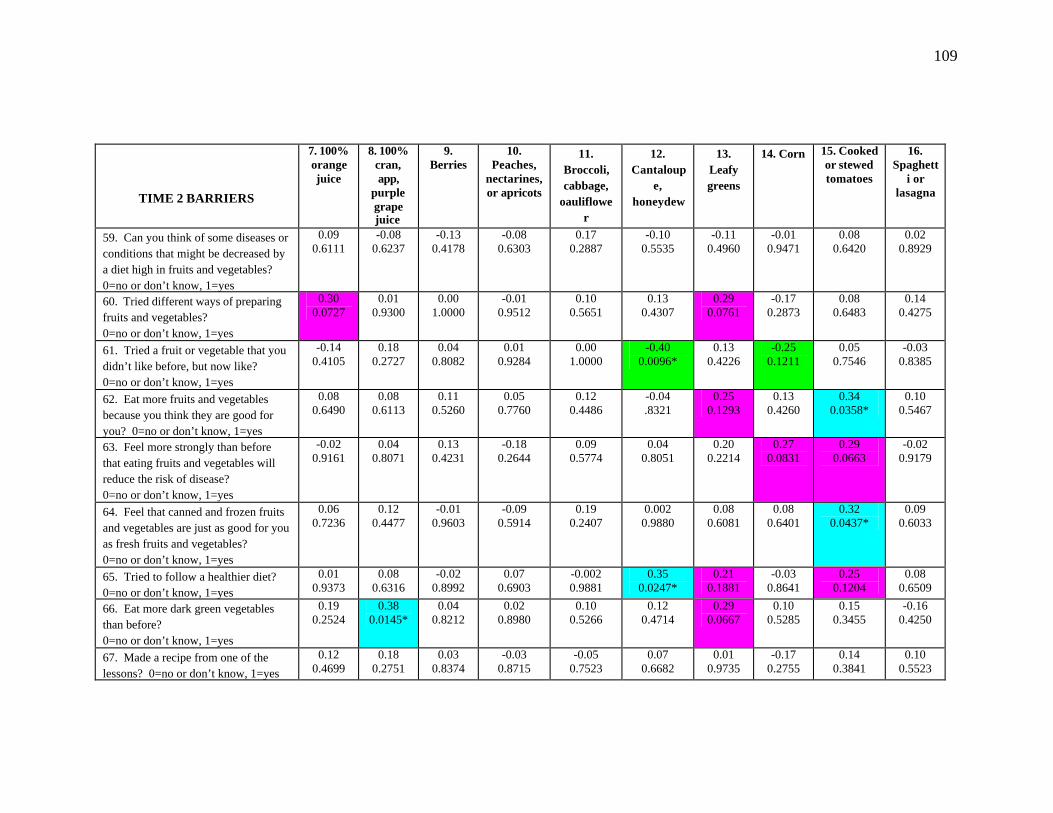
109
TIME 2 BARRIERS
7. 100% orange juice
8. 100% cran, app,
purple grape juice
9. Berries
10. Peaches,
nectarines, or apricots
11. Broccoli, cabbage,
oauliflower
12. Cantaloup
e, honeydew
13. Leafy greens
14. Corn 15. Cooked or stewed tomatoes
16. Spaghett
i or lasagna
59. Can you think of some diseases or conditions that might be decreased by a diet high in fruits and vegetables? 0=no or don’t know, 1=yes
0.09 0.6111
-0.08 0.6237
-0.13 0.4178
-0.08 0.6303
0.17 0.2887
-0.10 0.5535
-0.11 0.4960
-0.01 0.9471
0.08 0.6420
0.02 0.8929
60. Tried different ways of preparing fruits and vegetables? 0=no or don’t know, 1=yes
0.30 0.0727
0.01 0.9300
0.00 1.0000
-0.01 0.9512
0.10 0.5651
0.13 0.4307
0.29 0.0761
-0.17 0.2873
0.08 0.6483
0.14 0.4275
61. Tried a fruit or vegetable that you didn’t like before, but now like? 0=no or don’t know, 1=yes
-0.14 0.4105
0.18 0.2727
0.04 0.8082
0.01 0.9284
0.00 1.0000
-0.40 0.0096*
0.13 0.4226
-0.25 0.1211
0.05 0.7546
-0.03 0.8385
62. Eat more fruits and vegetables because you think they are good for you? 0=no or don’t know, 1=yes
0.08 0.6490
0.08 0.6113
0.11 0.5260
0.05 0.7760
0.12 0.4486
-0.04 .8321
0.25 0.1293
0.13 0.4260
0.34 0.0358*
0.10 0.5467
63. Feel more strongly than before that eating fruits and vegetables will reduce the risk of disease? 0=no or don’t know, 1=yes
-0.02 0.9161
0.04 0.8071
0.13 0.4231
-0.18 0.2644
0.09 0.5774
0.04 0.8051
0.20 0.2214
0.27 0.0831
0.29 0.0663
-0.02 0.9179
64. Feel that canned and frozen fruits and vegetables are just as good for you as fresh fruits and vegetables? 0=no or don’t know, 1=yes
0.06 0.7236
0.12 0.4477
-0.01 0.9603
-0.09 0.5914
0.19 0.2407
0.002 0.9880
0.08 0.6081
0.08 0.6401
0.32 0.0437*
0.09 0.6033
65. Tried to follow a healthier diet? 0=no or don’t know, 1=yes
0.01 0.9373
0.08 0.6316
-0.02 0.8992
0.07 0.6903
-0.002 0.9881
0.35 0.0247*
0.21 0.1881
-0.03 0.8641
0.25 0.1204
0.08 0.6509
66. Eat more dark green vegetables than before? 0=no or don’t know, 1=yes
0.19 0.2524
0.38 0.0145*
0.04 0.8212
0.02 0.8980
0.10 0.5266
0.12 0.4714
0.29 0.0667
0.10 0.5285
0.15 0.3455
-0.16 0.4250
67. Made a recipe from one of the lessons? 0=no or don’t know, 1=yes
0.12 0.4699
0.18 0.2751
0.03 0.8374
-0.03 0.8715
-0.05 0.7523
0.07 0.6682
0.01 0.9735
-0.17 0.2755
0.14 0.3841
0.10 0.5523

110
TIME 2 BARRIERS
7. 100% orange juice
8. 100% cran, app,
purple grape juice
9. Berries
10. Peaches,
nectarines, or apricots
11. Broccoli, cabbage,
oauliflower
12. Cantaloup
e, honeydew
13. Leafy greens
14. Corn 15. Cooked or stewed tomatoes
16. Spaghett
i or lasagna
69. How many sessions of the fruit and vegetable nutrition education program did the participant attend? 0= 0-4 sessions, 1= 5-10 sessions
0.10 0.5478
-0.13 0.4224
0.01 0.9667
0.06 0.7034
0.13 0.4269
-0.07 0.6550
-0.04 0.8209
0.01 0.9732
-0.22 0.1747
0.25 0.1269
71. How many prescription medications do you take every day? 0= > 4 meds per day, 1= 0-3 meds per day
0.18 0.2883
0.15 0.3474
0.23 0.1628
0.04 0.8303
-0.09 0.5703
0.04 0.7989
0.17 0.2865
-0.14 0.3953
0.03 0.8426
0.05 0.7600
72. Are you able to detect a taste (using the PTC-impregnated strip)? What is the intensity of the taste? 0= Strong taste (supertaster) ; 1= No taste, slight taste, or moderate taste
0.23 0.1661
0.13 0.4121
0.06 0.7085
0.07 0.6712
0.31 0.0533
-0.22 0.1822
0.03 0.8352
0.09 0.5854
0.32 0.0422*
0.10 0.5647
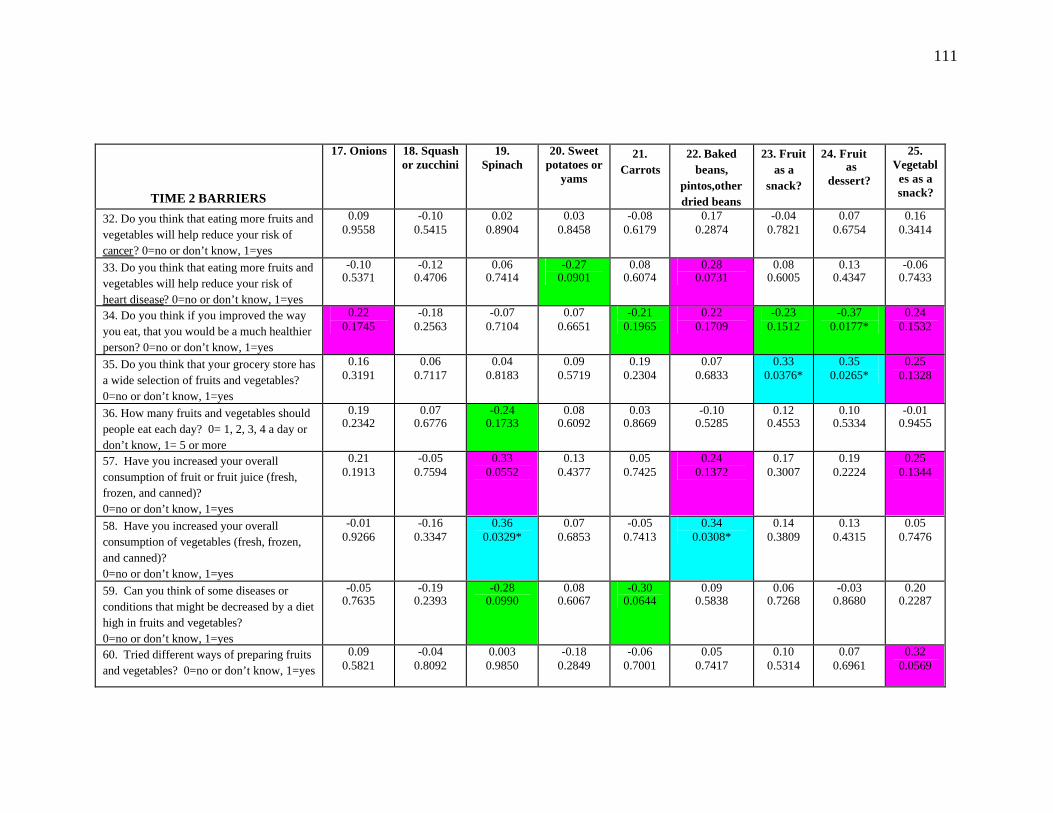
111
TIME 2 BARRIERS
17. Onions 18. Squash or zucchini
19. Spinach
20. Sweet potatoes or
yams
21. Carrots
22. Baked beans,
pintos,other dried beans
23. Fruit as a
snack?
24. Fruit as
dessert?
25. Vegetables as a snack?
32. Do you think that eating more fruits and vegetables will help reduce your risk of cancer? 0=no or don’t know, 1=yes
0.09 0.9558
-0.10 0.5415
0.02 0.8904
0.03 0.8458
-0.08 0.6179
0.17 0.2874
-0.04 0.7821
0.07 0.6754
0.16 0.3414
33. Do you think that eating more fruits and vegetables will help reduce your risk of heart disease? 0=no or don’t know, 1=yes
-0.10 0.5371
-0.12 0.4706
0.06 0.7414
-0.27 0.0901
0.08 0.6074
0.28 0.0731
0.08 0.6005
0.13 0.4347
-0.06 0.7433
34. Do you think if you improved the way you eat, that you would be a much healthier person? 0=no or don’t know, 1=yes
0.22 0.1745
-0.18 0.2563
-0.07 0.7104
0.07 0.6651
-0.21 0.1965
0.22 0.1709
-0.23 0.1512
-0.37 0.0177*
0.24 0.1532
35. Do you think that your grocery store has a wide selection of fruits and vegetables? 0=no or don’t know, 1=yes
0.16 0.3191
0.06 0.7117
0.04 0.8183
0.09 0.5719
0.19 0.2304
0.07 0.6833
0.33 0.0376*
0.35 0.0265*
0.25 0.1328
36. How many fruits and vegetables should people eat each day? 0= 1, 2, 3, 4 a day or don’t know, 1= 5 or more
0.19 0.2342
0.07 0.6776
-0.24 0.1733
0.08 0.6092
0.03 0.8669
-0.10 0.5285
0.12 0.4553
0.10 0.5334
-0.01 0.9455
57. Have you increased your overall consumption of fruit or fruit juice (fresh, frozen, and canned)? 0=no or don’t know, 1=yes
0.21 0.1913
-0.05 0.7594
0.33 0.0552
0.13 0.4377
0.05 0.7425
0.24 0.1372
0.17 0.3007
0.19 0.2224
0.25 0.1344
58. Have you increased your overall consumption of vegetables (fresh, frozen, and canned)? 0=no or don’t know, 1=yes
-0.01 0.9266
-0.16 0.3347
0.36 0.0329*
0.07 0.6853
-0.05 0.7413
0.34 0.0308*
0.14 0.3809
0.13 0.4315
0.05 0.7476
59. Can you think of some diseases or conditions that might be decreased by a diet high in fruits and vegetables? 0=no or don’t know, 1=yes
-0.05 0.7635
-0.19 0.2393
-0.28 0.0990
0.08 0.6067
-0.30 0.0644
0.09 0.5838
0.06 0.7268
-0.03 0.8680
0.20 0.2287
60. Tried different ways of preparing fruits and vegetables? 0=no or don’t know, 1=yes
0.09 0.5821
-0.04 0.8092
0.003 0.9850
-0.18 0.2849
-0.06 0.7001
0.05 0.7417
0.10 0.5314
0.07 0.6961
0.32 0.0569
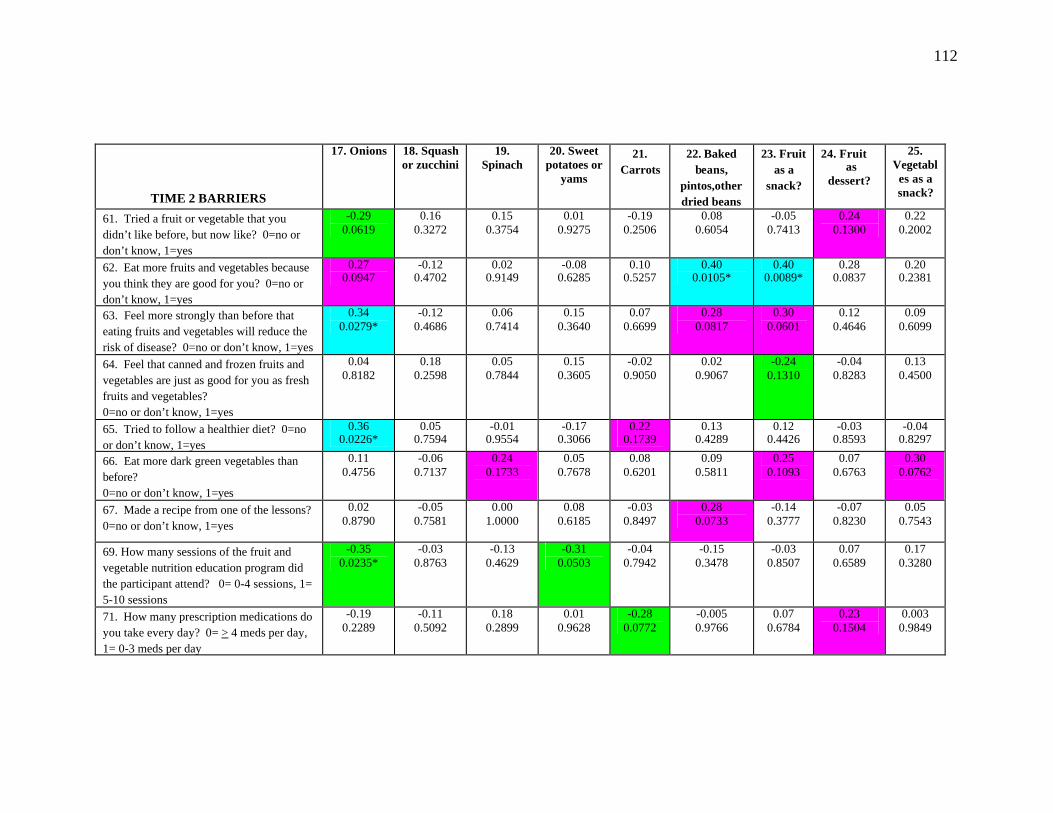
112
TIME 2 BARRIERS
17. Onions 18. Squash or zucchini
19. Spinach
20. Sweet potatoes or
yams
21. Carrots
22. Baked beans,
pintos,other dried beans
23. Fruit as a
snack?
24. Fruit as
dessert?
25. Vegetables as a snack?
61. Tried a fruit or vegetable that you didn’t like before, but now like? 0=no or don’t know, 1=yes
-0.29 0.0619
0.16 0.3272
0.15 0.3754
0.01 0.9275
-0.19 0.2506
0.08 0.6054
-0.05 0.7413
0.24 0.1300
0.22 0.2002
62. Eat more fruits and vegetables because you think they are good for you? 0=no or don’t know, 1=yes
0.27 0.0947
-0.12 0.4702
0.02 0.9149
-0.08 0.6285
0.10 0.5257
0.40 0.0105*
0.40 0.0089*
0.28 0.0837
0.20 0.2381
63. Feel more strongly than before that eating fruits and vegetables will reduce the risk of disease? 0=no or don’t know, 1=yes
0.34 0.0279*
-0.12 0.4686
0.06 0.7414
0.15 0.3640
0.07 0.6699
0.28 0.0817
0.30 0.0601
0.12 0.4646
0.09 0.6099
64. Feel that canned and frozen fruits and vegetables are just as good for you as fresh fruits and vegetables? 0=no or don’t know, 1=yes
0.04 0.8182
0.18 0.2598
0.05 0.7844
0.15 0.3605
-0.02 0.9050
0.02 0.9067
-0.24 0.1310
-0.04 0.8283
0.13 0.4500
65. Tried to follow a healthier diet? 0=no or don’t know, 1=yes
0.36 0.0226*
0.05 0.7594
-0.01 0.9554
-0.17 0.3066
0.22 0.1739
0.13 0.4289
0.12 0.4426
-0.03 0.8593
-0.04 0.8297
66. Eat more dark green vegetables than before? 0=no or don’t know, 1=yes
0.11 0.4756
-0.06 0.7137
0.24 0.1733
0.05 0.7678
0.08 0.6201
0.09 0.5811
0.25 0.1093
0.07 0.6763
0.30 0.0762
67. Made a recipe from one of the lessons? 0=no or don’t know, 1=yes
0.02 0.8790
-0.05 0.7581
0.00 1.0000
0.08 0.6185
-0.03 0.8497
0.28 0.0733
-0.14 0.3777
-0.07 0.8230
0.05 0.7543
69. How many sessions of the fruit and vegetable nutrition education program did the participant attend? 0= 0-4 sessions, 1= 5-10 sessions
-0.35 0.0235*
-0.03 0.8763
-0.13 0.4629
-0.31 0.0503
-0.04 0.7942
-0.15 0.3478
-0.03 0.8507
0.07 0.6589
0.17 0.3280
71. How many prescription medications do you take every day? 0= > 4 meds per day, 1= 0-3 meds per day
-0.19 0.2289
-0.11 0.5092
0.18 0.2899
0.01 0.9628
-0.28 0.0772
-0.005 0.9766
0.07 0.6784
0.23 0.1504
0.003 0.9849
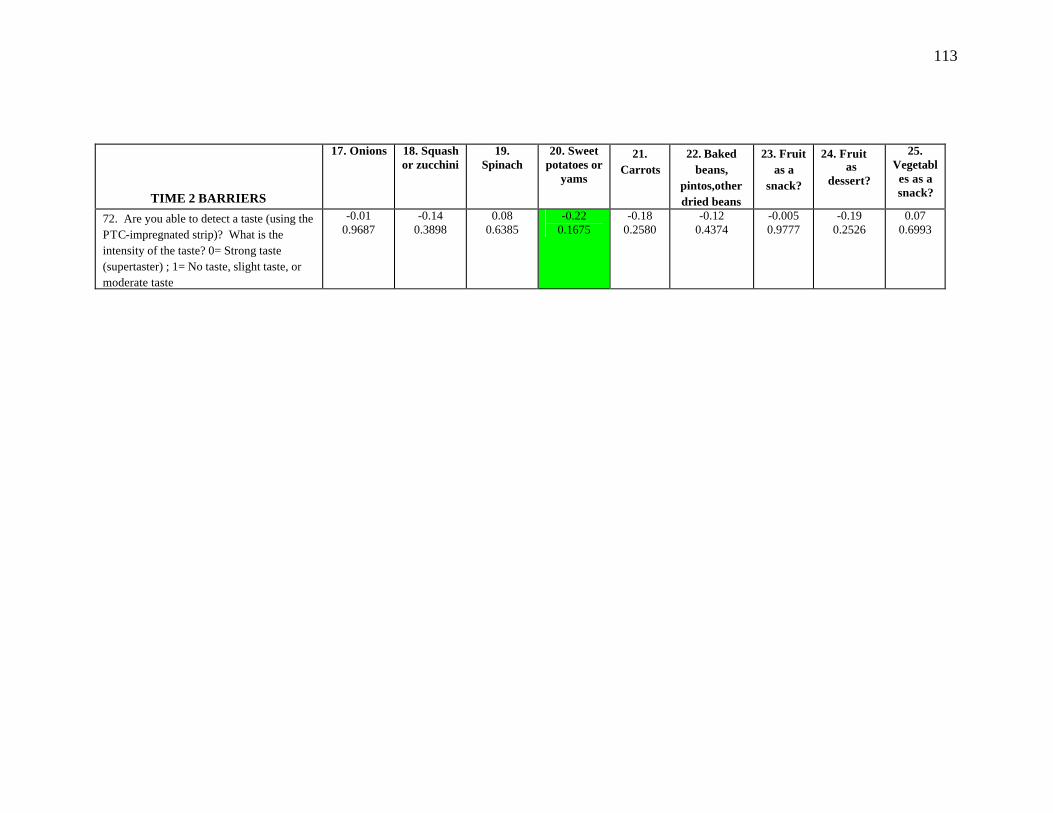
113
TIME 2 BARRIERS
17. Onions 18. Squash or zucchini
19. Spinach
20. Sweet potatoes or
yams
21. Carrots
22. Baked beans,
pintos,other dried beans
23. Fruit as a
snack?
24. Fruit as
dessert?
25. Vegetables as a snack?
72. Are you able to detect a taste (using the PTC-impregnated strip)? What is the intensity of the taste? 0= Strong taste (supertaster) ; 1= No taste, slight taste, or moderate taste
-0.01 0.9687
-0.14 0.3898
0.08 0.6385
-0.22 0.1675
-0.18 0.2580
-0.12 0.4374
-0.005 0.9777
-0.19 0.2526
0.07 0.6993
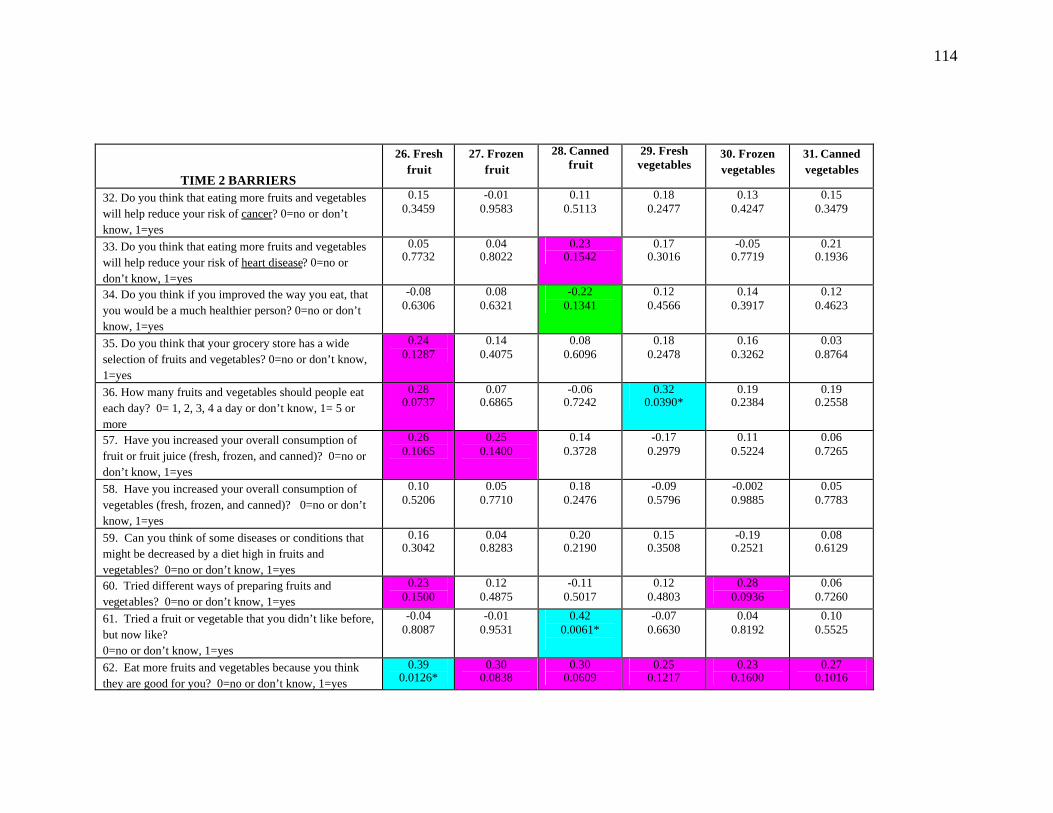
114
TIME 2 BARRIERS
26. Fresh fruit
27. Frozen fruit
28. Canned fruit
29. Fresh vegetables
30. Frozen vegetables
31. Canned vegetables
32. Do you think that eating more fruits and vegetables will help reduce your risk of cancer? 0=no or don’t know, 1=yes
0.15 0.3459
-0.01 0.9583
0.11 0.5113
0.18 0.2477
0.13 0.4247
0.15 0.3479
33. Do you think that eating more fruits and vegetables will help reduce your risk of heart disease? 0=no or don’t know, 1=yes
0.05 0.7732
0.04 0.8022
0.23 0.1542
0.17 0.3016
-0.05 0.7719
0.21 0.1936
34. Do you think if you improved the way you eat, that you would be a much healthier person? 0=no or don’t know, 1=yes
-0.08 0.6306
0.08 0.6321
-0.22 0.1341
0.12 0.4566
0.14 0.3917
0.12 0.4623
35. Do you think that your grocery store has a wide selection of fruits and vegetables? 0=no or don’t know, 1=yes
0.24 0.1287
0.14 0.4075
0.08 0.6096
0.18 0.2478
0.16 0.3262
0.03 0.8764
36. How many fruits and vegetables should people eat each day? 0= 1, 2, 3, 4 a day or don’t know, 1= 5 or more
0.28 0.0737
0.07 0.6865
-0.06 0.7242
0.32 0.0390*
0.19 0.2384
0.19 0.2558
57. Have you increased your overall consumption of fruit or fruit juice (fresh, frozen, and canned)? 0=no or don’t know, 1=yes
0.26 0.1065
0.25 0.1400
0.14 0.3728
-0.17 0.2979
0.11 0.5224
0.06 0.7265
58. Have you increased your overall consumption of vegetables (fresh, frozen, and canned)? 0=no or don’t know, 1=yes
0.10 0.5206
0.05 0.7710
0.18 0.2476
-0.09 0.5796
-0.002 0.9885
0.05 0.7783
59. Can you think of some diseases or conditions that might be decreased by a diet high in fruits and vegetables? 0=no or don’t know, 1=yes
0.16 0.3042
0.04 0.8283
0.20 0.2190
0.15 0.3508
-0.19 0.2521
0.08 0.6129
60. Tried different ways of preparing fruits and vegetables? 0=no or don’t know, 1=yes
0.23 0.1500
0.12 0.4875
-0.11 0.5017
0.12 0.4803
0.28 0.0936
0.06 0.7260
61. Tried a fruit or vegetable that you didn’t like before, but now like? 0=no or don’t know, 1=yes
-0.04 0.8087
-0.01 0.9531
0.42 0.0061*
-0.07 0.6630
0.04 0.8192
0.10 0.5525
62. Eat more fruits and vegetables because you think they are good for you? 0=no or don’t know, 1=yes
0.39 0.0126*
0.30 0.0838
0.30 0.0609
0.25 0.1217
0.23 0.1600
0.27 0.1016
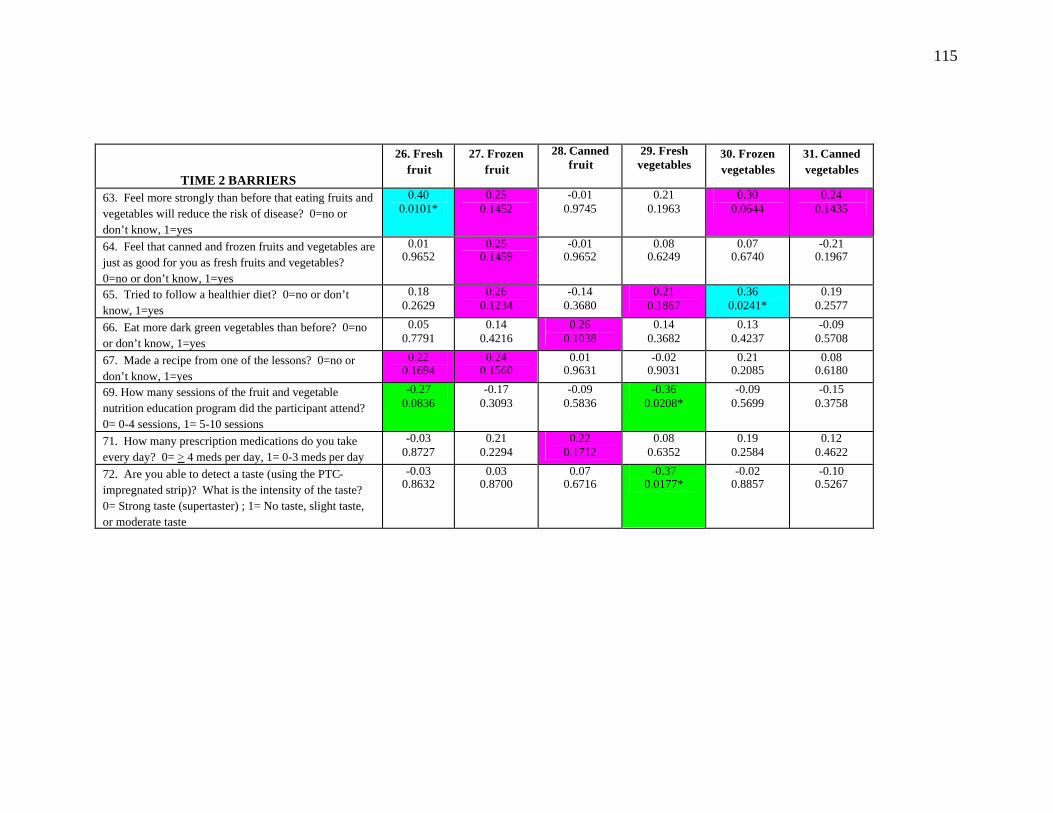
115
TIME 2 BARRIERS
26. Fresh fruit
27. Frozen fruit
28. Canned fruit
29. Fresh vegetables
30. Frozen vegetables
31. Canned vegetables
63. Feel more strongly than before that eating fruits and vegetables will reduce the risk of disease? 0=no or don’t know, 1=yes
0.40 0.0101*
0.25 0.1452
-0.01 0.9745
0.21 0.1963
0.30 0.0644
0.24 0.1435
64. Feel that canned and frozen fruits and vegetables are just as good for you as fresh fruits and vegetables? 0=no or don’t know, 1=yes
0.01 0.9652
0.25 0.1459
-0.01 0.9652
0.08 0.6249
0.07 0.6740
-0.21 0.1967
65. Tried to follow a healthier diet? 0=no or don’t know, 1=yes
0.18 0.2629
0.26 0.1234
-0.14 0.3680
0.21 0.1867
0.36 0.0241*
0.19 0.2577
66. Eat more dark green vegetables than before? 0=no or don’t know, 1=yes
0.05 0.7791
0.14 0.4216
0.26 0.1038
0.14 0.3682
0.13 0.4237
-0.09 0.5708
67. Made a recipe from one of the lessons? 0=no or don’t know, 1=yes
0.22 0.1694
0.24 0.1560
0.01 0.9631
-0.02 0.9031
0.21 0.2085
0.08 0.6180
69. How many sessions of the fruit and vegetable nutrition education program did the participant attend? 0= 0-4 sessions, 1= 5-10 sessions
-0.27 0.0836
-0.17 0.3093
-0.09 0.5836
-0.36 0.0208*
-0.09 0.5699
-0.15 0.3758
71. How many prescription medications do you take every day? 0= > 4 meds per day, 1= 0-3 meds per day
-0.03 0.8727
0.21 0.2294
0.22 0.1712
0.08 0.6352
0.19 0.2584
0.12 0.4622
72. Are you able to detect a taste (using the PTC-impregnated strip)? What is the intensity of the taste? 0= Strong taste (supertaster) ; 1= No taste, slight taste, or moderate taste
-0.03 0.8632
0.03 0.8700
0.07 0.6716
-0.37 0.0177*
-0.02 0.8857
-0.10 0.5267

116
SUMMARY SCORES
TIME 2 BARRIERS AllFV AllFr AllVeg HiVitACar HiVitC HiLutZea HiLycop 32. Do you think that eating more fruits and vegetables will help reduce your risk of cancer? 0=no or don’t know, 1=yes
-0.04 0.8319
-0.004 0.9829
-0.01 0.9470
0.004 0.9823
-0.04 0.8371
0.03 0.8573
-0.07 0.6970
33. Do you think that eating more fruits and vegetables will help reduce your risk of heart disease? 0=no or don’t know, 1=yes
-0.05 0.7822
-0.02 0.9080
-0.03 0.8735
0.02 0.9204
-0.02 0.9181
0.13 0.4653
-0.10 0.5607
34. Do you think if you improved the way you eat, that you would be a much healthier person? 0=no or don’t know, 1=yes
-0.16 0.3688
-0.19 0.2873
-0.07 0.7051
-0.14 0.4219
-0.14 0.4264
-0.17 0.3390
0.02 0.9159
35. Do you think that your grocery store has a wide selection of fruits and vegetables? 0=no or don’t know, 1=yes
0.35 0.0515
0.27 0.1225
0.37 0.0309*
0.24 0.1760
0.22 0.2294
0.14 0.4161
0.23 0.1642
36. How many fruits and vegetables should people eat each day? 0= 1, 2, 3, 4 a day or don’t know, 1= 5 or more
0.31 0.0827
0.31 0.0688
0.14 0.4323
-0.02 0.8890
0.18 0.3279
-0.06 0.7508
-0.01 0.9628
57. Have you increased your overall consumption of fruit or fruit juice (fresh, frozen, and canned)? 0=no or don’t know, 1=yes
0.51 0.0030*
0.42 0.0125*
0.32 0.0667
0.21 0.2413
0.44 0.0102*
0.35 0.0451*
0.38 0.0216*
58. Have you increased your overall consumption of vegetables (fresh, frozen, and canned)? 0=no or don’t know, 1=yes
0.23 0.1969
0.22 0.2056
0.11 0.5415
0.08 0.6339
0.23 0.2030
0.38 0.0270*
0.20 0.2267
59. Can you think of some diseases or conditions that might be decreased by a diet high in fruits and vegetables? 0=no or don’t know, 1=yes
-0.11 0.5547
-0.08 0.6617
0.03 0.8524
-0.20 0.2504
0.04 0.8324
-0.19 0.2829
0.00 1.0000
60. Tried different ways of preparing fruits and vegetables? 0=no or don’t know, 1=yes
0.25 0.1876
0.18 0.3198
0.18 0.3242
0.11 0.5519
0.27 0.1455
0.14 0.4513
0.12 0.4796
61. Tried a fruit or vegetable that you didn’t like before, but now like? 0=no or don’t know, 1=yes
-0.13 0.4853
-0.17 0.3169
0.02 0.9282
0.10 0.5888
-0.11 0.5512
0.19 0.2881
-0.08 0.6582
63. Feel more strongly than before that eating fruits and vegetables will reduce the risk of disease? 0=no or don’t know, 1=yes
0.09 0.6395
-0.11 0.5280
0.32 0.0725
0.23 0.1812
0.02 0.9181
0.13 0.4653
0.32 0.0574
64. Feel that canned and frozen fruits and vegetables are just as good for you as fresh fruits and vegetables? 0=no or don’t know, 1=yes
0.19 0.3070
0.10 0.5762
0.31 0.0758
0.09 0.6113
0.20 0.2698
0.08 0.6732
0.27 0.1101
65. Tried to follow a healthier diet? 0=no or don’t know, 1=yes 0.22 0.2238
0.04 0.8379
0.30 0.0825
0.15 0.3919
0.0716 0.6944
0.05 0.7834
0.29 0.0868
66. Eat more dark green vegetables than before? 0=no or don’t know, 1=yes
0.37 0.0347*
0.31 0.0731
0.33 0.0558
0.30 0.0902
0.26 0.1421
0.39 0.0228*
0.12 0.4916
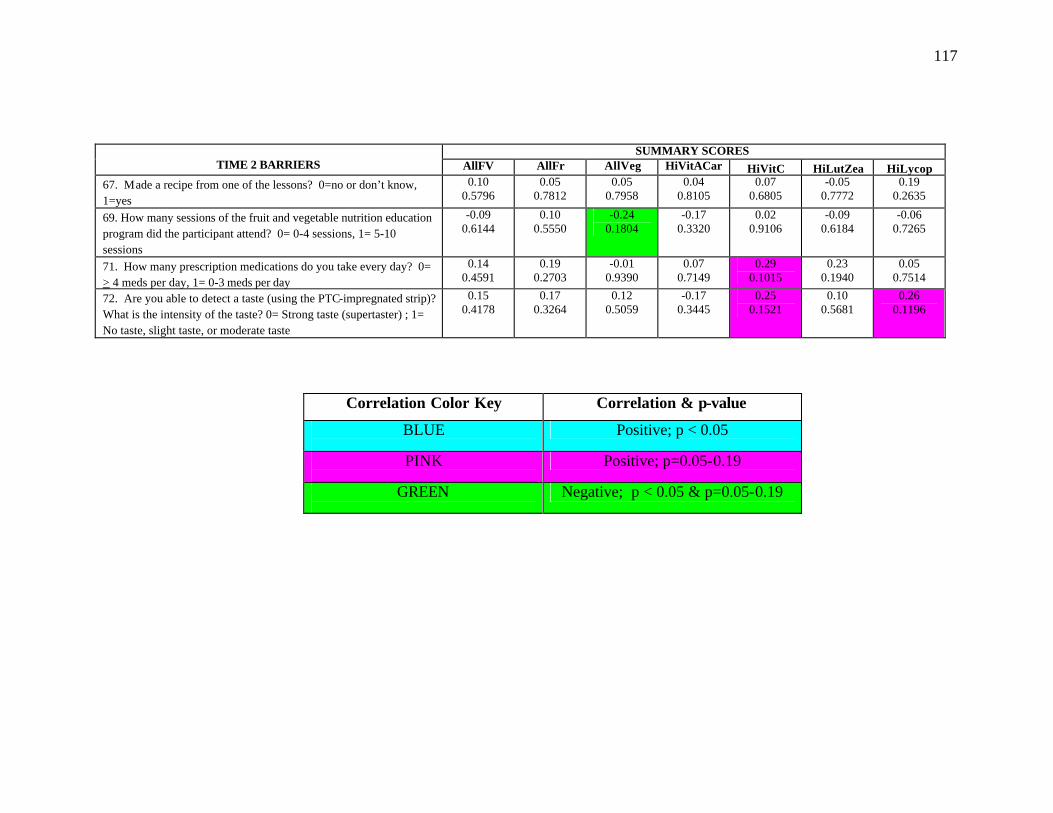
117
SUMMARY SCORES
TIME 2 BARRIERS AllFV AllFr AllVeg HiVitACar HiVitC HiLutZea HiLycop 67. Made a recipe from one of the lessons? 0=no or don’t know, 1=yes
0.10 0.5796
0.05 0.7812
0.05 0.7958
0.04 0.8105
0.07 0.6805
-0.05 0.7772
0.19 0.2635
69. How many sessions of the fruit and vegetable nutrition education program did the participant attend? 0= 0-4 sessions, 1= 5-10 sessions
-0.09 0.6144
0.10 0.5550
-0.24 0.1804
-0.17 0.3320
0.02 0.9106
-0.09 0.6184
-0.06 0.7265
71. How many prescription medications do you take every day? 0= > 4 meds per day, 1= 0-3 meds per day
0.14 0.4591
0.19 0.2703
-0.01 0.9390
0.07 0.7149
0.29 0.1015
0.23 0.1940
0.05 0.7514
72. Are you able to detect a taste (using the PTC-impregnated strip)? What is the intensity of the taste? 0= Strong taste (supertaster) ; 1= No taste, slight taste, or moderate taste
0.15 0.4178
0.17 0.3264
0.12 0.5059
-0.17 0.3445
0.25 0.1521
0.10 0.5681
0.26 0.1196
Correlation Color Key
Correlation & p-value
BLUE
Positive; p < 0.05
PINK
Positive; p=0.05-0.19
GREEN
Negative; p < 0.05 & p=0.05-0.19
118
CHAPTER IV
CONCLUSIONS
The overall objectives of this evaluation were to: 1) determine baseline consumption
patterns of selected fruit and vegetables, 2) identify perceived and actual barriers to fruit
and vegetable consumption, and to improve behaviors, attitudes, and knowledge related
to fruit and vegetable consumption, 3) identify prescription medication use and its
relationship to fruit and vegetable consumption and super-taster status, and 4) determine
the effectiveness of a nutrition intervention program that is designed for a low income,
low literacy older adult population by assessing change in intakes of selected fruits and
vegetables.
Major Findings Baseline data indicated that this convenience sample of 54 older adults had low
intakes of specific fruits and vegetables associa ted with reduced chronic disease risk, and
encountered several barriers to increasing fruit and vegetable consumption, including low
knowledge of the Five a Day fruit and vegetable recommendation (24%). In addition,
51% were identified as super-tasters, and 56% took 4 or more medications daily.
The fruit and vegetable nutrition education intervention program resulted in
several positive changes at post-test. The first major outcome is that mean intakes of
total fruit and vegetable items (from 22.8 + 1.5 to 25.2 + 2.0 servings/week) and total
fruit items (from 9.0 + 0.9 to 10.9 + 1.3 servings/week) significantly increased from Time
1 to Time 2 (p<0.05). Additionally, there were significant increases in 5 of the 31 fruit
119
and vegetable items assessed: cranberry, apple, or purple grape juice; peaches, nectarines,
and apricots; beans; vegetables consumed as a snack; and canned vegetables. Therefore,
the first hypothesis, which states that participants will increase mean intakes of > 3 fruit
and vegetable items assessed in the intervention, is true. The second finding was an
improvement in knowledge of the Five a Day recommendation in African American
participants. The percentage of African Americans who answered correctly increased
from 13% to 41% from Time 1 to Time 2, while the percentage of Caucasians who
answered correctly slightly decreased. Among all participants, there was a trend toward
increased knowledge of the relationship between high fruit and vegetable consumption
and reduced risk of cancer (from 70% to 83%, p=0.14). Therefore, the second
hypothesis, which states that knowledge and self-efficacy related to fruit and vegetable
consumption will increase post- intervention, is also true. The third major outcome was
identification of chemosensory barriers to fruit and vegetable consumption and
determining how they affected ability to increase fruit and vegetable consumption.
Participants who took > 4 medications per day or were identified as supertasters were
more likely to have significantly lower intakes of several fruits and vegetables, especially
those high in vitamin C.
Implications
The results of this nutrition intervention program demonstrate the ability of older
adults in Georgia OANPs to respond positively to instruction on diet and disease
prevention. Because ethnicity and increasing age are identified as high-risk groups
within the older adult population (Millen et al., 2002; Ponza et al., 1996), these findings
are especially important for African Americans and adults aged 80 and older.

120
Because this study and others have found larger increases in fruit intake than
vegetable intake, and because barriers such as taste and preparation difficulty often relate
more closely to vegetables than fruits, future interventions should consider addressing
vegetable consumption separately. Trudeau et al. (1998) suggests implementing all-
vegetable intervention that focuses on simple, practical information for meal planning
and preparation. Further, because some older adults do not use or follow recipes when
cooking, suggesting simple, one-step ways to modify home-prepared meals may be more
effective than distributing recipes. This would involve collecting more extensive data on
cooking or meal preparation patterns of older adults at home, and structur ing an
intervention program to address these findings. Conducting focus groups in senior
centers prior to the fruit and vegetable intervention would be useful for collecting this
type of information, and addressing these findings in the program would better meet the
needs of participants.
Future interventions in this population should also assess cognitive ability using
Folstein’s Mini-Mental State Examination or other comparable tool in order to obtain a
clearer picture of self-reported fruit and vegetable intake and behaviors. Additionally, a
control group may be useful in assessing change in fruit and vegetable intake due to
seasonal variation vs. change as a result of the intervention. A follow-up assessment is
also needed to determine if increases in fruit and vegetable intake were permanent.
Further research is needed to determine the extent to which taste and smell
defecits impact food choices, nutrition, and overall health in this population and in all
older adults (Drewnowski, 1997). The use of flavor-enhancers in food needs to be
explored as a means to increase palatability of fruits and vegetables. Flavor enhancers, by
121
intensifying the positive characteristics of food and minimizing the unpleasant taste
sensations produced by prescription medications, may increase the enjoyment of meals
and acceptance of fruits and vegetables with high levels of phytochemicals. Flavor
enhancers may also have positive effects on improving nutrient status/food intake, food
enjoyment, and increasing immune status (Schiffman & Finkelstein, 1999).
Suggested questions to add to pre-test data collection tools include: 1) Do you
grow your own fruits and vegetables or do you receive fruits and vegetables from a
family member or neighbor’s garden? If yes, what types of fruits and vegetables do
you/they grow? 2) Where do you purchase fresh fruits and vegetables? ___ local
farmer’s or produce market ___ local grocery store ___ other (list) 3) Do you eat more
fresh fruits and vegetables when they’re in season? If yes, which fruits and vegetables?
4) Do you feel that fruits and vegetables are too expensive? (in place of “ Do you have
enough money to spend on fruits and vegetables?”), and 5) How are the vegetables that
you eat prepared? ___ fried ___steamed ___boiled ___raw ___ sautéed ___ with
fatback or meat ___in a casserole ___other (add “usually”, “sometimes”, and “rarely
or never” to each possible response). On the taste questionnaire, a question regarding
tobacco use needs to be added, since tobacco use can have negative effects on taste
perception. Also, the word “prescription” needs to be added to the question pertaining to
daily medication use. Clarifications and additions suggested regarding the food
frequency questionnaire include: “beans” should read “dried beans and legumes”; “fruit
as a snack” and “fruit as dessert” should be combined to read “fruit as a snack or as
dessert”; “fresh tomatoes” should be added; and “fresh oranges, tangerines, or grapefruit”
should be added.

122
Continued use of the fruit and vegetable characters is suggested, as they are
excellent visual aids in a low-literacy audience, and they served as good icebreakers
throughout the lessons. Participants responded positively to the colorful, cartoon- ish
characters. Also, repeated viewing of the characters may help participants remember
nutrition benefits and recall key concepts repeated in each lesson. Additionally,
individual goal-setting based on participants’ personal barriers to increasing fruit and
vegetable intake has been associated with greater outcomes (Ammerman et al., 1999).
Outlining specific goals or behaviors, such as having 100% fruit juice or fruit with
breakfast, having vegetables for a snack, or eating two vegetables for dinner, have been
shown to have great potential for increasing fruit and vegetable intake (Treiman et al.,
1996). Individual, simple goal sheets or checklists may be useful in enhancing program
outcomes.
In conclusion, many factors, including environmental, social, cultural, physical,
cognitive, and behavioral, are closely linked with fruit and vegetable consumption in low-
income, older adult populations. Increased intake of fruits and vegetables, especially
those closely associated with reduced risk of health conditions, and reduced barriers to
consumption are of great importance in an older adult population where chronic disease,
diabetes, obesity, and related health problems are rampant. Including these suggestions
in planning and evaluation of future studies in this population may facilitate further
increases in fruit and vegetable intake, reductions in barriers to increased consumption,
and reductions in chronic disease risk.

123
REFERENCES
Accettura N. (2000) Micronutrient Intervention in Elderly Nutrition Programs. Masters’ Thesis, University of Georgia, Athens, GA. Ammerman AS, Lindquist CH, Lohr KN, Hersey J. (2002) The Efficacy of Behavioral Interventions to Modify Dietary Fat and Fruit and Vegetable Intake: A Review of the Evidence. Prev Med 35: 25-41. Anderson JV, Bybee DI, Brown RM, McLean DF, Garcia EM, Breer L, Schillo BA. (2001) 5 A Day fruit and vegetable intervention improves consumption in a low-income population. J Am Diet Assoc 101(2): 195-202. Aspinwall EA. (2000) Serum Carotenoid Concentrations and Fruit, Vegetable and Carotenoid Intake among Participants in Northeast Georgia’s Elderly Nutrition Program. Masters’ Thesis, University of Georgia, Athens, GA. Bernstein MA, Nelson ME, Tucker KL, Layne J. (2002) A home-based nutrition intervention to increase consumption of fruits, vegetables, and calcium-rich foods in community dwelling elders. J Am Diet Assoc 102 (10): 1421-1427. Block G, Subar AF. (1992) Estimates of Nutrient Intake from a Food Frequency Questionnaire: The 1987 National Health Interview Survey. J Am Diet Assoc 92 (8): 969-978. Brackett, WRH. (1999) Nutritional Status of Participants of Northeast Georgia Senior Nutrition Centers. Masters’ Thesis, University of Georgia, Athens, GA. Campbell MK, Denmark-Wahnefried W, Symons M, Kalsbeek WD. (1999) Fruit and vegetable consumption and prevention of cancer: The Black Churches United for Better Health Project. Am J Publ Health 89 (9): 1390-1396. Caserta MS. (1995) Health Promotion and the Older Population: Expanding Our Theoretical Horizons. J Comm Health 20 (5): 283-292.
Centers for Disease Control. (2001) Healthy Aging: Preventing Disease and Improving Quality of Life in Older Americans. Retrieved March 12, 2002 from: http://www.cdc.gov/nccdphp/aag-aging.htm Cheong JMK, Johnson MA, Lewis RD, Fischer JG, Johnson JT. Reduction in modifiable osteoporosis-related risk factors in the Older Americans Nutrition Program, Family Economics and Nutrition Review, in press, 2003. Chernoff R. (2001) Nutrition and Health Promotion in Older Adults. J Gerontol: Biol Sci & Med Sci 56 (2): 47-53.
124
Ciliska D, Miles E, O'Brien MA, Turl C, Tomasik HH, Donovan U, Beyers J. (2000) Effectiveness of Community-Based Interventions to Increase Fruit and Vegetable Consumption. J Nutr Ed 32 (6): 341-351. Cohen NL, Stoddard AM, Sarouhkhanians S, Sorenson G. (1998) Barriers toward Fruit and Vegetable Consumption in a Multiethnic Worksite Population. J Nutr Ed 30 (6): 381-385. Coulston AM, Rock CL, Monsen ER, eds. (2001) Nutrition in the Prevention and Treatment of Disease. Academic Press, San Diego CA. 6: 83-93. Cox RH, Gonzales-Vigilar MCRV, Novascone MA, Silva-Barbeau I. (1996) Impact of a Cancer Intervention on Diet-related Cardiovascular Disease Risks of White and African American EFNEP Clients. J Nutr Ed 28: 209-218. Dittus KL, Hillers VN, Beerman KA. (1995) Benefits and Barriers to Fruit and Vegetable Intake: Relationship between Attitudes and Consumption. J Nutr Ed 27: 120-126. Donkin AJM, Johnson AE, Lilley JM. (1998) Gender and Living Alone as Determinants of Fruit and Vegetable Consumption among the Elderly Living at Home in Urban Nottingham. Appetite 30: 39-51. Drewnowski A, Kristal A, Cohen J. (2001) Genetic Taste Responses to 6-n-Propylthiouracil Among Adults: a Screening Tool for Epidemiological Studies. Chem Senses 26: 483-489. Drewnowski A.(1997) Taste Preferences and Food Intake. Annu Rev Nutr 17: 237-253. Drewnowski A, Evans WJ. (2001) Nutrition, Physical Activity, and Quality of Life in Older Adults: Summary. J Gerontol 56A: 89-94. Drewnowski A, Henderson SA, Barratt-Fornell A. (2001) Genetic Taste Markers and Food Preferences. Drug Metabolism and Disposition 29 (4): 535-538. Drewnowski A, Kristal A, Cohen J. (2001) Genetic Taste Responses to 6-n-Propylthioluracil Among Adults: a Screening Tool for Epidemiological Studies. Chem Senses 26: 483-489. Duffy V, Backstrand JR, Ferris AM. (1995) Olfactory Dysfunction and Related Nutritional Risk in Free-Living, Elderly Women. J Am Diet Assoc 8: 879-892. Finkelstein JA, Schiffman SS. (1999) Workshop on Taste and Smell in the Elderly: An Overview. Phys & Behav 66 (2): 173-176.
125
Georgia Department of Human Resources Division of Aging Services. (2002) DHR Office of Communications Fact Sheet. Retrieved February 13, 2003 from: http://dhr.georgia.gov/vgn/images/portal/cit_1210/77364DivisionofAging.pdf Glanz K. (2001) Current Theoretical Bases for Nutrition Intervention and their Uses. In Nutrition in the Prevention and Treatment of Disease, Coulston AM, Rock CL, Monsen ER, eds., 83-91. Academic Press Publishing, 525 B Street, Suite 1900, San Diego, CA 92101-4495. Glanz K, Basil M, Maibach E, Goldberg J, Snyder D. (1998) Why Americans eat what they do: Taste, nutrition, cost, convenience, and weight control concerns as influences on food consumption. J Am Diet Assoc 98 (10): 1119-1126. Glanz K, Lewis FM, Rimer BK, eds. (1990) Health Behavior and Health Education: Theory, Research, and Practice. Jossey-Bass Publ, San Francisco CA. 3:39-62. Hackman RM, Wagner EL. (1990) The Senior Gardening and Nutrition Project: Development and Transport of a Dietary Behavior Change and Health Promotion Program. J Nutr Ed 22: 262-270. Harnack L, Block G, Subar A, Lane S. (1998) Cancer Prevention-Related Nutrition Knowledge, Beliefs, and Attitudes of U.S. Adults: 1992 NHIS Cancer Epidemiology Supplement. J Nutr Ed 30: 131-138. Havas S, Treiman K, Langenberg P, Ballesteros M, Anlinker J, Damron D, Feldman R. (1998) Factors associated with fruit and vegetable consumption among women participating in WIC. J Am Diet Assoc 98 (10): 1141-8. Havas S, Anliker J, Damron D, Langenberg P, Ballesteros M, Feldman R. (1998) Final Results of the Maryland WIC 5 A Day Promotion Program. American Jourmal of Public Health 88 (8): 1161-1167. Johnson AE, Donkin AJM, Morgan K, Neale RJ. (1998) Fruit and vegetable consumption in later life. Age & Aging 27 (6): 723-728. Johnston CS, Taylor CA, Hampl JS. (2000) More Americans are eating 5 a day but intakes of dark green and cruciferous vegetables remain low. J Nutr 130 (12): 3063- 3067. Joshipura KJ, Hu FB, Manson JE, Stampfer MJ, Rimm EB, Speizer FE, Colditz G, Ascherio A, Rosner B, Spiegelman D, Willett WC. (2001) The Effect of Fruit and Vegetable Intake on Risk for Coronary Heart Disease. Ann Int Med 134: 1106-1114. Krebs-Smith S, Kantor LS. (2001) Choosing a Variety of Fruits and Vegetables Daily: Understanding the Complexities. J Nutr Supplement 487S-501S.
126
Laforge RG, Greene GW, Prochaska JO. (1994) Psychosocial Factors Influencing Low Fruit and Vegetable Consumption. J Behav Med 17 (4): 361-374. Liu S, Manson JE, Lee IM, Cole SR, Hennekens CH, Willett WC, Buring JE. (2000) Fruit and vegetable intake and risk of cardiovascular disease: the Women’s Health Study. Am J Clin Nutr 72: 955-928. Lokken SL. (2000) Food Assistance Needs of Low-Income Elderly: A Qualitative Investigation. J Fam & Cons Sci 92 (2): 46-50. McCamey MA, Hawthorne NA, Reddy S, Lombardo M, Cress ME, Johnson MA. An education intervention in the Georgia Older Americans Nutrition Program improves nutrition and physical activity, Family Economics and Nutrition Review, in press, 2003. Millen BE, Ohls JC, Ponza M, McCool AC. (2002) The Elderly Nutrition Program: An effective national framework for preventive nutrition interventions. J Am Diet Assoc 102 (2): 234-240. National Cancer Institute: Cancer Control & Population Sciences (2000) Five a Day for Better Health Program Evaluation Report. Retrieved March 24, 2003 from: http://www.cancercontrol.cancer.gov/5aday_12-4-00.pdf Nutrition Screening Initiative. (1992) Nutrition Education and Counseling Interventions to Improve the Nutritional Status of Older Americans, in Nutrition Interventions Manual for Professionals Caring for Older Americans,86-97. Nutrition Screening Initiative, Washington, DC, 2626 Pennsylvania Avenue, Suite 301, Washington DC 20037. Ponza M, Ohls JC, Millen BE. (1996) Executive Summary: Serving Elders at Risk: The Older Americans Act Nutrition Programs - National Evaluation of the Elderly Nutrition Program, 1993-1995. Princeton, NJ, Mathematica Policy Research. Reniscow K, Odom E, Wang T, Dudley W, Mitchell D, Vaughan R, Jackson A, Baranowski T. (2001) Validation of Three Food Frequency Questionnaires and 24-Hour Recalls with Serum Carotenoid Levels in a Sample of African-American Adults. Am J Epidem 152 (11): 1072-1080. Sahyoun NR. (2002) Nutrition Education for the Healthy Elderly Population: Isn’t it Time? J Nutr Educ Behav 34: 542-547. SAS Institute, Inc. (2001) Version 6.2, Cary, North Carolina. Schiffman SS, Zervakis J. (2002) Taste and Smell Perception in the Elderly: Effect of Medications and Disease. Adv Food Nut Res 44: 247-346.
127
Shankar S & Klassen A. (2001) Influences on fruit and vegetable procurement and consumption among urban African-American public housing residents, and potential strategies for intervention. Family Economics & Nutrition Review 13 (2): 34-41. Shumaker SA, Schron EB, Ockene JK, McBee WL, eds. (1998) The Handbook of Health Behavior Change, 2nd ed., 8-10, Spronger Publishing, New York NY 10012-3955. Stables GJ, Subar AF, Patterson BH, Dodd K, Heimendinger M, Van Duyn MAS, Nebeling L. (2002) Changes in vegetable and fruit consumption and awareness among US adults: Results of the 1991 and 1997 5 A Day for Better Health Program surveys. J Am Diet Assoc 102 (6): 809-817. Steinmetz KA, Potter JD. (1996) Vegetables, Fruit, and Cancer Prevention: A review. J Am Diet Assoc 96(10): 1027-1039. Subar AF, Heimendinger J, Patterson BH, Krebs-Smith SM, Pivonka E, Kessler R. (1995) Fruit and Vegetable Intake in the United States: The Baseline Survey of the Five A Day for Better Health Program. Sci Health Prom 9 (5): 352-360. Thompson B, Demark-Wahnefried W, Taylor G, McClelland JW, Stables G, Havas S, Feng Z, Topor M, Heimendinger J, Reynolds KD, Cohen N. (1999) Baseline fruit and vegetable intake among adults in seven 5 A Day study centers located in diverse geographic areas. J Am Diet Assoc 99 (10): 1241-1248. Treiman K, Freimuth V, Damron D, Lasswell A, Anliker J, Havas S, Langenberg P, Feldman R. (1996) Attitudes and Behaviots Related to Fruits and Vegetables among Low-Income Women in the WIC Program. Society for Nutrition Education 28 (3): 149-156. Trudeau E, Kristal AR, Li S, Patterson RE. (1998) Demographic and Psychosocial predictors of fruit and vegetable intakes differ: implications for dietary interventions. J Am Diet Assoc 98 (12): 1412-1417. U. S. Census Bureau. (2000) Census 2000 Summary File 1. Retrieved February 17, 2002 from: http://factfinder.census.gov USDA Nutrient Database for Standard Reference, Release 15: Vitamin C (mg) and Vitamin A (RAE) Content of Selected Foods per Common Measure, sorted by nutrient content; USDA-NCC Carotenoid Database for U.S.Foods – 1998. Tables retrieved online 2/10/02 from: http://www.nal.usda.gov/fnic/food_comp/Data/SR15/wtrank/wt_rank.html U.S. Department of Health and Human Services. (2000) Healthy People 2010, 2nd ed., 2 vols. Washington, DC: U.S. Government Printing Office.
128
U.S. Department of Health and Human Services, Administration on Aging. A Profile of Older Americans: 2002. Retrieved February 17, 2003 from: http://www.aoa.gov/aoa/stats/profile/profile.pdf U.S. Department of Health and Human Services, Administration on Aging. (2002) The Elderly Nutrition Program. Retrieved February 17, 2003 from: http://www.aoa.gov/press/fact/alpha/fact_elderly_nut rition.asp
U.S. Department of Health and Human Services, National Center for Chronic Disease Prevention and Health Promotion, Centers for Disease Control and Prevention. BRFSS 2000 National and Georgia Prevalence Data. Retrieved February 17, 2003 from: http://apps.nccd.cdc.gov/brfss/age.asp?cat=NU&yr=2000&qkey=4340&state=GA Weimer J. (1998) Factors Affecting Nutrient Intake in the Elderly. USDA Agricultural Economic Report No. 769. Accessed online 3/10/03. World Health Organization, Department of Noncommunicable Disease Prevention and Health Promotion. (2001) Global Movement for Active Ageing, Background Information. Retrieved March 12, 2002 from: http://www.who.int/hpr/globalmovement/background.htm

129
APPENDICES
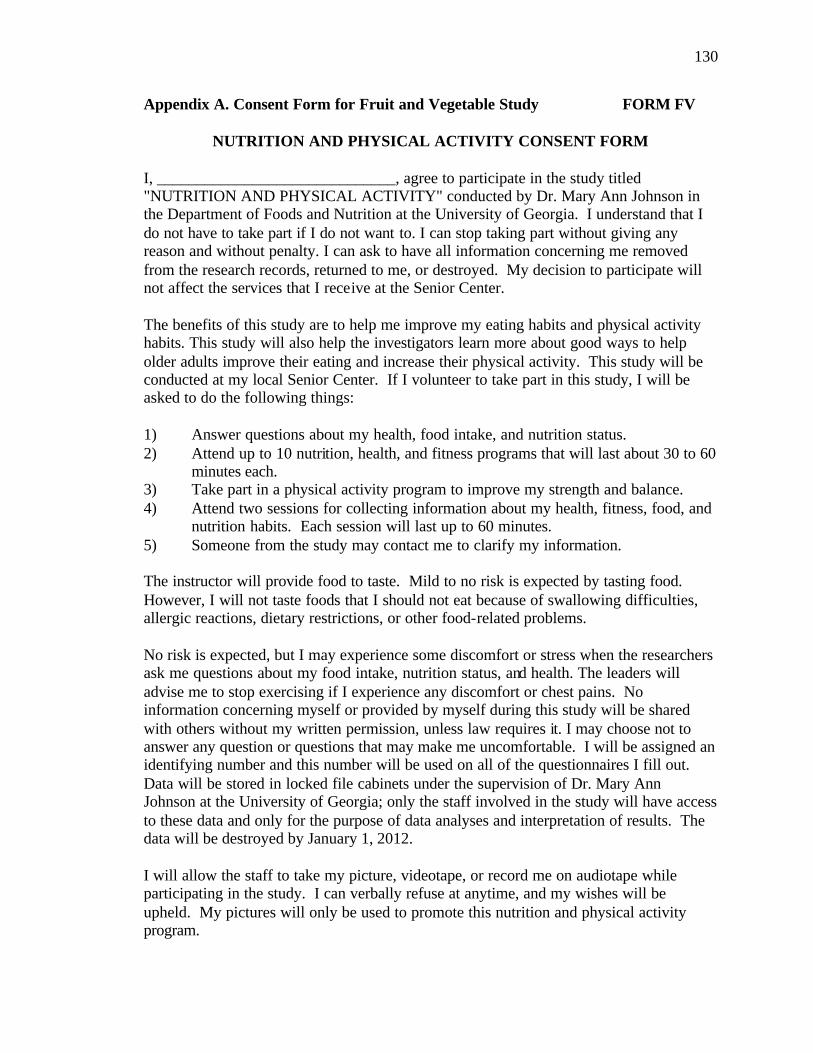
130
Appendix A. Consent Form for Fruit and Vegetable Study FORM FV
NUTRITION AND PHYSICAL ACTIVITY CONSENT FORM I, ______________________________, agree to participate in the study titled "NUTRITION AND PHYSICAL ACTIVITY" conducted by Dr. Mary Ann Johnson in the Department of Foods and Nutrition at the University of Georgia. I understand that I do not have to take part if I do not want to. I can stop taking part without giving any reason and without penalty. I can ask to have all information concerning me removed from the research records, returned to me, or destroyed. My decision to participate will not affect the services that I receive at the Senior Center. The benefits of this study are to help me improve my eating habits and physical activity habits. This study will also help the investigators learn more about good ways to help older adults improve their eating and increase their physical activity. This study will be conducted at my local Senior Center. If I volunteer to take part in this study, I will be asked to do the following things: 1) Answer questions about my health, food intake, and nutrition status. 2) Attend up to 10 nutrition, health, and fitness programs that will last about 30 to 60
minutes each. 3) Take part in a physical activity program to improve my strength and balance. 4) Attend two sessions for collecting information about my health, fitness, food, and
nutrition habits. Each session will last up to 60 minutes. 5) Someone from the study may contact me to clarify my information. The instructor will provide food to taste. Mild to no risk is expected by tasting food. However, I will not taste foods that I should not eat because of swallowing difficulties, allergic reactions, dietary restrictions, or other food-related problems. No risk is expected, but I may experience some discomfort or stress when the researchers ask me questions about my food intake, nutrition status, and health. The leaders will advise me to stop exercising if I experience any discomfort or chest pains. No information concerning myself or provided by myself during this study will be shared with others without my written permission, unless law requires it. I may choose not to answer any question or questions that may make me uncomfortable. I will be assigned an identifying number and this number will be used on all of the questionnaires I fill out. Data will be stored in locked file cabinets under the supervision of Dr. Mary Ann Johnson at the University of Georgia; only the staff involved in the study will have access to these data and only for the purpose of data analyses and interpretation of results. The data will be destroyed by January 1, 2012. I will allow the staff to take my picture, videotape, or record me on audiotape while participating in the study. I can verbally refuse at anytime, and my wishes will be upheld. My pictures will only be used to promote this nutrition and physical activity program.
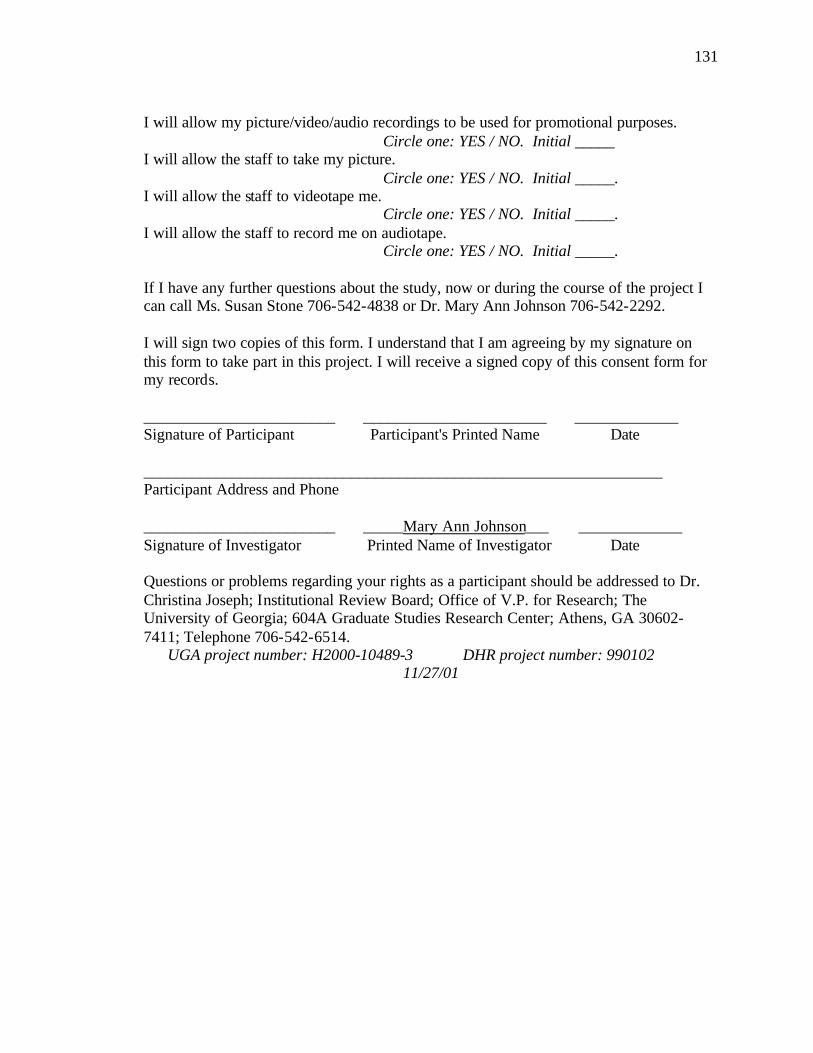
131
I will allow my picture/video/audio recordings to be used for promotional purposes. Circle one: YES / NO. Initial _____ I will allow the staff to take my picture.
Circle one: YES / NO. Initial _____. I will allow the staff to videotape me.
Circle one: YES / NO. Initial _____. I will allow the staff to record me on audiotape.
Circle one: YES / NO. Initial _____. If I have any further questions about the study, now or during the course of the project I can call Ms. Susan Stone 706-542-4838 or Dr. Mary Ann Johnson 706-542-2292. I will sign two copies of this form. I understand that I am agreeing by my signature on this form to take part in this project. I will receive a signed copy of this consent form for my records. ________________________ _______________________ _____________ Signature of Participant Participant's Printed Name Date _________________________________________________________________ Participant Address and Phone ________________________ _____Mary Ann Johnson___ _____________ Signature of Investigator Printed Name of Investigator Date Questions or problems regarding your rights as a participant should be addressed to Dr. Christina Joseph; Institutional Review Board; Office of V.P. for Research; The University of Georgia; 604A Graduate Studies Research Center; Athens, GA 30602-7411; Telephone 706-542-6514.
UGA project number: H2000-10489-3 DHR project number: 990102 11/27/01
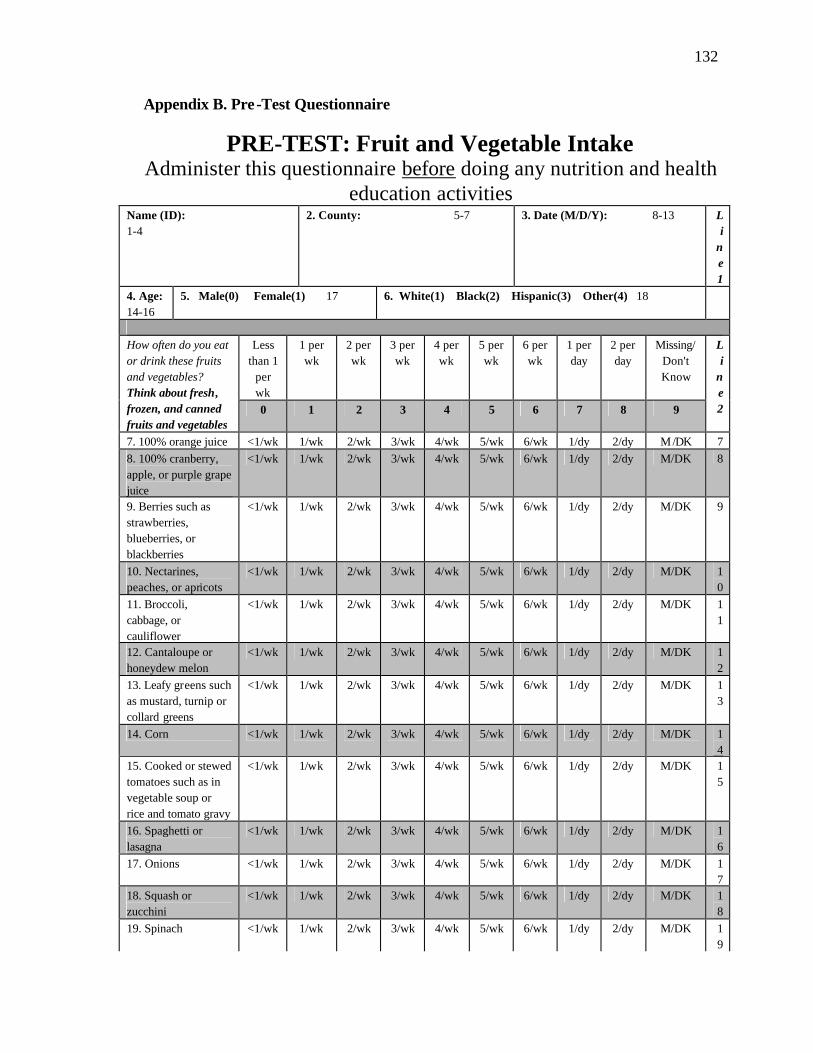
132
Appendix B. Pre-Test Questionnaire
PRE-TEST: Fruit and Vegetable Intake Administer this questionnaire before doing any nutrition and health
education activities Name (ID): 1-4
2. County: 5-7 3. Date (M/D/Y): 8-13 Li
ne 1
4. Age: 14-16
5. Male(0) Female(1) 17 6. White(1) Black(2) Hispanic(3) Other(4) 18
Less
than 1 per wk
1 per wk
2 per wk
3 per wk
4 per wk
5 per wk
6 per wk
1 per day
2 per day
Missing/Don't Know
How often do you eat or drink these fruits and vegetables? Think about fresh, frozen, and canned fruits and vegetables
0 1 2 3 4 5 6 7 8 9
Li
ne 2
7. 100% orange juice <1/wk 1/wk 2/wk 3/wk 4/wk 5/wk 6/wk 1/dy 2/dy M/DK 7 8. 100% cranberry, apple, or purple grape juice
<1/wk 1/wk 2/wk 3/wk 4/wk 5/wk 6/wk 1/dy 2/dy M/DK 8
9. Berries such as strawberries, blueberries, or blackberries
<1/wk 1/wk 2/wk 3/wk 4/wk 5/wk 6/wk 1/dy 2/dy M/DK 9
10. Nectarines, peaches, or apricots
<1/wk 1/wk 2/wk 3/wk 4/wk 5/wk 6/wk 1/dy 2/dy M/DK 10
11. Broccoli, cabbage, or cauliflower
<1/wk 1/wk 2/wk 3/wk 4/wk 5/wk 6/wk 1/dy 2/dy M/DK 11
12. Cantaloupe or honeydew melon
<1/wk 1/wk 2/wk 3/wk 4/wk 5/wk 6/wk 1/dy 2/dy M/DK 12
13. Leafy greens such as mustard, turnip or collard greens
<1/wk 1/wk 2/wk 3/wk 4/wk 5/wk 6/wk 1/dy 2/dy M/DK 13
14. Corn <1/wk 1/wk 2/wk 3/wk 4/wk 5/wk 6/wk 1/dy 2/dy M/DK 14
15. Cooked or stewed tomatoes such as in vegetable soup or rice and tomato gravy
<1/wk 1/wk 2/wk 3/wk 4/wk 5/wk 6/wk 1/dy 2/dy M/DK 15
16. Spaghetti or lasagna
<1/wk 1/wk 2/wk 3/wk 4/wk 5/wk 6/wk 1/dy 2/dy M/DK 16
17. Onions <1/wk 1/wk 2/wk 3/wk 4/wk 5/wk 6/wk 1/dy 2/dy M/DK 17
18. Squash or zucchini
<1/wk 1/wk 2/wk 3/wk 4/wk 5/wk 6/wk 1/dy 2/dy M/DK 18
19. Spinach <1/wk 1/wk 2/wk 3/wk 4/wk 5/wk 6/wk 1/dy 2/dy M/DK 19
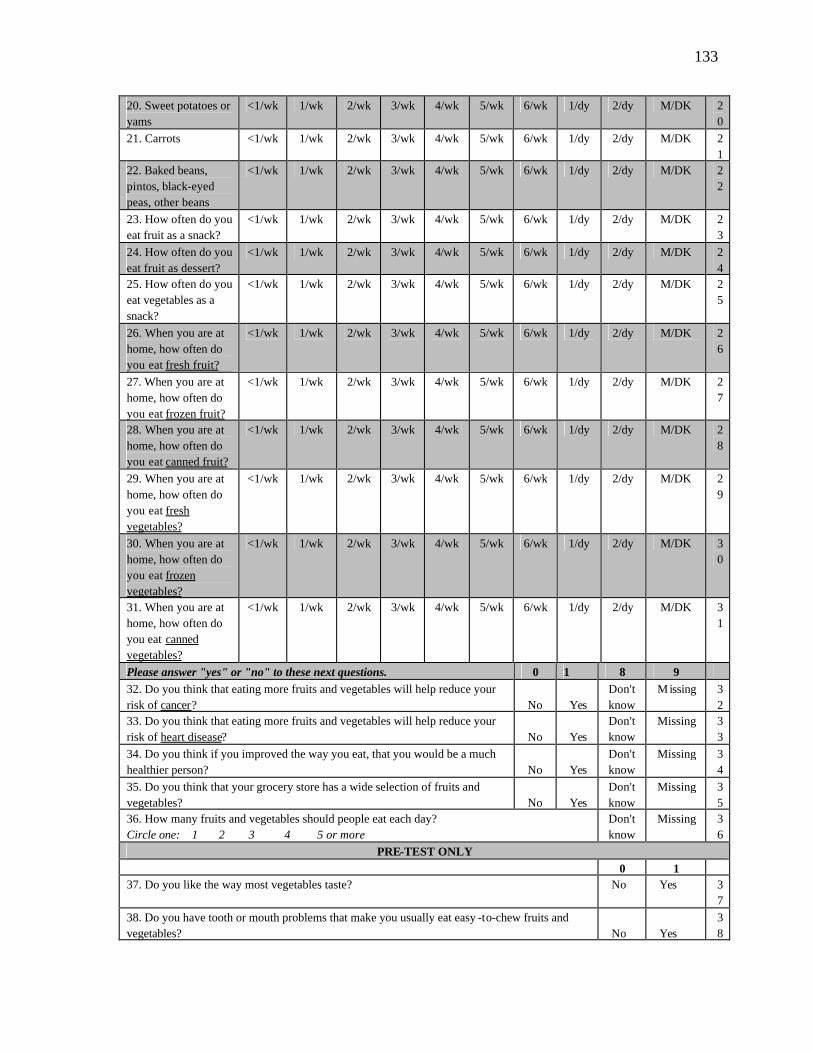
133
20. Sweet potatoes or yams
<1/wk 1/wk 2/wk 3/wk 4/wk 5/wk 6/wk 1/dy 2/dy M/DK 20
21. Carrots <1/wk 1/wk 2/wk 3/wk 4/wk 5/wk 6/wk 1/dy 2/dy M/DK 21
22. Baked beans, pintos, black-eyed peas, other beans
<1/wk 1/wk 2/wk 3/wk 4/wk 5/wk 6/wk 1/dy 2/dy M/DK 22
23. How often do you eat fruit as a snack?
<1/wk 1/wk 2/wk 3/wk 4/wk 5/wk 6/wk 1/dy 2/dy M/DK 23
24. How often do you eat fruit as dessert?
<1/wk 1/wk 2/wk 3/wk 4/wk 5/wk 6/wk 1/dy 2/dy M/DK 24
25. How often do you eat vegetables as a snack?
<1/wk 1/wk 2/wk 3/wk 4/wk 5/wk 6/wk 1/dy 2/dy M/DK 25
26. When you are at home, how often do you eat fresh fruit?
<1/wk 1/wk 2/wk 3/wk 4/wk 5/wk 6/wk 1/dy 2/dy M/DK 26
27. When you are at home, how often do you eat frozen fruit?
<1/wk 1/wk 2/wk 3/wk 4/wk 5/wk 6/wk 1/dy 2/dy M/DK 27
28. When you are at home, how often do you eat canned fruit?
<1/wk 1/wk 2/wk 3/wk 4/wk 5/wk 6/wk 1/dy 2/dy M/DK 28
29. When you are at home, how often do you eat fresh vegetables?
<1/wk 1/wk 2/wk 3/wk 4/wk 5/wk 6/wk 1/dy 2/dy M/DK 29
30. When you are at home, how often do you eat frozen vegetables?
<1/wk 1/wk 2/wk 3/wk 4/wk 5/wk 6/wk 1/dy 2/dy M/DK 30
31. When you are at home, how often do you eat canned vegetables?
<1/wk 1/wk 2/wk 3/wk 4/wk 5/wk 6/wk 1/dy 2/dy M/DK 31
Please answer "yes" or "no" to these next questions. 0 1 8 9 32. Do you think that eating more fruits and vegetables will help reduce your risk of cancer?
No
Yes
Don't know
Missing 32
33. Do you think that eating more fruits and vegetables will help reduce your risk of heart disease?
No
Yes
Don't know
Missing 33
34. Do you think if you improved the way you eat, that you would be a much healthier person?
No
Yes
Don't know
Missing 34
35. Do you think that your grocery store has a wide selection of fruits and vegetables?
No
Yes
Don't know
Missing 35
36. How many fruits and vegetables should people eat each day? Circle one: 1 2 3 4 5 or more
Don't know
Missing 36
PRE-TEST ONLY 0 1 37. Do you like the way most vegetables taste? No Yes 3
7 38. Do you have tooth or mouth problems that make you usually eat easy -to-chew fruits and vegetables?
No
Yes
38

134
39. Do you have enough money to spend on fruits and vegetables? No Yes 39
40. Would you like to know more about which fruits and vegetables are good for your health? No
Yes
40
41. Would you like to know more about different ways to cook vegetables? No Yes 41
42. Would you like a handout with healthy menus to take home? No Yes 42
Which of these kitchen tools can you easily use to cook vegetables at home? 43. Sharp knife? No Yes 4
3 44. Can opener? No Yes 4
4 45. Pot of hot water? No Yes 4
5 46. Do you shop for your own groceries? 47. If you answered no, then who shops for you? 8=not applicable; 1=spouse, 2=other family, 3=friend, 4=other, describe: _____________
No Yes 46
47
48. Do you plan the meals you eat? No Yes 48
49. Do you cook the meals you eat? No Yes 49
50. Do you use a microwave at home? No Yes 50
51. Do you use a stove at home? No Yes 51
Do you have or have you ever had any of the following? 52. Diabetes No Yes 5
2 53. Cancer No Yes 5
3 54. Heart disease or heart attack No Yes 5
4 55. High blood cholesterol No Yes 5
5 56. High blood pressure or hypertension No Yes 5
6
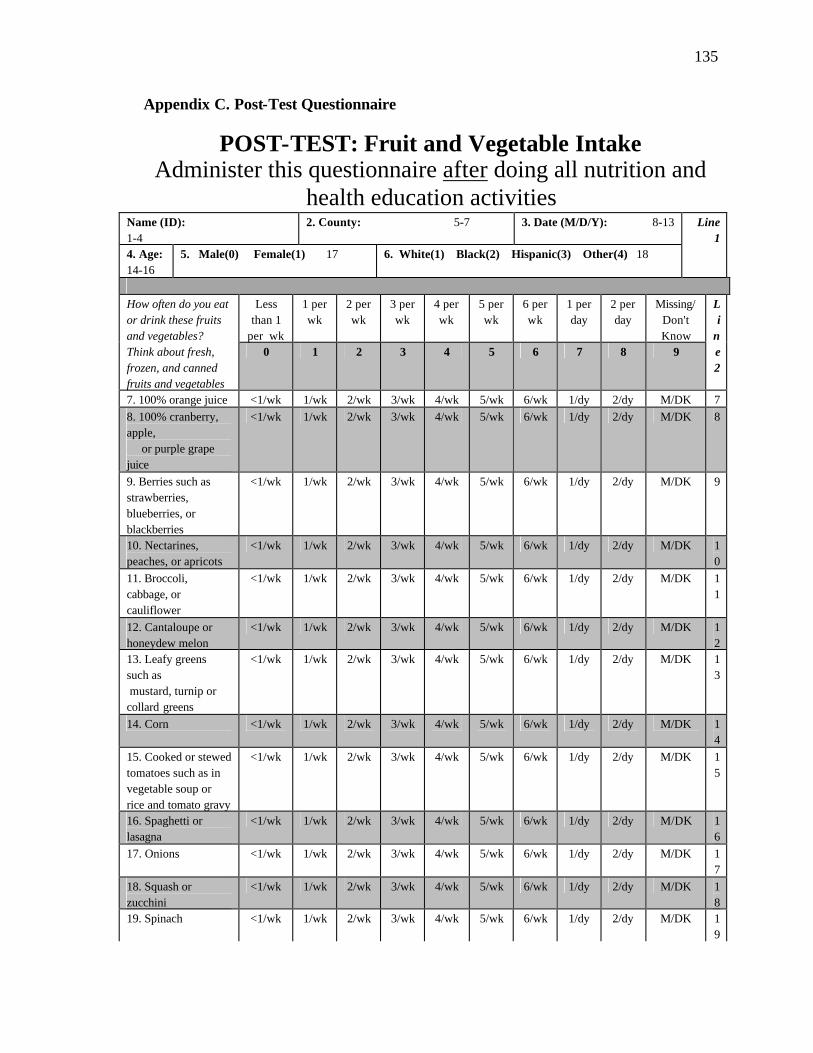
135
Appendix C. Post-Test Questionnaire
POST-TEST: Fruit and Vegetable Intake Administer this questionnaire after doing all nutrition and
health education activities Name (ID): 1-4
2. County: 5-7 3. Date (M/D/Y): 8-13
4. Age: 14-16
5. Male(0) Female(1) 17 6. White(1) Black(2) Hispanic(3) Other(4) 18
Line 1
Less
than 1 per wk
1 per wk
2 per wk
3 per wk
4 per wk
5 per wk
6 per wk
1 per day
2 per day
Missing/Don't Know
How often do you eat or drink these fruits and vegetables? Think about fresh, frozen, and canned fruits and vegetables
0 1 2 3 4 5 6 7 8 9
Li
ne 2
7. 100% orange juice <1/wk 1/wk 2/wk 3/wk 4/wk 5/wk 6/wk 1/dy 2/dy M/DK 7 8. 100% cranberry, apple, or purple grape juice
<1/wk 1/wk 2/wk 3/wk 4/wk 5/wk 6/wk 1/dy 2/dy M/DK 8
9. Berries such as strawberries, blueberries, or blackberries
<1/wk 1/wk 2/wk 3/wk 4/wk 5/wk 6/wk 1/dy 2/dy M/DK 9
10. Nectarines, peaches, or apricots
<1/wk 1/wk 2/wk 3/wk 4/wk 5/wk 6/wk 1/dy 2/dy M/DK 10
11. Broccoli, cabbage, or cauliflower
<1/wk 1/wk 2/wk 3/wk 4/wk 5/wk 6/wk 1/dy 2/dy M/DK 11
12. Cantaloupe or honeydew melon
<1/wk 1/wk 2/wk 3/wk 4/wk 5/wk 6/wk 1/dy 2/dy M/DK 12
13. Leafy greens such as mustard, turnip or collard greens
<1/wk 1/wk 2/wk 3/wk 4/wk 5/wk 6/wk 1/dy 2/dy M/DK 13
14. Corn <1/wk 1/wk 2/wk 3/wk 4/wk 5/wk 6/wk 1/dy 2/dy M/DK 14
15. Cooked or stewed tomatoes such as in vegetable soup or rice and tomato gravy
<1/wk 1/wk 2/wk 3/wk 4/wk 5/wk 6/wk 1/dy 2/dy M/DK 15
16. Spaghetti or lasagna
<1/wk 1/wk 2/wk 3/wk 4/wk 5/wk 6/wk 1/dy 2/dy M/DK 16
17. Onions <1/wk 1/wk 2/wk 3/wk 4/wk 5/wk 6/wk 1/dy 2/dy M/DK 17
18. Squash or zucchini
<1/wk 1/wk 2/wk 3/wk 4/wk 5/wk 6/wk 1/dy 2/dy M/DK 18
19. Spinach <1/wk 1/wk 2/wk 3/wk 4/wk 5/wk 6/wk 1/dy 2/dy M/DK 19
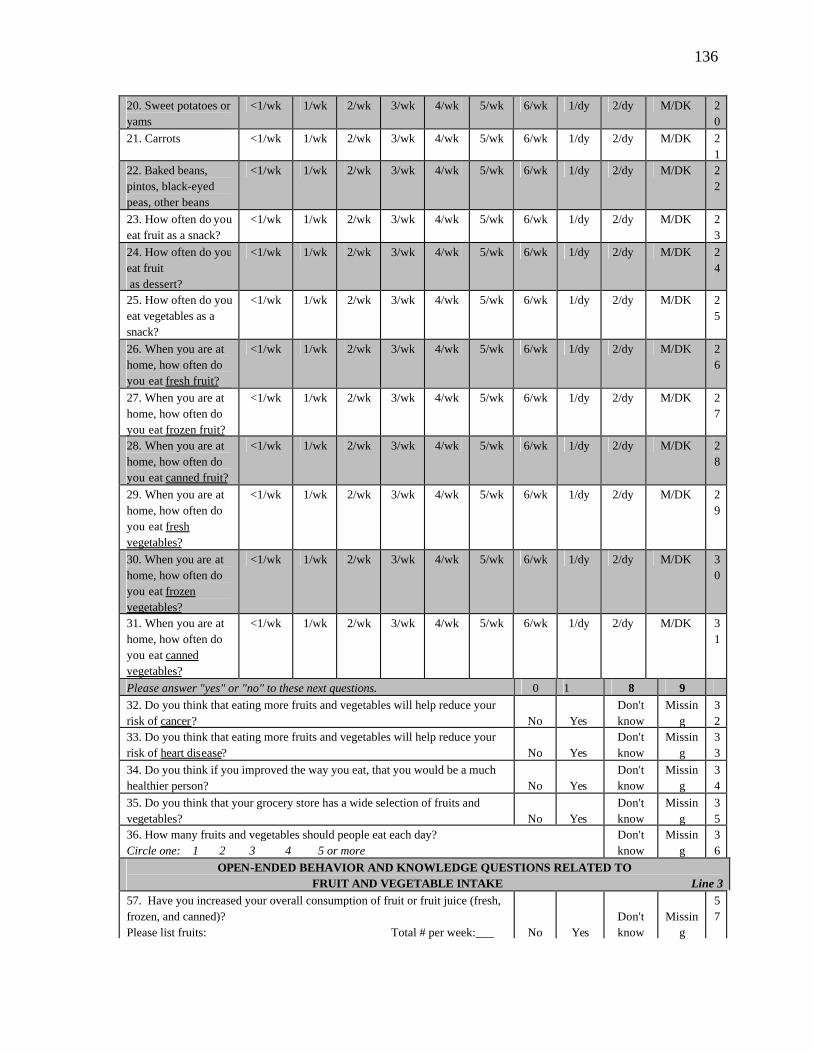
136
20. Sweet potatoes or yams
<1/wk 1/wk 2/wk 3/wk 4/wk 5/wk 6/wk 1/dy 2/dy M/DK 20
21. Carrots <1/wk 1/wk 2/wk 3/wk 4/wk 5/wk 6/wk 1/dy 2/dy M/DK 21
22. Baked beans, pintos, black-eyed peas, other beans
<1/wk 1/wk 2/wk 3/wk 4/wk 5/wk 6/wk 1/dy 2/dy M/DK 22
23. How often do you eat fruit as a snack?
<1/wk 1/wk 2/wk 3/wk 4/wk 5/wk 6/wk 1/dy 2/dy M/DK 23
24. How often do you eat fruit as dessert?
<1/wk 1/wk 2/wk 3/wk 4/wk 5/wk 6/wk 1/dy 2/dy M/DK 24
25. How often do you eat vegetables as a snack?
<1/wk 1/wk 2/wk 3/wk 4/wk 5/wk 6/wk 1/dy 2/dy M/DK 25
26. When you are at home, how often do you eat fresh fruit?
<1/wk 1/wk 2/wk 3/wk 4/wk 5/wk 6/wk 1/dy 2/dy M/DK 26
27. When you are at home, how often do you eat frozen fruit?
<1/wk 1/wk 2/wk 3/wk 4/wk 5/wk 6/wk 1/dy 2/dy M/DK 27
28. When you are at home, how often do you eat canned fruit?
<1/wk 1/wk 2/wk 3/wk 4/wk 5/wk 6/wk 1/dy 2/dy M/DK 28
29. When you are at home, how often do you eat fresh vegetables?
<1/wk 1/wk 2/wk 3/wk 4/wk 5/wk 6/wk 1/dy 2/dy M/DK 29
30. When you are at home, how often do you eat frozen vegetables?
<1/wk 1/wk 2/wk 3/wk 4/wk 5/wk 6/wk 1/dy 2/dy M/DK 30
31. When you are at home, how often do you eat canned vegetables?
<1/wk 1/wk 2/wk 3/wk 4/wk 5/wk 6/wk 1/dy 2/dy M/DK 31
Please answer "yes" or "no" to these next questions. 0 1 8 9 32. Do you think that eating more fruits and vegetables will help reduce your risk of cancer?
No
Yes
Don't know
Missing
32
33. Do you think that eating more fruits and vegetables will help reduce your risk of heart disease?
No
Yes
Don't know
Missing
33
34. Do you think if you improved the way you eat, that you would be a much healthier person?
No
Yes
Don't know
Missing
34
35. Do you think that your grocery store has a wide selection of fruits and vegetables?
No
Yes
Don't know
Missing
35
36. How many fruits and vegetables should people eat each day? Circle one: 1 2 3 4 5 or more
Don't know
Missing
36
OPEN-ENDED BEHAVIOR AND KNOWLEDGE QUESTIONS RELATED TO FRUIT AND VEGETABLE INTAKE Line 3
57. Have you increased your overall consumption of fruit or fruit juice (fresh, frozen, and canned)? Please list fruits: Total # per week:___
No
Yes
Don't know
Missin
g
57
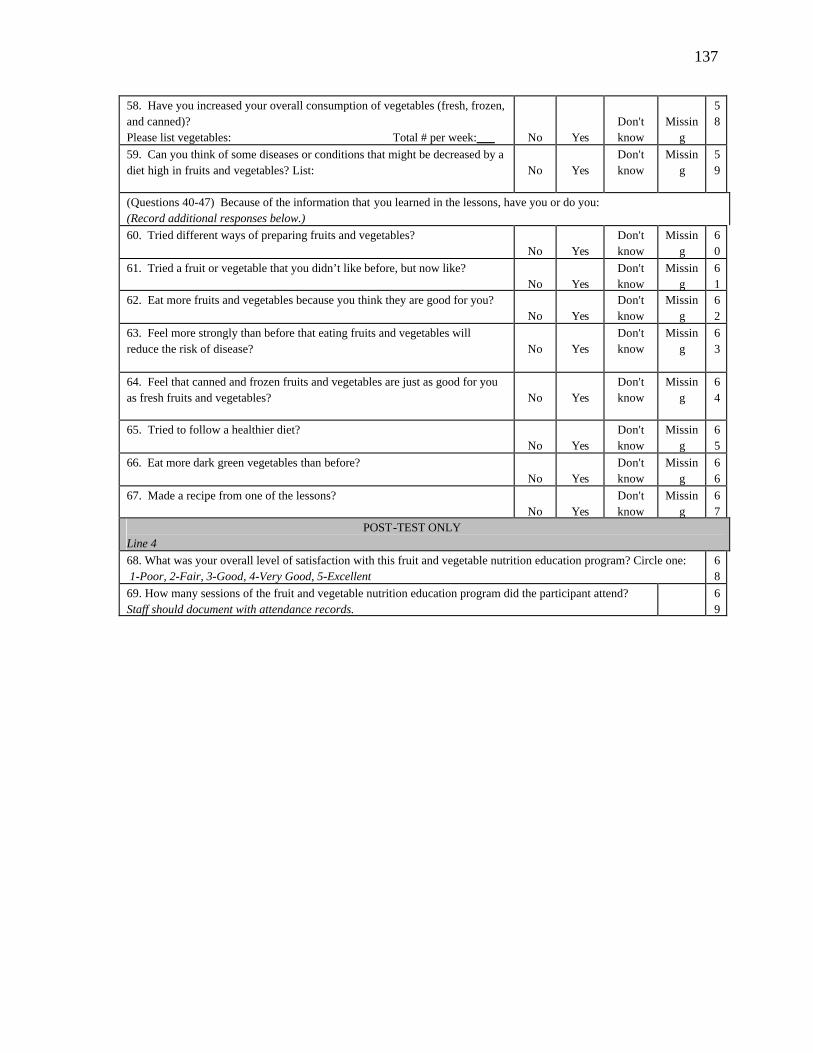
137
58. Have you increased your overall consumption of vegetables (fresh, frozen, and canned)? Please list vegetables: Total # per week:___
No
Yes
Don't know
Missin
g
58
59. Can you think of some diseases or conditions that might be decreased by a diet high in fruits and vegetables? List:
No
Yes
Don't know
Missing
59
(Questions 40-47) Because of the information that you learned in the lessons, have you or do you: (Record additional responses below.) 60. Tried different ways of preparing fruits and vegetables?
No
Yes
Don't know
Missing
60
61. Tried a fruit or vegetable that you didn’t like before, but now like?
No
Yes
Don't know
Missing
61
62. Eat more fruits and vegetables because you think they are good for you? No
Yes
Don't know
Missing
62
63. Feel more strongly than before that eating fruits and vegetables will reduce the risk of disease?
No
Yes
Don't know
Missing
63
64. Feel that canned and frozen fruits and vegetables are just as good for you as fresh fruits and vegetables?
No
Yes
Don't know
Missing
64
65. Tried to follow a healthier diet?
No
Yes
Don't know
Missing
65
66. Eat more dark green vegetables than before?
No
Yes
Don't know
Missing
66
67. Made a recipe from one of the lessons? No
Yes
Don't know
Missing
67
POST-TEST ONLY Line 4 68. What was your overall level of satisfaction with this fruit and vegetable nutrition education program? Circle one: 1-Poor, 2-Fair, 3-Good, 4-Very Good, 5-Excellent
68
69. How many sessions of the fruit and vegetable nutrition education program did the participant attend? Staff should document with attendance records.
69
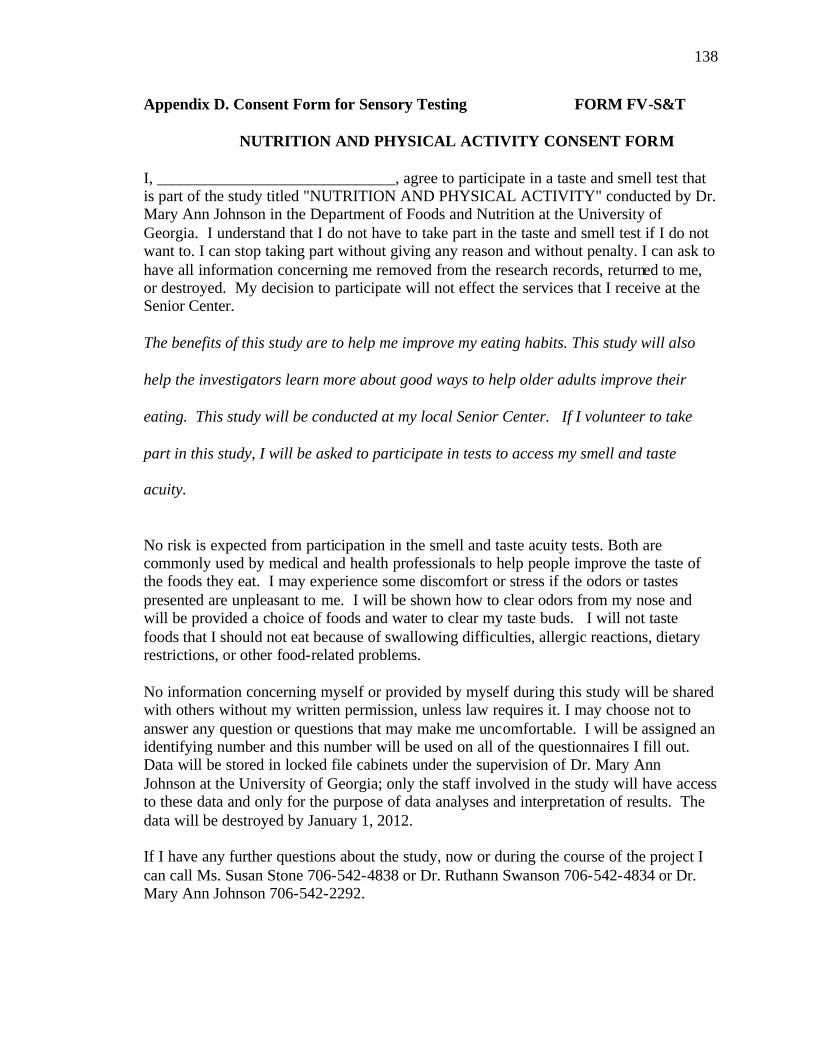
138
Appendix D. Consent Form for Sensory Testing FORM FV-S&T NUTRITION AND PHYSICAL ACTIVITY CONSENT FORM
I, ______________________________, agree to participate in a taste and smell test that is part of the study titled "NUTRITION AND PHYSICAL ACTIVITY" conducted by Dr. Mary Ann Johnson in the Department of Foods and Nutrition at the University of Georgia. I understand that I do not have to take part in the taste and smell test if I do not want to. I can stop taking part without giving any reason and without penalty. I can ask to have all information concerning me removed from the research records, returned to me, or destroyed. My decision to participate will not effect the services that I receive at the Senior Center. The benefits of this study are to help me improve my eating habits. This study will also
help the investigators learn more about good ways to help older adults improve their
eating. This study will be conducted at my local Senior Center. If I volunteer to take
part in this study, I will be asked to participate in tests to access my smell and taste
acuity.
No risk is expected from participation in the smell and taste acuity tests. Both are commonly used by medical and health professionals to help people improve the taste of the foods they eat. I may experience some discomfort or stress if the odors or tastes presented are unpleasant to me. I will be shown how to clear odors from my nose and will be provided a choice of foods and water to clear my taste buds. I will not taste foods that I should not eat because of swallowing difficulties, allergic reactions, dietary restrictions, or other food-related problems. No information concerning myself or provided by myself during this study will be shared with others without my written permission, unless law requires it. I may choose not to answer any question or questions that may make me uncomfortable. I will be assigned an identifying number and this number will be used on all of the questionnaires I fill out. Data will be stored in locked file cabinets under the supervision of Dr. Mary Ann Johnson at the University of Georgia; only the staff involved in the study will have access to these data and only for the purpose of data analyses and interpretation of results. The data will be destroyed by January 1, 2012. If I have any further questions about the study, now or during the course of the project I can call Ms. Susan Stone 706-542-4838 or Dr. Ruthann Swanson 706-542-4834 or Dr. Mary Ann Johnson 706-542-2292.
139
I will sign two copies of this form. I understand that I am agreeing by my signature on this form to take part in this project. I will receive a signed copy of this consent form for my records. ________________________ _______________________ _____________ Signature of Participant Participant's Printed Name Date _________________________________________________________________ Participant Address and Phone ________________________ _____Mary Ann Johnson___ _____________ Signature of Investigator Printed Name of Investigator Date Questions or problems regarding your rights as a participant should be addressed to Dr. Christina Joseph; Institutional Review Board; Office of V.P. for Research; The University of Georgia; 604A Graduate Studies Research Center; Athens, GA 30602-7411; Telephone 706-542-6514. UGA project number: H2000-10489-3 DHR project number: 990102

140
Appendix E. Taste & Smell Test Forms
Taste & Smell Test Questions We would like to know if you disagree, somewhat agree or strongly agree with these statements about the foods you eat...
Disagree Somewhat Agree
Strongly Agree
1. Foods that I used to enjoy eating just don’t taste right anymore.
2. I no longer eat at least one food that I used to enjoy eating because it just doesn’t taste right.
If response is agree, probe..... What food is that? ________________________ Any others? ___________________________ _____________________________ _____________________________ _____________________________ ______________________________
3. My food has little taste.
4. My mouth is often dry.
6. I often have an unpleasant taste in my mouth.
If response is agree, probe... How would you describe that taste?_____________________________________ Possible response categories : bitter, metallic, decayed, other How many medications do you routinely take each day? _____0 _____1 _____2 _____3 _____4 ______5 or more

141
Taste Test
The same food often tastes different to different people. For example, you might think the ____ you ate today were salty, but the person sitting next to you complained that the cooks forgot to add the salt again. The same food tasted different to the two of you. I have two little strips of paper. I want to see if you can taste anything on the papers and if so, how strong that taste is. (Demonstrate with a control strip, because do not want participant to chew and/or swallow strip.) First, take a sip of water. Paper 1(Control Strip) Ask: Is a taste present? ______yes _______no If yes, then ask: Would you describe that taste as slight, moderate or strong? ______slight ______moderate ______strong If strong, then ask: Would you describe the taste as strong or very strong? ______strong ______very strong Take another sip of water. Paper 2 (Impregnated Strip) Ask: Is a taste present? ______yes _______no If yes, then ask: Would you describe that taste as slight, moderate or strong? ______slight ______moderate ______strong If strong, then ask: Would you describe the taste as strong or very strong? ______strong ______very strong You can have another sip of water, a bite of cracker or apple slice if you’d like to clean
your mouth. Thanks for your help. Please don’t talk with anyone else about these questions until after you leave today. Again, thanks.
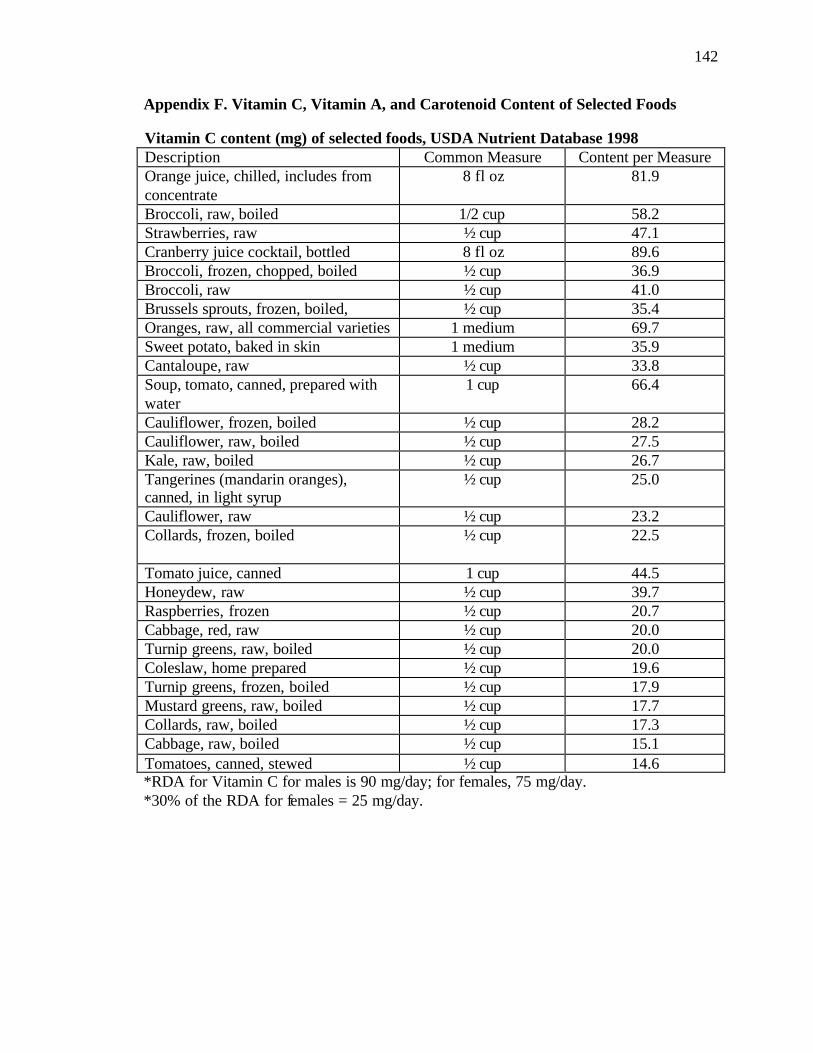
142
Appendix F. Vitamin C, Vitamin A, and Carotenoid Content of Selected Foods Vitamin C content (mg) of selected foods, USDA Nutrient Database 1998 Description Common Measure Content per Measure Orange juice, chilled, includes from concentrate
8 fl oz 81.9
Broccoli, raw, boiled 1/2 cup 58.2 Strawberries, raw ½ cup 47.1 Cranberry juice cocktail, bottled 8 fl oz 89.6 Broccoli, frozen, chopped, boiled ½ cup 36.9 Broccoli, raw ½ cup 41.0 Brussels sprouts, frozen, boiled, ½ cup 35.4 Oranges, raw, all commercial varieties 1 medium 69.7 Sweet potato, baked in skin 1 medium 35.9 Cantaloupe, raw ½ cup 33.8 Soup, tomato, canned, prepared with water
1 cup 66.4
Cauliflower, frozen, boiled ½ cup 28.2 Cauliflower, raw, boiled ½ cup 27.5 Kale, raw, boiled ½ cup 26.7 Tangerines (mandarin oranges), canned, in light syrup
½ cup 25.0
Cauliflower, raw ½ cup 23.2 Collards, frozen, boiled ½ cup 22.5
Tomato juice, canned 1 cup 44.5 Honeydew, raw ½ cup 39.7 Raspberries, frozen ½ cup 20.7 Cabbage, red, raw ½ cup 20.0 Turnip greens, raw, boiled ½ cup 20.0 Coleslaw, home prepared ½ cup 19.6 Turnip greens, frozen, boiled ½ cup 17.9 Mustard greens, raw, boiled ½ cup 17.7 Collards, raw, boiled ½ cup 17.3 Cabbage, raw, boiled ½ cup 15.1 Tomatoes, canned, stewed ½ cup 14.6 *RDA for Vitamin C for males is 90 mg/day; for females, 75 mg/day. *30% of the RDA for females = 25 mg/day.
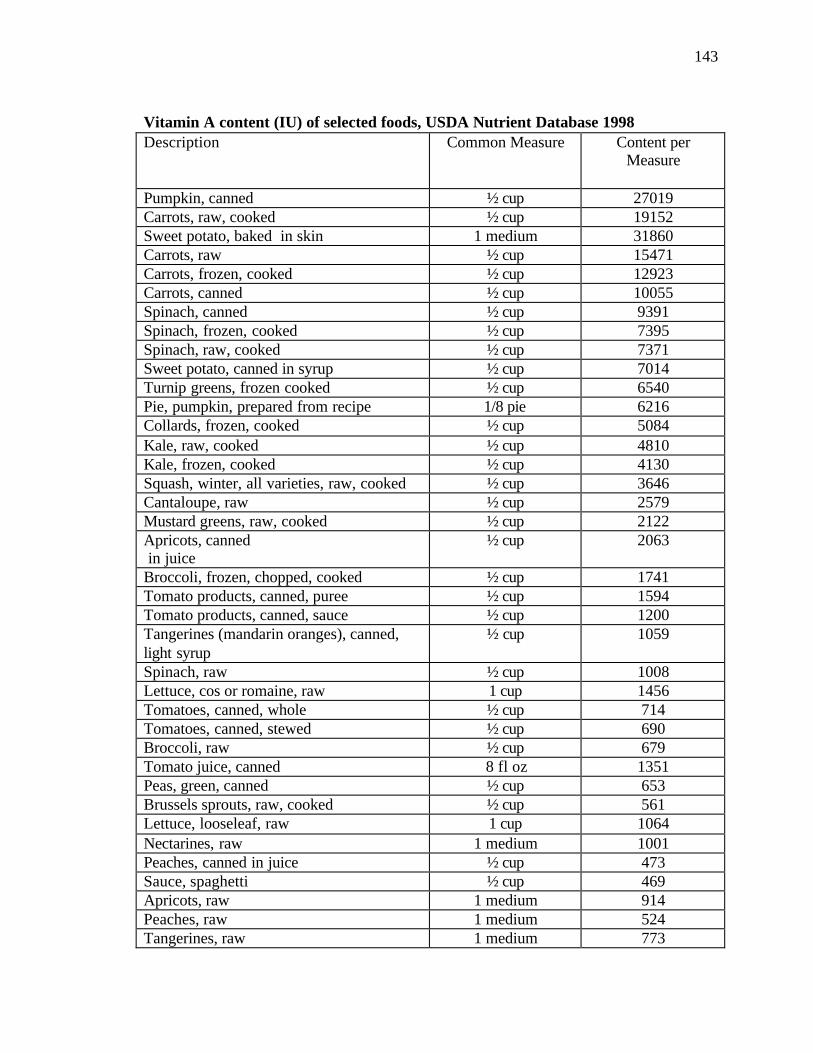
143
Vitamin A content (IU) of selected foods, USDA Nutrient Database 1998 Description Common Measure Content per
Measure
Pumpkin, canned ½ cup 27019 Carrots, raw, cooked ½ cup 19152 Sweet potato, baked in skin 1 medium 31860 Carrots, raw ½ cup 15471 Carrots, frozen, cooked ½ cup 12923 Carrots, canned ½ cup 10055 Spinach, canned ½ cup 9391 Spinach, frozen, cooked ½ cup 7395 Spinach, raw, cooked ½ cup 7371 Sweet potato, canned in syrup ½ cup 7014 Turnip greens, frozen cooked ½ cup 6540 Pie, pumpkin, prepared from recipe 1/8 pie 6216 Collards, frozen, cooked ½ cup 5084 Kale, raw, cooked ½ cup 4810 Kale, frozen, cooked ½ cup 4130 Squash, winter, all varieties, raw, cooked ½ cup 3646 Cantaloupe, raw ½ cup 2579 Mustard greens, raw, cooked ½ cup 2122 Apricots, canned in juice
½ cup 2063
Broccoli, frozen, chopped, cooked ½ cup 1741 Tomato products, canned, puree ½ cup 1594 Tomato products, canned, sauce ½ cup 1200 Tangerines (mandarin oranges), canned, light syrup
½ cup 1059
Spinach, raw ½ cup 1008 Lettuce, cos or romaine, raw 1 cup 1456 Tomatoes, canned, whole ½ cup 714 Tomatoes, canned, stewed ½ cup 690 Broccoli, raw ½ cup 679 Tomato juice, canned 8 fl oz 1351 Peas, green, canned ½ cup 653 Brussels sprouts, raw, cooked ½ cup 561 Lettuce, looseleaf, raw 1 cup 1064 Nectarines, raw 1 medium 1001 Peaches, canned in juice ½ cup 473 Sauce, spaghetti ½ cup 469 Apricots, raw 1 medium 914 Peaches, raw 1 medium 524 Tangerines, raw 1 medium 773

144
Cabbage, raw ½ cup 350 Soup, tomato, canned, prepared with water 1 cup 688 Squash, summer, all varieties, cooked ½ cup 259 Fruit cocktail, canned in syrup ½ cup 254 *RDA for Vitamin A for men aged 19+ is 3000 IU, and for women aged 19+ is 2330 IU. * 30% of the RDA for females = 777 IU.

145
Carotenoid content (µg/100g edible portion) of selected foods, USDA Nutrient Database 1998
Description Beta-carotene Beta-cryptoxanthin
Lutein + Zeaxanthin
Lycopene
Apricots, canned, heavy syrup
6640 65
Apricots, raw 2554 5 Beans, baked, canned
408
Blueberries, raw 35 Broccoli, cooked, boiled
1042 2226
Broccoli, frozen, cooked
1000 830
Broccoli, raw 779 2445 Brussels sprouts, cooked
465 1290
Cabbage, cooked 90 Cabbage, raw 65 310 Carrots, baby, raw 7275 358 Carrots, cooked 8015 Carrots, canned 5776 Carrots, frozen, cooked
12272
Carrots, raw 8836 Collards, cooked 4418 20 8091 Fruit cocktail, canned, heavy syrup
138 52 112
Kale, cooked 6202 15798 Lasagna with meat & tomato sauce
170 97 7750
Lettuce, cos or romaine, raw
1272 2635
Lettuce, iceberg 192 352 Melons, cantaloupe 1595 40 Nectarines, raw 101 59 Onions, spring, raw 391 Orange juice, frozen, diluted with water
24 99 138
Oranges, raw 51 122 187 Peaches, canned, heavy syrup
334 141 33
Peaches, raw 97 24 57 Peas, green, canned 320 1350
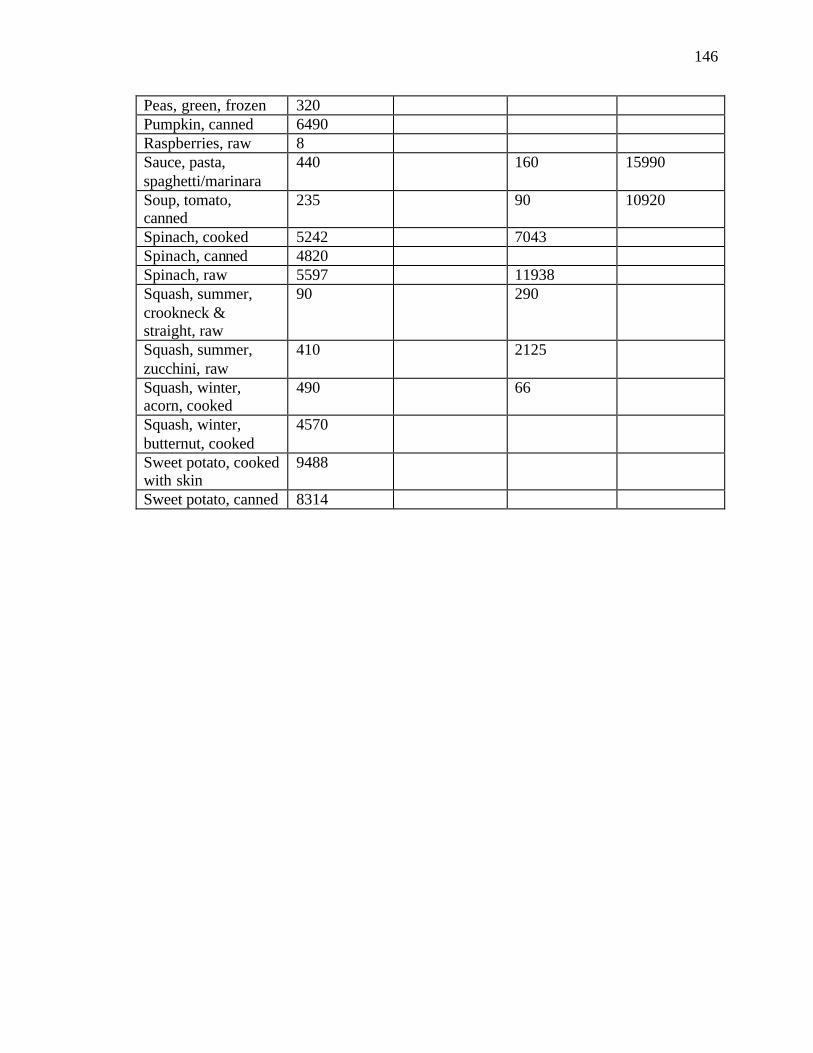
146
Peas, green, frozen 320 Pumpkin, canned 6490 Raspberries, raw 8 Sauce, pasta, spaghetti/marinara
440 160 15990
Soup, tomato, canned
235 90 10920
Spinach, cooked 5242 7043 Spinach, canned 4820 Spinach, raw 5597 11938 Squash, summer, crookneck & straight, raw
90 290
Squash, summer, zucchini, raw
410 2125
Squash, winter, acorn, cooked
490 66
Squash, winter, butternut, cooked
4570
Sweet potato, cooked with skin
9488
Sweet potato, canned 8314
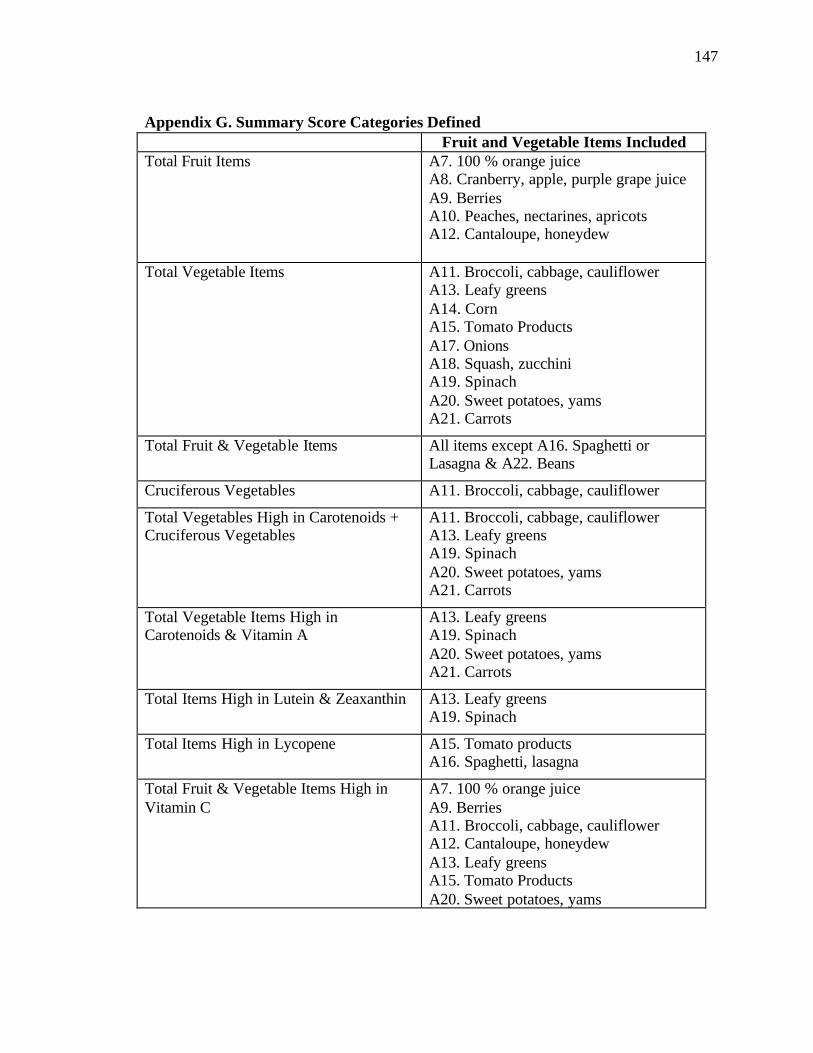
147
Appendix G. Summary Score Categories Defined
Fruit and Vegetable Items Included Total Fruit Items A7. 100 % orange juice
A8. Cranberry, apple, purple grape juice A9. Berries A10. Peaches, nectarines, apricots A12. Cantaloupe, honeydew
Total Vegetable Items A11. Broccoli, cabbage, cauliflower A13. Leafy greens A14. Corn A15. Tomato Products A17. Onions A18. Squash, zucchini A19. Spinach A20. Sweet potatoes, yams A21. Carrots
Total Fruit & Vegetable Items All items except A16. Spaghetti or Lasagna & A22. Beans
Cruciferous Vegetables A11. Broccoli, cabbage, cauliflower
Total Vegetables High in Carotenoids + Cruciferous Vegetables
A11. Broccoli, cabbage, cauliflower A13. Leafy greens A19. Spinach A20. Sweet potatoes, yams A21. Carrots
Total Vegetable Items High in Carotenoids & Vitamin A
A13. Leafy greens A19. Spinach A20. Sweet potatoes, yams A21. Carrots
Total Items High in Lutein & Zeaxanthin A13. Leafy greens A19. Spinach
Total Items High in Lycopene A15. Tomato products A16. Spaghetti, lasagna
Total Fruit & Vegetable Items High in Vitamin C
A7. 100 % orange juice A9. Berries A11. Broccoli, cabbage, cauliflower A12. Cantaloupe, honeydew A13. Leafy greens A15. Tomato Products A20. Sweet potatoes, yams
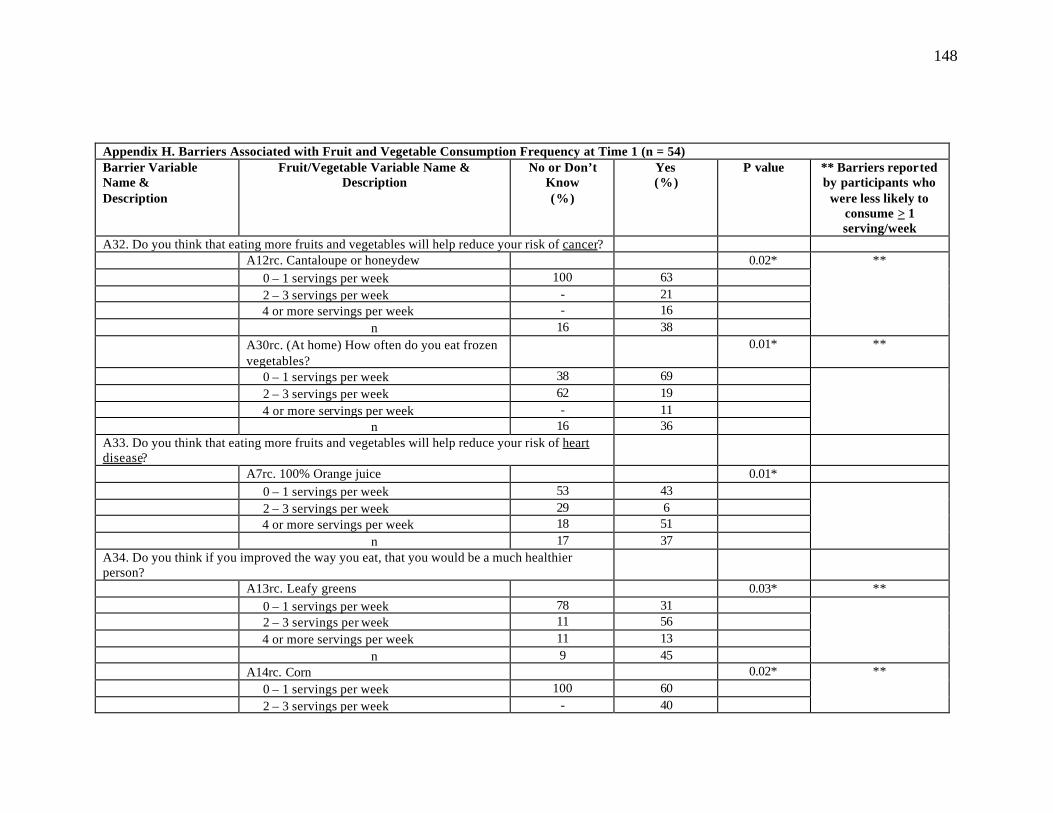
148
Appendix H. Barriers Associated with Fruit and Vegetable Consumption Frequency at Time 1 (n = 54) Barrier Variable Name & Description
Fruit/Vegetable Variable Name & Description
No or Don’t Know (%)
Yes (%)
P value ** Barriers reported by participants who
were less likely to consume > 1 serving/week
A32. Do you think that eating more fruits and vegetables will help reduce your risk of cancer? A12rc. Cantaloupe or honeydew 0.02* 0 – 1 servings per week 100 63 2 – 3 servings per week - 21
4 or more servings per week - 16 n 16 38
**
A30rc. (At home) How often do you eat frozen vegetables?
0.01* **
0 – 1 servings per week 38 69 2 – 3 servings per week 62 19 4 or more servings per week - 11 n 16 36
A33. Do you think that eating more fruits and vegetables will help reduce your risk of heart disease?
A7rc. 100% Orange juice 0.01* 0 – 1 servings per week 53 43 2 – 3 servings per week 29 6
4 or more servings per week 18 51 n 17 37
A34. Do you think if you improved the way you eat, that you would be a much healthier person?
A13rc. Leafy greens 0.03* ** 0 – 1 servings per week 78 31 2 – 3 servings per week 11 56
4 or more servings per week 11 13 n 9 45
A14rc. Corn 0.02* 0 – 1 servings per week 100 60 2 – 3 servings per week - 40
**

149
4 or more servings per week - - n 9 40
AllFrrc. All fruit items 0.02* 0 – 6 servings per week 33 38 7 – 13 servings per week 67 33 14 or more servings per week - 29 n 9 45
A37. Do you like the way most vegetables taste? A29rc. (At home) How often do you eat fresh
vegetables? 0.02*
0 – 1 servings per week - 26 2 – 3 servings per week 73 30 4 or more servings per week 27 44 n 11 43
A41. Would you like to know more about different ways to cook vegetables?
A24rc. How often do you eat fruit for dessert? 0.04* ** 0 – 1 servings per week 85 48 2 – 3 servings per week 15 27 4 or more servings per week - 25 n 13 40
A42. Would you like a handout with healthy menus to take home? A9rc. Berries 0.001* 0 – 1 servings per week 75 82 2 – 3 servings per week - 18 4 or more servings per week 25 - n 8 44
A13rc. Leafy greens 0.01* 0 – 1 servings per week 88 32 2 – 3 servings per week 12 52 4 or more servings per week - 16 n 8 44
**
A27rc. (At home) how often do you eat frozen fruit?
0.05*
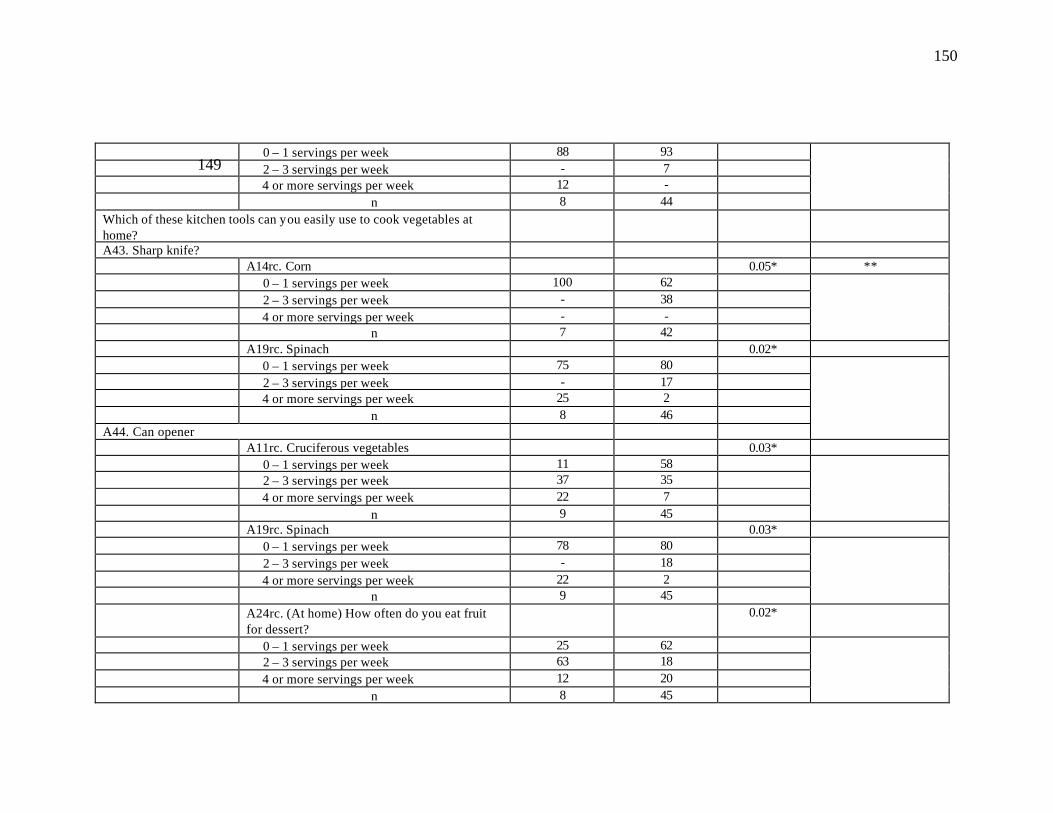
150
0 – 1 servings per week 88 93 2 – 3 servings per week - 7 4 or more servings per week 12 - n 8 44
Which of these kitchen tools can you easily use to cook vegetables at home?
A43. Sharp knife? A14rc. Corn 0.05* ** 0 – 1 servings per week 100 62 2 – 3 servings per week - 38 4 or more servings per week - - n 7 42
A19rc. Spinach 0.02* 0 – 1 servings per week 75 80 2 – 3 servings per week - 17 4 or more servings per week 25 2 n 8 46 A44. Can opener
A11rc. Cruciferous vegetables 0.03* 0 – 1 servings per week 11 58 2 – 3 servings per week 37 35 4 or more servings per week 22 7 n 9 45
A19rc. Spinach 0.03* 0 – 1 servings per week 78 80 2 – 3 servings per week - 18 4 or more servings per week 22 2 n 9 45
A24rc. (At home) How often do you eat fruit for dessert?
0.02*
0 – 1 servings per week 25 62 2 – 3 servings per week 63 18 4 or more servings per week 12 20 n 8 45
149

151
A45. Pot of hot water A19rc. Spinach 0.05* 0 – 1 servings per week 82 79 2 – 3 servings per week - 19 4 or more servings per week 18 2 n 11 43
A46. Do you shop for your own groceries? A15rc. Cooked tomato products 0.05* 0 – 1 servings per week 50 59 2 – 3 servings per week 21 36 4 or more servings per week 29 5 n 14 39
A20rc. Sweet potatoes or yams 0.04* 0 – 1 servings per week 62 67 2 – 3 servings per week 23 33 4 or more servings per week 15 - n 13 39
A22rc. Beans 0.05* 0 – 1 servings per week 64 69 2 – 3 servings per week 21 31 4 or more servings per week 14 - n 14 39
A48. Do you plan the meals you eat? A11rc. Cruciferous vegetables 0.05* 0 – 1 servings per week 18 58 2 – 3 servings per week 64 35 4 or more servings per week 18 7 n 11 43
A19rc. Spinach 0.05* 0 – 1 servings per week 82 79 2 – 3 servings per week - 19 4 or more servings per week 18 2 n 11 43
A20rc. Sweet potatoes or yams 0.01*
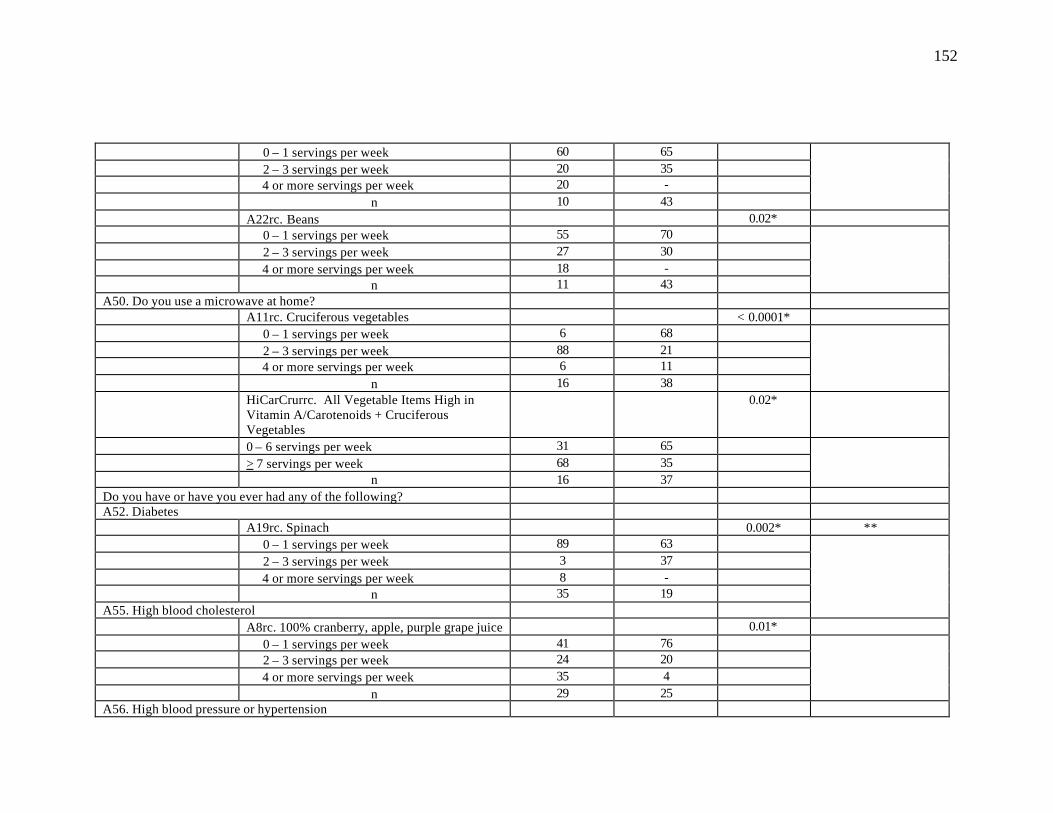
152
0 – 1 servings per week 60 65 2 – 3 servings per week 20 35 4 or more servings per week 20 - n 10 43
A22rc. Beans 0.02* 0 – 1 servings per week 55 70 2 – 3 servings per week 27 30 4 or more servings per week 18 - n 11 43
A50. Do you use a microwave at home? A11rc. Cruciferous vegetables < 0.0001* 0 – 1 servings per week 6 68 2 – 3 servings per week 88 21 4 or more servings per week 6 11 n 16 38
HiCarCrurrc. All Vegetable Items High in Vitamin A/Carotenoids + Cruciferous Vegetables
0.02*
0 – 6 servings per week 31 65 > 7 servings per week 68 35 n 16 37
Do you have or have you ever had any of the following? A52. Diabetes A19rc. Spinach 0.002* ** 0 – 1 servings per week 89 63 2 – 3 servings per week 3 37 4 or more servings per week 8 - n 35 19 A55. High blood cholesterol
A8rc. 100% cranberry, apple, purple grape juice 0.01* 0 – 1 servings per week 41 76 2 – 3 servings per week 24 20 4 or more servings per week 35 4 n 29 25
A56. High blood pressure or hypertension

153
A7. 100% Orange juice 0.04* ** 0 – 1 servings per week 65 32 2 – 3 servings per week 13 13 4 or more servings per week 22 55 n 23 31
A36. How many fruits and vegetables should people eat each day? 1 – 4 per servings day or
Don’t Know
5 or more servings per
day
A11rc. Cruciferous vegetables 0.01* ** 0 – 1 servings per week 56 31 2 – 3 servings per week 42 38 4 or more servings per week 2 31 n 41 13
A17rc. Onions 0.04* ** 0 – 1 servings per week 44 31 2 – 3 servings per week 24 61 4 or more servings per week 32 8 n 41 13
AllFVrc. Total Fruit and Vegetable Items (excluding A16 & A22)
0.03*
0 – 13 servings per week 22 25 14 – 20 servings per week 12 50 21 – 27 servings per week 37 8 28 – 34 servings per week 12 17 > 35 servings per week 17 - n 41 12
* P values < 0.05 were considered significant.


155
Appendix J. Responses to Open-Ended Questions at Time 2 Not all participants who answered “yes” provided further responses. The most common
answers to questions which received two or more responses are included below.
Responses to open-ended questions provided further insight into participants’
behaviors by allowing them to state, in their own words, how their behavior has changed
since pre-test. Sixty-six percent (n=31) reported that they increased their overall
consumption of fruit or fruit juice, while 53 percent (n=25) reported increasing their
overall vegetable intake. The most common responses to increased fruit or fruit juice
intake were: cranberry, apple, or grape juice (n=9), 100 percent orange juice (n=8),
peaches (n=7), berries (6), apples (n=6), and bananas (n=5). The most common
responses to increased vegetable intake were: cabbage (n=7), collard or turnip greens
(n=7), beans (n=6), peas (n=6), and corn (n=4). Twenty-eight (n=13) reported trying a
fruit or vegetable that they never liked before but now like. Responses included spinach
(n=3), beans, (n=3), and broccoli (n=2). Fifty-four percent state that they now eat more
dark green fruits and vegetables, including collards and turnips (n=1), cabbage, (n=1),
spinach (n=1), and broccoli (n=1). Only 28 percent of participants felt that canned and
frozen fruits and vegetables are just as good as fresh; two stated that they still preferred
fresh even though they felt canned and frozen were equally good.
Forty-eight percent (n=21) of participants reported using different methods to
prepare vegetables and fruit. These methods included cooking vegetables with butter or
margarine instead of fatback (n=2); steaming, baking, or boiling vegetables more and
frying less (n=5); eating more raw vegetables (n=1); using less salt to season vegetables
(n=1); and sweetening fruit with artificial sweetener (n=1). Twenty-two percent (n=10)
156
made a recipe from one of the handouts given at each session, but only one person was
able to name the recipe.
Fifty-five percent (n=26) were able to name disease risks that may be lowered by
a diet high in fruits and vegetables, including cancer (n=16), heart disease (n=12), high
blood pressure (n=6), and diabetes (n=3). When participants were asked if they have
increased their fruit and vegetable consumption due to perceived health benefits, 80
percent (n=37) responded yes. Seventy-eight percent (n=36) responded that, since the
intervention, they feel more strongly about the health benefits of fruits and vegetables; 63
percent have tried to follow a healthier diet by eating more fruits and vegetables (n=2),
and eating less sweets and high-fat foods (n=2).