a framework for simulations in clinical … framework for simulations in clinical research ... •...
TRANSCRIPT

A FRAMEWORK FOR SIMULATIONS IN CLINICAL RESEARCH with applications in small populations and rare diseases Tim Friede1, Norbert Benda2
1University Medical Center Göttingen, Göttingen, Germany 2Federal Institute for Drugs and Medical Devices, Bonn, Germany

2
This research has received funding from the EU‘s 7th Framework Programme for research, technological development and demonstration under grant agreement number FP HEALTH 2013 – 602144 with project title (acronym) „Innovative methodology for small populations research“ (InSPiRe).
The worked example is joint work with
Frank Konietschke (Dallas)
Markus Pauly (Ulm)
ACKNOWLEDGEMENTS
3
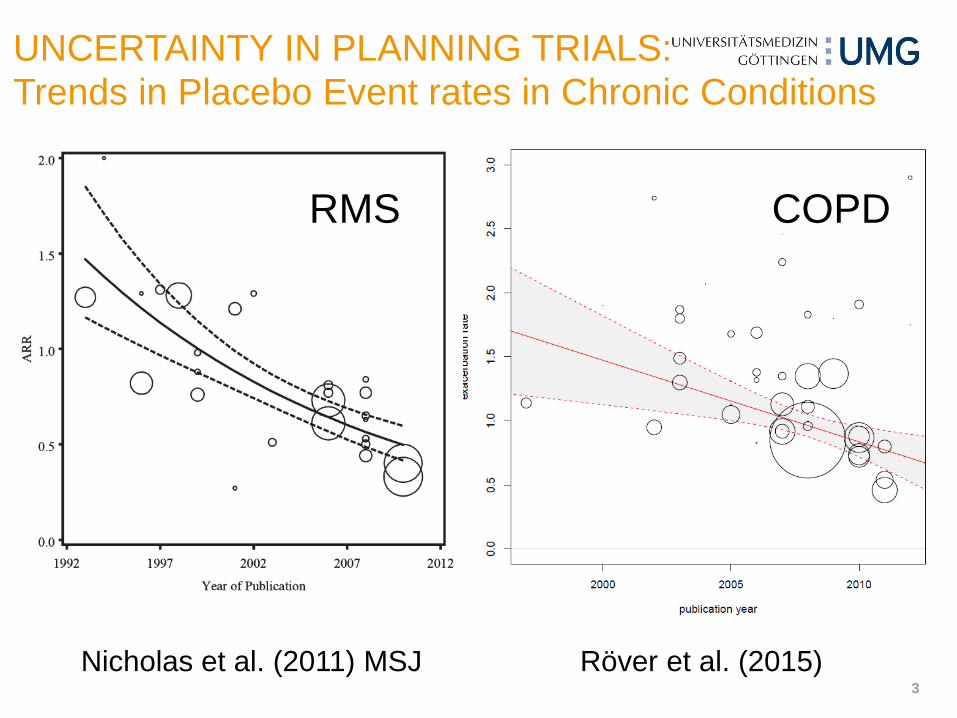
UNCERTAINTY IN PLANNING TRIALS: Trends in Placebo Event rates in Chronic Conditions
Röver et al. (2015) Nicholas et al. (2011) MSJ
RMS COPD
4
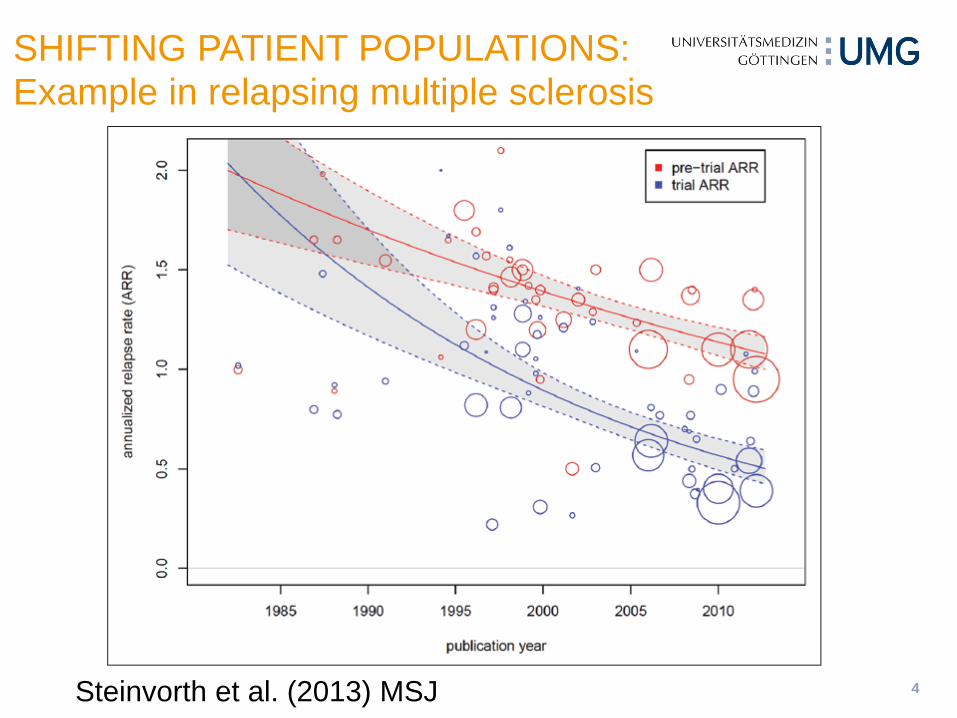
SHIFTING PATIENT POPULATIONS: Example in relapsing multiple sclerosis
Steinvorth et al. (2013) MSJ

5
With rising pressure on resources for clinical trials and shifting patient populations (see for example Steinvorth et al. (2013) for an example in relapsing multiple sclerosis) there is an increasing demand for efficient and robust clinical trials.
As a consequence the way clinical trials are planned, conducted and analysed is changing with a move to more complex designs and analysis methods, which in turn leads to more frequent use of Monte Carlo simulations to plan individual clinical trials or entire clinical development programmes consisting of multiple clinical trials.
BACKGROUND
6
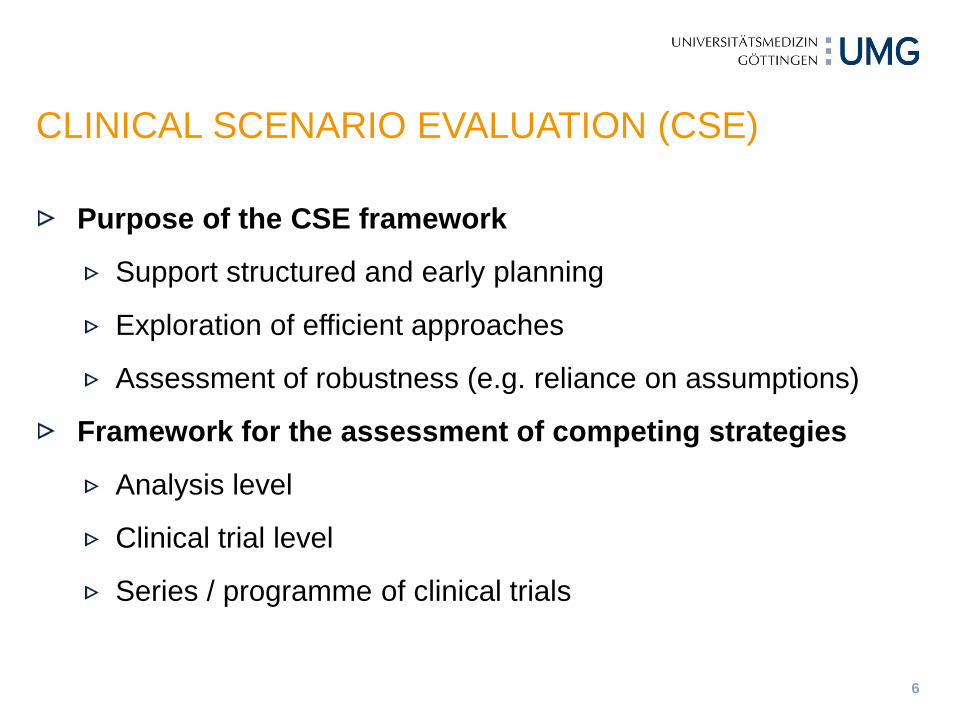
Purpose of the CSE framework
Support structured and early planning
Exploration of efficient approaches
Assessment of robustness (e.g. reliance on assumptions)
Framework for the assessment of competing strategies
Analysis level
Clinical trial level
Series / programme of clinical trials
CLINICAL SCENARIO EVALUATION (CSE)
7
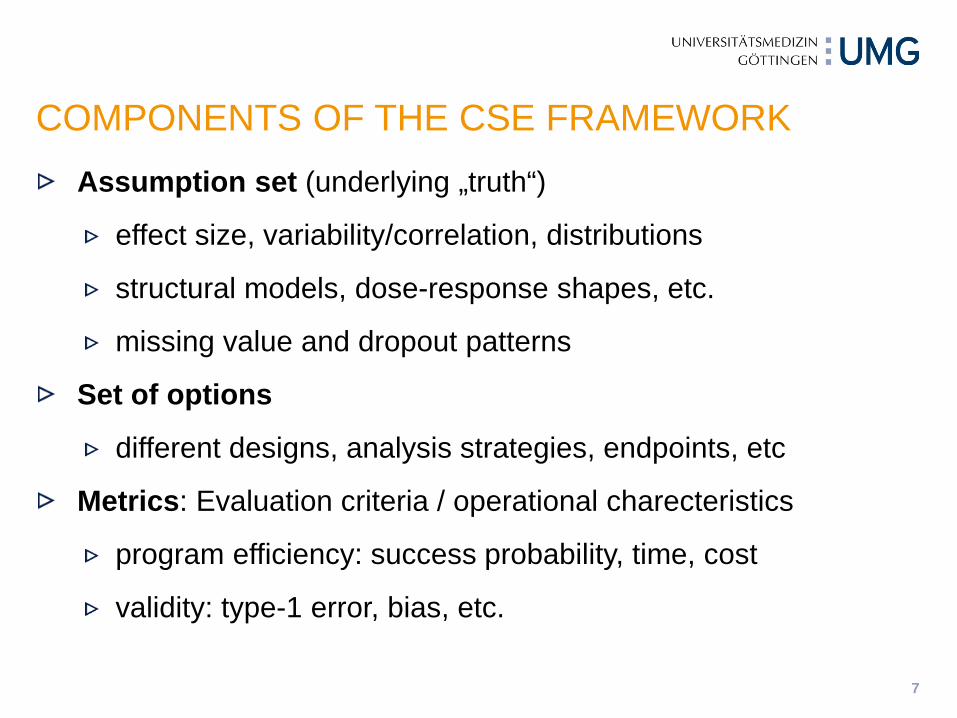
Assumption set (underlying „truth“)
effect size, variability/correlation, distributions
structural models, dose-response shapes, etc.
missing value and dropout patterns
Set of options
different designs, analysis strategies, endpoints, etc
Metrics: Evaluation criteria / operational charecteristics
program efficiency: success probability, time, cost
validity: type-1 error, bias, etc.
COMPONENTS OF THE CSE FRAMEWORK

8
CSE FRAMEWORK
Figure 2 from Benda et al (2010) DIJ
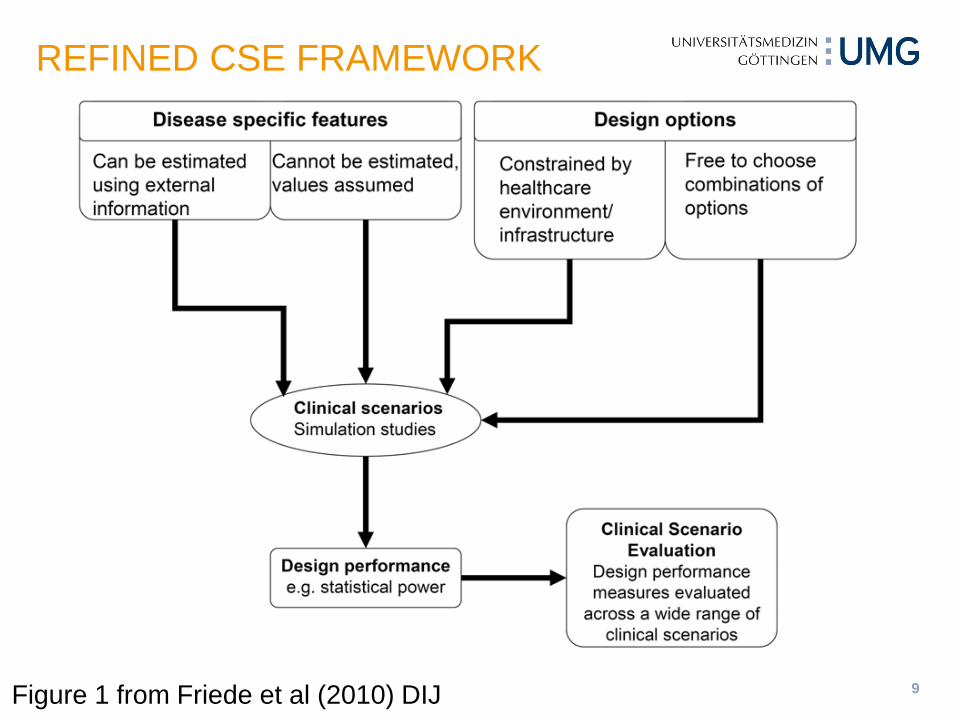
9 Figure 1 from Friede et al (2010) DIJ
REFINED CSE FRAMEWORK
10
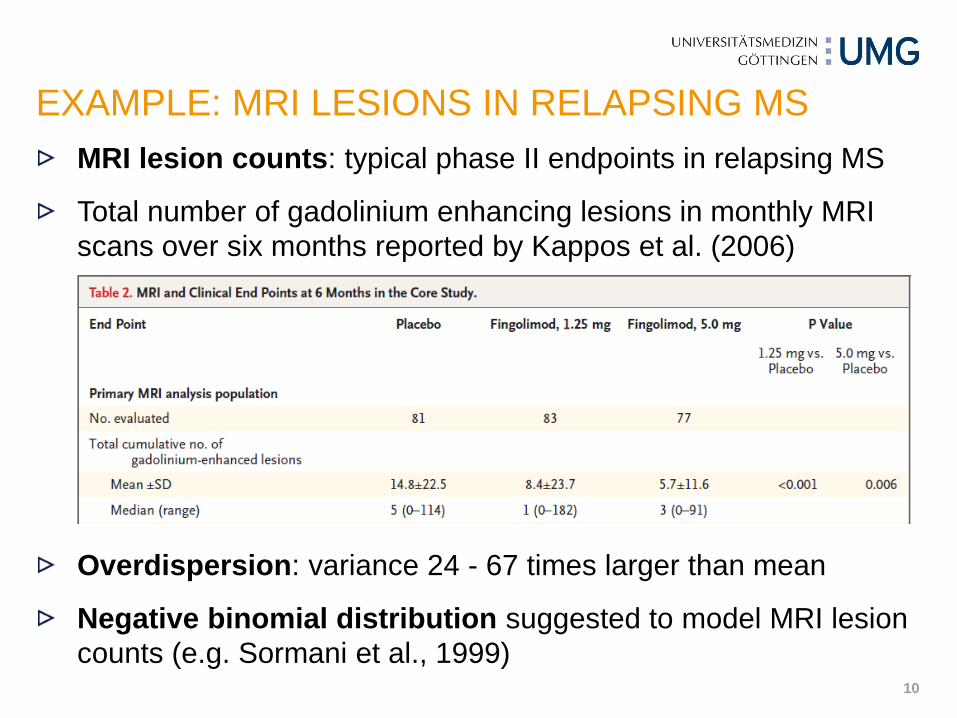
MRI lesion counts: typical phase II endpoints in relapsing MS
Total number of gadolinium enhancing lesions in monthly MRI scans over six months reported by Kappos et al. (2006)
Overdispersion: variance 24 - 67 times larger than mean
Negative binomial distribution suggested to model MRI lesion counts (e.g. Sormani et al., 1999)
EXAMPLE: MRI LESIONS IN RELAPSING MS
11
RCT in paediatric multiple sclerosis (Pakdamen et al, 2006)
assessing efficacy and safety of interferon beta-1a compared to no treatment
N=16 patients randomized
Endpoints: relapse rates and new T2 lesions
Phase II trial of autologous mesenchymal stem cells in MS
relapsing-remitting MS patients not responding to at least a year of approved therapy
efficacy endpoint: cumulative number of gadolinium-enhancing lesions (GEL)
N=9 patients randomized (planned n=16)
SMALL SAMPLES AND RARE DISEASES
12
Assumptions
Distribution (e.g. NB), group-specific / common overdispersion parameter, size of treatment effect etc.
Options
Analysis method: Test statistic and reference distribution
Metrics
Type I error rate
Power / sample size
EXAMPLE: CSE TO INFORM CHOICE OF ANALYSIS METHOD

13
Statistical model:
allowing for varying follow-up times, group-specific overdispersion parameters
Hypotheses: e.g.
STATISTICAL MODEL AND HYPOTHESES
Konietschke et al (2015)

14
Wald-type test statistics
Variance estimators
Moment estimator (simpler to compute; unbiased; more robust to model misspecifications)
Maximum-likelihood estimator (smaller variance under assumed model)
WALD-TYPE STATISTICS
Konietschke et al (2015)
15
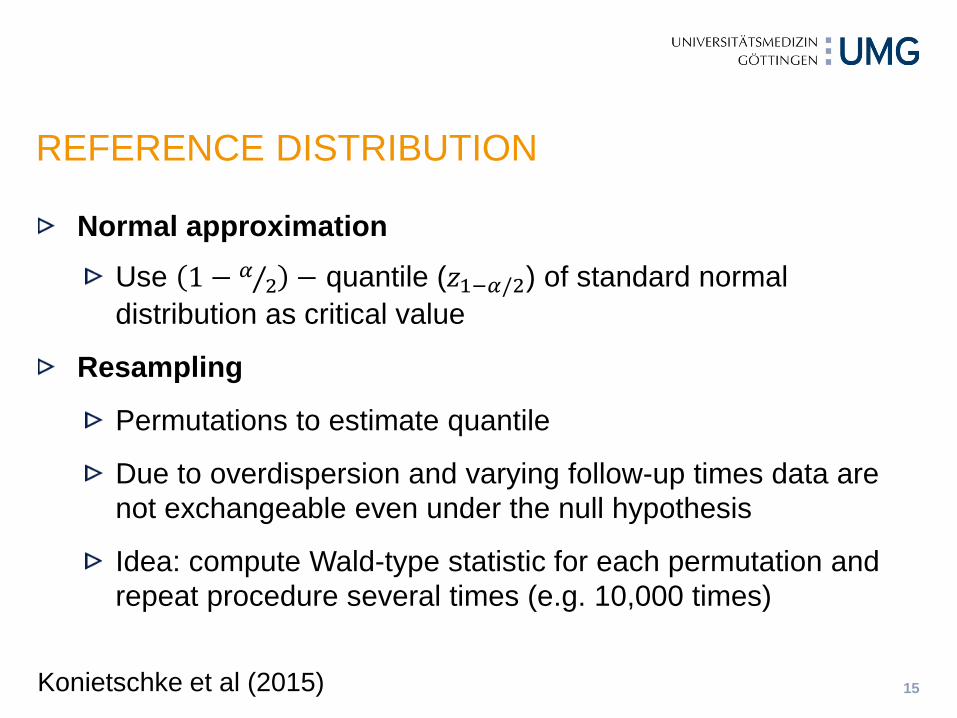
Normal approximation Use 1 − 𝛼
2⁄ − quantile (𝑧1−𝛼/2) of standard normal distribution as critical value
Resampling
Permutations to estimate quantile
Due to overdispersion and varying follow-up times data are not exchangeable even under the null hypothesis
Idea: compute Wald-type statistic for each permutation and repeat procedure several times (e.g. 10,000 times)
REFERENCE DISTRIBUTION
Konietschke et al (2015)
16
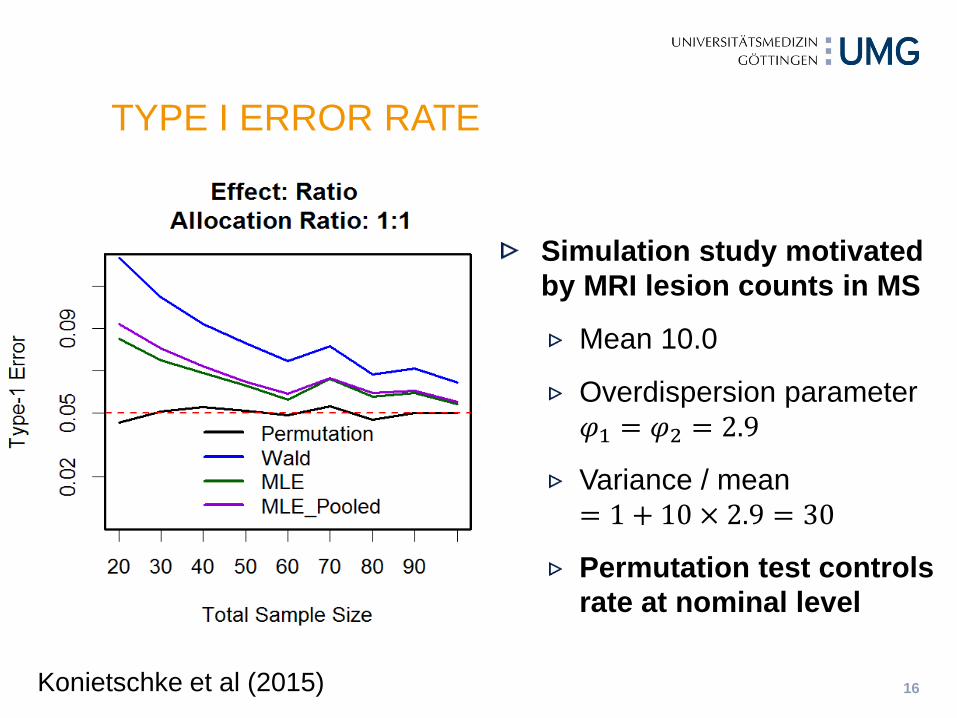
TYPE I ERROR RATE
Simulation study motivated by MRI lesion counts in MS
Mean 10.0
Overdispersion parameter 𝜑1 = 𝜑2 = 2.9
Variance / mean = 1 + 10 × 2.9 = 30
Permutation test controls rate at nominal level
Konietschke et al (2015)
17
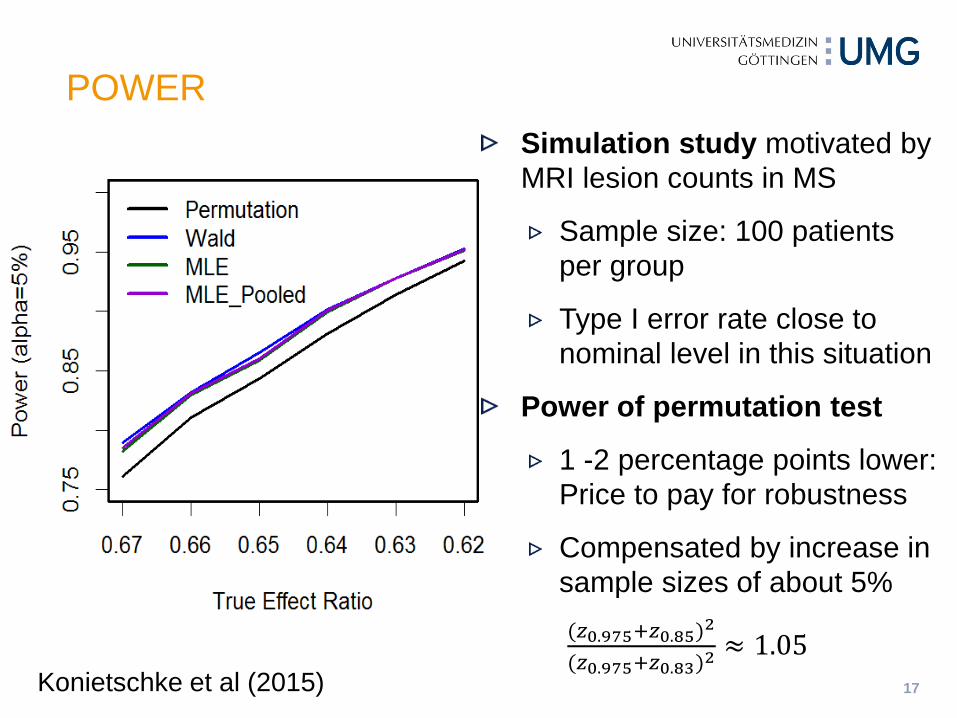
Simulation study motivated by MRI lesion counts in MS
Sample size: 100 patients per group
Type I error rate close to nominal level in this situation
Power of permutation test
1 -2 percentage points lower: Price to pay for robustness
Compensated by increase in sample sizes of about 5% (𝑧0.975+𝑧0.85)2
(𝑧0.975+𝑧0.83)2≈ 1.05
POWER
Konietschke et al (2015)
18
EARLY PRO-TECT Alport Trial
Extrapolation from larger to smaller populations, e.g. from adutls to children
EXAMPLES FOR COMPLEX TRIALS IN RARE DISEASES

19
Alport disease
Rare genetic disease leading ultimately to kidney failure
Data from the European registry suggest ACE inhibition delays kidney failure (Gross et al, 2012a)
EARLY PRO-TECT ALPORT TRIAL

20
Double-blind RCT in children
Difficulties in recruitment to be expected
EARLY PRO-TECT Alport Trial (Gross et al, 2012b)
EARLY PRO-TECT ALPORT TRIAL
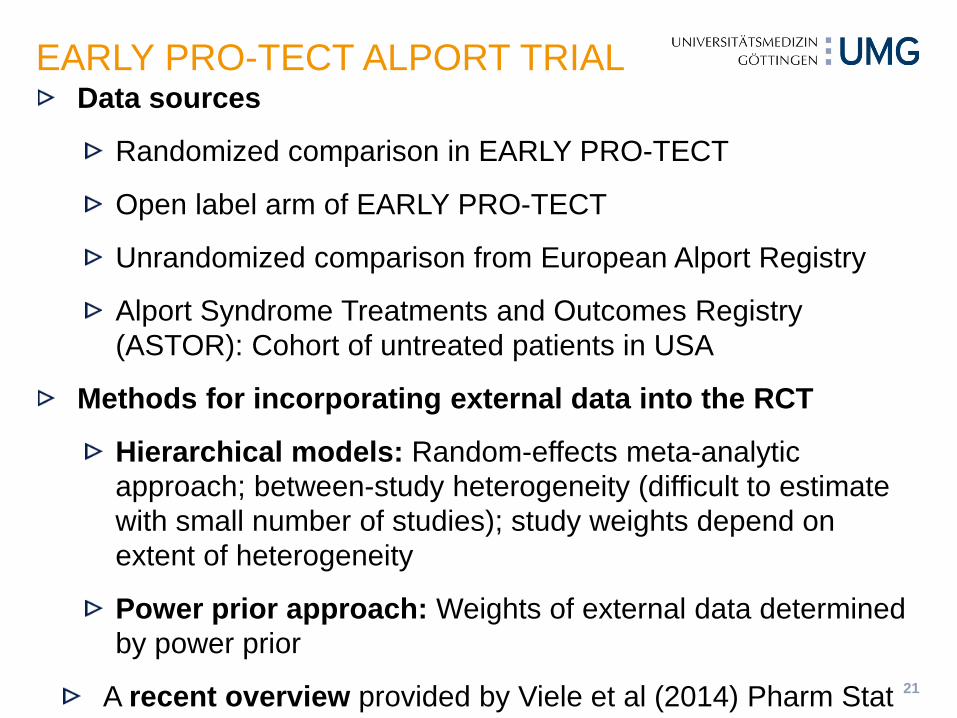
21
Data sources
Randomized comparison in EARLY PRO-TECT
Open label arm of EARLY PRO-TECT
Unrandomized comparison from European Alport Registry
Alport Syndrome Treatments and Outcomes Registry (ASTOR): Cohort of untreated patients in USA
Methods for incorporating external data into the RCT
Hierarchical models: Random-effects meta-analytic approach; between-study heterogeneity (difficult to estimate with small number of studies); study weights depend on extent of heterogeneity
Power prior approach: Weights of external data determined by power prior
A recent overview provided by Viele et al (2014) Pharm Stat
EARLY PRO-TECT ALPORT TRIAL
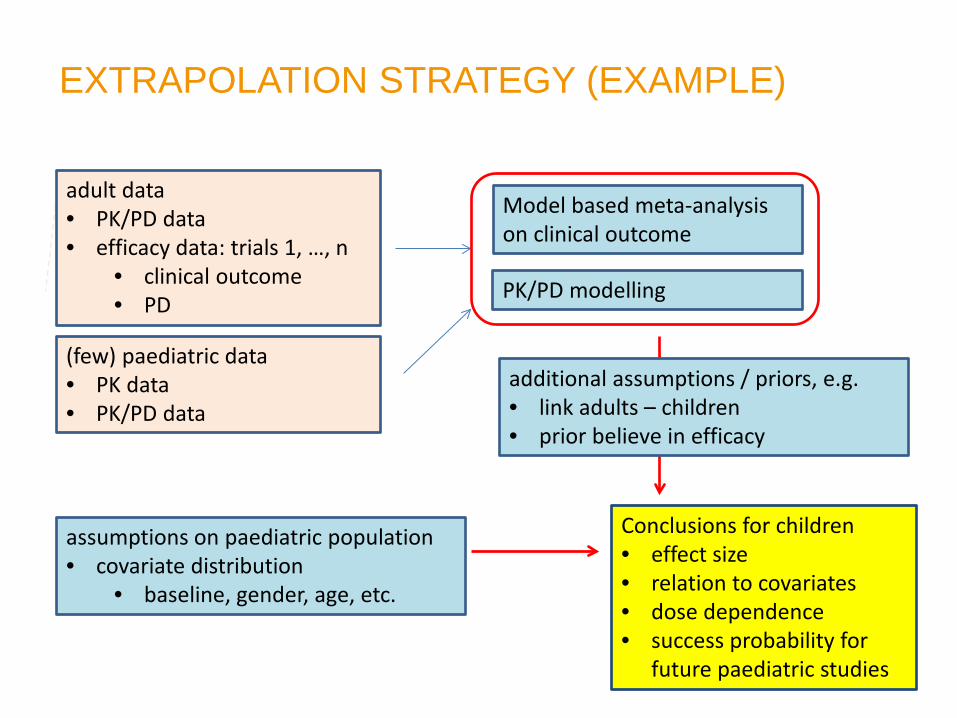
adult data • PK/PD data • efficacy data: trials 1, …, n
• clinical outcome • PD
(few) paediatric data • PK data • PK/PD data
Model based meta-analysis on clinical outcome
PK/PD modelling
additional assumptions / priors, e.g. • link adults – children • prior believe in efficacy
assumptions on paediatric population • covariate distribution
• baseline, gender, age, etc.
Conclusions for children • effect size • relation to covariates • dose dependence • success probability for
future paediatric studies
EXTRAPOLATION STRATEGY (EXAMPLE)

Summarize simulation results, e.g. • probability of a false positive decision
= conclusion of a positive/relevant effect in children if assumption x implies no effect in children
Assumption set on • adult data • paediatric data • link
Assumption 1
Assumption r
Assumption 2
Extrapolation strategy 1
Extrapolation strategy k
Repeated simulations of an extrapolation exercise:
• Simulation of adult trials and paediatric data according to the different assumptions
• Apply different extrapolation strategies
• Conclusion/result for a specific simulation
Clinical Scenario Evaluation
Set of different extrapolation strategies
CSE APPLIED TO EXTRAPOLATION
24
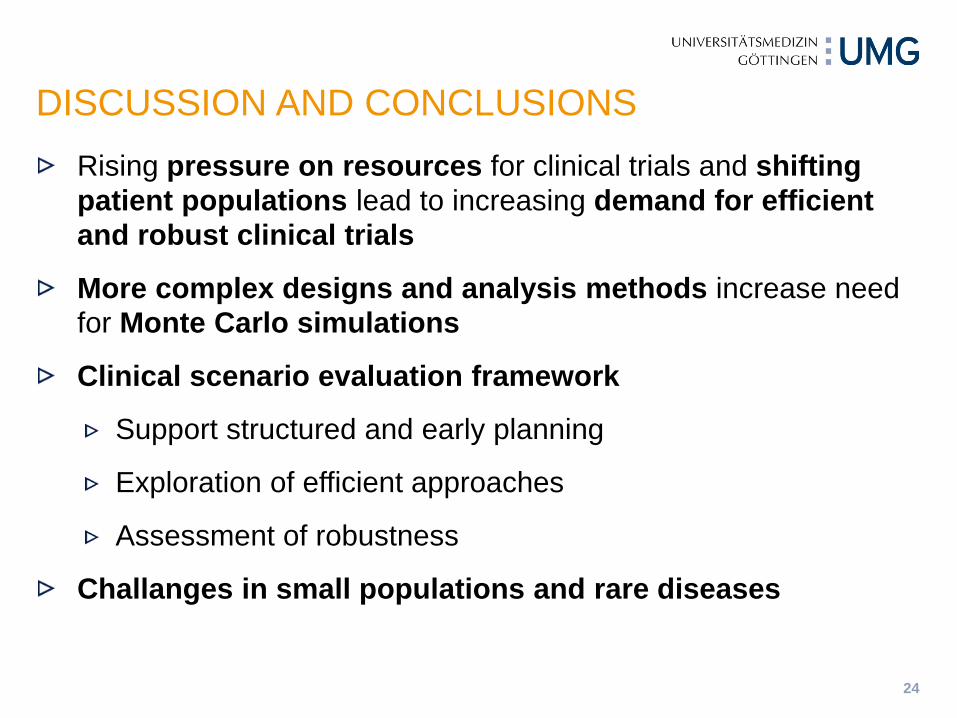
Rising pressure on resources for clinical trials and shifting patient populations lead to increasing demand for efficient and robust clinical trials
More complex designs and analysis methods increase need for Monte Carlo simulations
Clinical scenario evaluation framework
Support structured and early planning
Exploration of efficient approaches
Assessment of robustness
Challanges in small populations and rare diseases
DISCUSSION AND CONCLUSIONS
25
Benda N, Branson M, Maurer W, Friede T (2010) Aspects of modernizing drug development using scenario planning and evaluation. Drug Information Journal 44: 299-315.
Friede T, Nicholas R, Stallard N, Todd S, Parsons N, Valdés-Márquez E, Chataway J (2010) Refinement of the clinical scenario evaluation framework for assessment of competing development strategies with an application to multiple sclerosis. Drug Information Journal 44: 713-718.
Konietschke F, Friede T, Pauly M (2015) Robust analyses of over-dispersed counts with varying follow-up in small samples and rare diseases. (Submitted)
Steinvorth SM, Röver C, Schneider S, Nicholas R, Straube S, Friede T (2013) Explaining temporal trends in annualized relapse rates in placebo groups of randomized controlled trials in relapsing multiple sclerosis: Systematic review and meta-regression. Multiple Sclerosis Journal 19: 1580-1586.
Viele K, Berry S, Neuenschwander B, Amzal B, Chen G, Enas N, Hobbs B, Ibrahim JG, Kinnersley N, Lindborg S, Micallef S, Roychoudhury S, Thompson L (2014) Use of historical control data for assessing treatment effects in clinical trials. Pharmaceutical Statistics 13: 41–54.
SOME REFERENCES