a formalised approach to the management of riskorca.cf.ac.uk/54845/1/u585234.pdf · the objective...
TRANSCRIPT

A Formalised Approach to the Management of Risk
by
Michael J Brownsword, MEng(Hons)
Thesis submitted for the Degree of Doctor of Philosophyat
Cardiff University
April 2009

UMI Number: U5852B4
All rights reserved
INFORMATION TO ALL USERS The quality of this reproduction is dependent upon the quality of the copy submitted.
In the unlikely event that the author did not send a complete manuscript and there are missing pages, these will be noted. Also, if material had to be removed,
a note will indicate the deletion.
Dissertation Publishing
UMI U585234Published by ProQuest LLC 2013. Copyright in the Dissertation held by the Author.
Microform Edition © ProQuest LLC.All rights reserved. This work is protected against
unauthorized copying under Title 17, United States Code.
ProQuest LLC 789 East Eisenhower Parkway
P.O. Box 1346 Ann Arbor, Ml 48106-1346

Declaration
This work has not previously been accepted in substance for any degree and is not concurrently submitted in candidature for any degree.
Signed . ......... (candidate) Date ..! . 1 ..
STATEMENT 1
This thesis is being submitted in partial fulfillment of the requirements for the degree of PhD
Signed . . (candidate) Date . . ? . . . .
STATEMENT 2
This thesis is the result of my own independent work/investigation, except where otherwise stated.Other sources are acknowledged by explicit references.
Signed (candidate) Date
STATEMENT 3
I hereby give consent for my thesis, if accepted, to be available for photocopying and for inter-library loan, and for the title and summary to be made available to outside organisations.
Signed . . .(candidate) Date . . . .

Acknowledgements
I would like to thank Brass Bullet Ltd. whose funding made this project
possible. I would specifically like to thank Dr Jon Holt for providing unwavering
support, insight and clarity throughout the project.
My thanks go to Prof Mike Rodd and Dr Rossi Setchi as academic
supervisors, their guidance, insight and drive has been invaluable.
Thanks also go to the Kings Norton Parish who have provided the backdrop
for the main case study. Their willingness to try, acceptance of and openness
to the results of a different way of working has been refreshing.
Thanks also go to the many friends and colleges who have indulged in
conversation and debate regarding my thoughts and ideas, especially Dave
and Simon who in any discussion will provide the most positive of criticism.
This includes those I have worked with in many different establishments over
the course of this work.
Almost finally my thanks go to Lesley, Peter, Bob and Mita who have all
always been supportive and provided much needed food, drink,
accommodation and child care.
And finally, to Jean, my dear wife, who has prodded and cajoled me into
action; whilst reviewing various aspects of this work since we were married.
She has provided me with two wonderful boys, Samuel and Daniel, who have
provided much motivation over the last two years.

Abstract
Taking a pragmatic, systems engineering approach, this thesis identifies a
number of fundamental issues that presently arise in risk management,
primarily as a result of the overly complex and somewhat outdated approach
conventionally taken in process definition and a lack of coherence within the
current risk management vocabulary. It is suggested that many recent
developments in systems engineering have largely been ignored by the risk
management community.
The objective of this work is to develop a formalised approach to the
management of risk using a model based approach this will enable a
fundamental simplification of the risk management process, resulting -
amongst other things - in an improved understanding of the associated
terminology.
An object oriented modelling approach, now widely exploited in systems
engineering, has been used to provide an insight into many existing risk
management standards considering the approaches they present and
terminology used. It has also been used to derive both a set of processes for
risk management and a methodology for implementation. Alongside this, a
consistent, inter-related terminology as been proposed for use with these
processes.
The outcome of this work is a formalised but pragmatic approach to risk
management including the definition of processes, ontology for risk
management and a pragmatic methodology for the application of the
processes. This approach has been validated in a number of case studies of
varying depth and breadth, covering health & safety, business, project and
individual needs, showing that the proposed processes and terminology can
be used effectively in different organisations and industries.

Table of Contents
1 Introduction.............................................................................................................................. 11.1 Background.....................................................................................................................11.2 Context/Scope..................................................................................................................2
1.2.1 Formalisation...........................................................................................................41.3 Objectives.........................................................................................................................61.4 Thesis plan and structure................................................................................................7
2 Literature Review....................................................................................................................92.1 Introduction....................................................................................................................... 92.2 Process............................................................................................................................ 92.3 Standards....................................................................................................................... 152.4 Terminology..................................................................................................................38
2.4.1 Risk Definitions..................................................................................................... 442.4.2 Terminology Summary.......................................................................................... 49
2.5 Tools and techniques.................................................................................................... 502.6 Conclusions.................................................................................................................. 52
3 Research Methodology.........................................................................................................533.1 Introduction..................................................................................................................... 533.2 Methodology.................................................................................................................. 53
3.2.1 Strategy.................................................................................................................. 533.2.2 Tactics.................................................................................................................... 543.2.3 Generalisability......................................................................................................54
4 Application.............................................................................................................................554.1 Introduction................................................................................................................... 554.2 Technique selection...................................................................................................... 56
4.2.1 Framework Selection............................................................................................ 574.2.2 Application by Industry.......................................................................................... 624.2.3 Application Overview............................................................................................ 67
4.3 Ontology Modelling....................................................................................................... 684.4 Process Modelling..........................................................................................................69
4.4.1 Process Concepts..................................................................................................704.5 Conclusions....................................................................................................................73
5 Ontology................................................................................................................................ 745.1 Introduction....................................................................................................................745.2 Risk Definition................................................................................................................745.3 Associated Terminology................................................................................................ 78
5.3.1 Causal terminology...............................................................................................785.3.2 Consequence Terminology...................................................................................80
5.4 Mappings........................................................................................................................ 805.4.1 Definition mappings.............................................................................................. 815.4.2 Mapping considerations........................................................................................ 85
5.5 Risk Ontology.................................................................................................................865.6 Conclusions....................................................................................................................87

< CQ
6 Processes............................................................................................................................. 886.1 Introduction.................................................................................................................... 886.2 Process Formalisation.................................................................................................. 886.3 Requirements View - Risk Management Requirements.............................................. 896.4 Process Content View - Risk Processes.......................................................................90
6.4.1 Context Identification Process.............................................................................. 926.4.2 System Modelling Process................................................................................... 936.4.3 Concern Identification Process............................................................................. 946.4.4 Risk Definition Process..........................................................................................956.4.5 Evaluation Process................................................................................................976.4.6 Risk Treatment Process.........................................................................................99
6.5 Information View - Risk Processes Artefacts............................................................. 1016.6 Process Instance View - Methodology....................................................................... 1026.7 Process Support.......................................................................................................... 104
6.7.1 Risk Contexts....................................................................................................... 1046.7.2 Context Conclusions............................................................................................1106.7.3 Risk Evaluation...................................................................................................111
6.8 Conclusion................................................................................................................... 113
7 Case Studies.......................................................................................................................1157.1 Introduction...................................................................................................................115
7.1.1 Background...........................................................................................................1157.1.2 Case study tactics................................................................................................ 116
7.2 Approach......................................................................................................................1177.2.1 Initial Concern Identification.................................................................................1187.2.2 Initial Context Development................................................................................. 1197.2.3 Initial Risk Definition............................................................................................. 120
7.3 Health and Safety Risk................................................................................................ 1217.3.1 Understanding the System.................................................................................. 1227.3.2 Scalded child situation evaluation........................................................................1257.3.3 Effect evaluation.................................................................................................1287.3.4 Treating the risk of scalding a child.................................................................... 1297.3.5 Additional Concerns.............................................................................................1327.3.6 Scalded child Solution evaluation....................................................................... 1337.3.7 Health and Safety Risk Conclusion.................................................................... 133
7.4 Parish review................................................................................................................1347.4.1 Situation evaluation.............................................................................................. 1357.4.2 Effect evaluation.................................................................................................. 1357.4.3 Treating the risk of not getting new clergy members..........................................136
7.5 Conclusions..................................................................................................................1387.5.1 Evidence collection studies.................................................................................. 1397.5.2 Interpretation/Evaluation of Case studies........................................................... 1497.5.3 Summary...............................................................................................................150
8 Conclusions.........................................................................................................................1538.1 Introduction...................................................................................................................1538.2 Case study evaluation............................................................................................... 1538.3 Summary of Chapters............................................................................................... 1548.4 Conclusions by Objective............................................................................................1568.5 Contributions................................................................................................................1578.6 Further work.................................................................................................................158
8.6.1 Academic..............................................................................................................1588.6.2 Industrial...............................................................................................................159
References................................................................................................................................ 160- Restoration project study.............................................................................................172- Modelling Language Overview....................................................................................191
Table of FiguresFigure 2-1 - Spiral Model (Boehm 1988).......................................................... 10Figure 2-2 - Risk management (Boehm 1989)................................................. 11Figure 2-3 - Spiral life cycle model....................................................................12Figure 2-4 - Summary....................................................................................... 12Figure 2-5 - Risk engineering (Hughes and Cotterell 1999)..............................13Figure 2-6 - Redmill’s Risk Analysis..................................................................14Figure 2-7 - Risk groupings............................................................................... 16Figure 2-8 - Process steps................................................................................17Figure 2-9 - Examples of the Drivers of Key Risks (IRM et al 2002).............. 19Figure 2-10 - The Risk Management Process (IRM et al 2002)......................20Figure 2-11- IEC 61508 Overview................................................................... 22Figure 2-12 - System Life Cycle Stages - Process Structure View................ 25Figure 2-13 - Project - Process Content View..................................................26Figure 2-14 - AS/NZS 4360 Purpose............................................................... 28Figure 2-15 - Risk Management Process - Overview (AS/NZS 2004)........... 29Figure 2-16 - Process - assumed flow ............................................................. 30Figure 2-17 - Process - additional flows........................................................... 31Figure 2-18 - AS/NZS 4360 Terminology Quagmire....................................... 32Figure 2-19 - AS/NZS 4360 Summary............................................................ 34Figure 2-20 - Framework (ISO 2008)............................................................... 35Figure 2-21 - Risk Management Process (ISO 2008)..................................... 36Figure 2-22 - Risk management vocabulary....................................................39Figure 2-23 - AS/NZS 4360 ..............................................................................40Figure 2-24 - QoS UML profile (OMG 2008b)..................................................42Figure 2-25 - PH A ontology (Mazouni and Aubry 2007)................................. 43Figure 2-26 - Finance risk.................................................................................44Figure 2-27 - Leveson risk................................................................................45Figure 2-28 - Roland and Moriarty's risk.........................................................45Figure 2-29 - Storey risk ................................................................................... 46Figure 2-30 - BS 6079 risk definition................................................................ 46Figure 2-31 - BS 8444 risk................................................................................47Figure 2-32 - EN 50126 risk Definition............................................................. 47Figure 4-1 - Requirements................................................................................56Figure 4-2 - UML Concepts Usage view.......................................................... 59Figure 4-3 - Development................................................................................. 60Figure 4-4 - UML IT/IS Usage view.................................................................. 61Figure 4-5 - UML Defence Usage view............................................................ 63Figure 4-6 - UML Rail Usage view................................................................... 64Figure 4-7 - UML Science/Education Usage view.............................................66Figure 4-8 - UML Developed Usage view........................................................ 67Figure 4-9 - Ontology concepts & realisation...................................................69Figure 4-10 - Process Concepts View (Holt 2005)...........................................70Figure 4-11 - Process Realization View (Holt 2005)....................................... 71Figure 5-1 - Generic risk................................................................................... 74Figure 5-2 - Risk Composition..........................................................................75Figure 5-3 - Taxonomy of Outcomes............................................................... 76Figure 5-4 - System vs Outcome......................................................................78Figure 5-5 - Causal analysis.............................................................................79

Figure 5-6 - Effect Analysis...............................................................................80Figure 5-7 - Financial........................................................................................ 81Figure 5-8 - Project........................................................................................... 82Figure 5-9 - Safety.............................................................................................83Figure 5-10 - Non-safety..................................................................................84Figure 5-11 - Risk Ontology.............................................................................86Figure 6-1 - Risk Management Requirements.................................................89Figure 6-2 - Risk Processes..............................................................................90Figure 6-3 - Context ID .....................................................................................92Figure 6-4 - System Modelling......................................................................... 93Figure 6-5 - Concern ID ....................................................................................94Figure 6-6 - Risk Definition...............................................................................96Figure 6-7 - Evaluation......................................................................................98Figure 6-8 - Risk Treatment............................................................................100Figure 6-9 - Process Artefacts........................................................................101Figure 6-10 - Theoretical ideal...................................................................... 102Figure 6-11 - Pragmatic approach................................................................. 103Figure 6-12 - Risk Context relationships....................................................... 104Figure 6-13 - Business Context......................................................................105Figure 6-14 - Financial Context......................................................................106Figure 6-15 - Marketing Context....................................................................107Figure 6-16 - Technical Context.....................................................................108Figure 6-17 - Project Context......................................................................... 109Figure 6-18 - People Context......................................................................... 110Figure 6-19 - Risk Evaluation example Causal scenario.................................111Figure 6-20 - Risk Evaluation example Effect scenario................................. 112Figure 6-21 - Risk factor overview.................................................................113Figure 6-22 - Risk Ontology with processes.................................................114Figure 7-1 - Initial Process Instance View......................................................117Figure 7-2 - Initial concerns............................................................................118Figure 7-3 - Context identification.................................................................. 119Figure 7-4 - Risk Definition............................................................................. 120Figure 7-5 - Risk - Concern Trace..................................................................121Figure 7-6 - Scalding child Process Instance View.........................................122Figure 7-7 - Infrastructure............................................................................... 123Figure 7-8 - Areas within buildings..................................................................124Figure 7-9 - Population - St Nicholas Urn Concern........................................124Figure 7-10 - Population - Urn in area........................................................... 125Figure 7-11 - Child grabs tap on urn............................................................. 126Figure 7-12 - Child grabs tap with table........................................................ 127Figure 7-13 - Person falls into bench............................................................ 127Figure 7-14 - Effect evaluation........................................................................128Figure 7-15 - Risk Treatment - Scalded child - Solution 4............................. 130Figure 7-16 - Risk Treatment - Scalded child - Solution 7............................. 131Figure 7-17 - Treatment - Scalded child........................................................131Figure 7-18 - Concern Identification Revisited..............................................132Figure 7-19 - Parish review methodology..................................................... 134Figure 7-20 - Causal evaluation.................................................................... 135Figure 7-21 - Risk Treatment - No new clergy...................................... 136Figure 7-22 - Risk Treatment - No new clergy...................................... 137
Figure 7-23 - Project actual Process Instance View.......................................138Figure 7-24 - Tailored project context............................................................ 140Figure 7-25 - Tailored business context......................................................... 141Figure 7-26 - System view.............................................................................. 142Figure 7-27 - Constraint view..........................................................................143Figure 7-28 - Parametric view.........................................................................143Figure 7-29 - Personal Development............................................................. 145Figure 7-30 - Competence..............................................................................147Figure 7-31 - Competence evidence.............................................................. 148Figure 7-32 - standard - work - competence..................................................148Figure A-1 - Project view.................................................................................175Figure A-2 - Stakeholders...............................................................................180Figure A-3 - SWOT Analysis...........................................................................181Figure A-4 - Asset Diagram............................................................................183Figure A-5 - Threat Scenario ‘Bad Weather’ .................................................186Figure A-6 - Risks and Assets........................................................................187Figure A-7 - Treatment Model........................................................................189Figure B-1 - UML Diagrams Overview........................................................... 192Figure B-2 - Class Diagram Meta Model........................................................ 194Figure B-3 - Class Diagram Symbols............................................................. 195Figure B-4 - Example structure.......................................................................196Figure B-5 - Example classification.................................................................196Figure B-6 - Example Mapping.......................................................................197Figure B-7 - Class Relationships Overview.................................................... 198Figure B-8 - Activity Diagram Meta Model..................................................... 199Figure B-9 - Activity Diagram Symbols.......................................................... 199Figure B-10 - Example Activity diagram.........................................................200Figure B-11 - Deployment Diagram Meta Model........................................... 201Figure B-12 - Deployment Diagram Symbols................................................ 201Figure B-13 - Example Deployment............................................................... 202Figure B-14 - Sequence Diagram Meta Model.............................................. 203Figure B-15 - Sequence Diagram Symbols....................................................203Figure B-16 - Example Sequence.................................................................. 204Figure B-17 - Use Case Diagram Meta Model............................................. 205Figure B-18 - Use Case Diagram Symbols.................................................. 206Figure B-19 - Example Use Case................................................................. 206Figure B-20 - UML Diagram Relationships................................................... 207Figure B-21 - SysML Overview.......................................................................208Figure B-22 - Parametrics - Definition Notation........................................... 209Figure B-23 - Parametrics - Usage Notation................................................ 210Figure B-24 - The coffin escape..................................................................... 211Figure B-25 - The coffin escape - parametric definitions..............................212Figure B-26 - The coffin escape - parametric usage....................................212Figure B-27 - SysML Diagram Relationships.................................................214

1 Introduction
1.1 BackgroundThe consideration of risk is a day-to-day phenomenon used by individuals,
Small to Medium Enterprises (SME's) to large national, multinational or global
organisations. Although in many instances risks may be 'mitigated' this does
not mean that complex issues have been well understood.
Risk Management proposes to be a solution to understanding and removing
the worry associated with issues which may arise in the future. As a discipline
Risk Management has existed since the 1960's emerging from an historic
need and desire to insure. From the 1980's clear reference can be made to a
process for risk management which has remained relatively unchanged.
There are many tools available to assist in the modelling of complex systems.
Modelling allows simplification of the system to allow the complexity to be
understood or at least to aid the recognition that there is a complex issue.
These tools vary from high level business strategy identification to Failure
Modes and Effects Analysis (FMEA) examining the detail associated with
failures of components in a system.
Risk can be a very personal thing; people generally understand risk in slightly
different ways due to their own experiences. This view of risk is not directly
associated with numbers, probabilities and specific outcomes. It is about the
chance that the individual may lose something of value. The situations where
people think about risk are around us all the time from investments to flying or
crossing the road to bungee jumping. The question is how do people think
about risk? Generally as life progresses new challenges arise, situations
which have not been encountered previously. In the case of these new
situations people tend toward caution, taking things slowly trying to ensure the
best outcome. Once the situation has been tried and tested confidence grows
and it is possible to start to believe that there is no danger or risk as the
situation has been encountered many times and has always ended well.
Page 1 of 214
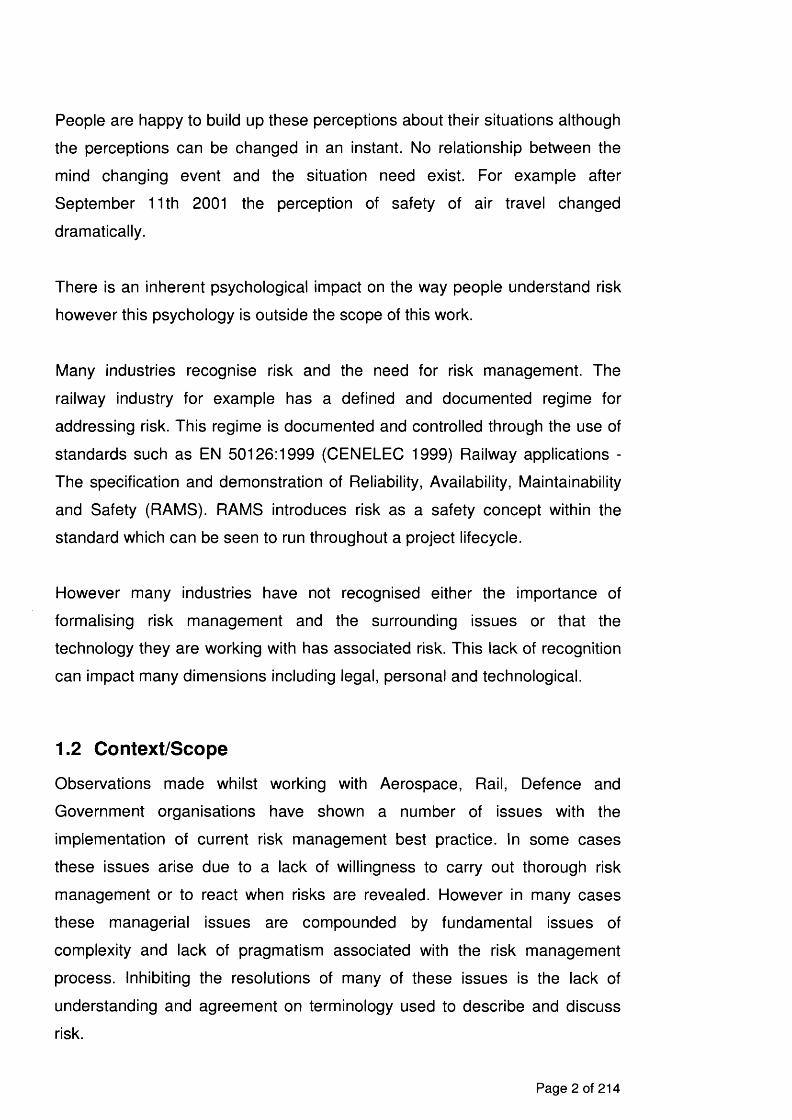
People are happy to build up these perceptions about their situations although
the perceptions can be changed in an instant. No relationship between the
mind changing event and the situation need exist. For example after
September 11th 2001 the perception of safety of air travel changed
dramatically.
There is an inherent psychological impact on the way people understand risk
however this psychology is outside the scope of this work.
Many industries recognise risk and the need for risk management. The
railway industry for example has a defined and documented regime for
addressing risk. This regime is documented and controlled through the use of
standards such as EN 50126:1999 (CENELEC 1999) Railway applications -
The specification and demonstration of Reliability, Availability, Maintainability
and Safety (RAMS). RAMS introduces risk as a safety concept within the
standard which can be seen to run throughout a project lifecycle.
However many industries have not recognised either the importance of
formalising risk management and the surrounding issues or that the
technology they are working with has associated risk. This lack of recognition
can impact many dimensions including legal, personal and technological.
1.2 Context/Scope
Observations made whilst working with Aerospace, Rail, Defence and
Government organisations have shown a number of issues with the
implementation of current risk management best practice. In some cases
these issues arise due to a lack of willingness to carry out thorough risk
management or to react when risks are revealed. However in many cases
these managerial issues are compounded by fundamental issues of
complexity and lack of pragmatism associated with the risk management
process. Inhibiting the resolutions of many of these issues is the lack of
understanding and agreement on terminology used to describe and discuss
risk.
Page 2 of 214

Issues include:
• consideration of risk management as a support process,
• differing desires of stakeholders,
• the need to re-create existing documents or designs to enable risk
management to be carried out,
• the multitude of possible routes through the risk management process
and
• the variation in meaning associated with the word 'Risk' and other risk
management terminology
The view of risk management as a support process causes issues as there is
a view that support processes are add-on processes armoured in
documentation which provide no real purpose other than to delay the project
until after the prescribed deadline.
There may be a number of reasons for the image associated with these
support processes. One may be that they are in fact much more integral to the
work than most would like to admit. As such many of the activities are carried
out as a matter of course. In relation to these activities the risk management
process duplicates work adding rather than removing the likelihood of errors
or failure.
Not only can the process duplicate work already carried out it can also deliver
an inconsistent view of the order in which the risk management steps should
or could be carried out. The process is generally wrapped in catchall activities
relating to all steps ensuring that no assumed flow can be guaranteed.
All of these issues stand in the way of considering the information regarding a
'risk' which as a word means something different almost every time it is used.
Page 3 of 214

1.2.1 Formalisation
These issues, duplication of information, complexity of process and
incoherence of terminology, drive the need for a more formalised approach to
risk management. To ensure that complexity is reduced rather than increased
a tried and tested method of understanding complex, diverse and multi
faceted systems must be applied.
Formalisation, in this work, means to emphasise the logical approach taken
towards the understanding and definition of risks. This approach in turn
supports the validity of the risk. Within the current engineering and economic
climate this logical approach must provide a visualisation which is consistent,
repeatable and view based and pragmatic.
The software/IT domain has been using these kinds of formalised techniques
for many years. In the last 15 years there has been a move to provide
consistency across these techniques. One of the results of this need for
consistency is the Unified Modelling Language (UML). The UML has been
used in many applications from project management to real-time critical
system design making use of its syntax, ability to communicate and provide
consistency both internally, between visualisations and externally through
links to real examples and scenarios.
As the UML provides a consistent, graphical multi-view approach to
understanding complex, diverse and multi-faceted systems its application to
the concepts of risk enable a consistency, formalisation and visual
representation of the terminology and process of risk management. Many of
the diagrams, shown using the UML, within this work provide interpretations of
the original work rather than the work itself, where this is not the case full
references are provided. These interpretations, as well as providing a
consistent understanding of diverse works, provide an independent view of
the work enabling an overview to be gained and faster access to relevant
areas within the work.
Page 4 of 214

Having a consistent, formalised approach supports repeatability within a
formalised approach by focusing on modularisation and re-use without
forgetting the overall need s of the whole.
The use of modularisation within risk management enables the pragmatic
application of the processes required to carry out risk management.
Pragmatic application is achieved through the timely execution of relevant
processes, this may mean that one processes is carried out many times whilst
another is only used once or twice. The pragmatic application of the process
has the added advantage of improving the accuracy of project plans and
records.
There are three main areas which must be addressed prior to the application
of a formalised approach these areas are the ontology, processes and
methodology.
• The ontology provides the definitions of terms, as per a glossary or
dictionary, and well defined relationships between the terms (which is
lacking in many cases).
• Each process provides a concise set of activities to be carried out
showing which artefacts, documents or information, are consumed and
produced by each activity. Relationships between artefacts are also
defined.
• The methodology provides the ordering for application of the processes.
This ordering can show planned or actual ordering enabling
consideration and improvement in planning.
There are two key long term benefits to a formalised approach to risk
management which are:
1. Improved application of risk management on current and future projects
2. Improved education for those who will apply risk management enabling
further improvements in 1.
Page 5 of 214

1.3 Objectives
The primary aim of this thesis is to develop a formalised approach to the
management of risk using a model based approach. This will address the
problem of a lack of formalisation across risk management in many industries,
applications and education.
To achieve the overall aim both terminology and processes related to risk
must be understood and formalised. Formalised ontology and processes will
be developed and demonstrated through a number of threads abstracted from
a case study.
The aims and objectives outlined here will be addressed throughout the
thesis; the main contribution of each chapter to these objectives is:
• Chapter 2 - to review and understand the terminology and processes
related to risk management.
• Chapter 3 - to present the methodology for the research.
• Chapter 4 - to discuss the requirements for a model based framework
for the formalisation of risk management and propose a framework
which fulfils the requirements.
• Chapter 5 - to define risk and present an ontology for risk management.
• Chapter 6 - to define the processes required to carry out risk
management using a multi-view approach.
• Chapter 7 - to demonstrate the applicability of the processes and
ontology.
Page 6 of 214

1.4 Thesis plan and structure
This thesis makes extensive use of the Unified Modelling Language (UML) as
an approach to understanding and describing concepts and systems. The
approach is born out of the Object Oriented (00) world of systems
understanding and can be used to describe system needs, structure,
hierarchy, state and activity at many different viewpoints and levels of
abstraction. It is not, however, the intention here to provide a detailed survey
of UML, but brief introduction to the notation is given in Appendix B. Further
detailed references are found in Stevens and Pooley (2005), Holt (2005) and
Holt (2008).
The following gives a more general overview of the thesis defining what is
discussed in each chapter:
This chapter introduces the need for this work covering complexity, risk
related to people, industry and standards. It defines the aims and objectives of
the work and provides an overview of the thesis
Chapter two investigates the processes defined for risk management, the
terminology defined along side these processes and tools and techniques
used to examine and create the data required to understand risks.
Chapter three presents the methodology for the research considering the use
of empirical vs theoretical and phenomenological vs positivist approaches.
Chapter four discusses the use of the Unified Modelling Language (UML) as a
visual, multi-view modelling approach and shows that this language is a
relevant language to use for understanding and implementing risk
management and analysis. It does this through defining the requirements for
the notation to be used and investigating a number of applications of the UML.
Chapter five presents the generic terminology of risk and the relationships
between the terms, by way of an ontology. Sections of the ontology are
Page 7 of 214

compared with definitions and terminology discussed in chapter two.
Chapter six presents the set of processes which can be used to manage risk,
it presents a number of views of these processes giving confidence that they
have been fully defined. This is supported by a set of examples showing
possible outputs from the processes. This chapter also defines a methodology
providing theoretical and practical application sequences for the processes.
Chapter seven presents two examples, from a case study, of the application
of the ontology defined in chapter 4 and the processes defined in chapter 5 to
verify the processes and ontology.
Chapter eight presents conclusions drawn from the project as a whole with
recommendations for areas of further work.
Page 8 of 214
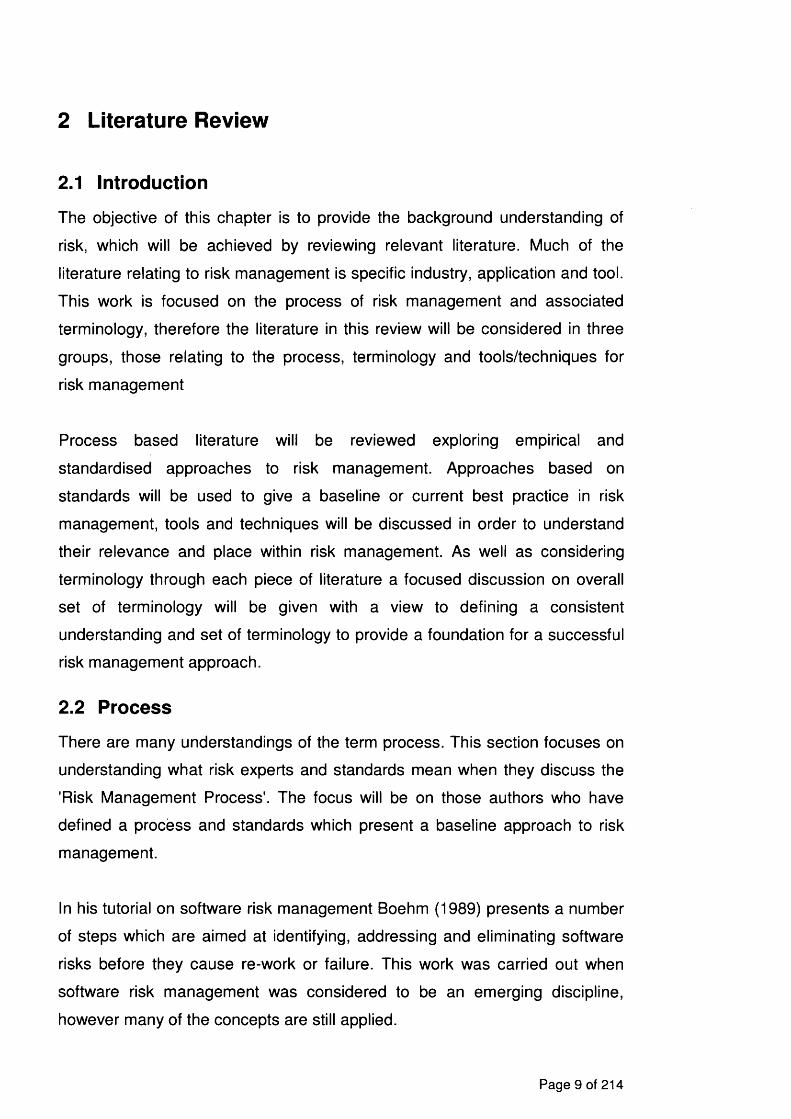
2 Literature Review
2.1 Introduction
The objective of this chapter is to provide the background understanding of
risk, which will be achieved by reviewing relevant literature. Much of the
literature relating to risk management is specific industry, application and tool.
This work is focused on the process of risk management and associated
terminology, therefore the literature in this review will be considered in three
groups, those relating to the process, terminology and tools/techniques for
risk management
Process based literature will be reviewed exploring empirical and
standardised approaches to risk management. Approaches based on
standards will be used to give a baseline or current best practice in risk
management, tools and techniques will be discussed in order to understand
their relevance and place within risk management. As well as considering
terminology through each piece of literature a focused discussion on overall
set of terminology will be given with a view to defining a consistent
understanding and set of terminology to provide a foundation for a successful
risk management approach.
2.2 Process
There are many understandings of the term process. This section focuses on
understanding what risk experts and standards mean when they discuss the
'Risk Management Process'. The focus will be on those authors who have
defined a process and standards which present a baseline approach to risk
management.
In his tutorial on software risk management Boehm (1989) presents a number
of steps which are aimed at identifying, addressing and eliminating software
risks before they cause re-work or failure. This work was carried out when
software risk management was considered to be an emerging discipline,
however many of the concepts are still applied.
Page 9 of 214

Boehm has defined both the steps for risk management and a life cycle The
spiral model' (Boehm 1988) in which the steps can be applied. The spiral
model evolved over a number of years. It is based on the waterfall model with
a number of refinements applied to it.
This model is defined to provide an approach to development which is risk
driven and reflects the incremental nature of most development projects.
The spiral model (Figure 2-1) provides an incremental approach to defining
requirements, architecture and design through the re-use of the four main
elements 'Determine objectives, alternatives, constraints', 'Evaluate
alternatives; identify, resolve risks', 'Develop, verify next level product' and
'Plan next phases'. There are further refinements and detail provided within
each phase or element and a revised spiral model was also produced
expanding on the detail within the 'Plan next phases' element.
Boehm (1989) states that "Software Risk management is an emerging
discipline whose objectives are to identify, address, and eliminate software
Determine objectives, alternatives and
constraints /Evaluate alternatives, identify resolve risks
Riskanalysts
Riskanalysis
Riskanalysis \ . O p e ra -\
.Prototype 3 \ tional \ \ protoypePrototype 2
Riskanalysis Proto
type!REVIEW
Requirements plan life-cycle plan
Simulations, models, benchmarks Concept of / fOperation /
-^requirements/ Product / 'design / Detailed /
Requirement s ' / design /v a l i d a t i o n /
Developmentplan
Integration and test plan Integration
test ^Acceptancetest Develop, verify
next-level product
Figure 2-1 - Spiral Model (Boehm 1988)
Page 10 of 214

risk items before they become either threats to successful software operation
or major sources of software rework." he provides steps to support these
objectives.
based on results of
risksfrom
Risk control Risk Assessment
Risk Management
risk exposure risk leverage com pound risk reduction
Risk prioritisation
Risk Resolution
prototypes ()s im ulations()benchmark()analysesQstaffing()
track m ilestones() track top ten() re -assess risk() corrective actions ()
Risk Monitoring
check listsdecis ion driver analysis assum ption analysis decom position
Risk identification
Performace m odels cost m odels network analysis decis ion analysis quality factor analysis
Risk Analysis
buying info()risk avoidance()risk transfer()risk reduction()risk e lem ent planning()risk plan integrationQ
Risk management planning
Figure 2-2 - Risk management (Boehm 1989)
Boehm defines two primary steps (Figure 2-2), within risk management, of risk
control and risk assessment. Three sub-steps exist within each; risk control
covering management, monitoring and resolution and risk assessment
involving identification, analysis and prioritisation. These steps are further
defined with some explanation of the items which may be produced by the
step as well as typical techniques.
The disadvantage of the spiral model, this works interpretation of which is
abstracted in Figure 2-3, is that it specifies the work to be completed in each
step: this constrains the flexibility of the model and therefore its application to
other areas. Another way of explaining this would be to say that it begins to
pre-define the project plan.
Page 11 of 214

:Plan next PhaseService :Develop, verify next-level product
Evaluate alternatives;identify, resolve risks
Determine objectives, alternatives and
constraints
Figure 2-3 - Spiral life cycle model
Boehm has provided a differentiation between the management, which he
called control, in 'risk management' and the assessment in 'risk assessment'
providing in many cases a useful delineation between the work of identifying
and fully defining risks and the plans and controls which need to be in place to
ensure that risks are dealt with effectively.
Together the spiral model and risk management steps provide an approach
for the business to incorporate risk management into projects (Figure 2-4)
applied during
Risk Management
StepEvaluate alternatives; identify, resolve risks
Figure 2-4 - Summary
Overall Boehm's model provides a sensible way forward when addressing risk
in the software environment giving a general overview from a management or
project perspective.
Lee et al (2009) use Boehm's work with others to generalise risk management
into four phases: classification and identification, risk assessment, risk
analysis and risk control. Lee applies Bayesian Belief networks (Aven 2003)
Page 12 of 214

within the phases incorporating uncertainty into risk management. Although
some technical risks are identified the majority of the work is focused on
management issues associated with the company and project rather than the
impact of technical issues.
Hughes and Cotterell (1999) have extended Boehm's model of risk
management, starting with a re-partitioning of the risk management steps
(Figure 2-5).
Risk directing
Risk staffing
Risk evaluation Risk Monitoring
Risk Estimation
Risk Engineering
Risk Planning Risk control
Risk Analysis
Riskidentification
Risk Management
Figure 2-5 - Risk engineering (Hughes and Cotterell 1999)
They also provide two primary areas within risk; Risk Analysis and Risk
Management. The management area groups all planning, staffing, directing,
monitoring and control activities whilst the Analysis area focuses on the
identification, estimation and evaluation of risk.
Re-sectioning Boehm's risk management steps separates the analysis of risk
from its management whereas Boehm's model looked at assessment and
control. It is believed that many of the changes are in the meaning of the word
'management'. In Boehm's work the use of 'risk management' was used to
signify the whole area of risk assessment, analysis and control whereas
Hughes and Cotterell are using management to specify only the control,
planning and resource issues leaving identification, estimation and evaluation
being grouped as Risk Analysis.
It is unclear in this model how the identification, estimation and evaluation will
Page 13 of 214

be carried out, where the techniques to be used will be selected, again the
focus is on the management of risk rather than the definition and analysis of
technical risk. Kirchsteiger (2008) takes a similar view when he explains risk
assessment as the 'fact finding' and administrative follow up measures as risk
management.
Redmill (2002) highlights the three stages most consider to be included in risk
analysis, hazard identification, hazard analysis and risk assessment (or
evaluation). He goes on to expand these steps by adding a 'definition of
scope', highlighted in Figure 2-6, concerned with the planning of the work to
be carried out during the risk analysis. Jenkins et al (2009), Mohaghegh et al
(2009) and Olsen and Lindoe (2008) all use the concept of context or
viewpoints within their work. Olsen and Lindoe use context to understand the
implications of transferring technology between contexts. Jenkins et al use
dimensions to develop a management framework and Mohaghegh uses
perspectives and multilevel framing to ensure the relevant aspects are
included in the analysis.
Stage
Risk Analysis
HazardIdentification
HazardAnalysis
Definition of scope
Risk Assessment (or evaluation)Added by Redmill
Figure 2-6 - Redmill’s Risk Analysis
Further to each of these stages Redmill discusses many of the tools which
can be used within these stages to carry out the detailed work required, he
uses this to highlight the areas where subjectivity can enter into the provision
of a full analysis for a project or product.
Page 14 of 214

Redmill’s work from 2002 seems to lack the breadth and depth of definition
found in Boehms work from 1989. This lack of consistency is symptomatic of
the lack of connectivity across disciplines when it comes to the understanding
of Risk.
It is useful that he reflects on the issues from project management in terms of
cost and time in relation to the detail required from a technique used to define
hazards within the risk analysis stages.
It is also noticeable that Redmill is predominantly concerned with hazards or
causes and that risk is the end point of understanding hazards where others
including Boehm (1989) the risk process has been focused on effects rather
than causes. Woodruff (2005) argues that the focus on consequence and
hazard ensure that decisions are not based on overall risk which he suggests
is leading to risk averse stakeholders defining the level of acceptable or
tolerable risk.
Redmill’s work seems to be behind the mark in relation to Boehm however
this may be due to the relative maturity of risk management across different
industries. The benefit Redmill adds is by ensuring that the scope of the
assessment is defined.
The variation in definition between Boehm and Redmill, including the focus on
cause or effect, highlights a need to consider standard practice. It will be
important io note whether the standards are industry specific or cross
discipline.
2.3 Standards
Mainly concerned with the approach to Risk Management numerous
standards can be consulted to see what is claimed to be best practice.
Standards may be company, national, or international some of which are used
as much outside the expected boundary as with AS-NZS 4360 (2004) an
Australian standard which is recognised in Canada by the Canadian
Information Processing Society (CIPS) Risk Management document (CIPS
2007), mainland Europe through European projects such as CORAS (Lund et
al 2004) and in the UK within the Fishing industry.
Page 15 of 214

There are many differing views on what constitutes risk management,
analysis and assessment hence the need for standardisation across
industries and domains. This section will investigate whether standards have
provided a common understanding and approach to risk management.
Many professional bodies and industry organisations provide guidance, codes
of practice and principles for risk management. These include the Institute of
chartered accountants in England and Wales (ICAEW) (2002), the Institute of
Risk Management (IRM) with the Association of Insurance and Risk
Managers (AIRMIC) (2002) and CIPS (2007) to name a few.
ICAEW in its briefing on Risk management for SMEs (2002) identifies the
need to apply risk management across the organisation expanding from the
previous narrow financial view it took.
Risk grouping
Financial Environmental
Compliance
Strategic
Operational
Figure 2-7 - Risk groupings
The briefing goes on to describe five headings, described in Figure 2-7, under
which risk maybe grouped or assessed. The groupings are;
• Strategic - risks from industry or geographically areas,
• Operational - risks from operations and administrative procedures,
• Financial - risks from the financial structure and third party transactions,
• Compliance - risks from law and regulation including Health and Safety,
• Environmental - risks could be covered under compliance.
Page 16 of 214

Step
Monitoringapproaches
implementingcontrols
Learn from experience
Identify and rank risk from
strategy
Selectappropriateapproaches
Figure 2-8 - Process steps
The briefing goes on to state that the risk management process will normally
involve the following steps
• Identifying and ranking the risks inherent in the company's strategy
(including its overall goals and appetite for risk);
• selecting the appropriate risk management approaches and transferring
or avoiding those risks that the business is not competent or willing to
manage;
• implementing controls to manage the remaining risks;
• monitoring the effectiveness of risk management approaches and
controls; and
• learning from experience and making improvements.
Following this it suggests four ways of controlling risks known as the four T's;
tolerate, transfer, treat or terminate.
Expressing that risk should be cross business rather than purely financial is a
step in the right direction but it misses the opportunity to explain whether
'business' is only the management side of an organisation or whether it is
Page 17 of 214
intended to cover the whole organisation including technical project and
development. It is limited in its consideration of these areas when applying the
categories of risk, shown in Figure 2-7, it has defined.
As a briefing document this is forward thinking and open, providing a good
basis for improvement. However, the similarity between the risk management
requirements and process means that the standard misses the opportunity to
explain or justify why risk management should be carried out, whether it is a
core business process or not, it only succeeds in defining the activities that
the process must deliver.
The IRM et al (2002) have defined 'A risk management standard' which it is
stated "is the result of a team drawn from the major risk management
organisation in the UK" The standards sets out risk management as "a rapidly
developing discipline" which has a need for a standard to ensure that there is
an agreed:
• terminology related to the words used
• process by which risk management can be carried out
• organisation structure for risk management
• objective for risk management
The standard begins by defining the drivers of risks.
Page 18 of 214

FINANCIAL RISKSN TEREST RATES
FOREIGN EXCHANGE
CREDIT
GICRCOMPETITION
CUSTOMER CHANGES
INDUSTRYCHANGES
CUSTOMERDEMAND
M IA INTEGRATION
U Q U D irr A RESEARCH A DEVELOPMENTCASHFLO W
INTELLECTUAL CAPITAL
INTERNALLY DRIVENACCOUNTING CONTROLS
INFORM ATION SYSTEM S
RECRUITMENT
SUPPLY CHAIN
REGULATIONS
CULTURE
BOARDCOM POSITIO N
OPERATIONAL RISKS
PUBLIC ACCESS
BWPLOYEES
PROPERTIES
PftOOUCTSASERVICES
CONTRACTS
NATURAL EVENTS
6U PPLER 6
ENVIRONM ENT
Figure 2-9 - Examples of the Drivers of Key Risks (IRM et al 2002)
The standard shows the drivers for risk, as represented in Figure 2-9, in terms
of internal and external factors and further categorises these into types of risk
which are financial, strategic, operational and hazards. It uses this picture to
provide a Venn diagram of the drivers in relation to their categorisations.
Page 19 of 214

M onitoring
Residual Risk Reporting
Risk Treatm ent
Decision
The Organisation’s Strategic Objectives
Risk ReportingThreats and Opportunities
Risk Assessment Risk Analysis
Risk Identification Risk Description Risk Estimation
Risk Evaluation
Figure 2-10 - The Risk Management Process (IRM et al 2002)
The standard focuses firstly on risk analysis and evaluation from the ISO
guide 73 (2002) definition of risk assessment before discussing the following
steps of the process. It does not however return to discuss the first step The
organisation's strategic objectives'.
The basic process, shown in Figure 2-10, is again similar to many that have
already been mentioned by ICAEW, Boehm etc with the added specification
of nested processes. This is seen as a hierarchy of processes - within the risk
management process is the risk assessment process, within risk assessment
there is risk analysis and risk evaluation, risk analysis in turn has its own set
of processes. The standard suggests that risk identification, description or
estimation can not be carried out without the con-current execution of the
parent processes, running three processes at the same time; this supposition
Page 20 of 214
is not pragmatic or practical, a risk will be described when it is recognised this
may be in conversation or formal review. The rest of the risk management
process and all of its sub processes do not need to be executed to carry out
this activity.
The standard also defines methods and tools although in the situation where
all processes are nested it is not clear where these fit into the overall structure
of applying risk management. Another issue with using a nested structure in
this way is that it is unclear how to start or end the work - if each process
opens up into a plethora of more detailed processes the complexity, cost,
resource needs and value of the task could be hidden or lost.
When investigating the detail of this process other issues arise, in many cases
the document seems to be unsure which process it is talking about. It refers to
risk assessment in a number of places where estimation or evaluation would
appear to be the focus of the statement. The sheer number of relationships
and transitions which can be followed within the process mean that it
becomes meaningless which is compounded by the use of terms including
'Hazard risks' which are difficult to interpret.
Much of the terminology used in the standard is defined in ISO/IEC Guide 73
(2002) which is a positive move to ensure that a shared set of terminology is
used within risk management. However it also states in at least one place that
it doesn't agree with the terminology in the ISO guide and so uses the term to
mean something else.
IRM are proposing the same Risk Management process which companies
have been refusing or failing to implement for nearly 20 years and in light of
the recent credit crunch has failed again. However this is similar to the
information in many national and international standards. CIPS (2007) have
taken a more general view recognising some of the issues with risk
management best practice, organisational view and scope of management
responsibility. Based on these issues they provide a guide to aid in
recognising, within their responsibility, what is required of an IT professional
Page 21 of 214
when assessing and managing risk.
There are three main ways that risk management is considered when it is
expressed in a standard. One is to describe the lifecycle of risk management,
the second considers risk management as a process and the last is a
variation of the two, not really sure if risk management is process or lifecycle
based. This section investigates four standards, IEC 61508, ISO 15288,
AS/NZS 4360 and ISO 31000, understanding the approach each takes and
the benefits and issues associated with the standard.
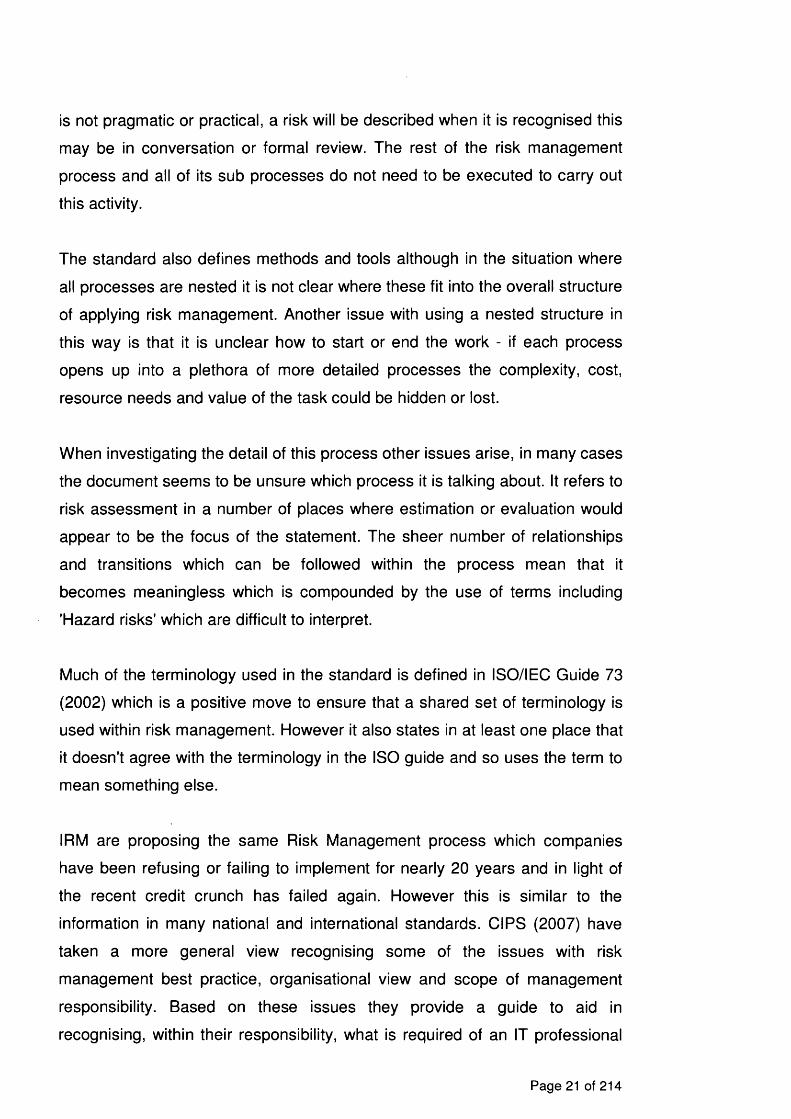
IEC 61508, which is focused on equipment, does not provide a risk
management process or discuss risk management. It focuses on the
equipment being used to provide specific functions and considers whether the
equipment may cause harm.
GeneralRequirements
IEC 61508
IDefinitions &Abbreviations
SpecificRequirements
Isuggests how to apply
Guidelines on Application
Examples of Methods
HardwareRequirements
SoftwareRequirements
i suggests how to apply
Overview of Tehniques and
Measures
Figure 2-11- IEC 61508 Overview
The focus on equipment can be seen from an overview of the standard shown
in Figure 2-11, the requirements in the standard are aimed at software and
hardware, more specifically those pieces of hardware or software which
provide safety related functions.
Page 22 of 214

Clause 7.4 of IEC 61508 highlights the need for hazard and risk analysis for
which it defines a number of objectives including:
• Determine the hazards and hazardous events of the equipment under
control (EUC) and the EUC control system for all reasonably
foreseeable circumstances, including fault conditions and misuse.
• Determine the event sequences leading to the hazardous event
• Determine the EUC risks associated with the hazardous event
The standard carries on to define a set of requirements for the hazard and risk
analysis ensuring that the hazards and hazardous events are defined, event
sequences determined, hazard eliminations considered, likelihood of
hazardous events evaluated, potential consequences determined and that the
EUC risk shall be determined.
The relationship between hazard, hazardous event and risk can create some
interesting reading. It is good to see a clear line between the hazards and risk
with the hazardous event being the situation where a person is harmed; risk is
the probability of the harm and the severity.
The standard states that 'risk shall be evaluated, or estimated, for each
hazardous event. When considering hazardous events and risks together the
clear relationship appears to blur as it is known that - in an hazardous event a
person is harmed so the probability of occurrence of harm is 1. The risk from
above is the probability of the harm and the severity therefore risk = 1 x
severity which could also be expressed as risk = severity of the harm. This
statement does not support the added value required of risk management
although it is unlikely that the statement is the one the authors intended to
make.
The approach the standard takes, only defining the requirements to be
fulfilled, leaves an organisation to select and implement its own choice of risk
management approaches or indeed to define its own. This can be
Page 23 of 214

advantageous for those with multiple approaches dependant on project or
product, but can make demonstration of compliance complicated.
The standard provides a good overall set of ideas for the consideration of
safety related systems, it does not consider risk management but does feed
forward into many domain specific standards including EN 50126 (CENELEC
1999), focused on the rail industry, which like IEC 61508 do not define a
specific risk management approach or process.
Rather than provide a risk management process they provide a lifecycle which
has an element of risk analysis integrated within.
ISO 15288 (2002) is arguably the most widely used systems engineering
standard in the world. ISO 15288 was defined provide a set of systems
engineering processes, in doing this it attempts to render obsolete a number
of existing standards including EIA 632 (EIA 1999), IEEE 1220 (1998) and
SECAM (INCOSE 1996) thus removing a some of the complexity of the
framework quagmire described by Sheard (1997). ISO 15288 provides
processes for systems engineering and a suggested structure in which the
processes can be applied.
Page 24 of 214

Framework
used to construct
used to m odel i
{sequence}
1..*
O Life Cycle Model
Stage
D escrip tionO utcom ePurpose
Aapp lythroughout 1
Process
Purpose
1 ..*
Outcome
1 ..*
Activity
1 ..*O Life cycle
I describes
Enterprise
System Life Cycle Processes
O Process Ooup
ITechnical Project Agreement
Figure 2-12 - System Life Cycle Stages - Process Structure View
This diagram, Figure 2-12, shows the structure of the System Life Cycle
Stages taken from the standard. A framework is used to model the System
Life Cycle Process Processes and is constructed from stages made up of a
number of processes applied throughout each stage. The life cycle is made
up of stages and the life cycle model provides the sequence in which the
stages are executed. The System Life Cycle Processes are categorised into 4
Process groups: Enterprise, Technical, Project and Agreement.
Page 25 of 214

•■Process group» Project
« Process» Project Planning
«Process>* Project Control
«Process» Project Assessment
« Process » Information Management
<<Process»Decision-making
«Process» Configuration Management
establish systematic approach to risk( identify/define risks() determine risk probability!) evaluate risks() prioritize risks()determine risk treatment strategies!) define acceptability threshold!) identify ris k treatm ent actions () communicate risk treatment actions!) maintain risk register!)
Risk Register Risks Rated Risk Strategy Risk StatusUnacceptable Risk Action
«Process» Risk Management
Figure 2-13 - Project - Process Content View
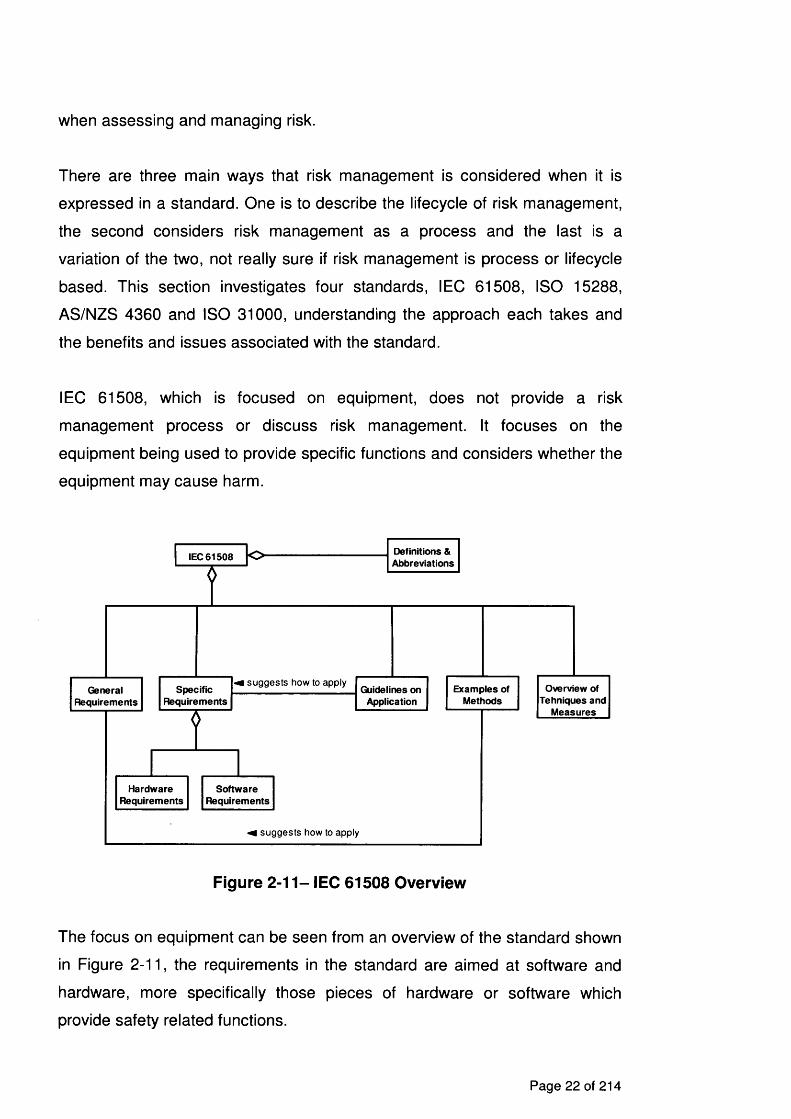
Figure 2-13 shows the project processes of which there are seven:
Configuration Management, Decision-making, Information Management,
Project Assessment, Project Control, Project Planning and Risk Management,
it also provides detail of the risk management process. The detail takes the
form of expected outcomes and tasks, these are shown in the two boxes
below the process name and are abstracted from the text of the standard.
ISO 15288 is not a risk specific standard. However it still considers risk
management a necessary part of a system life cycle and as such defines the
outcomes and tasks which should be performed. It does not in any way define
a flow for these tasks leaving it to the organisation to tailor as is applicable, as
it does with all processes throughout the standard.
The standard provides a very good overall framework for understanding
system lifecycles and presents an approach to defining them which enables
processes to be re-used throughout the lifecycle rather than used once as
some lifecycles would suggest.
Page 26 of 214

Historically the application of lifecycles has been a topic of great discussion
and is presented by Royce (1970) and McConnell (1996). ISO 15288 reflects
much of the learning discussed in these papers and is considered the key
standard for understanding systems lifecycles by many including the
International Council on Systems Engineering (INCOSE) whose systems
engineering handbook (2007) is based on the standard. More recent texts
focus on the project planning effort (Zwikael and Sadeh 2007) or managing
the supply chain (Wu and Olson 2008) and (Neiger et al 2009). Although
these perspectives provide useful research they do not provide an overall
approach to applying the risk management process.
The tasks within the process are presented in the same terminology as the
other standards which have already been considered. Two main differences
exist; the first is that as no flow has been defined the user is not presented
with an excess of bi-directional relationships; secondly there are no oversized
steps which connect to every other step here only given tasks which relate to
risk e.g. communicate risk treatment actions' are presented. This provides a
useful transferable module which can be integrated with other processes.
ISO 15288 does not provide a deep and all encompassing explanation of risk
management but it does provide a good overview to work from within a
framework which can be applied in most situations and organisations. The risk
management process it describes is commensurate with those from other
standards and best practice models including those already discussed. This
standard is aimed at providing capability for the whole organisation rather
than a single risk management focus.
AS/NZS 4360 (2004) is an Australia/New Zealand national standard which is
applied internationally including use in Europe on the CORAS project (Lund et
al 2004) as risk management process on which the work is based.
The standard provides a set of guidance which is aimed at assisting an
organisation in the improvement of its risk management activities. It achieves
this by defining terminology, a risk management process, a detailed version of
Page 27 of 214

the process and providing some thoughts on assessing current practices and
planning.
Increase confidence and' rigour for decision making]
and planning
rovide guidance to ...
Improved incident managementimprove
compliance with legislation
improvecorporate
governance
improved stakeholder
confidence and trust
improve 'v'\<dnciude>> identification of ipportunities anc
threats
_ _ _ variabilitynsure pro-active\" "«Include >
management
«includeImproved use of
resource
includ?^reduction in insurance premiums
Figure 2-14 - AS/NZS 4360 Purpose
An abstraction of the purpose defined in the standard is shown in Figure 2-14,
this shows that the purpose of the standard is to provide a generic set of
guidance which is focused on improving identification of opportunities and
threats, ensuring pro-active management, improving incident management,
improving stakeholder confidence and trust, improving compliance with
legislation and improving corporate governance.
Along side this breadth of objectives it is aimed at many different activities,
organisations and communities.
Page 28 of 214

IDENTIFY RISKS
ANALYSE RISKS
TREAT RISKS
EVALUATE RISKS
ESTABLISH THE CONTEXT
Figure 2-15 - Risk Management Process - Overview (AS/NZS 2004)
Within the standard the risk management process, shown in Figure 2-15, is
defined by seven main elements:
1. Communicate and consult - with internal and external stakeholders
2. Establish the context - Internal, external & risk contexts to be defined.
Evaluation criteria and the structure of the analysis also to be defined.
3. Identify risks - Identify where, when, why and how events could prevent,
degrade, delay or enhance the achievement of the objectives.
4. Analyse risks - Identify and evaluate controls. Determine consequences
and likelihood and hence the level of risk, whilst considering a range of
potential consequences.
5. Evaluate risks - Compare levels of risk against the criteria and consider
the balance between potential benefits and adverse outcomes.
6. Treat risks - Develop and implement specific strategies and plans for
increasing potential benefits and reducing potential costs.
Page 29 of 214

7. Monitor and review - Monitor the effectiveness of all steps of the risk
management process. Risks and the effectiveness of treatment
measures need to be monitored to ensure changing circumstances do
not alter priorities.
To consider this process in more detail elements 2-6 have been extracted and
are shown in Figure 2-16. This diagram shows the theoretical or expected
flow through the process.
Treat risks(AS/NZS 4360 process::)
Evaluate risks(AS/NZS 4360 process::)
Analyse risks(AS/NZS 4360 process::)
Establish the context(AS/NZS 4360 process::)
Identify risks(AS/NZS 4360 process::)
Figure 2-16 - Process - assumed flow
What looks like a simple approach, a flow of five activities, has a number of
issues including the lack of decisions, in-ability to re-visit work, no clear start
and end (this is currently assumed) and no artefacts.
The lack of artefacts appears to be an issue with the overall approach to the
definition of this process. The artefacts which are missing will hold information
which it is imperative to value of carrying out the process. The need to record
the process is left to an additional statement outside the process.
The overall picture becomes more unclear when reading the text relating to
each element, in section 3 of the standard, this talks of steps, activities and
Page 30 of 214

stages of the risk management process leaving the reader at an overall loss
to know how this process is constructed.
Monitor and review(AS/NZS 4360 process::)
Establish the context(AS/NZS 4360 process::)
Treat risks(AS/NZS 4360 process::)
Analyse risks(AS/NZS 4360 process::)
Identify risks(AS/NZS 4360 process::)
Evaluate risks(AS/NZS 4360 process::)
Communicate and consult
(AS/NZS 4360 process::)
Figure 2-17 - Process - additional flows
This once simple flow has been transformed, through the addition of elements
1 and 7 to the diagram (Figure 2-17), into a set of flows which can not be
comprehended let alone calculated. Further to the sheer number of options
and paths that can be taken there are also questions as to the meaning of the
numerous two way relationships between elements.
The sheer complexity within this process starts to suggest that this is not a
process at all but something much larger and more complicated. Although a
bad example for integrating activities and information flow the standard does
try to remind the reader and sets a good example for integrating with other
processes within the organisation.
Twenty seven terms are defined for use within the standards risk
management process some of which have cross references to other terms
within the list. Each term is accompanied by explanatory text and notes giving
some context to the term presented.
Page 31 of 214

There is a breadth to these terms ranging from 'Event' to 'risk management
framework' and 'Stakeholders' giving a grasp of the terms used across risk
management and organisations in general. There is also depth to the terms
considering 'Control assessment', 'Frequency' and 'Risk sharing'.
understands and deduces level of
[aw from ^
shares
actions taken to lessen modil
actions taken to le s s inimpact or outcome of compared against
acceptance(negative)
Hazard
Risk sharing
Likelihood
Monitor
Risk analysis
Event
Stakeholders
Residual risk
Organization
Risk retentionLoss
Consequence
Control
Probability
Risk criteria
Risk reduction
Frequence
Risk
Riskavoidance
Riskmanagement
RiskTreatment
Riskassessment
Riskidentification
ControlAssessment
Riskevaluation
RiskManagement
Process
Riskmanagementframework
Figure 2-18 - AS/NZS 4360 Terminology Quagmire
Figure 2-18 shows a diagrammatic interpretation of the definitions proposed in
AS 4360:2004. It also shows the relationships based on the references given
in the text. These definitions and relationships highlight some fundamental
issues:
• Some terms are not related to any of the other terminology defined.
• Where they are related it is unclear what the relationship is e.g. risk
and risk management framework.
• Unclear relationships also exist e.g. risk avoidance is related to risk
although the definition describes a 'risk situation'. It is not clear in this
case whether it is the risk or the situation which is being withdrawn
from; also risk reduction references risk as being associated with
consequence and likelihood but this association is not mentioned in
Page 32 of 214
risk, consequence or likelihood leaving a confusion as to the nature of
the relationship.
• A number of terms which would generally be related to risk have not
been, specifically consequence and likelihood - although the 'risk
reduction' definition does suggest that there may be a relationship
between them.
• Duplication of definition risk reduction and risk treatment either lessen
or modify risk, the difference between them seems to be only the level
at which they are applied; one to risk the other to likelihood and
consequence
Many of these issues could be resolved with a simple review based on the
diagram above. It is too often the case that list of terms and definitions are
created and published without a full understanding of the relationships.
This standard sets out with a good set of goals, focused at supporting and
guiding organisations through risk management, a summary of the standards
intentions is shown in Figure 2-19. This is considered as one of the best
examples of a risk management standard and is well referenced across the
world.
Page 33 of 214
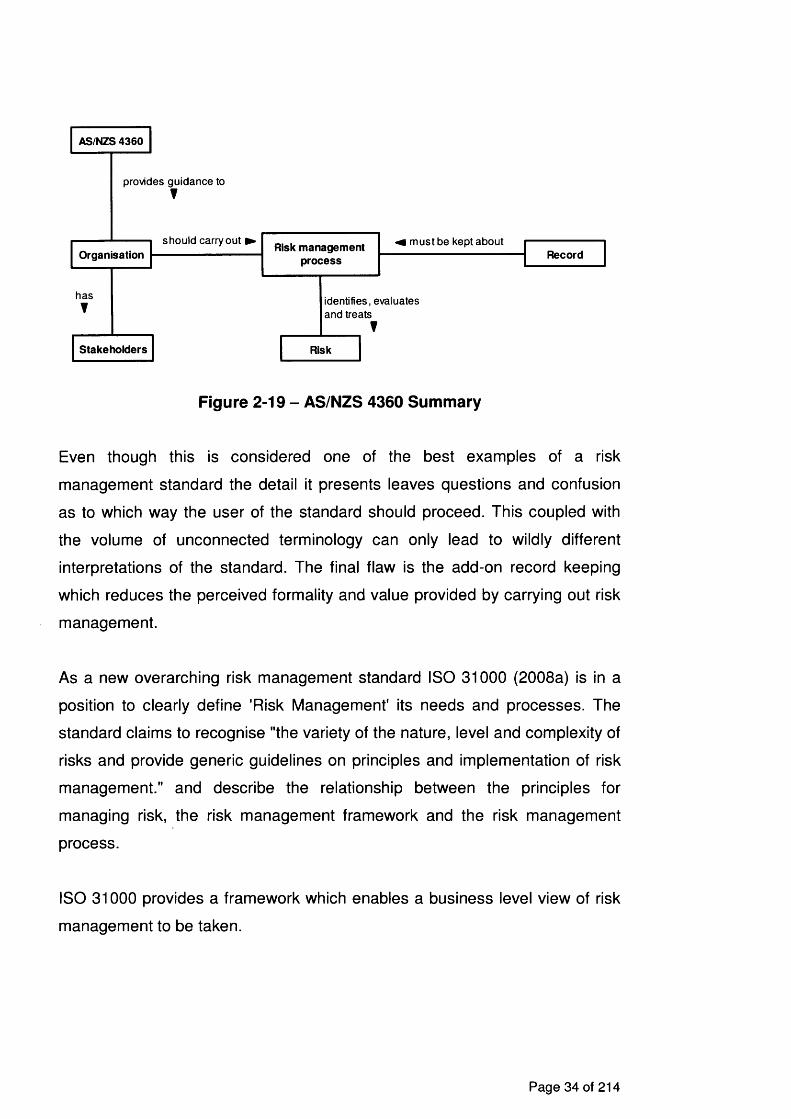
provides guidance to
should carryout ^ ^ must be kept about
has identifies, evaluates and treats
Risk
AS/NZS 4360
Record
Stakeholders
OrganisationRisk management
process
Figure 2-19 - AS/NZS 4360 Summary
Even though this is considered one of the best examples of a risk
management standard the detail it presents leaves questions and confusion
as to which way the user of the standard should proceed. This coupled with
the volume of unconnected terminology can only lead to wildly different
interpretations of the standard. The final flaw is the add-on record keeping
which reduces the perceived formality and value provided by carrying out risk
management.
As a new overarching risk management standard ISO 31000 (2008a) is in a
position to clearly define 'Risk Management' its needs and processes. The
standard claims to recognise "the variety of the nature, level and complexity of
risks and provide generic guidelines on principles and implementation of risk
management." and describe the relationship between the principles for
managing risk, the risk management framework and the risk management
process.
ISO 31000 provides a framework which enables a business level view of risk
management to be taken.
Page 34 of 214

5.2 Mandat* and commitment
5.3 Design of framework for managing rlak5.3 1 Understanding the organization and its context 5 3 2 Risk management policy5.3.3 Integration into organizational processes5.3 4 Accountability5.3 5 Resources5.3 6 Estabtahmg internal communication and reporting mechanwms5.3 7 Establishing external communication and reporting mechanisms
S.6 Continual improvement of the framework5.4 Implementing risk management
5.4 1 Implementing the framework for managing risk 54 2 Implementing the risk management process
5.S Monitoring and review of the framework
Figure 2-20 - Framework (ISO 2008)
The framework, shown in Figure 2-20, is designed to enable a business to
implement the risk management process whilst integrating risk management
into its existing management systems. The framework is comprised of five
components:
• Mandate and commitment
• Design of framework for managing risk
• Implementing risk management
• Monitoring and review of the framework
• Continual improvement of the framework
Within the implementation of risk management component the standard
promotes an iterative approach specifying multiple instances of the risk
management process will be required.
Page 35 of 214

I*— I 6 3 ^stat>ltsh'n9 the context
1 6.4 Risk assessment
6 2Communication
andconsultation
6.4. 3 Risk analysis ]• --1 -
i.5 Risk treatment
6.4.2 Risk identification
6.4.4 Risk evaluation
6.6Monitoring
andreview
Figure 2-21 - Risk Management Process (ISO 2008)
The risk management process shown in Figure 2-21 has five activities to be
carried out:
• communication and consultation,
• establishing the context,
• risk assessment,
• risk treatment and
• monitoring and review
The risk assessment activity is further defined by three sub-activities; risk
identification, risk analysis and risk evaluation as defined in the ISO guide 73
(2007).
The Framework defined by the standard adds a level of business integration
which has not been observed previously in other standards. Although it is
similar in style to the spiral model defined by Beohm (1988) which provides a
project level framework for software risk management, the ISO 31000
framework should enable a level of senior management buy-in and action
which has not been in evidence previously at an organisational level.
Page 36 of 214

The specification of multiple instances of the risk management process is an
improvement. Many other standards including BS 6079 (BSI 2000) leave the
reader to decide whether to use the process once per risk, once per project or
once per organisation. The standard also specifies that risk identification is
only carried out once for each instance of the process which leaves risks
identified later in a project or execution without the ability to be considered or
analysed.
The standard suggests that whenever a risk assessment is carried out risk
identification, analysis and evaluation will also be carried out. This may be an
issue with the terminology used in the standard, which is based on ISO Guide
73 (2007) to be discussed in more detail later. In many cases risk
identification, analysis and evaluation have to be carried out separately due to
issues like volume of information and time.
Overall the Risk Management process specified is very similar to AS/NZS
4360 and exhibits the same advantages and disadvantages, mainly the
inability to follow a process flow.
Although still in draft form this standard does not currently exhibit the clear
concise views which have been missing from the risk management domain
and are required to direct risk management across industries in this global
society. The use of guide 73 for the terminology provides a single reference
point for risk terminology although the clarity of the terms and their
relationships needs to be investigated further.
Page 37 of 214

2.4 Terminology
Issues with terminology have already been highlighted along with the
importance of having a consistent set of terminology on which to base
practices. This section will investigate literature which defines general risk
terminology focusing on guide 73 a key reference. The section will also focus
on the definition of a risk which itself provides much confusion.
The ISO Guide 73 Risk management - vocabulary provides the basic
definitions of risk management generic terms. The aims of the guide are to
"encourage a mutual and consistent understanding, a coherent approach to
the description of activities relating to the management of risk, and use of risk
management terminology in processes and frameworks dealing with the
management of risk."
The guide is split into four groups of terms:
• Basic Terms %
• Terms related to people or organisation affected by risk
• Terms related to risk assessment
• Terms related to risk treatment and control
This work focuses on the basic terms referencing specific relationships where
relevant.
Page 38 of 214

co-ordinates and directs
Risk Management Plan
decision on approach and /plan fonmanagement ot applies policies,
\ J pr/cedures and practices\ tJ tasks relating to
irding
-Im plied-is reference for the
M is tolerable
M is magnitude of
cNqbines ►M com byres
M has
state of deficiency of information related to a future
ConsequenceLikelihood
Exposure
outcome of ^
Event
Risk TolerabilityRisk Criteria
Risk Management
Risk Source
Risk
Incident
Level ot Risk
Uncertainty
Risk Management Process
Risk Management System
Risk Management Framework
Risk Management Policy
Figure 2-22 - Risk management vocabulary
The guide defines 17 basic terms many of which have multiple definitions
including risk which has one main definition and two variations. Each
definition provides references to other defined terms used within.
The diagram in Figure 2-22 shows the terms and their relationships as defined
by the guide and has been defined in this way to enable consideration of the
terms and relationships defined within the standards. It will also be used to
enable a comparison to be carried out between the terminology within guide
73 and AS/NZS 4360. The figure shows that more than half of the terms
defined related directly to the definition of risk. The number of direct
relationships to the definition of risk presents issues when factoring in the
general lack of relationship from these terms to any other definition. The main
issue is that many of the terms appear only to be related to the definition of
risk as they include the word risk. This concern is supported by the repetition
of relationships, two relationships 'direct' and 'control' risk, three relationships
provide intentions, policies, procedures or decisions relating to the
management of risk.
Within Figure 2-22 there are also two relationships marked as « im p lie d »
these are not stated by reference but is suggested by the notes associated
Page 39 of 214

with the definition.
When the same modelling principle is applied to the other sets of terminology
similar results are achieved, risk treatment for example is referred to as a
process, activity and a measure (solution) in ISO 16085 (2006)
On the whole the definitions are unimaginative and unclear for instance "Risk
Management System - management system to direct and control and
organization with regard to risk 3.1.1". The re-use of the defined term in the
definition only leaves six words to define the term. This only reference is to
Risk, not to the risk management process, plan or policy which the notes
suggest.
The Australian standard AS/NZS 4360:2004 provides its own set of
terminology, Figure 2-23, which has been discussed earlier in this chapter.
The issues discussed will be used to provide a comparison for those in the
ISO Guide 73.
^ reviews
raw from understands and deduces level of
shares ^
actions taken to lessen modil
a c tia is taken to lessenimpact or outcome of compared against
acceptance{negative)
Hazard
Risk sharing Risk analysis
ConsequenceEvent
Risk reduction
Frequence
LossRisk retention
Control
LikelihoodRisk criteria
Probability
Organization
Monitor
Ftesidual risk
Stakeholders
Risk
Risk avoidance
Ftisk Treatment
Fiisk evaluation
Riskidentification
ControlAssessment
Ftisk
Ftiskmanagement
FtiskManagement
Process
Ftiskmanagement
framework
Figure 2-23 - AS/NZS 4360
Page 40 of 214

Many of the issues are exhibited by both standards.
• Much of the terminology being related directly and only to risk rather
than other relevant terminology from the set.
• The lack of direct relationship between risk and consequence and
likelihood as in both standards it is implied that there is a direct
relationship but this is not clear within the definitions.
Both standards have their own advantages.
• ISO 31000 provides relationships from all of its terms which is a step
forward from AS/NZS 4360
• AS/NZS 4360 incorporates process terminology where ISO 31000
separates it into a different set of definitions.
There are other similarities which may be useful to note.
• The relationships between consequence and event are almost identical
• They both provide detail regarding the composition of risk
• They both ignore the composition of most terms other than risk.
The fact that both standards have similar issues with the definition of risk and
the direct relationships they try to assert between management terms and risk
highlight the need for a formalised approach to the definition of domain
terminology.
The Unified Modelling Language (UML) Profile for Modelling Quality of
Service and Fault Tolerance Characteristics and Mechanisms Specification
(OMG 2008b) provides a UML profile based on the AS/NZS 4360 (1999)
terminology, within this profile a risk is defined as being made up of a
frequency and a consequence. This definition is shown in a note and in the
2004 version of the standard.
Page 41 of 214

nstance«m etaclass»
::RiskAssessincnt::l n\vantedlncident::l imnntedlnci dentmetaclass »
Consequence
instance
t arget
source'
definition
definitioninstance« metac lass» Risk Value
met a das s> >
RiskThemc
<<met adass>>
AhstrnctRi.sk
metaclass Riskkva Illation
<• metaclass >> RiskRclationship
«m etadass»:: Risk Assessment: :C ontevt:: Asset
metadass»:: RiskAssessnient::Context::AssetValue
«m etaciass»:: Ri skAssessnie nt: :Con text:: Val u eDefi ni t ion
• metadass»
::RiskAssessment::Context:: RiskKvaluatiout riterion
Figure 2-24 - QoS UML profile (OMG 2008b)
Page 42 of 214
60

It can be seen by the clarity and volume of relationships between terms in
Figure 2-24 that this profile provides a better related set of terminology than
either standard considered above. This profile provides a useful meta model
to support IT Quality of service and the approach may be of use in supporting
a more generic model of risk terminology.
Mazouni and Aubry (2007) use the UML in a similar way but rather than
defining a profile he has defined an ontology for Preliminary Hazard Analysis
(PHA). PHA is a specific tool used for hazard identification, this case applied
in the rail industry.
0 ..T
Q,.f
SEVERITY
tewxirejevcK): aisr
Figure 2-25 - PHA ontology (Mazouni and Aubry 2007)
This work again improves the clarity of the use and relationships between risk
terminology and provides a definition of risk specific to PHA's. This definition
includes occurrence, exposure and severity shown in Figure 2-25 taken from
Mazouni and Aubry’s paper.
Page 43 of 214

2.4.1 Risk Definitions
The numerous definitions of risk and its surrounding terminology along side
the lack of consistency in the relationships between terms provide a large and
complex issue. To further understand the root cause of this issue focus will be
placed on the on the central terminology 'Risk' to which authors and standards
seem more able to relate detail.
This work will consider a number of risk definitions from texts and standards
prior to drawing conclusions regarding overall issues with the definition of risk.
The financial definition taken from Harvey's financial glossary (2008) provides
a succinct definition, depicted in Figure 2-26.
against ►Asset
Risk
Degree of uncertainty
Figure 2-26 - Finance risk
This definition is focused on the loss of money, the Asset is providing a return
and it is the uncertainty of the return that is in questions.
Leveson (1995) provides a number of definitions including risk and hazard.
Leveson defines risk by saying, "Risk is the hazard level combined with (1)
the likelihood of the hazard leading to an accident (sometimes called danger)
and (2) hazard exposure or duration (sometimes called latency)."
Page 44 of 214

combinedwith
combinedwith
Hazard level
Risk
Likelihood of accident
Hazardexposure
Figure 2-27 - Leveson risk
"Hazard exposure" requires an understanding of how long something will be
exposed.
Although when in time an event may occur cannot be told, it could be after
five minutes or one year. The point is that the same outcome could occur but
with this definition it appears that the risk will be different. The point Leveson
is trying to make is that the longer you are in a hazardous state, the more
likely an accident is to occur e.g. the longer you sit in a tree the more likely
you are to fall out.
Roland and Moriarty (1990) states "risk is associated with likelihood or
possibility of harm. Put another way, it is the expected value of loss."
Value
HarmPossibility
Loss
Risk
Figure 2-28 - Roland and Moriarty's risk
"Risk" may still exist if either "Possibility" or "Value" is not present; the empty
diamond denotes this. This definition shows two very different ideas of what
risk is, although Roland and Moriarty have used one as an example of
another. They are saying that the "Value" of "Loss" is equivalent to
"Possibility" of "Harm".
Page 45 of 214
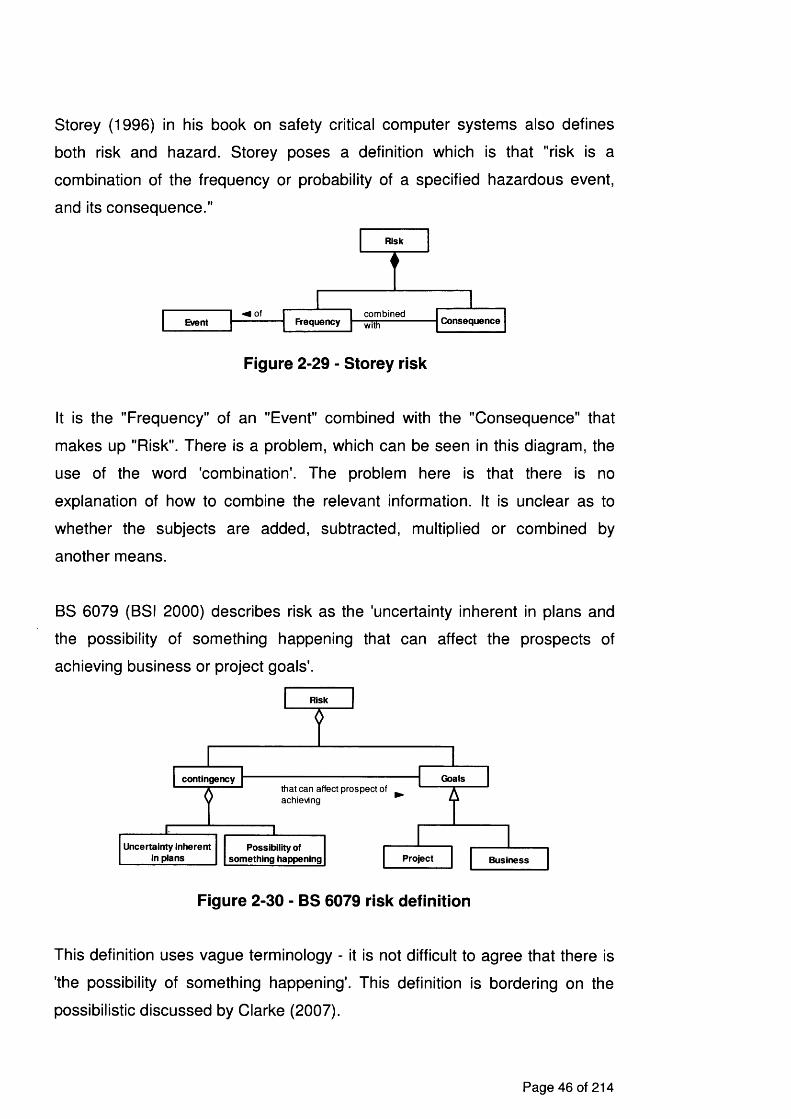
Storey (1996) in his book on safety critical computer systems also defines
both risk and hazard. Storey poses a definition which is that "risk is a
combination of the frequency or probability of a specified hazardous event,
and its consequence."
M of combinedwithEvent Frequency
Risk
Consequence
Figure 2-29 - Storey risk
It is the "Frequency" of an "Event" combined with the "Consequence" that
makes up "Risk". There is a problem, which can be seen in this diagram, the
use of the word 'combination'. The problem here is that there is no
explanation of how to combine the relevant information. It is unclear as to
whether the subjects are added, subtracted, multiplied or combined by
another means.
BS 6079 (BSI 2000) describes risk as the 'uncertainty inherent in plans and
the possibility of something happening that can affect the prospects of
achieving business or project goals'.
that can affect prospect of achieving
contingency Goals
Risk
Project BusinessUncertainty inherent In plans_____
Possibility of something happening
Figure 2-30 - BS 6079 risk definition
This definition uses vague terminology - it is not difficult to agree that there is
'the possibility of something happening'. This definition is bordering on the
possibilistic discussed by Clarke (2007).
Page 46 of 214
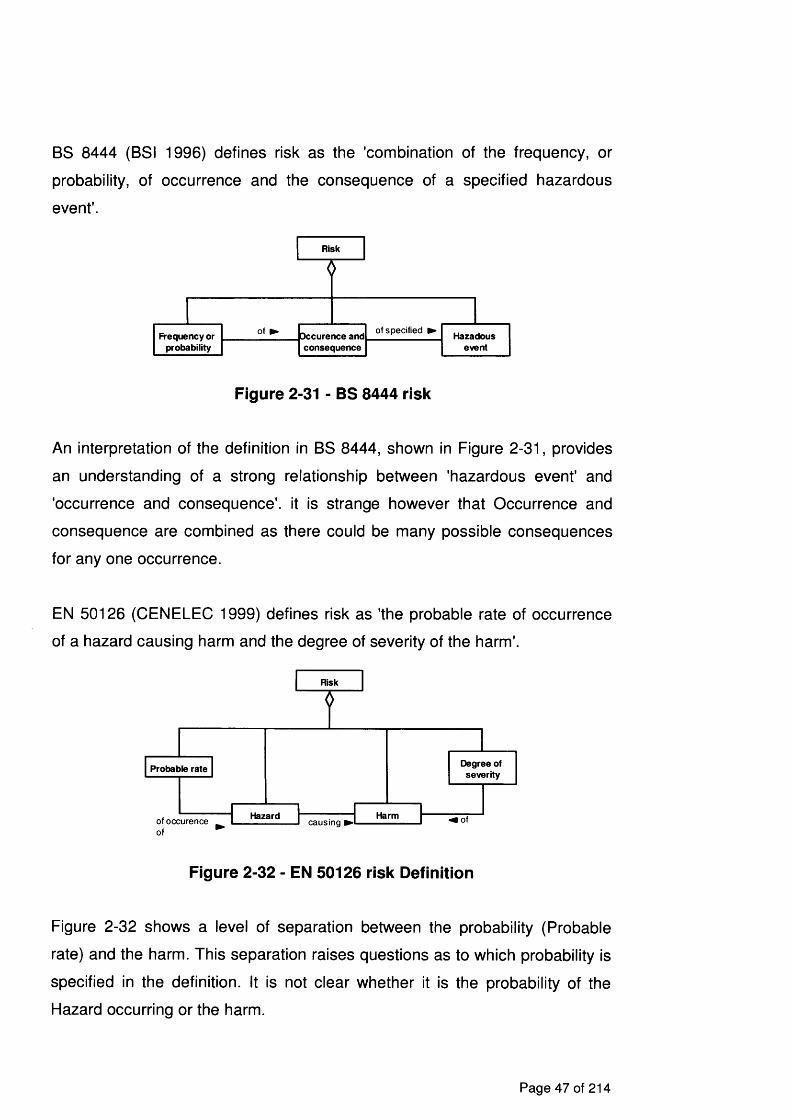
BS 8444 (BSI 1996) defines risk as the 'combination of the frequency, or
probability, of occurrence and the consequence of a specified hazardous
event'.
of specified ►
Risk
Frequency or probability
Occurence and consequence
Hazadousevent
Figure 2-31 - BS 8444 risk
An interpretation of the definition in BS 8444, shown in Figure 2-31, provides
an understanding of a strong relationship between 'hazardous event' and
'occurrence and consequence', it is strange however that Occurrence and
consequence are combined as there could be many possible consequences
for any one occurrence.
EN 50126 (CENELEC 1999) defines risk as 'the probable rate of occurrence
of a hazard causing harm and the degree of severity of the harm'.
of occurence causing ^
Risk
Hazard
Probable rate
Harm
Degree of severity
Figure 2-32 - EN 50126 risk Definition
Figure 2-32 shows a level of separation between the probability (Probable
rate) and the harm. This separation raises questions as to which probability is
specified in the definition. It is not clear whether it is the probability of the
Hazard occurring or the harm.
Page 47 of 214

Seven definitions of risk have been considered and a number of similarities
can be identified including; use of probability, focus on outcomes, use of
hazard, dependency on timing and multiple interpretations.
The first of these similarities the use of probability can be seen in many of the
definitions through the use of words like frequency, likelihood and uncertainty.
These terms all infer the use of probability in risk. For probability to mean
something in terms of risk it must be relevant to its mathematical definition
and therefore the sum of all probabilities must equal one.
The definitions above all in some way refer to an outcome. Some consider
this to be harm, accident or consequence. The problem with accident and
harm is that they only take into account one view of the argument - the
negative effect. To gain a fuller picture future (Hollnagel 2008) and positive
(Flage and Aven 2009) consequences must also be considered.
A number of the definitions incorporate Hazard, a word which could be
considered to have as many definitions as risk. In general it is used to signify
an event pre-ceding the outcome or consequence under scrutiny (Woodruff
2005, Stevens and Thevaranjan 2009 and Gamper and Turcanu 2009).
The use of words like consequence and hazard ensure that a reader of the
definitions will be considering issues beyond or before the 'event' that is the
focus as suggested by Woodruff (2005). Considering the chance of an
individual being rushed to hospital, as a consequence, has very little to do
with the risk that this is the consequence of.
The last point, interpretation, is amplified by Roland and Moriarty (1990) as
they provide two definitions within one. Their definition discusses possibility
and harm and talks about Value and loss as an example. This implies that
value would relate to possibility and loss to harm. Although this sounds
reasonable the value of loss, say £5,000 by itself cannot be linked to any
probability. This may be a bad example on their part but it goes to show risk is
easily misunderstood.
Page 48 of 214

Remenyi and Heafield (1996) summaries this discussion well by stating that
"Risk is a challenging concept to define, understand and ultimately to
manage. This is primarily because risk often means different things to
different people." This is supported by Aven and Kristensen (2005) through
the statement of their view "that the concept of risk, risk assessment and risk
management have not yet been sufficiently developed".
There are however a number of commonalities between the ideas discussed
above; one of these is that to understand risk a value must be provided
(whether numerical or descriptive) detailing the chance of occurrence of an
outcome. Another is that there must be a set of outcomes in order to
understand fully the whole set of risk. There will always be events that occur
prior to and soon after the outcome that is of concern. Finally, every outcome
must be traceable from its cause or hazard.
2.4.2 Terminology Summary
In summary there are a number of issues with the term risk and the
terminology which is associated with it. Initially there is a lack of coherence
between authors and standards including those yet to be published. Those
authors or standards providing definitions of more than one term very rarely
enable a user to navigate through the terms and the inclusion of timing in the
definition of risk, through the use of hazard and consequence, reduces the
focus on identifying and defining a risk before it is analysed.
A solution too many of these issues would be to provide an ontology for risk
defining the terminology and the relationships between those terms defined.
This would enable users to understand the scope of each term individually
and provide the associated terms which they would expect to hear in relation
to those initially defined.
Each set of terminology along with each industry has its own tools and
techniques which will also be impacted by this terminology and would benefit
from a single unified source.
Page 49 of 214

2.5 Tools and techniques
Much of the focus of risk management research past and present is on tools
and techniques; tools are the software, hardware and document templates in
and through which data is captured to give meaning and/or understanding to a
risk or hazard. Techniques are the approaches or methodologies used to
gather the data and calculate the results for specific risks. Tools and
techniques are often grouped together as it can be difficult to differentiate one
from the other.
Many types of tool and technique exist to support the definition of a risk,
understand causes of risks and to understand consequences. Leveson
(1995), The IRM and AIRMIC's risk management standard (2002) and ISO
31010 (2008b) all provide list of tools and techniques. Leveson provides a
critical analysis of each whilst ISO 31010 provides a matrix showing in which
areas of risk each tool or technique can be applied.
These three references provide a list of 73 tools, techniques or methods. The
IRM categorise their list into risk Identification techniques and risk analysis
methods and techniques. These categories equate to the areas incorporated
in risk assessment according to ISO guide 73 (2002). The latter of the two,
risk analysis methods and techniques, groups the techniques into upside risk,
both and downside risk.
ISO 31010 states that four of the methods identified apply to all steps in the
risk management process these methods are Failure, Modes, Effects and
Criticality Analysis (FMECA), Reliability centred maintenance, Structured
What If (SWIFT) and Environmental risk assessment. It is more likely that
these tools provide information related to terminology which is used in each
step rather than as the standard implies - if you have used this method risk
management has been carried out satisfactorily.
Many of the tools, techniques or methods provided by the references above
have been tailored for specific applications or industries including
Page 50 of 214

• human factors Cacciabue (2005) and human health Davis et al (2008)
• political acceptance criteria Ale (2005) and local empowerment Nilsen
(2008)
• supply chain disruptions Adhitya et al. (2007), procurement Aggarwal
and Ganeshan (2007) and operational risk (Dalla Valle and Giudici
2008)
• International project risk management Han et al. (2008) and post project
learning Dikmen et al (2008)
• Pedestrian surface evaluation Hunt-Sturman and Jackson (2009)and
water treatment Hess and Bernard (2008)
In many cases such as with Kirchsteiger (2008) the use of a tool or
methodology is referred to as 'Risk assessment'.
In truth 'Risk assessments' provide a variable output dependant on the user.
This is discussed in detail by Leveson (1995) when concluding her tools and
techniques discussion. In this discussion she explores results from
independent groups applying the same methods to a system and finds
inconsistent results with too much variation to be the tool alone.
Tools, methods and techniques provide detailed information regarding a risk
or the approach to calculating risk. Many authors are trying to further refine
these risk assessments for specific industries and applications. In many cases
they are re-defining the terminology of risk along side their tailoring of the risk
assessment.
Page 51 of 214

2.6 Conclusions
A number of issues with the existing process and terminology associated with
risk management have been identified during the investigation the purpose of
which was to review and understand the terminology and processes related to
risk management.
The lack of change in the risk management process is a major issue and can
be seen throughout this chapter from Bohems definition to the yet un
published ISO 31000 standard. The lack of change shows that there is little or
no recognition that the risk management process may not be fulfilling its aims.
The lack of any updates to the process and the inability of the process to fulfil
its aims suggest a re-evaluation using a pragmatic approach is required. To
ensure that the relevant level of rigour is also incorporated a formal approach
incorporating the definition of terminology and artefacts would also be
advantageous.
The lack of clear well related definitions hinder progress in risk management.
There does not appear to be any recognition that in this semantic world/age
loose relationships between terminology do not provide enough definition or
scope to the terminology in question. Both authors and standards must
recognise that definitions by themselves are no longer enough; ontologies
must be defined and published to show relationships between terms as well
as their definition.
Due to the variation in scope and depth of application no further work on tools
and techniques is proposed. The issues with risk management process and
terminology suggest that it is the wider, system view which needs
improvement and formalisation. Chapter three will investigate an approach to
providing the formalised view of risk management required.
Page 52 of 214
3 Research Methodology
3.1 Introduction
This chapter outlines the philosophical and practical approach taken toward
the development and implementation of this work. It discusses the
appropriateness of phenomenological and positivist perspectives discussed
by Remenyi (1998) and selects a research strategy before identifying tactics
which may be used for the identification of solutions and the demonstration of
the application of the solution proposed. It also considers the implications of
generalisation and validation.
3.2 Methodology
3.2.1 Strategy
It is envisaged that the initial research question will be developed through the
understanding of literature providing a document based approach to the initial
questions. These questions will be tested through the interpretation of a
number of cases. The intention is to take a cross sectional view of these
cases providing a variety of contexts in which issues may be identified.
In this way the research will be of an empirical nature understanding concepts
based on the experience of the researcher and the processes identified
through the initial studies.
It is anticipated that one of the issues within the research area is the lack of
ability to recognise and integrate the positivist and phenomenological mind
sets, with many people unable to release their positivist scientific
backgrounds. With this in mind the intention is to ensure that this work takes a
phenomenological approach enabling the identification of those areas which
are currently lacking.
Although a mainly phenomenological approach is suggested it is likely that the
final study although phenomenological in outlook and application will be
Page 53 of 214

positivist in nature - the intention will be to search for cases in which the
proposed solution does not work.
3.2.2 Tactics
Specific research tactics will be applied within the initial evidence gathering
case studies and the final application study. The tactics are likely to include:
• Case study
• Action research
• Ethnography
• Participant observer
It is envisaged that a number of issues may arise during the execution of this
work due to the implementation of these tactics. Issues include the inevitable
bias due to the researcher being part of the team within the case studies and
the cultural acceptance of a phenomenological approach within positivist
domains.
Where issues with the mind set of participants is an issue case studies may
be excluded or discontinued due to the resource and time available to change
the organisational culture. Participant observation and researcher in the team
issues will be unavoidable as it will be necessary to transfer the knowledge of
the proposed solution to other participants, in some cases the participants
may not know that research is being carried out, in these cases there will be a
long term ethnographic type relationship with the organisations in question.
3.2.3 Generalisability
It is anticipated that this work will provide a generalised approach to the
management of risk from a phenomenological viewpoint. Generalisation of
evidence based on a phenomenological approach is not usually
recommended however in this case the work will be carried out in relation to
the already generalised definitions of risk management. These existing
general definitions will enable direct comparison between the options
proposed within this work and current understandings.
Page 54 of 214
4 Application
4.1 Introduction
The purpose of this chapter is to discuss the requirements for a model based
framework for the formalisation of risk management and propose a framework
which fulfils the requirements.
The chapter begins by defining the requirements for and choice of
formalisation framework. It continues by providing reasoning behind the
choice through the use of some basic concepts and their relationships to
specific applications.
The Unified Modelling Language (UML) is selected and introduced as a high
level formalisation tool. To show that the UML can be used as a tool for
providing a formalised view of risk management a number of existing
applications of the UML are identified and the role of the UML within the
application discussed.
The first group of applications is taken from the IT/IS domain, the UML's
domain of origin, showing the breadth of application within its domain. Next,
various applications from a group of domains not traditionally associated with
the use of the UML are discussed, The aim is to show that the UML not only
applies to IT/IS but it has also been applied to the formalisation of other
domains.
Each existing application will be related to a number of systems concepts to
show the breadth and depth of the use of the UML.
Page 55 of 214

4.2 Technique selection
To provide a consistent understanding of risk management it is desirable to
have a common approach to the consideration of all concepts being
investigated and defined.
The framework selected to carry out the formalisation of risk management
must:
• use a modelling approach
• be capable of providing an understanding of the current terminology of
risk management
• be capable of providing an understanding of
• be applicable to the definition of ontologies and taxonomies and
• be an accepted approach for the definition of processes.
Use a modelling . approach
✓ ^ r o r m a l is e N . Constrainapproach to the \ managem ent of J N risk > /
Look at current definitions
in c lu d e
Terminologyinclude.
include*X Provide >
understanding of information for risk Nwmanagement^/
Define ontology
Look at current processes
include^
ind u ct
[Define processes]
include*
Figure 4-1 - Requirements
Page 56 of 214

These detailed requirements abstracted from the leaf use cases in Figure 4-1
describe the uses of the framework. The framework itself must still fulfil the
needs of formalisation including enabling, consistency, repeatability, multiple
views and pragmatism.
4.2.1 Framework Selection
Options for the provision of the framework required will now be considered.
These options focus on modelling languages as languages provide an
abstraction from specific applications.
Table 4-1 lists 10 graphical modelling languages showing their ability to model
current terminology and processes, define terminology and processes, and
provide a formal output.
Page 57 of 214
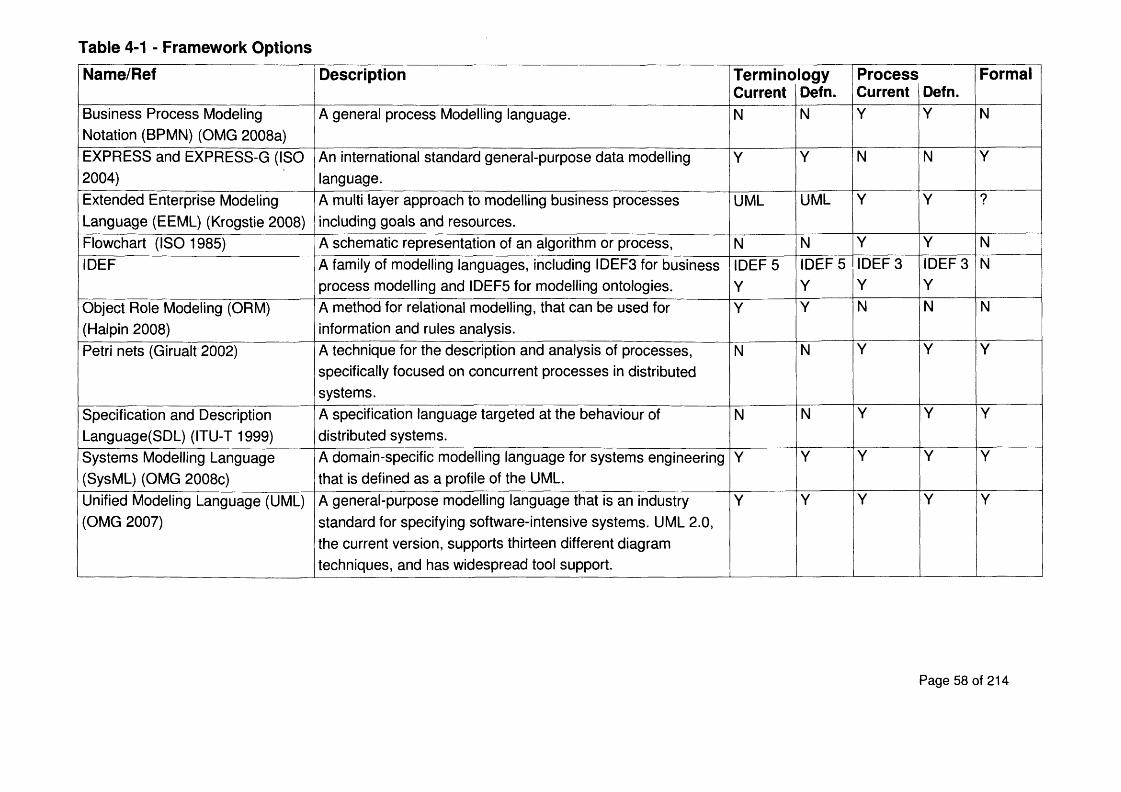
Table 4-1 - Framework OptionsName/Ref Description Termino
CurrentlogyDefn.
ProcessCurrent Defn.
Formal
Business Process Modeling Notation (BPMN) (OMG 2008a)
A general process Modelling language. N N Y Y N
EXPRESS and EXPRESS-G (ISO 2004)
An international standard general-purpose data modelling language.
Y Y N N Y
Extended Enterprise Modeling Language (EEML) (Krogstie 2008)
A multi layer approach to modelling business processes including goals and resources.
UML UML Y Y ?
Flowchart (ISO 1985) A schematic representation of an algorithm or process, N N Y Y NIDEF A family of modelling languages, including IDEF3 for business
process modelling and IDEF5 for modelling ontologies.IDEF 5 Y
IDEF 5 Y
IDEF 3 Y
IDEF 3 Y
N
Object Role Modeling (ORM) (Halpin 2008)
A method for relational modelling, that can be used for information and rules analysis.
Y Y N N N
Petri nets (Girualt 2002) A technique for the description and analysis of processes, specifically focused on concurrent processes in distributed systems.
N N Y Y Y
Specification and Description ^ Language(SDL) (ITU-T 1999)
A specification language targeted at the behaviour of distributed systems.
N N Y Y Y
Systems Modelling Language (SysML) (OMG 2008c)
A domain-specific modelling language for systems engineering that is defined as a profile of the UML.
Y Y Y Y Y
Unified Modeling Language (UML) (OMG 2007)
A general-purpose modelling language that is an industry standard for specifying software-intensive systems. UML 2.0, the current version, supports thirteen different diagram techniques, and has widespread tool support.
Y Y Y Y Y
Page 58 of 214

Based on the information shown in Table 4-1 the UML and SysML are the
only languages able to fulfil the requirements stated above, specifically the
ability to define both process and ontology. As the SysML is a profile of the
UML with some specific additions it is possible to select both. The main work
of defining ontology and process will be carried out using the UML and use
concepts from the SysML where relevant.
To further support the use of the UML a number of example applications have
been investigated. These example applications have been categorised by
industry and are related to a general set of terms which can be used to
describe concepts within a systems understanding.
is a use of UML -fef-i---------------------
takenfromOrganises ►
Development
Industry
Application
SoftwareDevelopment
Life Cycle Model
Life Cycle Concept
Software Development
Process Definition
Figure 4-2 - UML Concepts Usage view
The diagram in Figure 4-2 shows the basic concepts to which this chapter
relates the applications it describes. The major concepts are Life cycle
concept and Development. The Life Cycle Concept provides all of the
organisation tools including life cycles, life cycle models and the processes
which are executed within them. In this diagram the Software Development
Process Definition has been shown as software is the recognised origin of the
UML. The need for the Life Cycle Concept lies in the need to organise the
work being carried out, this work has been captured with the use of the term
Development. Development in this case is the activity of the people carrying
out the work whether organised by life cycle and process or not.
Page 59 of 214
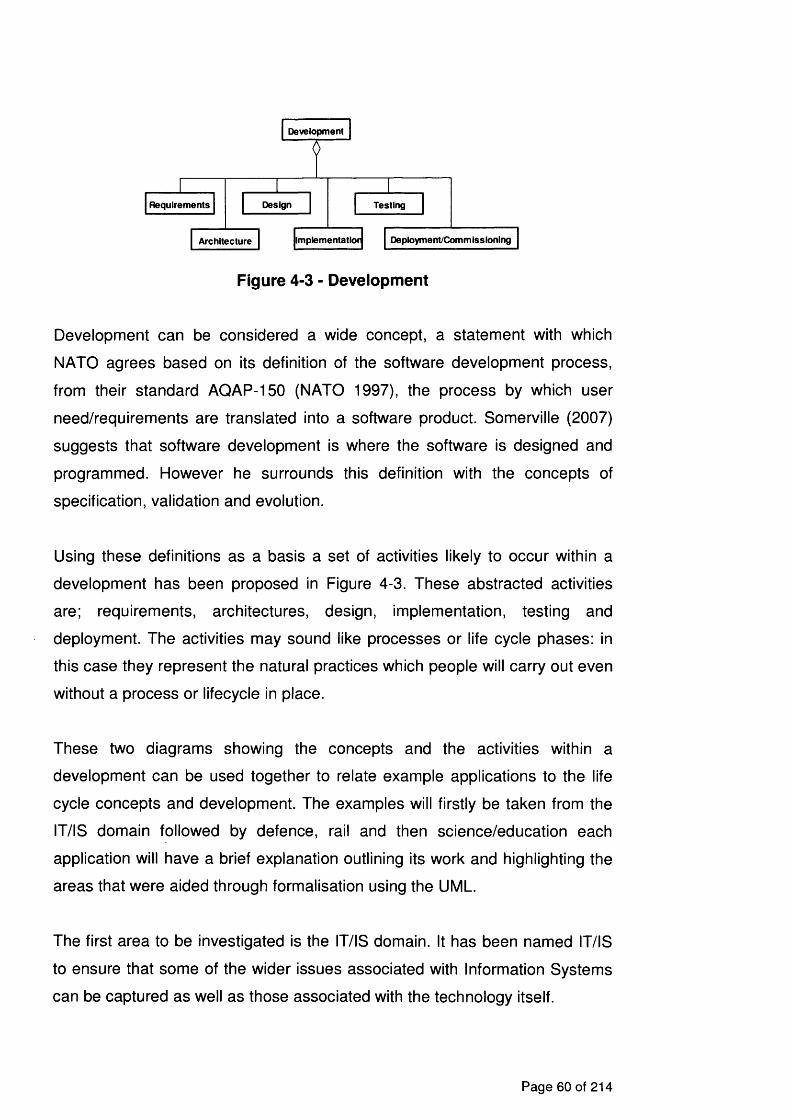
Architecture
Development
Requirements Testing
Implementatior
Design
Deployment/Commissioning
Figure 4-3 - Development
Development can be considered a wide concept, a statement with which
NATO agrees based on its definition of the software development process,
from their standard AQAP-150 (NATO 1997), the process by which user
need/requirements are translated into a software product. Somerville (2007)
suggests that software development is where the software is designed and
programmed. However he surrounds this definition with the concepts of
specification, validation and evolution.
Using these definitions as a basis a set of activities likely to occur within a
development has been proposed in Figure 4-3. These abstracted activities
are; requirements, architectures, design, implementation, testing and
deployment. The activities may sound like processes or life cycle phases: in
this case they represent the natural practices which people will carry out even
without a process or lifecycle in place.
These two diagrams showing the concepts and the activities within a
development can be used together to relate example applications to the life
cycle concepts and development. The examples will firstly be taken from the
IT/IS domain followed by defence, rail and then science/education each
application will have a brief explanation outlining its work and highlighting the
areas that were aided through formalisation using the UML.
The first area to be investigated is the IT/IS domain. It has been named IT/IS
to ensure that some of the wider issues associated with Information Systems
can be captured as well as those associated with the technology itself.
Page 60 of 214

Application Semantic web
a pp lie sApplicationCORAS
OrganisesLife Cycle Concept Development <-3’ Software Development
DesignRequirements Testing
Process Definition Software
Development Process Definition
ImplementatiorArchitecture Deployment/CommissioningLife Cycle
Model
Application Code Generation and
Software Patterns
Application The Unified
Process
Application Use Case Based
Requirements
Figure 4-4 - UML IT/IS Usage view
Four IT applications of the UML have been considered including associations
with the life cycle concepts and development activities. It can be seen in
Figure 4-4 that these four applications apply to different aspects of the
development and Life cycle concepts the main points from each application
are detailed below.
Code Generation and Software Patterns:-Peckham and MacKellar (2001)
used the UML to record design patterns from the database community, once
recorded the known good patterns were incorporated into high level
conceptual models for new software. The re-use of design patterns enabled
speedier design and implementation.
Semantic web:- Baclawski et al (2001) investigates the use of the UML as an
ontology development language by comparing it with existing markup
languages. He concludes that incompatibility issues can be resolved through
the definition of a UML profile.
The Unified Process:-The Unified Process (Jacobson et al 1999) defines a
Life Cycle Model as an iterative and incremental model meaning that the
stages in the life cycle are carried out once, with the processes being run
Page 61 of 214

many times within each stage.
Use Case Based Requirements:-Some (2005) defines an approach using Use
Cases along side a number of domain models 'Class diagrams' to provide a
formalisation of the requirements engineering process. This has been carried
out to improve the link between customer need and the system design and
implementation.
CORAS:-The CORAS project (Vraalsen et al 2004) applied the UML to risk
analysis of security-critical IT systems and provides a tool-supported
methodology for model-based analysis. This tool has been designed to apply
across all development activities.
From these examples it is reasonable to conclude that the UML is accepted
across the IT/IS domain as a tool which provides a level of formalisation and
consistency which is not inherent in other system definition tools.
4.2.2 Application by IndustryThis section provides a number of non-IT/IS applications of the UML. For
each example it describes how the UML has been used to aid in formalisation,
consistency and communication.
The first of these areas is defence where, with so many organisations
contracting for and supplying equipment, a clear consistent approach to
communication and system definition is imperative.
Page 62 of 214

Organises ►
Architecture
DesignRequirements
Implementatior
Testing
DevelopmentApplicationMODAF
Application Company A
Life Cycle Model
Life Cycle Concept
Deployment/Commissioning
ApplicationModeling
framework
Process Definition Software
Development Process Definition
Figure 4-5 - UML Defence Usage view
It can be seen from Figure 4-5 that three defence applications have been
considered. These applications apply to different aspects of the development
and Life cycle concepts the main points from each are detailed below.
Company A:-Company A uses the UML to define its life cycles and processes.
When following the processes for system development all relevant information
and artefacts are also developed and delivered through the medium of UML.
This company is doing this to improve its Systems Engineering capability. It
sees the use of the UML as providing consistency and formalisation to the
work they are carrying out.
MODAF:-MODAF (2007) provides an Architectural framework for the UK
Ministry of Defence (MOD). This framework is used to format information
which in turn supports communication between the MOD and its suppliers.
The MOD have suggested that the UML and SysML can be used to deliver a
number of the views within the framework due to the level of formalisation
offered by the UML.
Modeling framework:-Nicola et al (2007) discusses the Conceptual Modeling
Framework-Ontology, this discussion is included as a chapter in the book
Enterprise Engineering
Page 63 of 214
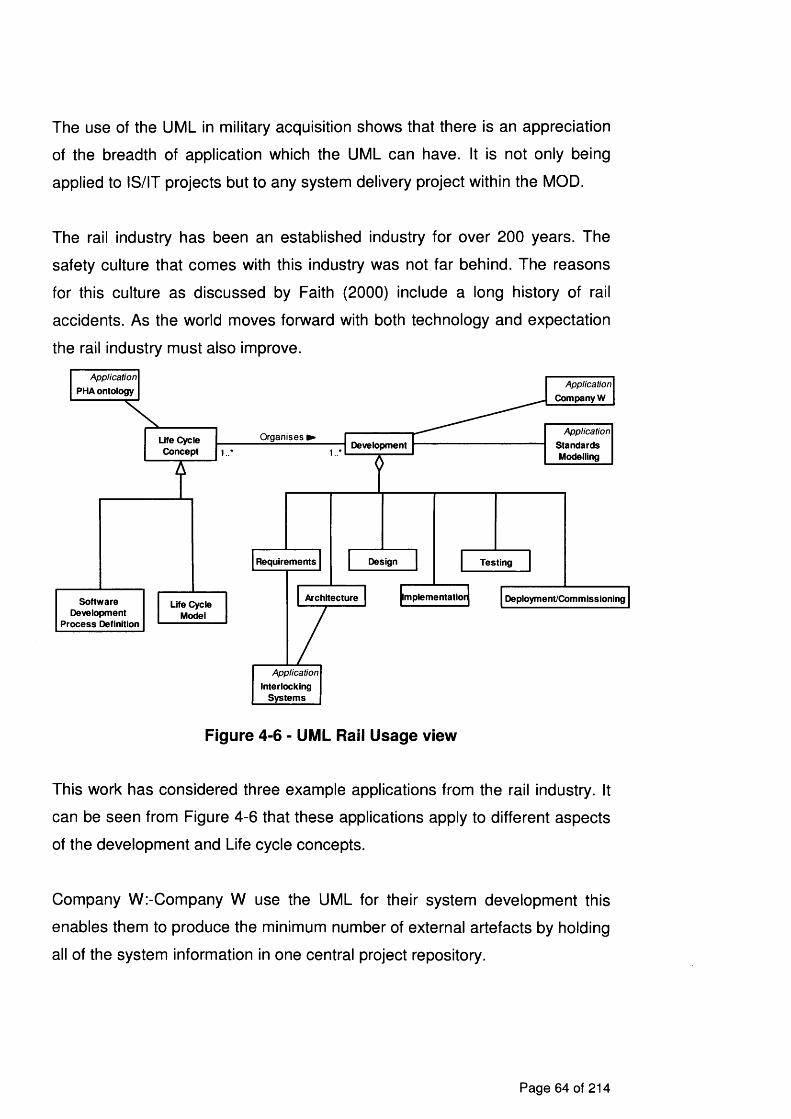
The use of the UML in military acquisition shows that there is an appreciation
of the breadth of application which the UML can have. It is not only being
applied to IS/IT projects but to any system delivery project within the MOD.
The rail industry has been an established industry for over 200 years. The
safety culture that comes with this industry was not far behind. The reasons
for this culture as discussed by Faith (2000) include a long history of rail
accidents. As the world moves forward with both technology and expectation
the rail industry must also improve.
Organises ►
Architecture
DesignRequirements
Implementatior
Testing
Development
Application Company W
Application PHA ontology
Life Cycle Model
Life Cycle Concept
ApplicationInterlocking
Systems
ApplicationStandardsModelling
Deployment/CommissioningSoftware Development
Process Definition
Figure 4-6 - UML Rail Usage view
This work has considered three example applications from the rail industry. It
can be seen from Figure 4-6 that these applications apply to different aspects
of the development and Life cycle concepts.
Company W:-Company W use the UML for their system development this
enables them to produce the minimum number of external artefacts by holding
all of the system information in one central project repository.
Page 64 of 214

Interlocking Systems:-Modelling Interlocking System Requirements in UML
(Bayley 2004). Interlockings are the safety system behind railway signalling.
Their purpose is to inhibit a situation where two trains could be in the same
place at the same time. Bayley discusses an abstract model of the European
Rail Traffic Management System (ERTMS) which can be simulated at the
requirements level. This work enabled communication through the
formalisation of the understanding of the ERTMS
PHA ontology:-Mazouni and Aubry (2007) uses the UML as a tool to define an
ontology for Preliminary Hazard Analysis (PHA). This provides terminology
which may be used to describe accident scenarios, risk calculation, severity
calculation and risk reduction.
Standards Modelling:-Barrow (2005) applies UML to the modelling of
standards to show the benefits that can be gained through a more formal
structure and common communications medium. In this example standards
modelling was applied to train activated warning systems and ERTMS.
The UML has been used in the rail industry to improve clarity, abstract
multiple views and improve communications with suppliers effectively
shortening supply time.
Science and education are aimed at formalisation, understanding and
teaching. Bloom (1956) made a large contribution to this when they developed
their taxonomy of education which sets out a number of levels of learning
along with learning domains.
Page 65 of 214

Organises ►
Architecture
Development
TestingDesign
Imptementatior
Requirements
Application Cell Biology
ProcessDefinition
Application Stum pi
Life Cycle Model
Life Cycle Concept
ApplicationCognitiveMapping
Deployment/Commissioning
Application Seven Views
Approach
Figure 4-7 - UML Science/Education Usage view
Four Science and Education applications of the UML and their associations
with the life cycle concepts and development activities can be seen in Figure
4-7. These applications apply to different aspects of the development and Life
cycle concepts the main points from each are detailed below.
Cell Biology:-Webb and White (2005) used the UML to develop models and
improve understanding of Cell biology
Cognitive Mapping:-McNellis (2005) used the UML to represent cognitive
mapping methods improving the consistency within the maps.
Seven Views Approach:-The seven views approach to process modelling
defined by Holt (2005) is adopted by the BSI as the best practice approach for
modelling processes. This approach, defined using the UML, provides a
formalisation and completeness to process modelling.
Stumpi:- Holt (2004) uses the UML to provide a tailored life cycle complete
with life cycle processes. This approach enables university students to
understand the importance of Life cycles and processes before carrying out
their degree projects following a defined life cycle model.
Page 66 of 214

4.2.3 Application OverviewWhen considering all the applications discussed in one view the breadth of
application, based on basic concepts, can be appreciated.Application
PHA ontology Application
StandardsModelling
Application
Company AApplication
CognitiveMapping
Application Application Company W
UML standard
ApplicationApplication
Modelingframework
Application Seven Views
Approach
applies ApplicationCORAS
Organises ► SoftwareDevelopment
Life Cycle Concept
Development O '
Application Stum pi
ProcessDefinition TestingDesignRequirements
Life Cycle ; Moaei
Application
The UnifiedSoftware
Development Process
Application Use Case Based _Reguirements_
ApplicationApplicationInterlocking
Systems
Application CeH Biologyand Software
Pfittorrw
Figure 4-8 - UML Developed Usage view
Figure 4-8 is based on only the applications from the four domains discussed,
however it provides an overview of the breadth of application of the UML in its
use as a formalisation framework. It has shown that the UML can be used to
define both terminology and approach.
The UML provides a multi view language based on the use of up to 13
different types of diagram. The diagrams are inter-related, the relationships
provide the ability to carry out consistency checks between diagrams enabling
confidence in the concepts defined to grow. Both views and consistency are
routed in an object oriented approach. Object orientation itself is not a concept
which has been defined to aid in software development. It can be traced to
Descartes thinking on human perception, well before software was
considered. The use of object orientation providing multiple views,
consistency and repeatability enables the UML to be used as a framework for
formalisation. The following sections describe the way in which the UML will
be applied to the visualisation and formalisation of ontology and process.
Page 67 of 214

4.3 Ontology Modelling
Examples of domain specific uses of the UML for defining ontologies have
already been shown in the applications above. What is required in this case is
an approach which in not related to domain.
IDEF 5 (1994) provides a generic approach to the definition of ontology using
its own schematic and elaboration languages. The schematic language within
IDEF 5 enables the definition of initial visual versions of ontologies however, it
provide a large number of detailed constructs which could be considered too
complicated for any initial version. The IDEF approach provides three
schematic views Classification, Object state and Composition along with
symbols which can be deployed onto the schematics. The main symbols are
Kind, Individual an instance of a kind, process and relationship it goes on to
define many types of relationship covering state relationships to physical
parts.
Others including Cranefield and Purvis (1999) have been investigating the use
of the UML as an ontology modelling language. Cranefields approach is to
use the UML to describe an ontology and compare this with the advantages
and dis-advantages of existing ontology representation languages used for
knowledge based reasoning. Cranefield uses UML class and object diagrams
to obtain what he describes as "both a highly structured model that could
support automated reasoning and an expressive language that it would not be
practical to attempt general-purpose reasoning wtih."
The approaches taken by Cranefield, use of class diagrams and IDEF5,
definition of kinds and relationships, can be abstracted to fulfil the generic
needs of defining an ontology, which is not focused on the use of automated
reasoning, using the UML.
Page 68 of 214
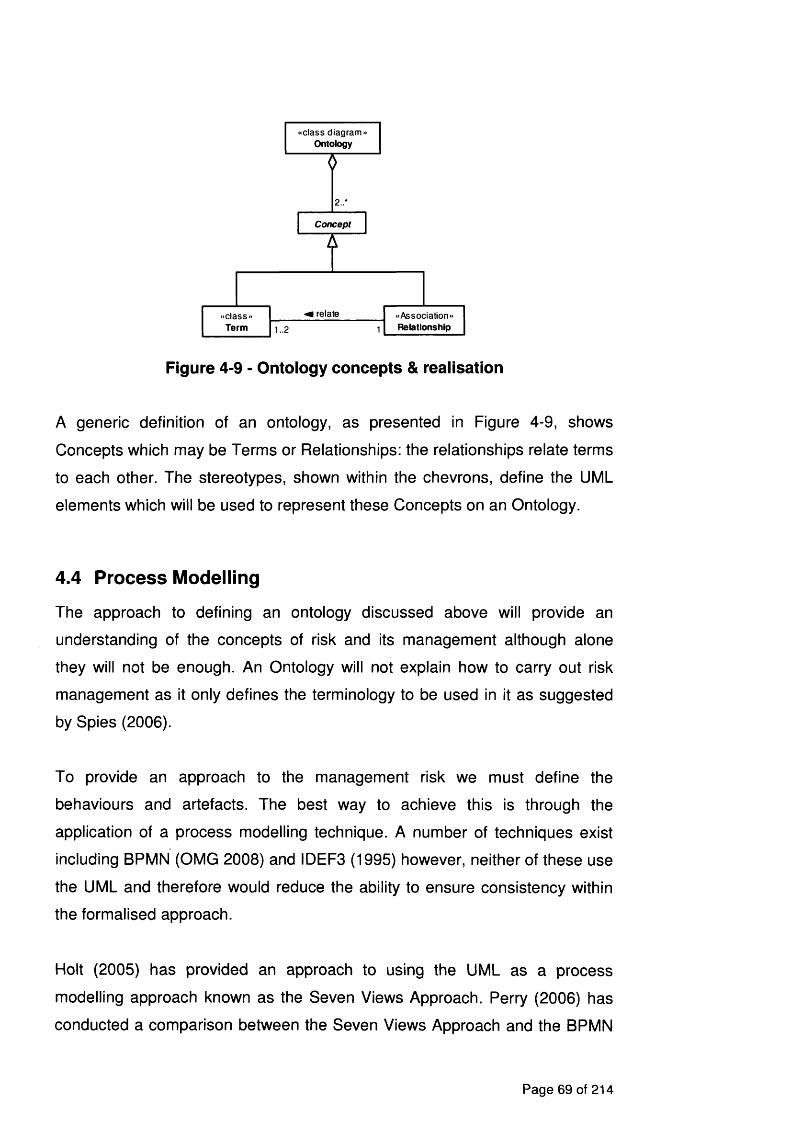
2 . .*
relate
Concept
:classTerm
« Association” Relationship
class diagram Ontology
Figure 4-9 - Ontology concepts & realisation
A generic definition of an ontology, as presented in Figure 4-9, shows
Concepts which may be Terms or Relationships: the relationships relate terms
to each other. The stereotypes, shown within the chevrons, define the UML
elements which will be used to represent these Concepts on an Ontology.
4.4 Process Modelling
The approach to defining an ontology discussed above will provide an
understanding of the concepts of risk and its management although alone
they will not be enough. An Ontology will not explain how to carry out risk
management as it only defines the terminology to be used in it as suggested
by Spies (2006).
To provide an approach to the management risk we must define the
behaviours and artefacts. The best way to achieve this is through the
application of a process modelling technique. A number of techniques exist
including BPMN (OMG 2008) and IDEF3 (1995) however, neither of these use
the UML and therefore would reduce the ability to ensure consistency within
the formalised approach.
Holt (2005) has provided an approach to using the UML as a process
modelling approach known as the Seven Views Approach. Perry (2006) has
conducted a comparison between the Seven Views Approach and the BPMN
Page 69 of 214

showing that the approach covers all of the views from the BPMN and
provides extras to ensure that a consistent model can be created.
This section will provide an overview and introduction to the Seven Views
Approach by presenting the concepts behind the approach and the way in
which it is realised in the UML.
4.4.1 Process ConceptsThere are three main concepts involved. The first is the Source, namely
where the process knowledge is held. Knowledge may be tacit or previously
recorded. The second Presentation; is the way the process is delivered to the
end user. The presentation may have to vary for users who have different
reasons for looking at the process. The third and possibly most important is
Understanding this is where the process knowledge is captured and
interpreted to develop a consistent and complete model of the process.Presentation |UnderstandingSource
is formatted according topresents
stakeholder's view oforganizesDocument TemplateProcess Document~~l Process ModelProcess Knowledge
describes purpose of
satisfies ^Requirements SetProcess
d( sc ibes
Section
Customer
Author User
Supplier
Stakeholder
Domain Expert
ProcessValidation
ProcessDescription
Figure 4-10 - Process Concepts View (Holt 2005)
The problem that occurs is the way that the Source and Presentation are
related. In most cases, the person who has the tacit knowledge of the process
records what they know and this record becomes the presentation. This is
where the Understanding becomes important, to fully understand the process
Page 70 of 214

knowledge one needs a model to organise the thoughts, this model must
explain why the process is needed and provide a clear and consistent
description of the process.
The realisation view further expands the description of the process; it also
relates the process modelling terminology to the concepts from the UML that
will be used to realise them. The main advantage to this approach is that it is
not relevant where one starts collating information. The fact that the
relationships have been navigated is the most important point about this
model as navigating the relationships ensures a complete and consistent
model for the process.
The realisation view provides the overview of the seven views along with a
number of the relationships which provide consistency when building up the
detail within the views.ProcessValidation
— T “Requirements Set
5
••use case diagram- Requirements View
••use case- Requirement
-actor-Stakeholder
■•sequence diagram- Process Instance View
5--------
ProcessDescription
definesstructure
•■class diagram- Process Comem
View
••class diagram- Process Structure View_____
••class diagra. Stakeholder View
-c lass-Stakehokter
1 ^ behaviour of -activity diagram »«class» Process BehaviourProcess View
-attribute- -operation-Arte fact Act vitv
1 .*•« produces/consumes
1..*
-object-Artefact
••swim Ian... Stakeholder
-life line- -activity invocation-Process Activity
••classInformal
diagra.. km View
)
1..*
-c lass-Artefact
Figure 4-11 - Process Realization View (Holt 2005)
A full picture of the process can be developed by producing these seven
views (Figure 4-11):
Page 71 of 214

The Requirements View presents the need for the process: this can be very
useful for checking whether a process is still relevant or requires updating as
the needs may change over time.
The Process Content View provides a static view of the process, it shows the
Process along with the Artefacts which are used and produced by the Process
and the Activities which use and create the Artefacts. This view can be very
useful in compiling a library of processes.
The Information View shows the relationships between the Artefacts within a
Process: it can also be used to show the relationships between Artefacts in
different Processes. This is very useful for understanding the documentation
required from the process and provides a powerful method of reviewing the
documentation to eliminate replication of documents, remove unused
documents and show documentation updates over time.
The Process Behaviour View is the view of the process which everyone
expects to see first and is the main view presented by BPMN (OMG 2008). It
shows the order in which the Activities are carried out, any decision points
within the process and where the Artefacts flow. It can also be used to show
the Stakeholder responsible for ensuring that the Activities have been carried
out.
The Stakeholder View presents the roles to be fulfilled in relation to the
process, these will be consistent with the Stakeholders on the Process
Behaviour View and Requirements View.
The Process Instance View is used to show the order in which the processes
can be run, from a theoretical point of view, or have been run, as a way to
record their execution on a project. Process Instance Views are also used in
the development of project plans ensuring that the project relates to the
processes which exist within an organisation.
Page 72 of 214

The Process Structure View shows the structure and terminology to be used
within a process for an organisation. It can also be used to show the
relationship between processes and life cycles.
In this work the basic structure shown in the diagram above will be used as
the Process Structure View meaning that a Process will always be made up of
Artefacts and Activities.
4.5 Conclusions
This chapter has discussed the breadth of application of the UML as a
formalisation tool, presented an ontology for risk, a set of definition mappings
to show the relationships between the ontology and existing standards and
shown an approach to process modelling.
The applications of the UML have shown both breadth of usage across the
IT/IS domain as well as three other industries, education, rail and defence. It
has also shown a depth of usage with some applications applying to the
whole development and others to specific aspects within. On the whole this
chapter has shown that the UML can be used as a formalisation tool in many
domains and as it provides a consistency within the language, improved
communication and reduction in complexity.
The objectives of this chapter were to discuss the requirements for a model
based framework for the formalisation of risk management and propose a
framework which fulfils the requirements.
This chapter has achieved these objectives by defining the needs of a
formalisation approach, selecting the UML as the formalisation framework,
showing that the UML can be used in many and varying applications and as
such is relevant for both ontology and process modelling, it has also
described the way in which the UML will be used to model both ontological
elements and processes. This work will continue by defining an ontology for
risk management using the UML as a definition medium.
Page 73 of 214

5 Ontology
5.1 IntroductionThe previous chapter selected the UML as an appropriate tool for the defining
ontology, taxonomy and processes. The literature review, Chapter 2, showed
the lack of consistency in terminology from national and international
standards.
The objective of this chapter is to use the UML to define risk and present an
ontology for risk management. This means defining the terms which can be
used in the context of their relationships to other terminology. This will be
achieved by firstly defining a risk and then widening the scope and
incorporating some of the wider terminology which is associated with a risk.
5.2 Risk DefinitionThe following section presents a formalisation of the terminology and
concepts of a risk, including a definition of a risk. Once defined this definition
of a risk will be compared with a number of definitions discussed in chapter 2
before presenting some advantages of this definition.
The section will be concluded with a description of an ontology for risk
showing the relationships between the terminology discussed.
providesprobability of
Risk
Chance to Occur Outcome
Figure 5-1 - Generic risk
This abstracted definition (see Figure 5-1) has been written to apply to any
situation or industry. In contrast most of those discussed in chapter 2 are
industry specific.
Page 74 of 214

The definition shows that for a risk to exist there must be a Chance to occur
and an Outcome. The Chance to occur provides the probability of the
Outcome occurring. The Outcome described refers to the unwanted event.
Outcome in many cases including Hollnagel (2008) and Aven and Kristensen
(2005) is used interchangeably with consequence.
This definition has been purposely kept simple and, more importantly,
singular. The singularity is to provide more clarity and consistency, if
discussing a risk then it must be one risk. It would be counter intuitive to then
refer to multiple outcomes in a risk. The Chance to Occur is also singular as it
is logical that there can only be one Chance to Occur for any one Outcome.
This singularity adds an orthogonal view when asking, have all outcomes
been considered. For all outcomes to have been considered the sum of all the
associated Chance to Occur must equal 1, assuming that Chance to Occur is
presented as a probability. This suggests that a set of risks will be collated
creating a 'Risk Set' which itself would need to be verified. A full investigation
into the verification of completeness of a 'Risk Set' is beyond the scope of this
work.
Risk Set1 . . *
Risk
IChance to Occur
provides probability of
providePerceptionclassification
Outcome
shows the severity of the
▼
Figure 5-2 - Risk Composition
Once a risk has been defined it is possible to apply a Classification to the
Outcome. Classification in most cases is related to the idea of the severity of
the Outcome when considering people and injuries, classifications are likely to
include Insignificant, Marginal, Critical and Catastrophic. Classifications such
as these are often related to the effect on people or a system and tend to
focus on industry specific issues Kristensen et al (2006) discusses a number
Page 75 of 214

of classification schemes. Where people are concerned classification is rarely
the only consideration it may also be necessary to understand stakeholder
feelings towards the Outcome and Classification these feelings are known as
the Perceptions.
Perceptions may help to define classifications but are one of the most
dangerous aspects to understanding and treating risk; a perception is a view
of the severity of the outcome from a specific stakeholder's understanding,
this is discussed in depth by Belzer (2001) in his paper on grin and bear it
practices in risk management. Perception is the focus of Pezzullo and De
Filippo (2009) paper on emergency management in Hazmat logistics and is
alluded to by Clarke (2007) when discussing probabilistic and possibilistic risk.
Risk O -
IChance to Occur
providesprobabilityoi
Outcome
INegative
“ 5“
Critical
Non Safety Critical
IRnance Business
shows ! the
severity of the
Positive
Classification
Non Critical
Safety critical
I may provide
Perception
Figure 5-3 - Taxonomy of Outcomes
One approach to categorising systems and the types of risk that relate to
them is to categorise the outcome (Figure 5-3)
Page 76 of 214

• Firstly is the outcome positive or negative? Most will no longer consider
an outcome to be part of a risk once they have established that this
outcome will benefit them. Hessami (1999) considered this in his paper
on Risk a missed opportunity? Also Flage and Aven (2009) discuss the
need to balance positive and negative outcomes through the use of
portfolios.
• Once it has been defined as negative - is it critical or non-critical? Again
non-critical outcomes tend to be forgotten.
• For critical outcomes is there a safety implication? This is where most
start to consider outcomes as risks it is also the point at which most
standards begin.
In many areas critical systems or safety critical systems are discussed. In
these cases it is the Classification of the Outcome which is being used to
select the category of risk. In many cases the category will then be
transposed onto the name of the system to highlight possible outcomes and
therefore the need for a more rigorous approach to the system definition and
development.
One problem here is that in many instances there is no differentiation between
the categorisation of a system and the classification of an outcome.
Classifications may be assumed due to the categorisation of the system.
There is a need to be consistent about classification and categorisation of
risk.
• Classification - relates to severity of outcome
• Categorisation - relates to the separating out types of outcome i.e.
financial, marketing etc.
Page 77 of 214

System O - Risk O -
Chance to Occurprovidesp ro bab ilityof severity
of the
INon safety
critical
Negative
Critical
I
Non Safety Critical
T
Safety Critical Safety critical
, m ay provide
Perception
Figure 5-4 - System vs Outcome
This diagram (Figure 5-4) has also linked these categorisations of the
outcome to terminology which is used to describe systems - it must be
remembered that there is no hard and fast rule as to how a system and an
outcome are related, the words are generally used interchangeably and
hence, one should be extremely careful with their use.
5.3 Associated TerminologyThe following defines relationships between risk and some of the broader
terms which are often associated and sometimes confused with risk.
5.3.1 Causal terminology
This work has not set out to define all of the terminology associated with risk.
However, there are concepts which need to be considered to ensure the
scope of risk management can be understood, hazard is one of those terms, it
has been used here to group the terms from chapter 2 which cover the idea of
events leading up to the occurrence of an Outcome.
Page 78 of 214

provides probability ofleads to ►
relates to probability of
OutcomeHazard
Risk
Chance to Occur
Probability of occuring
Stimulus
Scenario probability
Causal Scenario
Figure 5-5 - Causal analysis
There are many ways to consider stimuli which precede the outcome defined
in this work these will be called Hazards, Figure 5-5. The diagram also shows
that the relationship between the Hazard and the Outcome is via Causal
Scenarios, the fact that this is a scenario means that there could be many
hazards leading up to the Outcome and it is important that these are recorded
as they will be required for both causal analysis and definition of mitigations.
The two salient points to be remembered about hazards are that they must be
recorded and they must happen before the outcome, the Effect will happen
afterwards, this is characterised by the bow tie model (Delvosalle et al. 2005).
Page 79 of 214

5.3.2 Consequence TerminologyConsequences or effects are all of the things that happen or need to happen
after an Outcome has occurred.
provides probability of has an ►
relates to the probability of
Effect
Effect Scenario
Outcome
Risk
Chance to Occur
Figure 5-6 - Effect Analysis
Effect analysis is in essence opposite to the Hazard or causal analysis. It
provides an understanding of what happens after an outcome has occurred
Figure 5-6. Again it is important to record effects as they will, for those
Outcomes which can't be removed, become the basis for the policies and
procedures acting as mitigation.
5.4 M appings
As discussed in Chapter 2 there are already many definitions of risk; any new
definition will need to have a justifiable difference. The difference in this case
is that using the UML as a common language highlights similarities and
contrast across existing standards and approaches enabling a dialogue to be
held between risk experts in different industries. It may also provide a
common base knowledge of risk before specialising in one area. This section
presents four mappings between the definitions presented in this chapter and
those discussed in chapter 2.
Mappings will be separated in to those which map directly to the definition of
risk and wider mappings to the associated terminology. The mappings will
highlight the differences between the terminology within the definitions which
Page 80 of 214

had previously been considered to be commensurate.
5.4.1 Definition mappingsThe definitions which have been mapped include financial, project and
technical. The technical definitions cover both safety and non-safety
categorisations.
Rnancial Generic definition
Risk
Asset System
Return Outcome
Classification
Risk
Perception
Chance to OccurDegree of uncertainty
against
Figure 5-7 - Financial
Two direct mappings can be made from the financial definition, taken from
Harvey’s financial glossary (Harvey 2002), to the generic definition, there is
also a mapping to the wider concepts, Figure 5-7; direct mappings are
between:
• Degree of Uncertainty and Chance to Occur,
• Return and Outcome - Return is the only outcome that the financial
definition is concerned with.
The wider mapping is between:
• Asset and System - System has been added from the wider model to
show the relationship to Asset. The concept of an asset has not been
included in the generic definition in this way as it suggests ownership
related to the outcome where other definitions may be concerned with
Page 81 of 214

Outcomes relating to people or property which isn't owned.
This mapping shows some interesting points regarding the financial definition
of risk, firstly the sector has included the Outcome that it is concerned about
in its definition. This means in terms of the generic definition that there is only
ever one outcome to be considered and that is Return. Secondly the definition
includes the system, this focuses the view to be taken of the system to purely
financial, although this isn't a problem in the financial sector but would be for
example in the railways where the safety consideration is key.
Project
Project
that can affect prospect of achieving
contingencyUncertainty inherent in
plans
Possibility of something happening
Generic definition
Perception
Classification
Outcome
Aleads to
Chance to Occur
Figure 5-8 - Project
Two direct mappings are possible between the project related risk definition,
taken from BS6079 (BSI 2000), and the generic, there is also one wider
mapping, Figure 5-8; direct mappings are:
• Possibility of Something Happening to Chance to Occur and
• Goals to Outcome
The wider mapping is between:
• Uncertainty Inherent in Plans and Hazard - in this case Hazard has been
included from the wider model to show the relationship of Uncertainty to
the causal effects of risks.
The fact that hazards are included in the definition shows that there is a
Page 82 of 214
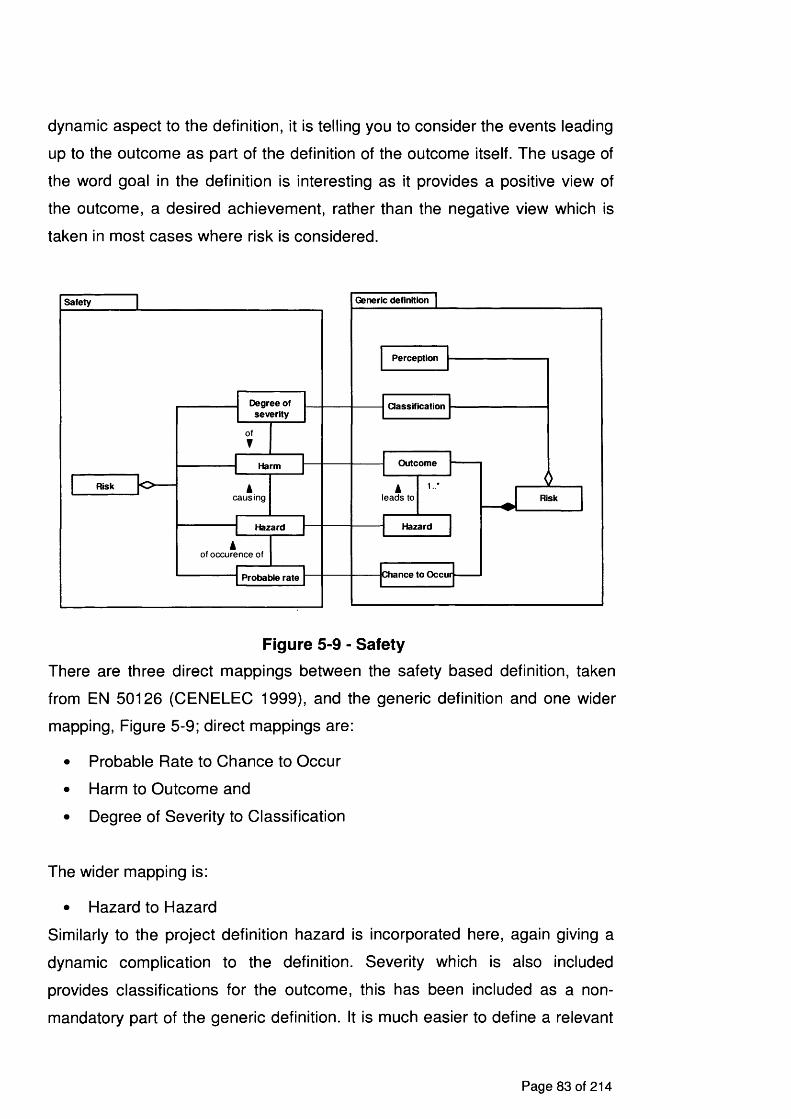
dynamic aspect to the definition, it is telling you to consider the events leading
up to the outcome as part of the definition of the outcome itself. The usage of
the word goal in the definition is interesting as it provides a positive view of
the outcome, a desired achievement, rather than the negative view which is
taken in most cases where risk is considered.
Generic definitionSafety
Risk
Probable rate
Harm
Hazard Hazard
Risk
Outcome
Perception
Chance to Occur
leads to
of occurence of
causing
Figure 5-9 - SafetyThere are three direct mappings between the safety based definition, taken
from EN 50126 (CENELEC 1999), and the generic definition and one wider
mapping, Figure 5-9; direct mappings are:
• Probable Rate to Chance to Occur
• Harm to Outcome and
• Degree of Severity to Classification
The wider mapping is:
• Hazard to Hazard
Similarly to the project definition hazard is incorporated here, again giving a
dynamic complication to the definition. Severity which is also included
provides classifications for the outcome, this has been included as a non
mandatory part of the generic definition. It is much easier to define a relevant
Page 83 of 214

set of classifications within a well established industry, however if setting out
on a risk management exercise for the first time it is unlikely to add value to
the initial work.
Non-safety Generic definition
Effect
RiskHazard
Risk
Classification
Perception
Outcome
Chance to OccurFrequency or probability
Hazadousevent
Occurence and consequence
leads to
has an
specified
Figure 5-10 - Non-safetyThere are two direct mappings and one mapping to the wider concept when
considering a non-safety based risk taken from BS8444 (BSI 1996), Figure
5-10. The two direct mappings are between:
• Frequency or Probability and Chance to Occur and
• Occurrence and consequence and Outcome - this is only a partial
mapping as the Non-safety definition also relates to the effect of the
Outcome after it has occurred.
• Occurrence and consequence and Outcome - maps specifically to the
consequence element.
The wider mapping is between:
• Hazardous Event and Hazard.
This definition considers both the hazards and the effects of the outcome
which makes a risk something almost impossible to consider as it includes all
possible pre and post scenarios. This definition is closer to a definition of risk
analysis rather than risk.
Page 84 of 214

5.4.2 Mapping considerationsMany of these definitions have inherent time considerations within them,
these are generally seen through the use of the term 'Hazard' or
'Consequence' which focus the reader on the pre-ceding and post outcome
happenings. The definition presented here has removed this time
consideration from the basic risk definition to focus the reader on the main
issue the problem outcome. Obviously timing is still important and will be
incorporated through relationships with the wider terminology and
implementation of the associated processes.
Hazard has come up a lot in the mappings but does not play such a central
role in the definition of a Risk, this work has chosen to eliminate the
complexity of timing within the definition of Risk, hence the relationship to
hazards which can then be investigated through causal evaluation.
There is still an unresolved issue with the term 'hazard' which may need to be
replaced with a more general term which does not imply a negative. In many
situations there is a level of synergy between hazard and risk which needs to
be investigated further but is outside the scope of this work.
Page 85 of 214

5.5 Risk OntologyHaving defined the terms within risk and the relationships to surrounding
terms this final diagram, Figure 5-11, relates the terms already discussed to
the concepts within the processes and can be considered as a generic
ontology for risk.
System
0
Risk Set O
1..*
Risk1 *
T
Chance to Occur
provides probability of
relates to probability of
Classification
I s hows the severity of the
, may provide
Perception
leads to ►Outcome
has an ►i 1 *
Causal Scenario
EStimulus
Effect
relates to the probability ofEffect Scenario
Figure 5-11 - Risk Ontology
A clear definition of terminology of risk including the relationships between the
terms is imperative. Without understanding these relationships it is impossible
to consistently discuss or manage risk. When compared with the Risk sub
model within the OMG quality of service and fault tolerance profile for IT
(OMG 2008b) discussed in Chapter 2 this provides a clear and usable set of
terms and relationships which for risk for any industry or application.
Page 86 of 214

5.6 ConclusionsThe objective of this chapter was to define risk and present an ontology for
risk management.
Using the UML as a formalisation tool this chapter has presented a generic
definition of risk and placed it within an ontology for risk management. The
ontology provides the relationships between the definition and associated
terminology.
The ontology is central to understanding relationships between other risk
standards, to aid with this understanding mappings have been developed
between the generic risk definition and the standards discussed in chapter 2.
From these mappings a number of salient points were highlighted including
the over complication of the definition.
The chapter has also shown mappings between the definition of risk
discussed here and definitions discussed in chapter 2, this has enabled
further clarity and questioning of the meanings of terminology from specific
industries and how they relate to each other.
Understanding the terminology and ontology of risk and risk management
provides a good grounding enabling a clearer expansion across the risk
domain. Mappings further support detailed industry specific approaches by
enabling recognition and supporting the understanding of relationships
between generic and industry specific ontologies. However, this work can not
stop at terminology - without a consistent approach to the management of risk
the terminology and ontology will be of use for discussion but serve no
purpose in practical application.
This work will continue by providing a formalisation of the risk management
approach and methodology using the UML and the seven views approach.
Page 87 of 214

6 Processes
6.1 IntroductionChapter 5 presented an ontology for risk, formatted through the use of the
UML, presenting the terminology of risk management. It highlighted that this
terminology although useful in its own right can not be used without processes
to realise it.
The purpose of this chapter is to define the processes required to carry out
risk management using a multi-view approach. This will be achieved by using
the 'Seven Views Approach', discussed in chapter 4, to define the processes,
behaviours, information and methodology for risk management. The chapter
presents the six risk management processes defined by this work. After
defining the processes a guide is given as to the expected outputs of the
processes.
6.2 Process Formalisation
This section presents the Requirements View, Process Content View and
Information View giving an overview of the all of the processes, it also
presents the Process Behaviour View for three of the processes; that of
Concern Identification, Risk definition and Evaluation. It is expected that these
processes will be implementable within the framework proposed by the draft
ISO 31000 Risk management - Principles and guidelines on implementation.
Page 88 of 214

6.3 Requirements View - Risk Management RequirementsThe Requirements View provides an understanding of the things that need to
be done to manage risk and the things that need to be understood.
Risk Management Requirements
Improveenterprise Understand
contextRecord
information ... structure
: constrainsconstrains ... behaviourgorfstrains
Understand system ...
i-<£L" " "^constrainsManage risk Identify risk
in c lu d e '~ ■•'VOrganisation include^Define risks
Calculate risk values
include;include:
incl\jdi
Analyse r is k ...
... causesControl/mitigate . risk
... effects
Figure 6-1 - Risk Management Requirements
Once it has been stated it is obvious that defining, analysing and controlling
risk are things that must be completed to manage risk. However, the
recording of such a fundamental concept of ’why this is being carried out' can
often be missed BPMN (OMG 2008a) for example does not provide the ability
to record why a process is being carried out. It is also easy to miss or forget
those things which need to be understood; it is the act of recording them
which provides focus.
The diagram above (Figure 6-1) provides a view of the reason for carrying out
Risk Management in this case it is to improve an enterprise. In other
situations it may be for health and safety, project planning or financial
reasons. With an understanding of why risk management is being carried out
the context in which it is being applied must also be considered. The context
Page 89 of 214

will ensure that the risk management has the right focus e.g. the risks to be
considered are mostly related to people, technical or marketing questions.
6.4 Process Content View - Risk ProcessesThe Process content view provides a static representation of the processes
showing the activities to be carried out and the artefacts to be produced or
consumed.
System Modelling
System model Tailored context Source
Select system model() Enhance system model()
Risk Process
IRisk Definition
System model Tailored context Concern list Risk list
Assess concern()Define outcome()Define chance to occur)) Define classification() Define perspective() Formalise list()
Evaluation
Tailored context Risk listEvaluation outcome System model
Select risk()Select Context/system model() Evaluate within current context() Formalise evaluation))________
Context ID Concern IDGeneric context Tailored context Source
Concern list System model Tailored context
Select generic contextQ Tailor context()
Elicit context concerns()Elicit system model concerns() Form alise concerns))
I
Risk Treatment
Evaluation outcome System model Suggested mitigation Tailored context
Categorise evaluation() Develop mitigation()
Cause Evaluation Effect Evaluation
::Evaluation ^.EvaluationTailored context Tailored contextR isk lis t Risk listEvaluation outcome Evaluation outcomeSystem model System model
::E valuation ■.-.EvaluationSelect risk)) Select risk))Select Context/system model)) Select Context/system model))Evaluate within current context)) Evaluate within current context))Formalise evaluation)) Formalise evaluation))
Figure 6-2 - Risk Processes
This approach to the definition of risk management processes has provided a
set of processes, Figure 6-2, rather than the single process provided in most
standards. This use of multiple processes each used as and when required
enables a more flexible and realistic approach to risk management. It means
that one process, Concern ID for example, could be used multiple times whilst
the Risk Definition process may only used once.
A brief overview of each process is given here before the behavioural view for
each process and overall information view are presented.
Page 90 of 214

Context ID:-This presents and discusses the contexts, the needs and scope,
associated with an entity such as a company. These contexts provide the
different points of view from which risk can be understood. They also show
the relationships between different contexts.
System Modelling:-This retrieves or provides the relevant system models,
these may be static or behavioural. The system models must relate to the
relevant contexts.
Concern ID:-This process provides hazard, risks, causes, outcomes or
worries based on context and system models. The use of context and system
models to identify concerns provides a repeatable approach without relying on
tacit knowledge.
Risk Definition:-This process is used to provide as much detail regarding a
risk as possible this may include applying assessment techniques providing
knowledge and detail of the risks.
Evaluation:-The Evaluation process applies a risk to the contexts being
investigated this will provide an understanding of the risk on the system or the
system on the risk.
Cause Evaluation:-The Cause evaluation process applies a risk to the
contexts being investigated to provide an understanding of the effect of the
system on the risk. i.e. it is looking backwards or into the system to see what
in the system will cause or affect the outcome before it has happened.
Effect Evaluation:-The Effect evaluation process applies a risk to the contexts
being investigated providing an understanding of the effect of the risk on the
system, i.e. it is looking forward to see what happens in the system after the
outcome has occurred.
Risk Treatment:-This process enables the decision as to whether any
mitigation is necessary or to be considered. Once this has been agreed it
provides possible mitigations for evaluation.
Page 91 of 214

Having defined the purpose of each process the behaviour also needs to be
defined showing who the process is achieved.
6.4.1 Context Identification ProcessThis presents and discusses the contexts associated with any entity. These
contexts provide the different points of view from which risk can be
understood. They also show the relationships between different contexts.
There are a number of points to remember when defining contexts firstly, and
this goes for all of the processes, they don't have to be finished at the end of
the first run through the process - the process can and should be run again to
add detail to the information. In addition to ensure that the contexts do not
become over complicated it is worth applying Miller's magic number (Miller
1956) for both the number of contexts and the needs defined within.
Requirements engineer
Source
.Generic Context
Tailorcontext
(Context ID::)
:Tailored Context
Select generic context
(Context ID::)
Figure 6-3 - Context ID
• Select generic context - Selecting Generic contexts may be achieved
through the review of context libraries. In the case where sufficient
knowledge of the domain exists this activity may create a list of the context
names to be fully defined later.
• Tailor context - Tailoring a context defines the boundary, stakeholders and
internal needs of a viewpoint. This tailoring relies on the ability to focus on
Page 92 of 214

the development of needs from a specific point of view. In the situation
where contexts already exist this activity may only be a check to see that
the contexts are still applicable. Where there is in-sufficient domain
knowledge it is preferable to define a simple set of needs to be improved
later when more information will be available.
6.4.2 System Modelling Process
This retrieves or provides the relevant system models, these may be static or
behavioural. The system models must relate to the relevant contexts.
This process has not been defined to re-develop any system models that may
exist, but to ensure that the benefit of re-use is gained in as many areas as
possible existing models should be used and further developed where they do
not provide sufficient detail in the area of focus.
System modeller
System Model
Source
Tailored Context
Select system model
(System Modelling::)
Enhance system model
(System Modelling::)
Figure 6-4 - System Modelling
• Select system model - The activity identifies the relevant models from the
Source for specific Tailored Contexts. This activity is based on the premise
that a system model will already exist for the defined contexts, for a
system it may be the architecture or behaviour, for a company it could be
Page 93 of 214
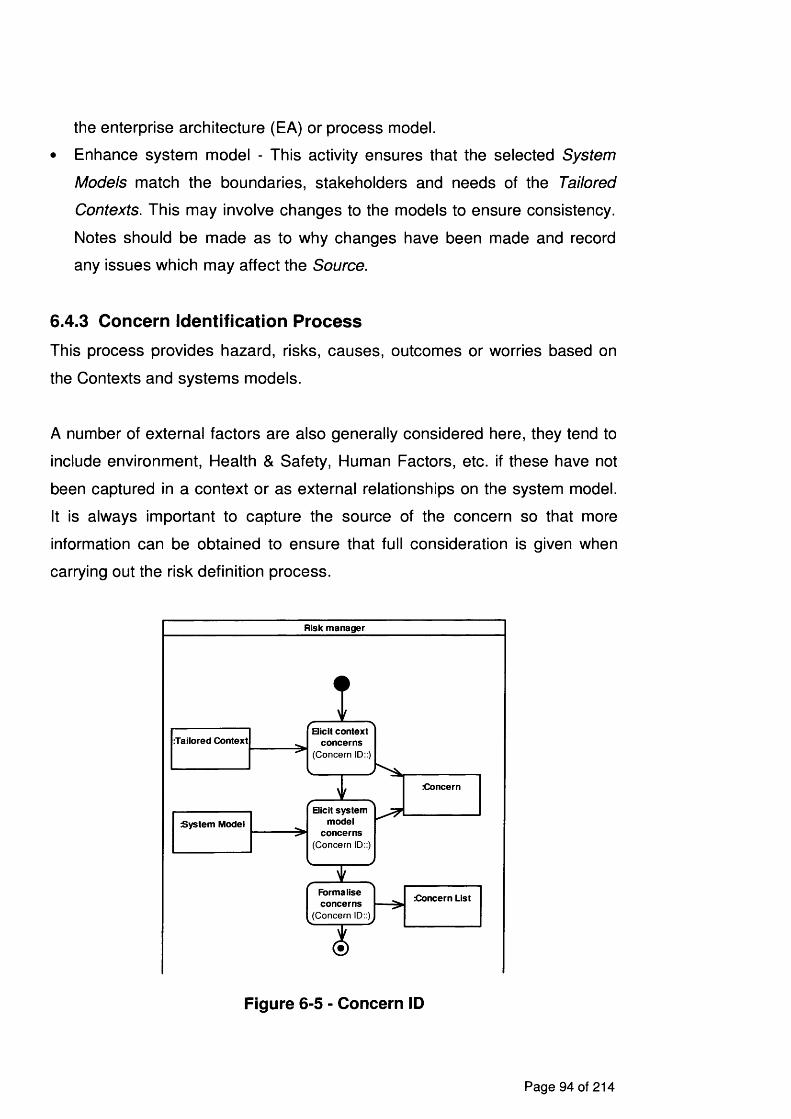
the enterprise architecture (EA) or process model.
• Enhance system model - This activity ensures that the selected System
Models match the boundaries, stakeholders and needs of the Tailored
Contexts. This may involve changes to the models to ensure consistency.
Notes should be made as to why changes have been made and record
any issues which may affect the Source.
6.4.3 Concern Identification ProcessThis process provides hazard, risks, causes, outcomes or worries based on
the Contexts and systems models.
A number of external factors are also generally considered here, they tend to
include environment, Health & Safety, Human Factors, etc. if these have not
been captured in a context or as external relationships on the system model.
It is always important to capture the source of the concern so that more
information can be obtained to ensure that full consideration is given when
carrying out the risk definition process.
Risk manager
Formaliseconcerns
(Concern ID::)
Concern List
Tailored Context
System Model
Elicit context concerns
(Concern ID::)
Elicit system model
concerns(Concern ID::]
Figure 6-5 - Concern ID
Page 94 of 214

• Elicit context concerns - During this activity any concerns based on the
Tailored Contexts are identified, the Concerns may be linked to conflicting,
missing, additional or unfulfilable needs. At this point a concern need not
be a risk or a problem it can be any question that someone wants to ask
about the system and although it would be preferred that it is based on the
Tailored context or System Model this isn't a pre-requisite, other questions
may in-turn provide improvements to the Tailored contexts or System
Models.
• Elicit system model concerns - During this activity any concerns based on
the System Models are identified, the concerns may be linked to parts of
the system, communications within the system or the behaviour of the
system. This could be as detailed as to question every relationship,
attribute and behaviour.
• Formalise concerns - During this activity the concerns identified within the
other activities will be recorded formally, this means that they must be
named, numbered, referenced and described.
6.4.4 Risk Definition ProcessThe Risk Definition process is used to define risks and provide as much detail
regarding each risk as possible this may include applying assessment
techniques providing knowledge and detail of the risk.
It is important to note that this process has been defined to look at the risk
from a static point of view, the inclusion of dynamics will be considered when
carrying out the evaluation process.
Page 95 of 214

Risk Analyst
[NotRisk]
Risk]
Defineperspective
(Risk Definition::)
Define outcome(Risk Definition::) [More
Concer i]
Define chance to occur
(R isk Definition::)
:Concern
.Tailored Context
System Model
Formalise list(Risk Definition::)
:Risk List
Defineclassification
(Risk Definition::]
Assess concern(Risk Definition::)
Figure 6-6 - Risk Definition
• Assess concern - During this activity each concern is reviewed and
categorised. The main category of interest is Risk i.e. this concern can be
considered to be a Risk. Other categories may be Hazard or Effect these
could be used to signify the need to consider these concerns when
carrying out the evaluations. A concern will be selected as a risk if it can
be shown to be one of the main areas for concern. It would be nice to
make this more scientific however this doesn't seem possible at the
moment due to the wide variety of systems and organisations to which
these processes may be applied.
• Define outcome - During this activity the outcome associated with the Risk
will be identified and recorded. This may required the use of a tool or
technique aimed at the identification of outcomes.
• Define chance to occur - During this activity the Chance to Occur of the
Page 96 of 214

Outcome will be calculated and recorded. This is likely to require the use
of an assessment technique aimed at the definition of probability, it may be
possible to choose an assessment technique from those referenced in
Chapter 2. In some cases the Chance to Occur will be very difficult or
expensive to calculate, in these cases there is a tendency to let the
classification or perception lead rather than having a full definition. This in
itself can be dangerous, however the values will depend on the
assessment technique employed.
• Define classification - During this activity the classifications of the Risk will
be identified and recorded. Classification are discussed in the generic
definition of risk in chapter 2 however, specific classifications relevant to
the situation may need to be developed. The classifications are defined as
part of the generic risk terminology.
• Define perspective - During this activity the perspective of different
stakeholders related to the Risk will be identified and recorded.
Understanding the perspective of a stakeholder or stakeholder group is a
subject in its own right and has been discussed by many including Belzer
(2001) in his paper on grin and bear it practices in risk management and
alluded to by Clarke (2007) when discussing probabilistic and possibilistic
risk.
• Formalise list - During this activity the information defined relevant to each
risk will be recorded formally, this means that as much of the information
as possible is complete and at a minimum each risk must be named,
numbered, described and have an Outcome and Chance to Occur.
6.4.5 Evaluation ProcessThe Evaluation process applies a risk to the contexts under investigation
providing an understanding of the risk on the system or the system on the
risk.
This process has been defined with two specific types in mind, causal
evaluation and effect evaluation. Causal evaluation provides consideration of
all the events that occur leading up to the occurrence of the outcome. Effect
Page 97 of 214

evaluation provides the ability to consider the events that occur after the
outcome, this may include exit procedures, notification of emergency services
and clean up.
As the process for each, cause and effect, is the same other than the focus of
pre-ceding or following events the overall process of evaluation will be
described.
Risk Analyst
:Risk
Tailored Context
System Model
[More conte to assess]
Select risk(Evaluation::)
Select Context/system model
(Evaluation::)
Evaluate within current context
(Evaluation::)
Formaliseevaluation
(Evaluation::)
:EvaluationOutcome
Figure 6-7 - Evaluation
• Select risk - This activity chooses the Risk to be evaluated from the Risk
List
• Select Context/system model - Selects a context and relevant system
model within which the Risk will be evaluated. This is to ensure that the
relevant evaluation is carried out, there is no point in carrying out a
financial evaluation for a technical Risk before the technical evaluation has
been carried out.
• Evaluate within current context - This activity applies the risk to relevant
scenarios from the context to the system model. This will be carried out in
Page 98 of 214

conjunction with the use of any specific techniques identified. The result of
the activity will be an increased understanding of the relationship between
the risk and the system. This activity is defined as 'current context' as once
evaluated for one context it is possible to follow the relationships between
contexts and apply the Evaluation Outcome to the next context. This also
provides an approach to effect analysis.
• Formalise evaluation - This activity ensures that a full record of the effect
of a risk on a context has been kept.
Due to the use of tailoring applied to this process the cause and effect
evaluation processes have not been described individually an example of
each analysis is shown in section 6.7. The relationship between cause and
effect is also investigated by Restrepo et al (2008) whilst understanding how
different causes of accidents are associated with consequence measures.
6.4.6 Risk Treatment ProcessThis process enables the decision as to whether any mitigation is to be
considered. If it is agreed that mitigation is required then the process provides
Suggested Mitigations for evaluation.
It is important to remember that the development of mitigations may be
projects or programmes in their own right, this process is designed to be a
place holder to ensure that the relevant projects are developed in response to
the risks and their evaluation. However, this does not mean that all project
developments should relate directly back to risks or their treatment.
Risk Treatment in this manner could be considered to be the art of System
Engineering in practice. Using the information gathered and derived through
all of the other processes as a basis will provide all of the inputs to a standard
Systems Engineering approach. It is important to ensure that treatments aren't
defined for there own sake and remember that some risks can not be
removed.
Page 99 of 214

Systems Engineer
[No mitigation required]
[Mitigation required^ j
SuggestedMitigation
System Model
fvaluationOutcome
Tailored Context
Categoriseevaluation
(Risk Treatment::)
Developmitigation
(Risk Treatment::]
Figure 6-8 - Risk Treatment
• Categorise evaluation - This enables the evaluation to be assessed
effectively deciding whether the Risk is undesirable enough to require
action to stop it occurring or reduce the effect.
• Develop mitigation - This activity allows for the development of mitigations
to the risk, mitigations are changes to the current system that reduce or
remove causes and effects of the Risk. The development of a mitigation
may require anything from 5 seconds thought to a full system
development, in some cases this could mean the creation of a new
organisation.
Page 100 of 214
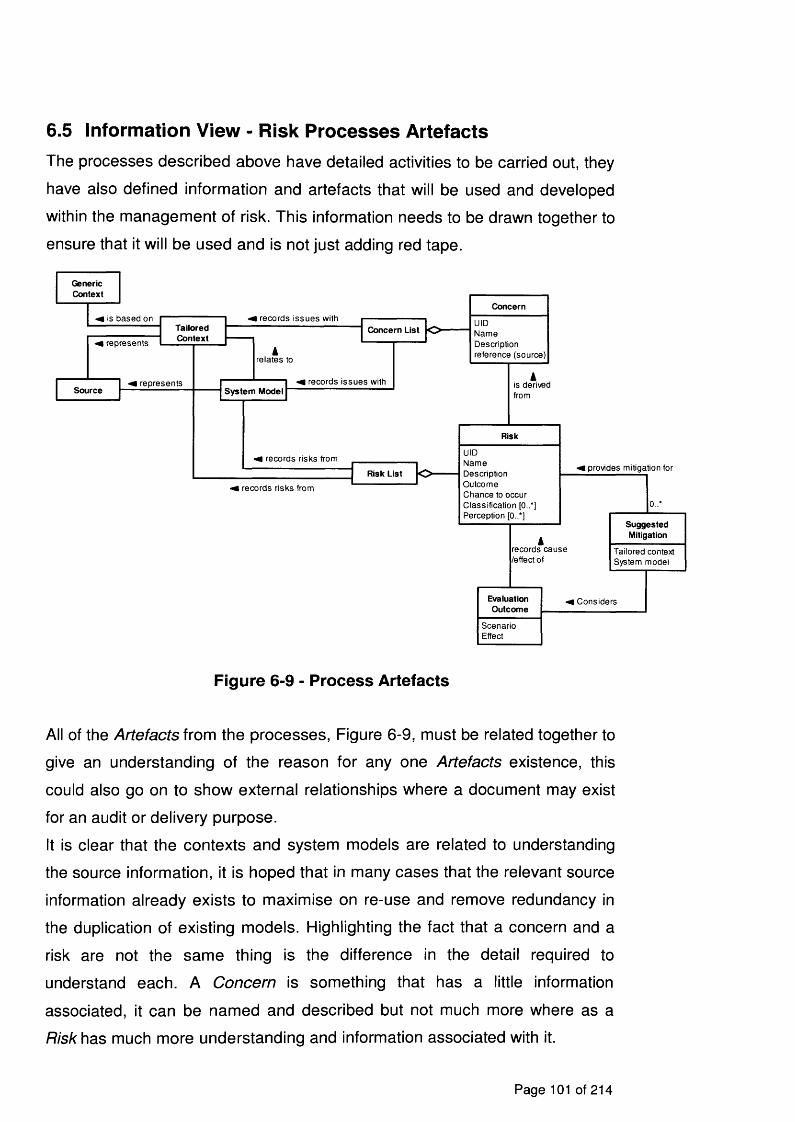
6.5 Information View - Risk Processes ArtefactsThe processes described above have detailed activities to be carried out, they
have also defined information and artefacts that will be used and developed
within the management of risk. This information needs to be drawn together to
ensure that it will be used and is not just adding red tape.
GenericContext
l is based on
i represents
SourceI represents
records is su e s w ithConcern ListTailored
Contextk
re la tes to
System Modell records is su e s with
I records risks from
i records r isks from
Risk List
Concern
UID Nam e Description reference (source)
kis derived from
Risk
UIDNam eDescriptionO utcom eC hance to occurC lass ifica tion [0..*]Perception [0..*]
I provides m itigation for
records cause /effect of
0..*
SuggestedMitigation
TailoredSystem
contextmodel
EvaluationOutcome
ScenarioEffect
l C onsiders
Figure 6-9 - Process Artefacts
All of the Artefacts from the processes, Figure 6-9, must be related together to
give an understanding of the reason for any one Artefacts existence, this
could also go on to show external relationships where a document may exist
for an audit or delivery purpose.
It is clear that the contexts and system models are related to understanding
the source information, it is hoped that in many cases that the relevant source
information already exists to maximise on re-use and remove redundancy in
the duplication of existing models. Highlighting the fact that a concern and a
risk are not the same thing is the difference in the detail required to
understand each. A Concern is something that has a little information
associated, it can be named and described but not much more where as a
Risk has much more understanding and information associated with it.
Page 101 of 214

It is worth noting here that in comparison with the standard processes
discussed in Chapter 2 there is a lack of communications and monitoring
Artefacts. These artefacts have been omitted as it is expected that these will
be part of an organisations standard process set and as such to re-define
them in risk management would create redundancy within the organisations
processes. If it is desirable to monitor the Risk to verify that it is still accurate
then the Risk Definition Process should be executed at defined intervals for
the specific risk or the whole list as required.
6.6 Process Instance View - MethodologyIt is expected that for any set of processes there is a prescribed order of
application. However, one of the main advantages of using object oriented
process definition is that the processes can be used in many different orders
providing flexibility to an organisation. This section describes two ways of
applying the processes the first shows the theoretical ideal, as if starting from
nothing, the second shows a more pragmatic approach accepting the fact that
some information will already exist and that if there were no concerns then it
is unlikely that the organisation would be carrying out risk management.
:Context ID iSystemModelling
:Concern ID :Risk Definition Evaluation :Risk Treatment
cr
Figure 6-10 - Theoretical ideal

When considering the theoretical ideal the first step would be to ensure that
the scope of the work and the areas to be investigated were understood, this
would move on to ensuring a consistent view of the system as it stands. With
a full understanding of the scope of work and the system in place concerns
with the system could be identified before specific risks defined. An evaluation
of the risks would be carried out with a view to defining mitigations for them.
This waterfall type approach, Figure 6-10, is presented by many as the
approach to projects and life cycles, it has also been shown to work well on
small well defined projects but not on large multidisciplinary undertakings,
Royce (1970) defines the waterfall approach before saying that it is 'risky and
invites failure'. For larger projects (or organisations) a more flexible and
cyclical approach is needed.
lj
:RiskTreatment
:Context ID Evaluation:Risk Definition:Concern ID:SystemModelling
Figure 6-11 - Pragmatic approach
An example of a more pragmatic approach, Figure 6-11, would be to start by
understanding the concerns first and based on these develop or retrieve the
relevant sections of the system understanding. The contexts can then be
developed with the knowledge of the areas to be considered before fully
defining the risks. All of this work could be carried out multiple times before
any evaluation is carried out or treatment defined.
Page 103 of 214

6.7 Process Support
The processes defined above detail the activities and artefacts required to
carry out risk management. This section provides further guidance in the
application of the ID Context, Risk Definition and Risk Evaluation processes.
6.7.1 Risk Contexts
It is well known that different types of risk exist in any organisation or entity.
This is re-enforced by concepts such as balanced scorecard (Kaplan and
Norton 1992) which identifies the need to consider the effects of Finance,
Learning and Growth and Customer and Business Processes on the vision
and strategy of the company. Zachman (1997) discusses different views
within an Enterprise architecture framework looking at Data, Function, People,
Time and Motivation; each of these he applies at different abstractions when
looking at an enterprise. These views, whether based on Zachman or on
balanced scorecard, are known as contexts.
The manner in which we are considering complex contexts and interactions
can be equated to Senge (2006) discussing the systems issue of dynamic
complexity; the whole being greater than the sum of the parts.
Project Context
Financial Context
People Context
BusinessContext
TechnicalContext
MarketingContext
Figure 6-12 - Risk Context relationships
This set of six generic contexts and their interactions, Figure 6-12, provide a
high level set of contexts, these can be considered as a starting point for
identifying relevant contexts for risk management. These six contexts are
Business, Finance, Marketing, People, Project and Technical.
When using the UML as a tool to aid understanding of contexts Use Case
Page 104 of 214

diagrams are used. These describe four main concepts:
• the Use Cases themselves which together describe the behaviour or
desired achievement of the context,
• the System Boundary which encapsulates the Use Cases and therefore
defines what is inside/outside the context,
• the Communications which represent the interactions of the context with
the outside world and
• the Actors which are the things or people to which the communications
connect (in this case these will always be other contexts).
All six Use Case diagrams will now be presented, starting with the Business
context;
Business contextThe Business context provides the overall mission of the company and the
ways it believes it can achieve that mission
Hnancial
Project
Marketing
Achieve goals
constrains
Generate income
Tenets
Business context
include
Define capability
Deliver capability
Use Assets
Figure 6-13 - Business Context
The overall aim of this business is to Achieve goals within the realms of its
tenets and it does this by defining capabilities, delivering capabilities, and
using assets. Therefore the Financial context is interested in Generating
income, the Project context is interested in using assets, the Project and
Marketing contexts are interested in delivering capability and the Marketing
Page 105 of 214

context is also interested in Achieving goals.
Financial contextThe Financial context deals with all things relating to the companies money.
Financial context
[Understand asset]Understandexpenditure People
indude
Understand money Project
Understand incomeBusiness
Client
Figure 6-14 - Financial Context
The overall aim of finance is to understand money which includes
understanding assets, understanding expenditure and understanding income.
Understand money relates to the business context as this is the only way in
which the business can work out if it is profitable or not, understand
expenditure relates to the People context and understand income to the
Project context. Understand income also relates to the Client
Page 106 of 214

Marketing contextThe Marketing context considers the scope for sales including ways to
improve the perception of the company and sales within the market.
Understanding the market includes understanding market share and market
demand, it also constrains the improvement of market share. Improving the
market share can be achieved by improving publicity and improving
reputation. "Brand" is a specific way of considering reputation and can be
considered separately. The Business context is interested in understanding
the market whilst the Client will be affected by improvement of market share.
Marketing context
Market shareinclude^
Understand marketDemandinclude:
constraii
Improve market . share
Clientin c lu d einelude
Improve publicity
ImprovereputationBrand
Figure 6-15 - Marketing Context
Page 107 of 214

Technical ContextThe Technical context is concerned with the product for its full lifecycle i.e.
from concept through to disposal.
Technical context
UnderstandRequirements
f "include-Provide product
Projectinclude'
Understand design
constrains
Analysis Build product
People
Safety analysis Performance
Security analysis
Figure 6-16 - Technical Context
The Technical context is focused on providing products. To provide products
the company must understand the requirements, develop a design and build
the product. Within each of these areas analysis will be performed and this
might include safety, security or performance related. There are obviously
many other types of analysis but they can generally be classified into one of
these groups. The Project and People context have relationships with "provide
product'.
Page 108 of 214
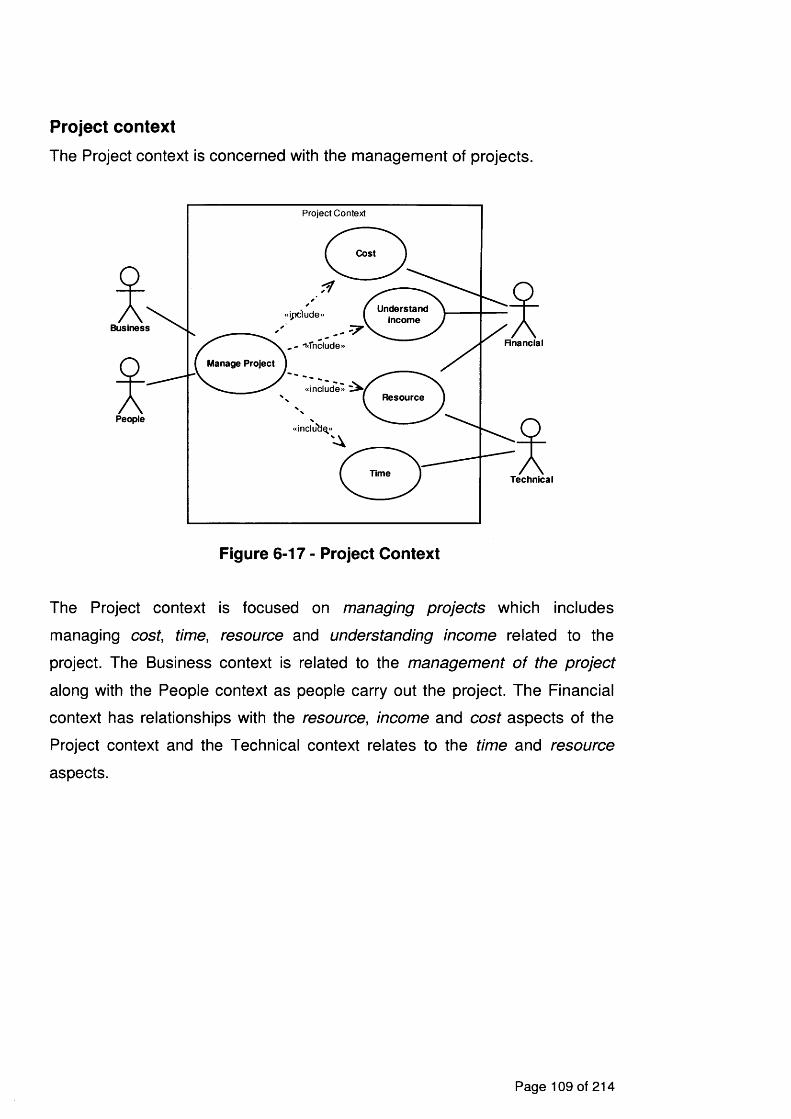
Project contextThe Project context is concerned with the management of projects.
Business
Rnancial
People
Technical
include' ^ 7
Manage Project
ipclude
Project Context
Cost
Time
Understandincome
Resource
Figure 6-17 - Project Context
The Project context is focused on managing projects which includes
managing cost, time, resource and understanding income related to the
project. The Business context is related to the management of the project
along with the People context as people carry out the project. The Financial
context has relationships with the resource, income and cost aspects of the
Project context and the Technical context relates to the time and resource
aspects.
Page 109 of 214

People contextThis final context looks at the individuals involved in the organisation.
People context
ExperienceTraining
MarketingTechnicalinclude;include
Competence
BusinessMotivation
Project
Financial
Figure 6-18 - People Context
The People context focuses on competence. Competence can be seen as the
amalgamation of training or underpinning knowledge with experience or the
skills developed through having applied that knowledge. A person's
competence can also be affected by their motivation or attitude to work. The
actors shown on this diagram cover all of the other contexts giving the People
context the most complex set of interactions.
6.7.2 Context ConclusionsThese six contexts provide a generic start point for understanding an
enterprise however, they are not designed to represent any specific
enterprise. As such they must be tailored to represent the enterprise in which
risk management is being carried out. Approaches to the application of these
contexts have been discussed in putting risk into context Brownsword and
Setchi (2007).
Page 110 of 214
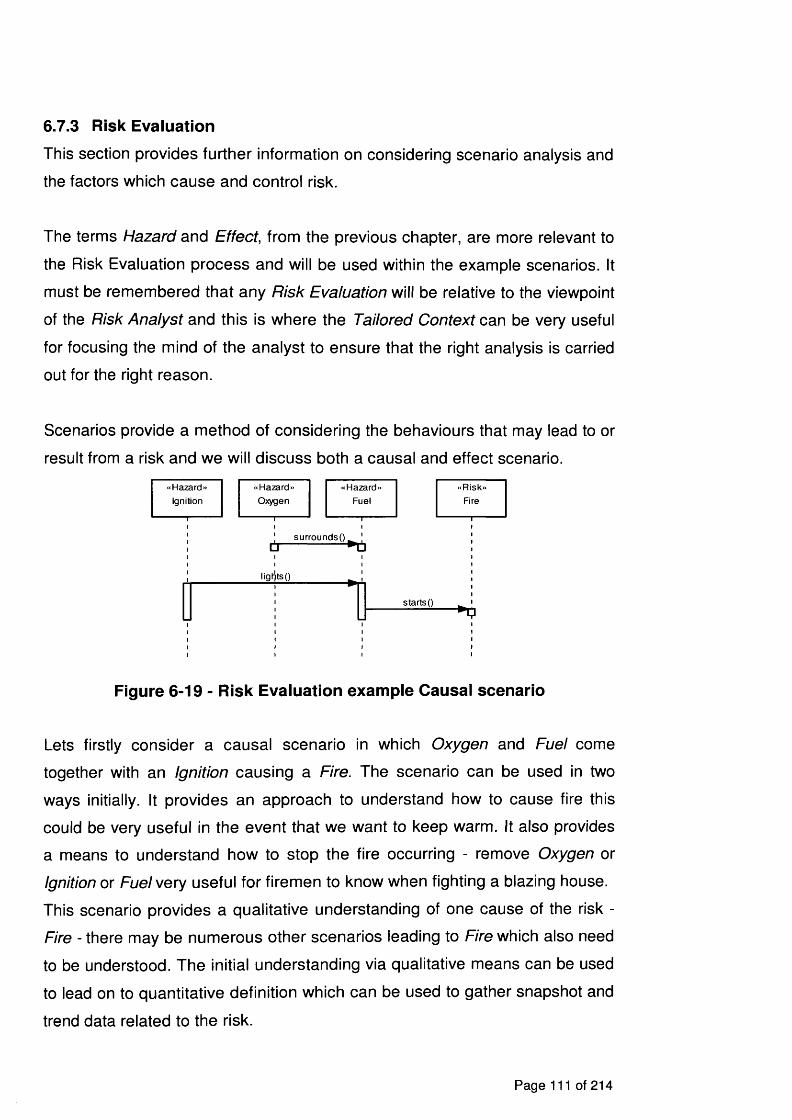
6.7.3 Risk Evaluation
This section provides further information on considering scenario analysis and
the factors which cause and control risk.
The terms Hazard and Effect, from the previous chapter, are more relevant to
the Risk Evaluation process and will be used within the example scenarios. It
must be remembered that any Risk Evaluation will be relative to the viewpoint
of the Risk Analyst and this is where the Tailored Context can be very useful
for focusing the mind of the analyst to ensure that the right analysis is carried
out for the right reason.
Scenarios provide a method of considering the behaviours that may lead to or
result from a risk and we will discuss both a causal and effect scenario.
« Hazard » « Hazard» « Hazard» «Risk»Ignition
-------------1-------Oxygen
-------------1------------
Fuel
-------------1------------
Fire
-------------1------------
surroundsQU U
ligljtsQ
starts ()
Figure 6-19 - Risk Evaluation example Causal scenario
Lets firstly consider a causal scenario in which Oxygen and Fuel come
together with an Ignition causing a Fire. The scenario can be used in two
ways initially. It provides an approach to understand how to cause fire this
could be very useful in the event that we want to keep warm. It also provides
a means to understand how to stop the fire occurring - remove Oxygen or
Ignition or Fuel very useful for firemen to know when fighting a blazing house.
This scenario provides a qualitative understanding of one cause of the risk -
Fire - there may be numerous other scenarios leading to Fire which also need
to be understood. The initial understanding via qualitative means can be used
to lead on to quantitative definition which can be used to gather snapshot and
trend data related to the risk.
Page 111 of 214

«Risk» « Effect.. « Effect»Fire
-------------1------------
Furniture
-------------1------------
Structure
burnsQU
burnsQ
de-stabalises ()
Figure 6-20 - Risk Evaluation example Effect scenario
Once the Fire is burning an Effect Scenario will show what happens next. In
this case we will consider a Fire in a house fire, the Fire burns the Furniture
and Structure of the house.
Again this provides a qualitative understanding of the effect of the Fire in this
scenario, it is obvious in this case that we could move on to understand
quantitatively the loss based on the occurrence of the risk. It is possible to use
SysML parametrics to carry out this analysis in a bespoke manner as
discussed in 'Formalising risk assessment through the use of SysML
parametrics' by Brownsword and Perry (2009) however, SysML is not the only
approach to carrying out the qualitative analysis but it does have the
advantage of providing a Formalisation consistent with use of UML.
Page 112 of 214

Model
Control
cause ►{Incomplete}
Risk
Business
Life Cycle SafetyProject
Technical
Non-Safety
Business
Standard
Factor
FinancialCompetence
Figure 6-21 - Risk factor overview
There are a number of factors which may both cause and control risk, some of
these factors are Standards, Life cycle, Business and Competence each of
these affects different and sometimes identical categories of risk discussed
further in picturing risk Brownsword and Setchi (2005). Each of these factors
can be considered at any point within a cause or effect scenario. These
factors are similar to the categorisations within the Taxonomy-Based Risk
Identification report by Carr et al (1993) where they have identified factors
within each of the basic engineering processes and are used in a similar way,
to support causal analysis.
6.8 ConclusionThe purpose of this chapter was to define the processes required to carry out
risk management using a multi-view approach. This has been achieved
through the application of the 'Seven Views Approach' which has been used
to formalise and communicate the processes for risk management whilst
providing a consistent method to identifying concerns, defining risks and
evaluating their cause and effect.
Page 113 of 214
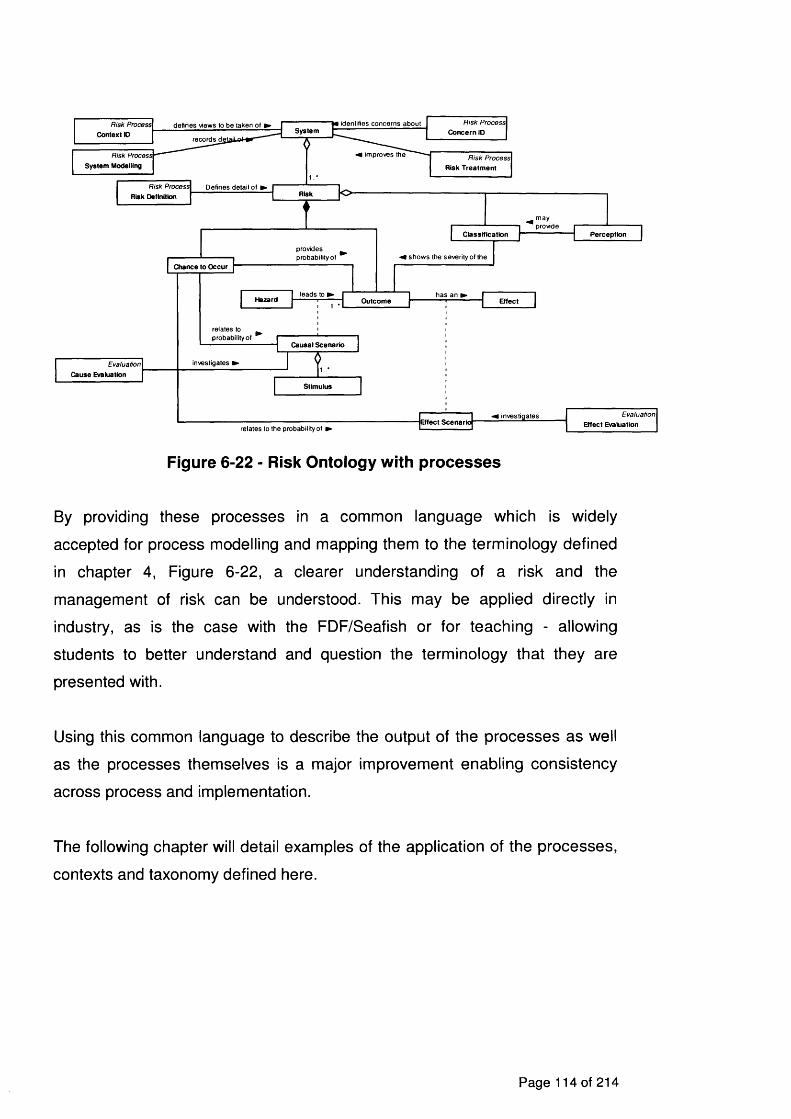
R isk P rocess
Concern ID~M identifies concerns aboutRisk Process
Context 10delines views to be taken of
Systemrecords detail
^ improves theRisk Procest
System ModellingR isk P rocess
Risk Treatment
Risk Process
Risk DefinitionDefines detail of » oRisk
m a yprovide
Classification Perception
provides probability of ^ shows the severity of the
Chance to Occur
leads to ► has anHazard Outcome Effect
relates to probability of
Causal Scenario
investigates ►Evaluation
Cause EvaluationStimulus
EvaluationinvesliqatesEffect Scenario ‘ Effect Evaluationrelates to the probability of ►
Figure 6-22 - Risk Ontology with processes
By providing these processes in a common language which is widely
accepted for process modelling and mapping them to the terminology defined
in chapter 4, Figure 6-22, a clearer understanding of a risk and the
management of risk can be understood. This may be applied directly in
industry, as is the case with the FDF/Seafish or for teaching - allowing
students to better understand and question the terminology that they are
presented with.
Using this common language to describe the output of the processes as well
as the processes themselves is a major improvement enabling consistency
across process and implementation.
The following chapter will detail examples of the application of the processes,
contexts and taxonomy defined here.
Page 114 of 214

7 Case Studies
7.1 IntroductionA number of Case studies have been carried out during this work to support
the definition, development and evaluation of the Ontology and Processes.
The case studies have been carried out using a variety of applications to
ensure a general nature in the processes and definitions already presented.
The objective of this chapter is to demonstrate the applicability of the
processes and ontology. This objective will be achieved through the
presentation of two paths through one of these case studies showing the
processes applied in a pragmatic but formal manner. These paths are based
on the application of the Ontology and processes to a charitable organisation.
The first path looks at a health and safety concern and the second at a
governance concern. The application of the processes to this organisation
shows the benefit of using a formalised approach to the management of Risk
and the ability of the processes to apply to different types of Risk.
7.1.1 Background
Charitable organisations must not only ensure that they are financially viable
(that they have a business case) but also that they meet the needs of the
beneficiaries of the charity while conforming to the rules set out by the charity
commission.
Kings Norton Parish Church, winners of the 2005 BBC 2 Restoration
programme, is such an organisation. Not only is it the custodian of two lovely
restored buildings it is also a team parish, meaning that there are a number of
staff members (clergy) to look after four churches, their congregations and to
spread the word through the wider public.
The Kings Norton Parochial Church Council (KNPCC) has identified the need
to improve the way in which risk management is carried out.
Page 115 of 214

7.1.2 Case study tactics
This study will be carried out using an ethnographic/participant observer
approach discussed by Yin (1998), the researcher is already an established
member of this community. Participants in the study will not be aware that
research is being carried out.
The study will record the use of the ontology and processes defined for risk
management. The application of the processes will be led by the researcher
along with a small number of other members of the community, these
members understand the need to carry out risk management and are happy
to trail the processes. The data created through the use of the processes will
be collected in two ways. General knowledge regarding the activities and
relationships within the organisation will be stored in a relational database
whilst information regarding the risks will be stored in the organisations
enterprise architectural/risk management model.
The main aim of this study is to understand the practicality of using the
ontology and processes, understanding firstly whether the processes can be
applied in a pragmatic way and secondly whether they are flexible enough to
deal with changes in the current situation in a timely fashion.
A benefit to this study will be the lack of existing risk management processes
within the organisation. This lack will reduce the cultural change issues
associated with the implementation of different approaches.
It is recognised that bias maybe introduced into this study due to the
researchers ability to guide events. This will be mitigated through the use of a
team approach to the approach followed ensuring that the processes and
ontology are not forced onto the work which is to be carried out.
Page 116 of 214

7.2 ApproachThe processes have been applied using the more pragmatic ordering
recognising the fact that work has been carried out before and that there is
some understanding of the concerns that exist. For this reason the case study
will be discussed in three main sections.
1. The initial processes carried out identify the first set of concerns,
contexts and risks. The risks which will then be taken forward and
discussed further are an health and safety issue and a governance
issue.
2. The health and safety risk shows the consideration of people’s needs in
relation to the physical structure of the building and although other
concerns are raised which could affect the solution the processes are
adaptable enough to include concerns from other contexts.
3. The work to solve the governance risk shows how information can be
recorded and retained to enable future concerns and risks to be
evaluated in a more efficient way, it also supports the definition of a
parish wide mission and the definition of job specifications for clergy.
Each section will be preceded by a sequence showing the order in which the
processes from Chapter 6 have been implemented.
The first of these sequences can be seen in Figure 7-1 below.
:SystemModelling
context requiredQ
:Concern ID Risk Definition Evaluation :Risk Treatment
initial concerns()
Figure 7-1 - Initial Process Instance View
This work starts by executing the Concern ID process, it is expected that this

in truth is where most applications will start, one of the reasons for this is that
it provides direction and scope to begin where contexts and systems models
do not exist, this will then be expanded in future iterations to encompass other
areas of concern. Following the initial identification of concerns high level
contexts are suggested before ensuring that any immediate risks have been
defined.
7.2.1 Initial Concern Identification
The initial concerns were elicited during a meeting of the KNPCC (as the
governing body of the organisation).
Child protection :Concern[Identified]
UID = C1Nam e = Child protection reference (source) = Deanary Description = All child protection
Information View:: Concern
UID < ------- __NameDescriptionreference (source)
Urn :Concern[Identified]
UID = C2 N am e = UrnDescription = Urn m ay fall on someone reference (source) = PCC m em ber
Health & Safety Concern[Identified]
UID = C3N am e = Health & SafetyDescription = Covering electrical and trip hazards reference (source) = PCC m em ber
:Concern
UID = C4Nam e = Parish ReviewDescription = Parish profile is out of datereference (source) = Team Rector
:Concern
UID = C5N am e = Clergy numbersDescription = Ability to replace Clergy mem ber due to leave reference (source) = Team Rector
Figure 7-2 - Initial concerns
It can be seen that the initial concerns, Figure 7-2, vary in scale including
governance, staff numbers, health and safety (a matter for any organisation
with buildings and people) to an Urn. An explanation was required to
understand what the Urn concern was, it suggested some large pot waiting to
Page 118 of 214

fall on some unsuspecting passer by, in actual fact it is a hot water urn which
is located near a children's play area and could be occasionally left
unattended whilst the children play. This is obviously a health and safety issue
although focus is required, analysis and categorisation of concerns will take
place at another point.
It is imperative to ensure that the terminology used throughout the application
of the processes is consistent with that defined in the ontology. Here the term
Concern is being used and the direct reference from the Information View for
the processes has been highlighted, the reference helps to ensure that the
correct terminology is used at all times.
7.2.2 Initial Context DevelopmentWith a number of concerns captured an overview of the organisation was
required to give some scope to these concerns. A number of contexts in
which the organisation works gives some focus to this and will enable a
considered approach to the definition of structure and behaviour during future
process execution.
Provision
Places
People Rnancial
Governance(Core)
Figure 7-3 - Context identification
In this case only the high level contexts have been defined initially, Figure 7-3.
These provide a start point for further consideration once a better
understanding of the organisation has been achieved. These contexts may
also be used to focus future work so that it considers specific areas in which
the organisation works rather than floating around ideas which may never
bear fruit.
Page 119 of 214

7.2.3 Initial Risk DefinitionIn the first instance the risks identified are the current priorities based on the
situation that the organisation is in and those which are likely to show results
in a reasonable time frame.
Information View:fiisk
UIDNameDescriptionOutcomeChance to occurClassification [0..*]Perception [0..*]
No new clergy :Risk
UID = R2Outcome = No new clergyDescription = No new clergy for the parishClassification = ResourceChance to occur = UnknownPerception = No new clergy will be perceived as a loss of clergy for the parish
Scalding child :Rlsk
UID = R1Outcome = Scalded child Description = Hot water on child Classification = SafetyPerception = No-one wants to see a child hurt Chance to occur = Unknown
Figure 7-4 - Risk Definition
Again terminology is key, at this point Risks are being defined and the
terminology used to define them must be from the Information View and
therefore the Ontology. It is interesting that in both these risks, Figure 7-4, the
Chance to occur is unknown this will be the case with many non technical
risks as it is almost impossible to calculate the probability and where it is
possible it tends not to be accurate. The only way to get close would be to
base the chance to occur on a fraction of the number of children recorded to
have been scalded in a set time frame, or to ask when it last happened in this
building or those like it. The problem with all of these approaches is twofold;
firstly there are so many variables that the chance to occur that is recorded
will not reflect the true chance to occur of that outcome and secondly the time
spent calculating the chance to occur is wasted as the perception and
classification of the outcome mean that something will be done whatever the
chance to occur actually is.
Having defined the risk it is also worth recording where it came from, this may
be a relationship to part of the system model, context, another risk or concern.
Page 120 of 214

«trace •>
(from Concern ID 1 - Initial Concern Identification)
■trace'
(from Concern ID 1 - Initial Concern Identification)
«trace
UID = C4Name = Parish ReviewDescription = Parish profile is out of datereference (source) = Team Rector
Concern
[Identified)
UID = C2 Name = UrnDescription = Urn mayfall on someone reference (source) = PCC member
Urn Concern
UID = C5Name = Clergy numbersDescription = Ability to replace Clergymemberdue to leave reference (source) = Team Rector
Scalding child :FBskUID = R1Outcome = Scalded child Description = Hot water on child Classification = SafetyPerception = No-one wants to see a child hurt Chance to occur = Unknown
No new clergy :RiskUID = R2Outcome = No new clergyDescription = No new clergy for the parishClassification = ResourceChance to occur = UnknownPerception = No new clergy will be perceived as a loss of clergy for the parish
(from Concern ID 1 - Initial Concern Identification)
Figure 7-5 - Risk - Concern Trace
In this case, Figure 7-5, both risks are based directly on the concerns that
were raised. Although this is the case currently it is possible that other areas,
structures or needs will be identified later that either re-enforce the definition
of the risk or affect one of its attributes, possibly the perception or
categorisation. This supporting information can be added when it is identified
either during the execution of the systems modelling and context id processes
or when next the risk definition process is carried out.
At the conclusion of the initial process execution a number of concerns,
contexts and risks have been identified, each may raise many questions. The
following will begin to ask some of these questions by both re-applying the
processes used here and expanding the investigation through the evaluation
and treatment of these two Risks.
7.3 Health and Safety RiskThe first path to be presented will consider the case of a child being injured
through scalding. The development of a system model will enhance and
support the evaluation of the cause and effect of the Risk before solutions, if
required, are considered.
The added complication of extra concerns being raised which affect possible
Page 121 of 214

solutions to this Risk will also be discussed and an approach to incorporating
these described.
Changes happen even in the most stable of situations, in this case the
expected processes have been presented enabling a comparison later when
extra inputs threaten to unbalance the approach.Evaluation:Concern ID :Risk Definition :Risk Treatment:Context ID :System
Modelling
ref
Initial PIV
causal evalulationQ
effect evaluationQ
Additional concern()
Figure 7-6 - Scalding child Process Instance View
Following the initial processes, already covered, more detail was added to the
areas directly related to the 'Scalding Child' risk, Figure 7-6, before re-visiting
the definition of the risk to ensure all areas had been covered in the depth
available. Both cause and effect evaluations were carried out based on the
system model before considering changes to the system model that may
provide solutions to the Risk.
7.3.1 Understanding the System
Understanding the current situation and recording the terminology behind it
are the objectives of this execution of the system modelling process. In this
case the process will firstly look at the terminology before organising the
terms to create a representation of the current situation. The focus of the
process will be within the places context that is focusing on the buildings
areas within.
Page 122 of 214

It is important to understand the terminology and concepts currently in place
as these will provide the consistency behind any populated views or
representations of the current situation. Ideally this information would already
exist within an Enterprise Architecture (EA) as described by (Zachman 1997)
or (Holt 2009) however, in this case there is no such EA, much of the
information is tacit knowledge, as such the process will be used to record the
information rather than to identify from existing sources. The process will
begin by recording some of the terminology used within the organisation.
Hawkesley
Resource
TechnicalFurniture SoftwareBuilding
Infrastructure
ImmanuelSt Nicolas Restoredbuildings
Figure 7-7 - Infrastructure
It is important to understand the concepts within the infrastructure to define
what the organisation has before trying to arrange it and place it in specific
locations. It is also important to know that the organisation does not own all of
the resources that it uses, some of them are hired and as such only available
at specific times and places.
Buildings are of obvious importance, the diagram in Figure 7-7 aids in the
understanding of the buildings which are considered to be of relevance, this
means that there may be other buildings not shown in this diagram but could
be equally as important in another view.
Page 123 of 214
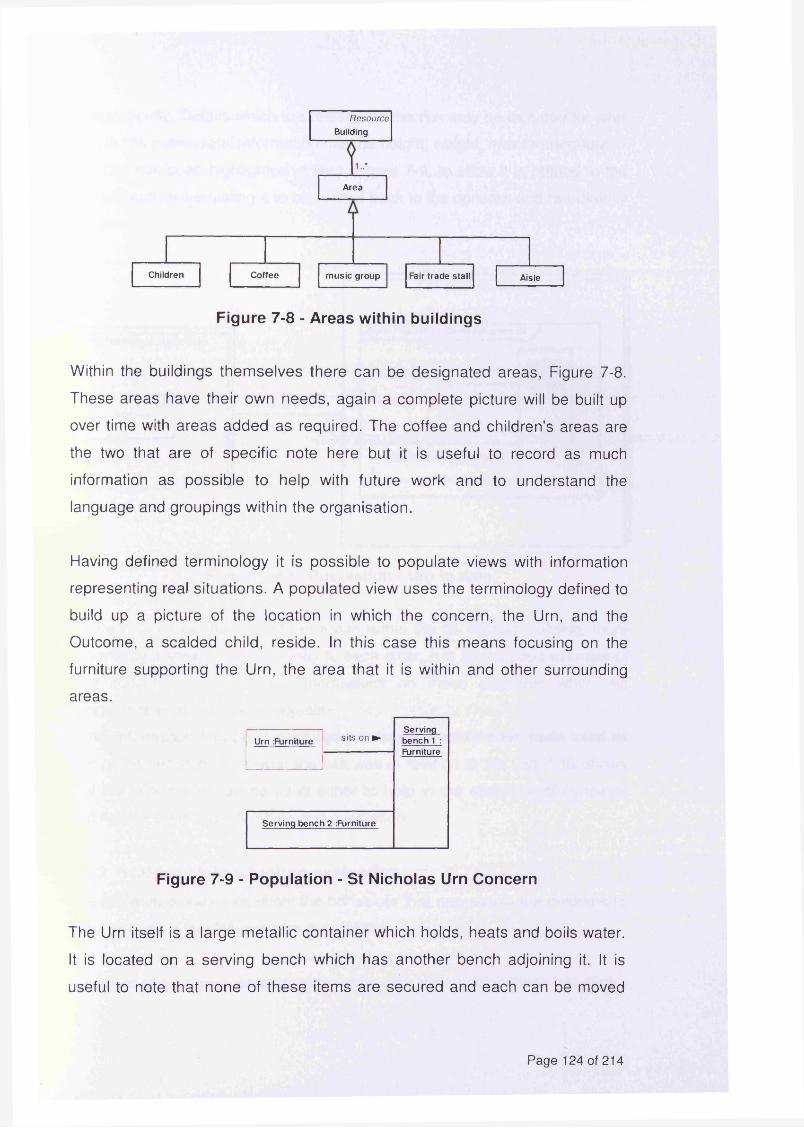
Aisle
Area
Children Fair trade stallmusic groupCoffee
ResourceBuilding
Figure 7-8 - Areas within buildings
Within the buildings themselves there can be designated areas, Figure 7-8.
These areas have their own needs, again a complete picture will be built up
over time with areas added as required. The coffee and children's areas are
the two that are of specific note here but it is useful to record as much
information as possible to help with future work and to understand the
language and groupings within the organisation.
Having defined terminology it is possible to populate views with information
representing real situations. A populated view uses the terminology defined to
build up a picture of the location in which the concern, the Urn, and the
Outcome, a scalded child, reside. In this case this means focusing on the
furniture supporting the Urn, the area that it is within and other surrounding
areas.
Serving sits on ► bench 1 :-------------------- Fijrniture
Serving bench 2 furn iture
Figure 7-9 - Population - St Nicholas Urn Concern
The Urn itself is a large metallic container which holds, heats and boils water.
It is located on a serving bench which has another bench adjoining it. It is
useful to note that none of these items are secured and each can be moved
Urn furn iture
Page 124 of 214

independently. Details which are relevant to the risk may be included for later
use, in this case useful information may be height, weight, max temperature.
The Urn has been highlighted in Red, Figure 7-9, to show it is related to the
risk and concern enabling it to be related back to the concern and risk directly
if desired.
R1 Solutions "Coffee area
R1 Solutions::Children Area
Soft toysis open to
object Population - St Nicholas Urn C2 J
Urn :Furniture sits on i
Serving bench 2 furniture
Serving bench 1 : Furniture
Figure 7-10 - Population - Urn in area
Figure 7-10 shows the two of the areas within the St. Nicolas building, more
importantly it shows their proximity to each other, it is also a good example of
how concerns may manifest themselves on these diagrams when the
concerns related to physical objects.If this information had been captured previously it would have been used as part of the decision as to what the risk was in relation to the Urn. This shows
that the information can be used either to help in the elicitation of concerns
and risks or their understanding and evaluation.
7.3.2 Scalded child situation evaluationThe following evaluations show the behaviour that may cause the outcome to
occur and the effect following an occurrence.
A number of scenarios were considered for causal evaluation these included:
Page 125 of 214
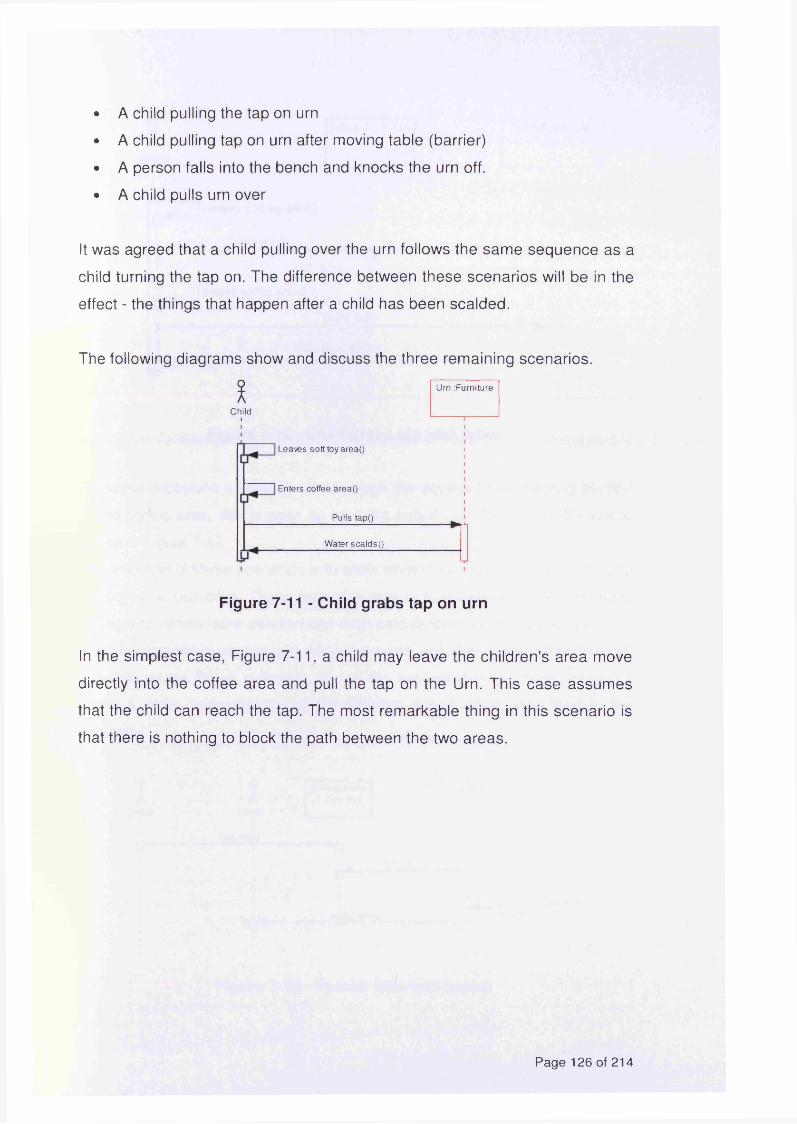
• A child pulling the tap on urn
• A child pulling tap on urn after moving table (barrier)
• A person falls into the bench and knocks the urn off.
• A child pulls urn over
It was agreed that a child pulling over the urn follows the same sequence as a
child turning the tap on. The difference between these scenarios will be in the
effect - the things that happen after a child has been scalded.
The following diagrams show and discuss the three remaining scenarios.
IChild
Leaves soft toy area()
Enters coffee area()
Pulls tap()
Water scaldsQ
Urn :Furniture
Figure 7-11 - Child grabs tap on urn
In the simplest case, Figure 7-11, a child may leave the children's area move
directly into the coffee area and pull the tap on the Urn. This case assumes
that the child can reach the tap. The most remarkable thing in this scenario is
that there is nothing to block the path between the two areas.
Page 126 of 214
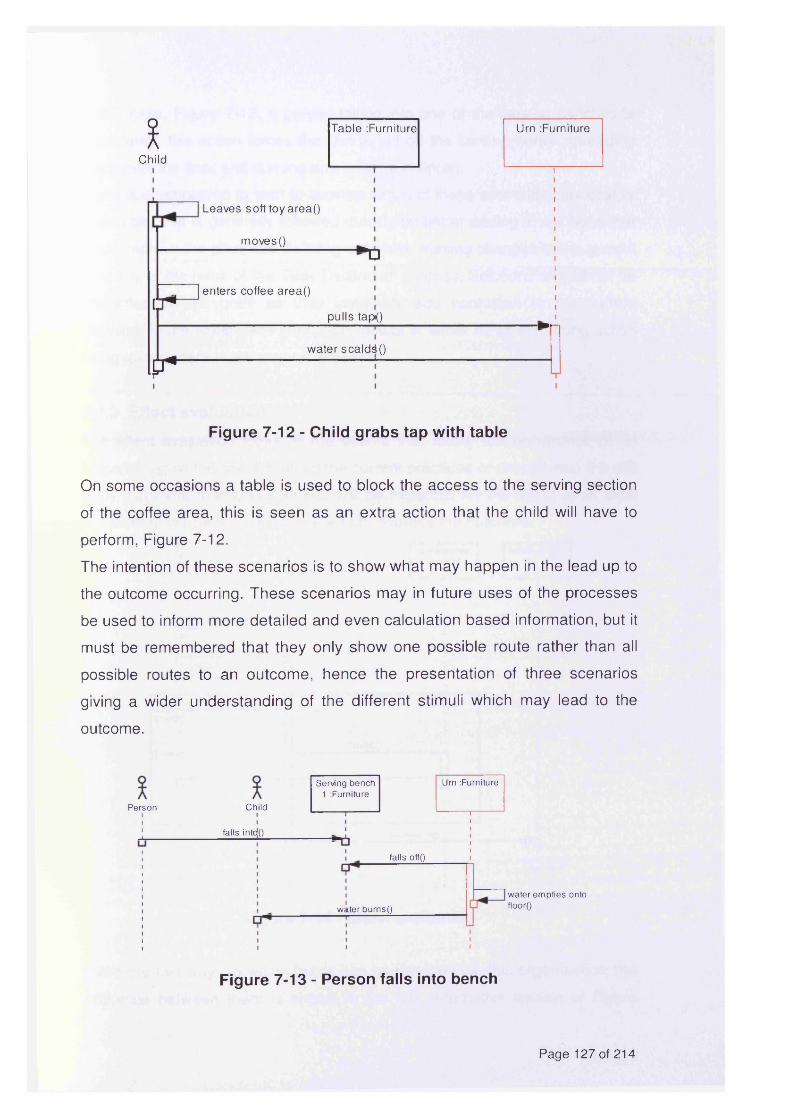
IC hild
T ab le :Furniture
Leaves soft toy a re a ()
m oves () n
i y * 1 3
Ip*
enters coffee a re a ()
pulls tap<)
w a te r sca ld^Q
Urn :Furmture
Figure 7-12 - Child grabs tap with table
On some occasions a table is used to block the access to the serving section
of the coffee area, this is seen as an extra action that the child will have to
perform, Figure 7-12.
The intention of these scenarios is to show what may happen in the lead up to
the outcome occurring. These scenarios may in future uses of the processes
be used to inform more detailed and even calculation based information, but it
must be remembered that they only show one possible route rather than all
possible routes to an outcome, hence the presentation of three scenarios
giving a wider understanding of the different stimuli which may lead to the
outcome.
Urn :FurnitureServing bench 1 :Furniture
ChildPerson
falls intcj()
falls off()
water empties onto floor()water burns()
Figure 7-13 - Person falls into bench
Page 127 of 214

In this case, Figure 7-13, a person falling into one of the serving benches is
considered, this action forces the Urn to fall off the serving bench spreading
water over the floor and burning one or more children.
There is a temptation to start to surmise which of these scenarios may best or
preferable, this is generally followed quickly by better adding in solutions that
could improve the situation. Defining solutions, making changes to the current
situation, is the remit of the 'Risk Treatment' process. Solutions should not be
presented at this point as they invariably add confusion to the current
situation. In the worst case confusion results in either no or the wrong action
being taken where real danger is present.
7.3.3 Effect evaluation
The effect evaluation looks at the events that follow the occurrence of an
outcome, again this should reflect the current practices or procedures. It is still
likely that more than one scenario will be expected for the effect as in most
cases there will be more than one way to address the outcome.
:Child :Person
Scalds()
i' assess injuryQ
Emergency accident bookservices
-------------1------------ T
administer first aid() r*---------------
alt j k
[m insrtreatQ
[major]‘carts O'
treatQ
records in()Tl
Figure 7-14 - Effect evaluation
There are two ways in which burns can be dealt with in this organisation; the
difference between them is shown in the 'alt', alternative section of Figure
Page 128 of 214

7-14. For minor injury the first aider will treat the child where as for a major
injury the emergency services will be called. Incorporating two options in a
scenario in this way can be very useful for small variations, however when
larger or more complicated alternatives are possible they can become
unwieldy - adding complication rather than clarifying a situation.
It was expected that before any evaluation was carried out more definition
may be added to the risk however in this case no information that will improve
the definition of the risk has been identified.
7.3.4 Treating the risk of scalding a child
Having identified both causes and effects of the outcome the risk treatment
processes uses the preceding information as a basis to decide whether
mitigation, solution or treatment should be considered. Treatment could mean
changes to either cause or effect, the ideal is to remove the possibility of the
Outcome or make the Chance to occur zero. When the chance to occur can
not be reduced to zero treatments ensure that sufficient procedures are in
place to be exercised should the outcome occur. As this outcome could cause
serious injuries resulting in the attendance of the emergency services it is
agreed that treatments for the risk should be considered. Seven possible
treatments have been identified;
1. Current (with table to reduce access)
2. Remove urn (move to another location)
3. Soft area in North pews
4. Soft area in South pews
5. Secure serving furniture and add door
6. Replace urn with fixed plumbed boiler on wall
7. Do not leave urn unattended.
By way of this example two of these options will now be discussed further,
these will be options 4 and 6.
Page 129 of 214

barrier ftjrnrture
b a rr ie r : ijrn iture
Soft toysb arrier: iirniturr
barrier .Furniture
Coffee area
object Population - St Nicholas Urn C2 J
Urn :Furniture I sits on ►Serving bench 1 : Furniture
Serving bench 2 :Furniture
------------------- '----------------------Cb.Soft area in south pews (aisle)Where would opening in pews be, center or to the door?
Figure 7-15 - Risk Treatment - Scalded child - Solution 4
This solution, Figure 7-15, shows the use of other areas within the church to
provide a separation between the children's area and the coffee area. These
solutions have been discussed with affected parties and questions raised.
Questions such as, will the main entrance door and step attract children and
present concerns, what sort of barrier will be used, is it a problem that this will
increase the distance to the toilet and the quiet area where carers take crying
children. The fact that these queries include items or areas not shown on this
diagram is not a problem; quite the reverse the identification of the areas will
support the improvement of the system model in another iteration of the
process.
Page 130 of 214

— kReplace Urn with plumbed fixed boiler
>Coffee area
Water boiler:Furniture
Children Area
aSoft toys
is open to
Serving bench 2 : Serving bench 1 :Furniture Furniture
Figure 7-16 - Risk Treatment - Scalded child - Solution 7
Suggesting that the urn should be replaced with a fixed boiler, Figure 7-16
met with resounding agreement, rather than issues or questions being raised
statements were along the lines of; won't this be more environmentally
friendly, this will save others having to move the urn to empty it, this will save
money, the only negative point was that holes would have to be created in the
wall to enable fixing and plumbing.
fcvDoes this risk require treatment?
No
Parents should be watchingat some services table is used to obstruct access
Yes
Perceived that if someone could be hurt we should do something about it.
Figure 7-17 - Treatment - Scalded child
The decision now has to be made whether to treat this risk or not. There are
arguments for both for and against including:
For - perception that if someone could be hurt something should be done
about it.
Against - Carers should be watching, in some situations a table is used to
Page 131 of 214

obstruct access.
Both of these options could provide a reasonable solution in the way of a
treatment for the risk, however to select a solution at this point would be
premature. These solutions have been defined to solve the problem from the
context of the place or building, their impact on the other contexts has not yet
been considered.
7.3.5 Additional Concerns
This case study was all going well, it was selected as a 'simple' concern to
look into, it was according to plan, everyone was happy... and then, as
happens with most projects, plans and operations something else cropped up.
Another concern was raised which was obviously linked to this risk. The
concern was about the amount of space available in the children's area, more
importantly one of the provisions is a group which has outgrown the space. It
was recognised that this concern may increase the chance to occur posed by
the 'Scalding child risk' as tiny tots, the group, was regularly having 18
children in the space whilst the urn was on.
Information View:: Concern
ConcernUID = 11Name = Tiny tot spaceDescription = Not enough space during tiny tots reference (source) = Honorary Curate
UID Name Description reference (source)
< ---------------------------
Figure 7-18 - Concern Identification Revisited
This concern, Figure 7-18, had the potential to throw the work out of control
as it may bring in other concerns and the treatment work may have to be re
iterated or completely re-done. Using the modular processes and robust set of
terminology defined in this work means that this is not the case. Using
processes in this way anticipates changes and additions such as this and in
this case it could even be considered to be timely providing needs for the
provision context against which solutions will be evaluated.
Page 132 of 214

7.3.6 Scalded child Solution evaluation
The provision context is directly related to the additional concern and as such
provides extra needs which to be considered. The main focus here is on
available space and this is two fold, there must be more physical space for the
children's area without reducing the overall seating capacity of the building.
Therefore each solution will be evaluated using parametrics based on number
of seats and amount of open space.
Most of these solutions do not have any relationship with finance as there will
be no capital outgoings. There is one however which does; solution option 7
suggests the purchase of a fixed and plumbed boiler unit and the financial
implications of this must be understood.
The cost of a boiler of this sort is in the region of £400 however the running
cost should be lower balancing this out over time. These costs including fitting
will need to be considered if this is thought to be a viable solution.
Something happening to a person in a place was the original reason for the
identification and definition of the concern and risk. From this point of view this
context can be considered to have been covered. It is worth however looking
a little further at this as there are a number of points to understand.
1. this risk supports the definition of a relationship between the people and
places contexts
2. other people interact with the urn, not just children
There is no direct relationship to governance as this is a place and people
issue and the effect on the contexts are not significant enough to have
repercussions through all contexts at this point.
7.3.7 Health and Safety Risk Conclusion
Solution selection is not within the remit of risk management only the
provision or suggestion of solutions. The selection of a solution must be the
responsibility of the whole organisation working with the broadest knowledge
of what it is trying to achieve. As such risk management provides the
Page 133 of 214
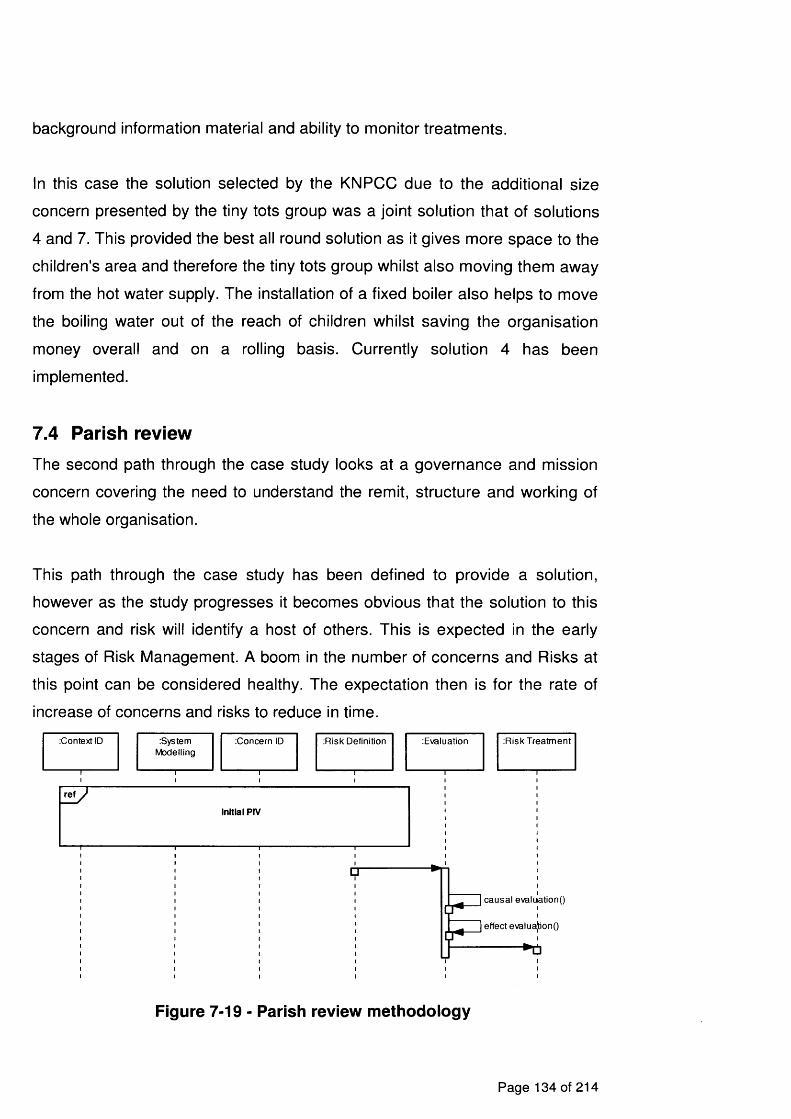
background information material and ability to monitor treatments.
In this case the solution selected by the KNPCC due to the additional size
concern presented by the tiny tots group was a joint solution that of solutions
4 and 7. This provided the best all round solution as it gives more space to the
children's area and therefore the tiny tots group whilst also moving them away
from the hot water supply. The installation of a fixed boiler also helps to move
the boiling water out of the reach of children whilst saving the organisation
money overall and on a rolling basis. Currently solution 4 has been
implemented.
7.4 Parish review
The second path through the case study looks at a governance and mission
concern covering the need to understand the remit, structure and working of
the whole organisation.
This path through the case study has been defined to provide a solution,
however as the study progresses it becomes obvious that the solution to this
concern and risk will identify a host of others. This is expected in the early
stages of Risk Management. A boom in the number of concerns and Risks at
this point can be considered healthy. The expectation then is for the rate of
increase of concerns and risks to reduce in time.Context ID System Concern ID Risk Definition
ModellingEvaluation Risk Treatment
ref J
Initial PIV
causal evaluation()
Figure 7-19 - Parish review methodology
Page 134 of 214

It is envisaged that the solution to this Risk will be a project, Figure 7-19, and
as such the solution will not be evaluated against all contexts in this example,
this will occur during the project itself by the nature of the work to be carried
out.
7.4.1 Situation evaluation
In constructing the causal analysis the point at which a Clergy member leaves
a parish provides a starting point, why they choose to leave is not under
investigation. The investigation is to the cause of clergy members not being
replaced in this team parish. In a team parish an assessment is carried out
after a clergy member leaves and a clergy member leaving does not mean
that there is a vacant position.
Clergy
Parish Review
Bishop
Leaves ()
InitiatesQ
Review missionQ
Review structure()
review needs ()
resultQ
| assess()
outcomes: no new clergy bad review
evaluation causal:don't do contextdon’t understand structuredon’t understand needproduce bad profile and job desc
effect:no new clergy demotivated congregation
solution:understand context, structure and need produce good parish profile and job desc
Figure 7-20 - Causal evaluation
There are two possible outcomes from the Bishops assessment at the end of
the review shown in Figure 7-20 this could be a simple yes, no. Yes a position
will be made available, no, a position will not be made available. It is the
negative outcome which is of most concern.
7.4.2 Effect evaluation
The effect of no new clergy being appointed could mean a loss of resource
creating; an inability to reach and service all areas of the parish; over
stretching of existing resources. This may mean that some needs are not
Page 135 of 214
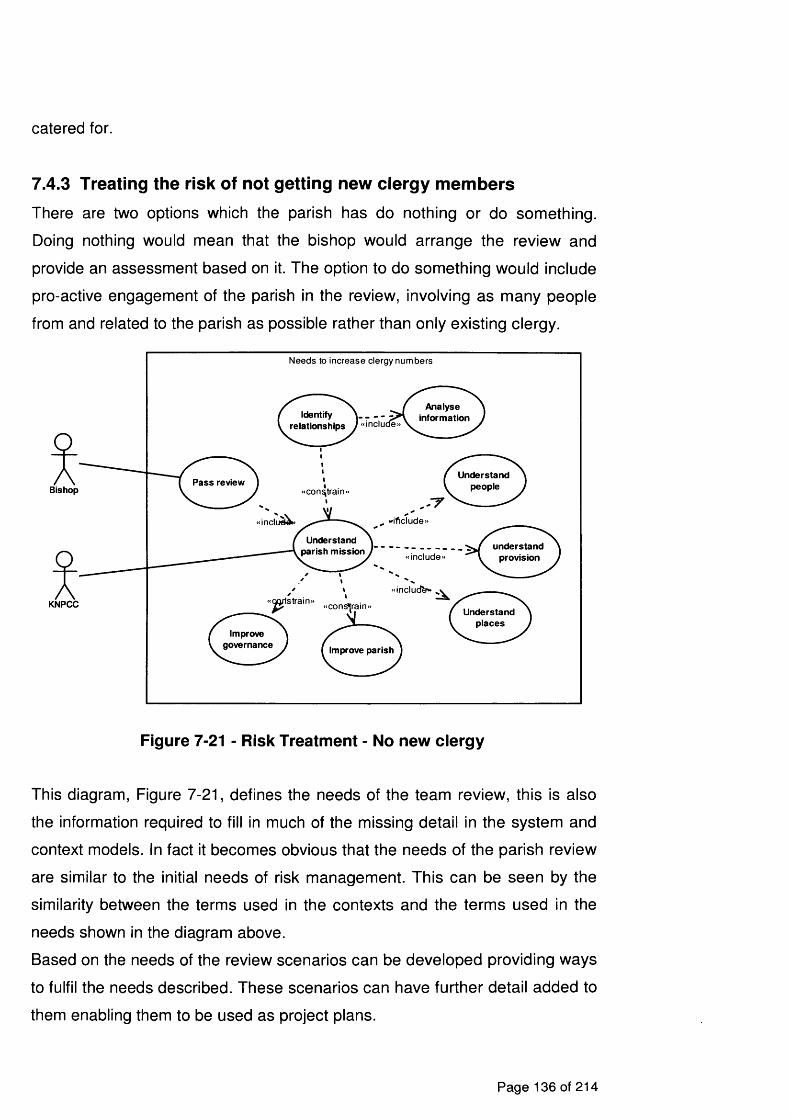
catered for.
7.4.3 Treating the risk of not getting new clergy members
There are two options which the parish has do nothing or do something.
Doing nothing would mean that the bishop would arrange the review and
provide an assessment based on it. The option to do something would include
pro-active engagement of the parish in the review, involving as many people
from and related to the parish as possible rather than only existing clergy.
Bishop
KNPCC
include
Pass review
Improvegovernance
lstrain»
Needs to increase clergy numbers
Identifyrelationships
Understand parish mission
constrain-
Improve parish
include»
Analyseinformation
Understandpeople
Understandplaces
understandprovision
Figure 7-21 - Risk Treatment - No new clergy
This diagram, Figure 7-21, defines the needs of the team review, this is also
the information required to fill in much of the missing detail in the system and
context models. In fact it becomes obvious that the needs of the parish review
are similar to the initial needs of risk management. This can be seen by the
similarity between the terms used in the contexts and the terms used in the
needs shown in the diagram above.
Based on the needs of the review scenarios can be developed providing ways
to fulfil the needs described. These scenarios can have further detail added to
them enabling them to be used as project plans.
Page 136 of 214

AnalysisWorkshop
Stakeholders
Identify PeopleQ
Identify places ()
Identify provision()
Rationalise information()
Request feedbackQ
identify relations hips ()feedbackQ
incorporate feedbackQ
Analyse relationshipsQ
focus groupsQ
Analyse focused informatior)Q
develop metricsQ
apply metricsQ
identifyoutcomesQ
IIV3develop profileQ
Develop job specificationQ i
Figure 7-22 - Risk Treatment - No new clergy
The main approach to gathering information in the initial part of this work is to
be completed through a number of workshops (Figure 7-22), the work uses
workshops to ensure 'buy-in' providing stakeholders with the opportunity to
input to the work and therefore have an emotional tie to the future of the work.
This work is now complete and the information gathered is of great
importance to the parish. The importance is not only in securing clergy
resource but in the ability of the parish to understand and manage its
structure, information and risk in a rigorous and timely fashion.
Page 137 of 214

7.5 ConclusionsThese examples have shown some of the paths through this extensive and
on-going case study. As this is real and ongoing work there are many
commonly seen issues which arise which would be impossible to deal with
accurately and consistently without the aid of processes and ontology.:C once rn ID:C ontext ID :System
M ode llin g:R is k D e fin itio n E v a lu a t io n :R is k T re a tm e n t
In itia l co n ce rn sQ
C ontext re q u ire d ()
ex te rna l co n o e rn ()
R 2 c a u s a l e va lua tionQ
R 2 e ffe c t e vq lu a tio n Q
so lu tio n im p te m e n ta tio n Q
w o rk s h o p ( w o rks hop ()
R1 c a u s a l e \}a lu a tio n ()
R1 e ffe c t e v ^ lu a tio n ()
---------tiny tot()
w o rk s h o p 2()
Figure 7-23 - Project actual Process Instance View
The sheer complexity of this plan, Figure 7-23, showing the execution of the
processes from only the initial set of work emphasises the fact that without a
formalised approach the management of risk, risk management would fall into
disarray providing a stumbling block an inhibitor rather than the enabler that it
Page 138 of 214

should be.
7.5.1 Evidence collection studies
A number of evidence collection studies were conceived, three of which were
completed during the investigative stages of this work. This section provides
an overview of two of the case studies carried out during the development and
verification of this work. Overviews are provided for the ‘Project risk
assessment’ and ‘Competence assessment and professional development’
studies.
The final study focused on the application of the CORAS IT Security tool
where it investigated the transferability of the tool to other areas of risk rather
than the terminology or process for risk management. Details regarding this
study can be found in Appendix A.
The two studies described comprise of an introduction giving an overview and
background, the work carried out in the study (including relevant
documentation from the study) and conclusions of each study providing a
summary of its contribution.
In addition to the studies described in this chapter the principles within this
work have been applied within a number of situations. In some cases this has
supported and improved the work of specific companies within the rail and
defence sectors. In others cases it has been found that the object oriented
nature of the techniques worked against the culture within organisation
meaning that a significant cultural change would be needed before a study
could be carried out.
Page 139 of 214

Study 1 - Project Risk AssessmentThis case study investigates the risks involved in accepting or tendering for
projects, this includes considering cost, time, resource and reputation gained
and lost due to working with specific clients.
Assessment Context
To understand the scope of the assessment the project and business contexts
have been considered.
With no specific project context in place the generic start point discussed in
Chapter 2 has been used and tailored to be relevant to this assessment.
people
Technical
Finance
Make profit
Manage project
constrains
Tailored project context
include
inclucte:
include^
include^
Manage cost
Manage time
Manage resource
Manage income
Figure 7-24 - Tailored project context
Only minor adjustments to the context have been made to the diagram in
Figure 7-24. The requirement of make profit has been added, this requirement
will constrain the assessment ensuring that the final output is related to profit.
The organisations development providing time and cost savings. The
existence of the business context means that only minor alterations have
been made.
Page 140 of 214

Business requirements
Assist local community
Local Community
iptlude»
Carry out researchProjectPromote excellence include»
Academiaextend
< constrains Obtain fundingPeople
includeRinding body
meet tenets
Provide services
■ constrains »
include
Provide consultancyMake money
Rnancial iusiness community
Provide training
Figure 7-25 - Tailored business context
The minor alterations to Figure 7-25 relate to the association of contexts
specifically the project context must be seen here. The people and financial
contexts provide a completeness and support the need to further define these
contexts as and when required.
The system view provides an understanding of the structures in place within
the organisation relating to the assessment of project risk.
Page 141 of 214

worksfor
workson
Project Specific
Days charged Days uncharged Days worked Project income Charge out rate Uncharged cost
Motivation Evidence record Competence score Evidence score Motivation score
Person
Days to work Nl: float SalaryCompany cost Tax
Company specific
Consum able cos Equipment cost Utility cost Building cost chargeable time No. of employees Overhead Profit Margin: int
Company
No. people Project profit Stage: Stage Total project income Total uncharged cost Total days charged Total days worked Total uncharged days Project overhead: int Profit value
Project
Figure 7-26 - System view
The system structure is taken from the company enterprise architecture which
provides all of the information regarding the structure and processes
associated with running of the organisation. The diagram in Figure 7-26 is a
extract from the enterprise architecture which has been further developed to
ensure that all relevant information from the assessment to be carried out can
be collated and retained.
The constraint view provides the mathematical operators and their associated
variables and formulas for implementation in the network
Page 142 of 214

Constraint Person Cost to
Company
Constraint Project Worth
PI - Project Income PP - Project Profit PO - Project Overhead
CC = Company cost Nl = National Insurance S = Salary
PP = P I-P O (): void
Constraint Project Cost to company
Constraint Person cost to client
Constraint Company Profit
CC - Company CostDW - Days workedPO - Project OverheadNP - Number of people on project
DC = Days ChargedPPI = Person income/projectCR = Charge out Rate
PM - Profit Margin PO - Project Overhead
PM = P O *1 .3 (): voidPPI = D C *C R (): voidFor {NP} PO = P O +C C *D W (): void
PI - Project IncomePPI - Person income/projectNP - Number of People on project
For {NP} PI = PI+PPIQ : void
Project RevenueConstraint
PO - Project Overhead PM - Profit Margin PP Project Profit V - Value
IF PP<0 Then V= High Risk()IF PM>PP>=0 Then V= High Risk() IF PP=PM Then V= Medium Risk() IF PP>PM Then V- Low RiskQ
Profit achievedConstraint
Figure 7-27 - Constraint view
The majority of the constraints defined in Figure 7-27 are addition and
multiplication based operators. Profit achieved is slightly different, it provides
an enumeration of the values calculated to this point. The enumeration gives
a high, medium or low result as the final output of the risk assessment.
Parametric viewThe parametric view enables the constraints defined above to be
implemented as a network shown in Figure 7-28.
Project revenueCharge out rate [PPI]
Days Charged ( D C ^
No. People
r srofit achievedProject cost to ^ company
Project worthPerson cost to company
National Insurance[PO][CC]
RiskValue
Salary
Tax
Days Worked f Company profit
Profittarget
Figure 7-28 - Parametric view
Running the network with all the inputs present will provide an output of risk
value from the network
Page 143 of 214

Conclusions Study 1 - Project Risk AssessmentThis case study exercised the context identification and system development
processes from the process set defined in Chapter 5. It also investigated the
use of the SysML parametrics as an approach to developing bespoke risk
assessments. The work on formalising risk assessments has been taken
further since this case study was carried out. The latest status is discussed in
the paper Formalising risk assessment through the use of SysML parametrics
Brownsword and Perry (2009).
This study supported the need to identify relevant contexts within which an
assessment will be applied. The study also highlighted the need to investigate
the effect of the assessment on neighbouring contexts.
The study enabled further definition and clarification of the terms concern and
risk and the need for separation between the concern identification and risk
definition processes.
Page 144 of 214

Study 2 - Competence assessment and professional developmentThis case study investigates competence and professional development as an
area to which the concepts of risk may be applied.
Competence and professional development are areas not normally associated
with Risk or Risk Management. This case study shows that the same
principles are used within competence assessment and risk assessment, the
major difference being that the competence assessment looks for favourable
outcomes i.e. how good an individual is, where as a risk assessment tends to
look for flaws and failures, this ability to consider both sides of risk is
discussed further by Hessami (1999) in Risk - A missed opportunity?
This study starts by understanding the need for the competence assessment
within the organisation before looking at some of the features of the system.
Assessment ContextThe first thoughts in this study were to define the need 'why carry out
professional development', Professional development is one of the main
reasons for carrying out competence assessments, In this case the need has
been defined using a use case diagram, Figure 7-29.
Org
Individual
Businessrequirements
Motivation
con:
ImproveCompetence
i trains
Personal Development
include^
IncreaseCompetence
Demonstratecompetence
Figure 7-29 - Personal Development
The most important thing to understand when undertaking any work is 'why is
this work being carried out'. The intention of the diagram above is to answer
Page 145 of 214

that question, in this case the work is being carried out to Improve
competence of an Individual this is likely to be a member of staff, but may
include students or the wider public.
It is important to know why the work is to be carried out however, this is rarely
of any use without knowing what has to be done; again in this case
competence must be both increased and demonstrated.
This has provided an understanding and record of the need for professional
development and competence assessment to be carried out. This approach,
using use cases to represent requirements or needs, has been used in many
applications providing repeatability in the identification and recording of
needs. Repeatability is one of the main concepts behind formalisation and as
such this may provide a worthwhile approach to defining the needs of a risk
assessment. The semantics behind the diagram above further support
formalisation through the understanding of needs and contexts.
Page 146 of 214
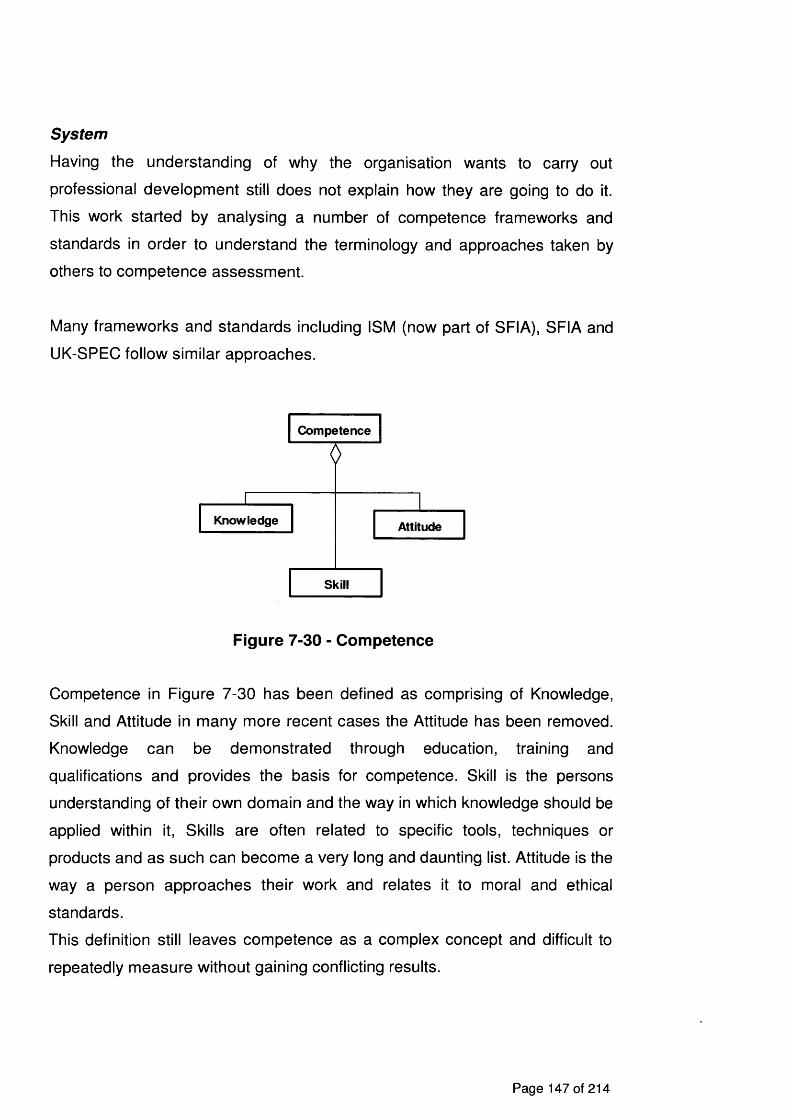
System
Having the understanding of why the organisation wants to carry out
professional development still does not explain how they are going to do it.
This work started by analysing a number of competence frameworks and
standards in order to understand the terminology and approaches taken by
others to competence assessment.
Many frameworks and standards including ISM (now part of SFIA), SFIA and
UK-SPEC follow similar approaches.
Attitude
Skill
Knowledge
Competence
Figure 7-30 - Competence
Competence in Figure 7-30 has been defined as comprising of Knowledge,
Skill and Attitude in many more recent cases the Attitude has been removed.
Knowledge can be demonstrated through education, training and
qualifications and provides the basis for competence. Skill is the persons
understanding of their own domain and the way in which knowledge should be
applied within it, Skills are often related to specific tools, techniques or
products and as such can become a very long and daunting list. Attitude is the
way a person approaches their work and relates it to moral and ethical
standards.
This definition still leaves competence as a complex concept and difficult to
repeatedly measure without gaining conflicting results.
Page 147 of 214

Maps to
relates
Produces ^Work
Competence
Evidence
EvidenceRecord
ProfessionalStandard
Figure 7-31 - Competence evidence
Figure 7-31 shows the generally accepted view of competence, that
demonstration of competence is via the presentation of evidence. Evidence is
to be based on work which has been carried out by the person under
assessment. The difficultly in many cases is clearly relating evidence to the
professional standard.
helps record ►must map toCompetence
IEE
SHA
OrganisationISM Company
Actual modelReferencemodel
Figure 7-32 - standard - work - competence
To support the clear definition of evidence mapped to standards it is useful to
have an organisational model that bridges the gap between work carried out
and the competencies required for demonstration by the relevant standard.
The diagram in Figure 7-32 proposes a high level view to support this idea
showing that the organisational model supports the recording of competence
against the professional standards by providing a mapping between the
organisational competencies and the professional standard.
Page 148 of 214

Conclusions Study 2 - Competence AssessmentThis study supports the concept that risk assessments are domain and
application specific and that although many standard risk assessments from
SWOT to Failure Modes and Effects Analysis (FMEA) exist it each has a
specific purpose and should be used outside its scope with care. Competence
assessment is a domain specific risk assessment for professional
development.
The context and system diagrams set out the information required in the
assessment of competence. It can be seen by the levelling system in place
which is used to assess candidates that there is no space for lack or negative
competence. This sets competence assessment apart from many risk
assessments as it is focused on looking at how well someone can do their
work rather than how badly or how likely they are to fail.
7.5.2 Interpretation/Evaluation of Case studiesThere are a number of benefits which can be observed when using the UML
within the case studies discussed. These benefits are based on the
fundamental principles that the UML itself. The benefits focus on:
• ‘views’ ensuring that multiple contexts have been considered, these may
include hierarchical, positional and procedural views.
• consistency ensuring that the knowledge and understanding which has
been assimilated provides a consistent set across behavioural and static
aspects. This consistency provides confidence that the ‘views’ have
meaning and relevance.
• Integration - the UML with the SysML parametrics enables the reduction in
the gap between contextual and scientific domains.
Many of the approaches and languages discussed in Chapter 4 provide
consistency within their own domains, IDEF 3 for processes and IDEF 5 for
ontologies for example, however they do enable clarity of checking across the
boundaries of domains which the UML with its extensibility provides.
The use of the 7-views approach to process modelling has also provided
benefits within the case studies. The strongest example of these benefits can
Page 149 of 214

be seen in the ability to re-organise or efficiently update the ordering of the
processes when unforeseen circumstances arise. Obviously this ability to
update the ordering of the processes would be much more complex had the
processes been lacking in their definition. Without the knowledge of the
relationships between artefacts and between artefacts and activities the time
to re-order would be inc'reased dramatically.
This work has focused on the contextual issues associated with the
understanding of concerns and risks. The intention is not to suggest that
specific tools such as FMEA, SWOT, FTA etc. should not be used. The
intention is, however, to provide a framework to ensure that these detailed
tools are applied in relevant and focused ways. There have also been a
number of domains which have not been incorporated in detail within this
work including Human Factors (HF) and project management. This is due to
the body of knowledge which already exists in these areas. Again, it is the
intention of this work to provide a framework to integrate with the current
thinking in these areas.
7.5.3 SummaryThese case studies have enabled the generation and understanding of
knowledge regarding risk management. They have in this way aided in the
definition of the processes, methodology and ontology defined by this work.
The table below shows the UML constructs used within each study and
identifies benefits provided in each case.
Page 150 of 214

Table 7-1 - Case Study Usage of UMLUML construct Project Metrics
Use/benefit
Competence
assessment
Use/benefit
CORAS tool
(Appendix A)
Use/benefit
KNPCC
Class diagram Clarity o f
business structure
enabling
development of
metrics
Clarity of system
structure
including
definitions
Definition of
assessment scope
and visualisation
of stakeholders
System concepts
definition,
Object diagram Issue and risk
capture
Deployment
diagram
Visualisation of
locations within
system
Component
diagram
Visualisation of
constructs within
system - without
location
Use case diagram Clarity o f reason
and scope for
carrying out
project
monitoring
Clarity o f context
and business
justification for
carrying out
competence
assessment
Visualisation of
situation analysis
including
definition of
threats and
identification of
treatment
Identification of
system and
assessment
contexts
Sequence diagram Visualisation of
cause and effect
scenarios
Parametric
diagrams
Visualisation of
mathematical
operators and
formula
Although there is value in using each of the diagram types identified in
Page 151 of 214

Table 7-1 individually, a more intangible yet valuable benefit is realised when
the diagrams are used together to ensure consistency. This can be achieved
by following the consistency checks set out within the UML specification. The
multiple, holistic and consistent aspects of the UML provide unique benefit
regarding the use of the UML rather than other approaches such as those
discussed in Chapter 4. For clarity this is due to the lack of internal
consistency between multiple views within many other techniques or loosely
coupled approaches such as IDEF standards.
The objective of this chapter was to demonstrate the applicability of the
processes and ontology defined in this work.
This has been demonstrated through the two paths discussed within this
chapter; the first investigating an health and safety issue relating to scalding
injuries of children and including wider issues into the risk definition and
solution space in a timely fashion based on the information available; the
second investigated governance and resource issues which has prompted an
information gathering exercise and review of the whole organisation.
The availability and application of the processes and ontology have been
shown to benefit the organisations through improved understanding and
communication through formalisation, this in turn has enabled the
identification of relevant concerns and will provide more efficient evaluation of
future risks.
Outside this work the principles defined within are continually applied within
Brass Bullet Ltd. supporting project and business development. They have
also been applied by the author within governmental and professional bodies
and engineering organisations within the rail and defence sectors.
Page 152 of 214

8 Conclusions
8.1 IntroductionChapter six described two threads through one of the case studies carried out
during this work, it concluded that the processes and ontology defined by the
work could be used ir; a pragmatic way to provide a formalised approach to
the management of risk. This chapter collates the conclusions from each
chapter and shows where each of the overall objectives of the work have
been meet. It also defines further work which could be carried out to further
develop this work.
8.2 Case study evaluationThe case study supports the overall objective of this work. It shows the
benefits of using a formalised, pragmatic approach to risk management. This
is highlighted by the ability to change the methodology in a pragmatic way
without losing control of the risk management activities or association with the
items within the study.
The study applied all of the processes defined within chapter 6 with negligible
issues in the application. Issues with the use of these processes and ontology
are related to the culture of the applying organisation rather than technical
issues with the activities and artefacts within the processes. The cultural
issues include a lack of basic understanding of the terminology to be used, a
lack of ability to abstract away from details and the inability to be open to a
different way of working.
In the main case study the application of the processes defined in Chapter 6
And ontology defined in Chapter 5 enabled the organisation to understand
and prioritise concerns before establishing risks vastly reducing the number
and complexity of the risks faced.
Limitations with this work include:
• The cultural change required in many organisations to use a pragmatic
methodology for risk
Page 153 of 214

• The perceived lack of application of the processes and ontology to
engineering and business applications due to the main study not
directly residing in one of these domains.
It is reasonable to generalise the results of this work suggesting that the
processes and ontology defined within will apply to engineering and business
based organisations. This ability to generalise is based on the observations
made within engineering organisations where the principles behind these
processes have been applied and the relationship between the processes and
ontology and the international standards which are already general in nature.
8.3 Summary of ChaptersChapter 1 presented the aims and objectives of this thesis detailing the
contribution of each chapter.
Chapter 2 presented issues with the risk management process and the
underlying terminology associated with risk management which exists in
general literature and standards. The chapter identifies the need for a
formalised approach to the processes and terminology of risk. It also
concludes that as tools and techniques are for the most part industry and
application specific therefore the detailed implementation of risk assessment
would not be considered by the rest of this work.
Chapter 3 presented the methodology for the research and recognises the
need for a phenomenological perspective and identifies issues with using a
phenomenological in a generally positivist domain.
Chapter 4 discussed the requirements for a model based framework to
formalise risk management and proposed the Unified Modelling Language
(UML) as a language capable of delivering this formalisation. Formalisation in
this work ensures that consistency, repeatability, multiple views and pragmatic
application are all considered. This chapter identifies the UML along with the
Systems Modelling Language (SysML) profile of the UML as the only tool,
Page 154 of 214

from those investigated by this work, to fulfil all of the requirements defined.
The tools considered exhibited two main weaknesses, either their focus was
on static or behavioural modelling or a lack of consistency was identified
meaning that consistency checking between ontology and process views
would become increasingly complex.
Chapter 5 defined risk and presented an ontology for risk management
incorporating the definitions and relationships for terminology which is often
confused and mis-used. The ontology of any industry is fundamental. Without
a clear understanding of the terms used within the domain and the
relationships between those terms it is difficult to clearly communicate within
the domain and almost impossible to teach. This ontology provides the ability
to improve the teaching of risk management at a grass routes level.
Chapter 6 defined the processes to be use when implementing risk
management. The chapter presented requirements, behaviour and
information views of the risk management processes, ensuring that multiple
views can be considered and consistency check when applying the
processes. The use of object orientation ensures that the processes support a
multi-view, consistent application whilst modularisation ensures that they can
be used in a pragmatic manner. Following the definition of the processes
theoretical and pragmatic methodologies for their application have been
defined, the pragmatic methodology is based on the use of the processes
within case studies.
Chapter 7 demonstrated the application of the processes and ontology
through the presentation of two threads within one of the case studies
completed during the execution of this work. These threads show the
applicability of the processes and ontology to organisational, project and
health and safety issues.
Page 155 of 214

8.4 Conclusions by ObjectiveThe primary aim of this thesis was to develop a formalised approach to the
management of risk using a model based approach. This addresses the lack
of formalisation across risk management in many industries, applications and education.
To achieve the overall aim both terminology and processes related to risk
have been understood and formalised. Formalised ontology and processes
have been developed and demonstrated through a number of threads
abstracted from a case study.
This section maps the main conclusions from each chapter to the Objectives
set out in Chapter 1. It explains where each has been defined and details why
the cases study threads show that these definitions, approach and
methodology provide a formalised approach to the management of risk.
• Chapter 2 - the purpose of which was to review and understand the
terminology and processes related to risk management. Has presented
a view of risk management which has at a high level been unchanged
for many years. The changes that have been suggested and made in
this latent period have confused the terminology and process further.
This chapter has highlighted the process confusion and issues with
terminology enabling an improved definition to be made.
• Chapter 4 - the purpose of which was to discuss the requirements for a
model based framework for the formalisation of risk management and
propose a framework which fulfils the requirements. Has identified and
justified a formalisation tool which is not only relevant to risk
management but to all areas requiring formalisation of ontology and
process.• Chapter 5 - the purpose of which was to define risk and present an
ontology for risk management. Has presented a clear concise candidate
definition for risk and shown the ontology in which this definition resides.
This provides a clear set of terminology enabling improvement of the
implementation and teaching of risk management.
Page 156 of 214

• Chapter 6 - the purpose of which was to define the processes required
to carry out risk management using a multi-view approach. Has
presented multiple views of the key processes required to carry out risk
management. These views have provided a modular, consistent and
multi-view approach to risk management.
• Chapter 7 - the purpose of which was to demonstrate through
application the applicability of the processes and ontology. Has shown
the application of the processes and ontology to business and health
and safety issues. This has enabled the improved management of risk
within the organisation under consideration.
8.5 ContributionsThe individual contributions made by this work are:
• Provision of independent interpretations and analysis of international
standards related to risk management.
• Provision of improved access to relevant areas of international
standards and frameworks through the overview models described.
• Provision of a comparison of description languages for formalisation.
• Provision of a related view of the terminology of risk management.
• Provision of a set of risk management processes, including their
behaviour, requirements and artefacts using the seven-views approach.
• Provision of a pragmatic methodology for processes application
enabling pro-active management of change.
• Provision of a worked example approach to the application of the
processes and ontology through the case study.
Page 157 of 214
8.6 Further workThis section defines a number of opportunities for further work within
academic and industrial arenas.
8.6.1 AcademicIt is expected that industry and application specific ontologies will be defined
and mapped to the ontology within this work. This will provide an improved
communications medium for those working in different sectors ensuring that
consistent meaning is interpreted when different words are used. The
ontology within this work may also be updated specifically with reference to
the use of the term 'Hazard' as it is not yet clear as to whether a hazard is a
risk but from another stakeholders perspective or if it is a cause of an
outcome. There is a specific need for further research into the generic
concepts and definitions of hazards with the purpose of enabling a clear
relationship to be drawn between hazards and risks.
With so many authors defining tailored risk assessments a formalised
approach to the definition of bespoke risk assessments to complement the
risk management approach defined within this work would is required. Such
an approach should provide improved re-use of existing assessments,
improved understanding of the relationship to the system under consideration
and clear traceability between bespoke and generic risk assessments. This
may include the modelling and tracing of existing risk assessments providing
a clear understanding of how they related to the source and product variables
with which they are concerned.
The use of a formalised approach to risk should support the definition of
complete sets of risks for products and systems. However there is a
complexity in the verification of completeness of these sets of risk. The
application of an additional tool such as metrics to the risk set to give
confidence merits investigation.
Page 158 of 214

8.6.2 IndustrialThe processes and ontology defined within this work are regularly applied
within Brass Bullet Ltd and the Kings Norton PCC. This approach is adding
value to the management of financial, organisational and project risk within
these organisations. Interest has been shown by the IET and NCC in applying
the processes and ontology to the Enterprise architecture and Systems
Engineering project which they are undertaking. This is will investigate the use
of the processes within the change management aspects of enterprise
architecture.
Page 159 of 214

References
Standards Australia and Standards New Zealand (1999), AS/NZS 4360
Risk Management
Standards Australia and Standards New Zealand (2004), AS/NZS 4360
Risk Management
Adhitya, A., Srinivasan, R., Karim, I.A. (2007), A model based
rescheduling framework for managing abnormal supply chain events,
Computers and Chemical Engineering Vol. 31 pp. 496-518
Aggarwal, P. and Ganeshan, R. (2007), Using risk management tools on
B2Bs: An exploratory investigation, Int. J. Production Economics vol. 108
PP 2-7
Ale, B.J.M. (2005), Living with risk: a management question, Reliability
Engineering and System Safety Vol. 90 pp 196-205
Aven, T. (2003), Foundations of Risk Analysis: A Knowledge and Decision-
oriented Perspective, WileyBlackwell
Aven, T. and Kristensen, V. (2005), Perspectives on risk: review and
discussion of the basis for establishing a unified and holistic approach,
Reliability Engineering and System Safety Vol. 90 pp 1-14
British Standards Institution (1996), BS 8444-3 Risk Management - Part 3:
Guide to risk analysis of technical systems.
British Standards Institution (2000), BS 6079-3:2000 Project management
- Part 3: Guide to the management of business related project risk
Page 160 of 214

Baclawski, K., Kokar, M., Kogut, P., Hart, L., Smith, J., Holmes, W.,
Letkowski, J. and Aronson, M. (2001), Extending UML to support ontology
engineering for the Semantic Web. In Fourth International Conference on
the Unified Modeling Language, M. Gogolla, C. Kobryn (Ed), pages 342-
360. Lecture Notes in Computer Science 2185:342-360. Springer-Verlag.
Barrow, R. (2005), Setting New Boundaries - Applying the UML to Railway
Standards, The IEE Seminar on: UML for Systems Engineers
Bayley, C. (2004), Modelling Interlocking Systems with UML, IEE System
Safety Conference
Belzer, R.B. (2001), Getting beyond 'grin and bear it' in the practice of risk
management, Reliability engineering and system safety
BLOOM, B.S. (ed.) (1956), Taxonomy of Educational Objectives, the
classification of educational goals - Handbook I: Cognitive Domain New
York: McKay
Boehm, B.W. (1988), A Spiral Model of Software Development and
Enhancement, IEEE Computer
Boehm, B.W. (1989), Tutorial: Software Risk Management, IEEE
Computer
Boiss, A.C. (2005), Risk Analysis and Risk Management using UML, MSc
Case Study, Cardiff University
den Braber, F., Lund, M. S., Stolen, K., Vraalsen, F. (2005), Integrating
security in the development process with UML, in MehdiKhosrow-Pour
(ed), Encyclopaedia of Information Science and Technologypages pp.
1560-1566
Page 161 of 214

den Braber, F., Mildal, A.-B., Nes, J., Stolen, K., Vraalsen, F. (2006),
Experiences from Using the CORAS Methodology to Analyze a Web
Application, Journal of Cases on Information Technology
Broendeland, G. and Stolen, K. (2004), Using risk analysis to assess user
trust -a net-bank scenario, Second International Conference on Trust
Management (iTrust'04)
Brownsword, M., Setchi, R. (2007), Putting Risk into Context, IET system
safety conf
Brownsword, M., Perry, S. (2009), Formalising risk assessment through
the use of SysML parametrics, INCOSE
Brownsword, M., Setchi, R. (2005), Picturing Risk - Connecting Industries,
The IEE Seminar on: UML for Systems Engineers
CENELEC (1999), EN 50126: Railway applications - The specification and
demonstration of Reliability, Availability, Maintainability and Safety (RAMS)
Cl PS (2007), Risk Management Practice Guideline
Cacciabue, P.C. (2005), Human error risk management methodology for
safety audit of a large railway organisation, Applied Ergonomics Vol 36 pp
709-718
Carr, M.J., Konda, S.L., Monarch, I., Ulrich, F. (1993), Taxonomy-Based
Risk Identification, SEI Carnegie Mellon University
Clarke, L. (2007), Thinking possibilistically in a probabilistic world,
Significance statistics making sense, Royal statistical society
Page 162 of 214
Cranefield, S. and Purvis, M. (1999), UML as an ontology modelling
language, CEUR
Dalla Valle, L. and Giudici, P. (2008), A Bayesian approach to estimate the
marginal loss distributions in operational risk management, Computational
Statistics & Data Analyssis Vol. 52 pp 3107-3127
Davis, J.R., Fogarty, J.A. and Richard, E.E. (2008), Human health and
performance risk management an approach for exploration missions, Aeta
Astronautica Vol.63 pp. 988-995
Delvosalle, C., Fievez, C., Pipart, A., Casal Fabreg, J., Planas, E.,
Christou, M., Mushtaq, F. (2005), Identification of reference accident
scenarios in SEVESO establishments, Reliability Engineering and System
Safety Vol. 90 pp. 238-246
Dikmen, I., Birgonul, M.T., Anac, C., Tah, J.H.M. and Aouad, G. (2008),
Learning from risks: A tool for post project risk assessment, Automation in
Construction Vol. 18 pp. 42-50
AN SI/E IA (1999), El A 632: Processes for Engineering a System.
Faith, N. (2000), Derail: Why Trains Crash, Channel 4 Books
Flage, R. and Aven, T. (2009), On treatment of uncertainty in system
planning, Reliability Engineering and System Safety Vol. 94 pp. 884-890
Gamper, C.D. and Turcanu, C. (2009), Can public participation help
managing risks from natural hazards?, Safety Science Vol. 47 pp. 522-528
Giralt, C. (2002), Petri Nets for Systems Engineering, Springer
Page 163 of 214

Haplin, T. and Morgan, T. (2008), Information Modeling and Relational
Databases, Morgan Kaufmann
Han, S.H., Kim, D.Y., Kim, H., Jang, W. (2008), A web based integrated
system for international project risk management, Automation in
Construction Vol. 17 pp.342-356
Harvey C.R. (Undated), Campbell R. Harvey's Hypertextual Finance
Glossary, http://www.duke.edu/~charvey
Electronically accessed 22 April 2009
Hess, J. and Bernard, O. (2008), Design and study of a risk management
criterion for an-unstable anaerobic wastewater treatment process, Journal
of Process control Vol. 18 pp. 71-79
Hessami A. (1999), Risk - A Missed Opportunity?, Risk and Continuity Vol.
2 pp. 17-26
Hollnagel, E. (2008), Risk + Barriers = Safety?, Safety Science Vol. 46 pp.
221-229
Holt, J.D. (2004), Those who can - use ISO IEC 15288, INCOSE Spring
conference
Holt, J.D. (2005), A Pragmatic Guide to Business Process Modelling, BCS
Holt, J.D. (2007), UML for Systems Engineering: watching the wheels
Holt, J.D. (2009), Enterprise architecture - systems engineering in the mist,
INCOSE
Hughes, B., Cotterell, M. (1999), Software Project Management, McGraw-
Hill
Page 164 of 214

Hunt-Sturman, A. and Jackson, N. (2009), Development and evaluation of
a risk management methodology for pedestrian surfaces, Safety Science
Vol. 47 pp. 131-137
ICAEW (2002), Risk management for SMEs
Knowledge Based Systems, Inc. (1994), IDEF5 Method Report
Knowledge Based Systems, Inc. (1995), IDEF3 Process description
capture method report
I EC (1998), I EC 61508 Functional safety of
electrical/electronic/programmable electronic safety-related systems
IEEE (1998), IEEE Std 1220-1998 IEEE Standard for Application and
Management of the Systems Engineering Process -Description
INCOSE (1996), Systems Engineering Capability Assessment Model
INCOSE (2007), Systems Engineering Handbook
IRM, AIRMIC & ALARM (2002), A Risk Management Standard
ISO (1985), ISO 5807-1985, Information processing - Documentation
symbols and conventions for data, program and system flowcharts,
program network charts and system resources charts
ISO (2002), BS ISO 15288:2002 Systems engineering - System life cycle
processes
Page 165 of 214
ISO (2004), ISO 10303-11 Industrial automation systems and integration -
Product data representation and exchange - Part 11: Description
methods: The EXPRESS language reference manual
ISO (2006), ISO 16085 Systems and software engineering - Life cycle
processes - Risk management
ISO (2007), ISO/IEC CD Guide 73 Risk Management - Vocabulary
ISO (2008a), BS ISO 31000 Risk Management - Principles and guidelines
on implementation
ISO (2008b), ISO 31010: Risk Management - Risk Assessment Techniques
ITU-T (1999), Specification and description language
Jacobson, I., Booch, G. and Rumbaugh, J. (1999), The Unified Software
Development Process, Addison-Wesley Professional
Jenkins, R.E., Brown, R.D.H., Phillips, M.R. (2009), Harbour porpoise
(Phocoena phocoena) conservation management: A dimensional
approach, Marine Policy
Kaplan, R. S. and Norton, D. P. (1992), The Balanced scorecard:
measures that drive performance, Harvard Business Review
Kirchsteiger, C. (2008), Carbon capture and storage desirability from a risk
management point of view, Safety Science Vol. 46 pp. 1149-1154
Kirstensen, V., Aven, T., Ford, D. (2006), A new perspective on Renn and
Klinke's approach to risk evaluation and management, Reliability
Engineering and System Safety Vol. 91 pp. 421 -432
Page 166 of 214

Krogstie, J. (2008), Using EEML for combined goal and process oriented
modeling: A case study, Proceeedings of EMMSAD
Lee, E., Park, Y., Shin, J.G. (2009), Large engineering project risk
management using a Bayesian belief network, Expert Systems with
Applications Vol. 36 pp. 5880-5887
Leveson, N.G. (1995), Safeware, system safety and computers, Addison-
Weslyey Professional
Lund, M., Braber, F., Stolen, K., Vraasen, F. (2004), A UML profile for the
identification and analysis of security risks during structured brainstorming,
Sintef ICT
MOD (2007), The MOD Architecture Framework (MODAF) Version 1.1
Mazouni, M. and Aubry, J. (2007), A PHA based on a systemic and
generic ontology, IEEE/INFORMS International Conference on Service
Operation and Logistics and Informatics
McConnell, S. (1996), Software Quality at Top Speed, Software
Development Vol. 4 pp. 38-42
McNeillis, P. (2005), Cognitive Mapping and UML Modelling Comparing
Book and Mind, The IEE Seminar on: UML for Systems Engineers
Miller, G. (1956), The Magical Number Seven, Plus or Minus Two: Some
Limits on Our Capacity for Processing Information, The Psychological
review
Page 167 of 214

Mohaghegh, Z., Kazemi, R. and Mosleh, A. (2009), Incorporating
organizational factors into Probabilistic Risk Assessment (PRA) of complex
socio-technical systems: A hybrid technique formalization, Reliability
Engineering and System Safety Vol. 94 pp. 1000-1018
NATO (1997), NATO quality assurance requirements for software
development AQAP-150
Neiger, D., Rotaru, K., Churilov, L. (2009) Supply chain risk identification
with value-focused process engineering, Journal of Operations
Management Vol. 27 pp.154-168
Nicola, A., Kabilan, V., Missikoff, M. and Mojtahed, V., (2007), Practical
Issues in Ontology Modeling: The Case of Defence Conceptual Modeling
Framework-Ontology, in Doumeingts et al, Enterprise Interoperability,
Springer London
Nilsen, A.S. (2008), Tools for empowerment in local risk management,
Safety Science Vol. 46 pp. 858-868
OMG (2007), OMG UML Specification
OMG (2008a), Business Process Modeling Notationm, V1.1
OMG (2008b), UML(TM) Profile for Modeling Quality of Service and Fault
Tolerance Characteristics and Mechanisms Specification
OMG (2008c), OMG SysML Specification
Olsen, O.E. and Lindoe, P.H. (2008), Risk on the ramble: The international
transfer of risk and vulnerability, Safety Science
Page 168 of 214
Peckham, J. and MacKellar, B. (2001), Generating code for engineering
design systems using software patterns, Artifical Intelligence in
Engineering Vol. 15 pp. 219-226
Perry, S. (2006), When is a Process Model Not a Process Model - A
Comparison between UML and BPMN, IEE seminar on Process Modelling
using UML
Pezzullo, L. and De Filippo, R. (2009), Perceptions of industrial risk and
emergency management procedures in Hazmat Logistics: A qualitative
mental model approach, Safety Science Vol. 47 pp. 537-541
Redmill, F. (2002), Risk analysis - a subjective process, Engineering
Management Journal
Remenyi, D. (1998), Doing research in business and management, Sage
Publications
Remenyi, D. and Heafield, A. (1996), Business process re-engineering:
some aspects of how to evaluate and manage the risk exposure,
International Journal of Project Management Vol. 14 pp. 349-357
Restrepo, C.E., Simonoff, J.S. and Zimmerman, R. (2008), Causes, cost
consequences, and risk implications of accidents in US hazardous liquid
pipeline infrastructure, International Journal of Critical Infrastructure
Protection
Roland, H.E. and Moriarty, B. (1990), System Safety Engineering and
Management, Wiley-IEEE
Royce, W. (1970), Managing the Development of Large Software Systems,
Proceedings of IEEE WESCON 26
Page 169 of 214

Senge, P. (2006), The Fifth Discipline: The Art & Practice of The Learning
Organisation, Random House Business Books
Sheard, S.A. (1997), The Frameworks Quagmire, Crosstalk: The Journalof
Defense Software Engineering Vol. 10, No. 9
Some, S.S. (2006), Supporting use case based requirements engineering,
Information and Software Technology Vol. 48 No. 1pp. 43-58
Somerville, I. (2007), Software engineering, Addison Wesley
Spies, M. (2006), Vocabularies, Ontologies and Rule for the Enterprise
(VORTE), IEEE enterprise distributed object conference
Stevens, P. and Pooley, R. (2005), Using UML: Software engineering with
Objects and Components, Addison Wesley
Stevens, D.E. and Thevaranjan, A. (2009) A moral solution to the moral
hazard problem, Accounting, Organizations and Society
Storey, N. (1996), Safety critical computer systems, Addison Wesley
Vraalsen, F., den Braber, F., Hogganvik, I., Soldal Lund, M., Stolen, K.
(2004), The CORAS Tool-Supported Methodology for UML-Based Security
Analysis, S IN TE FIC T
Vraalsen, F. , Lund, M.S., Mahler, T., Parent, X., Stolen, K. (2005)
Specifying Legal Risk Scenarios Using the CORAS Threat Modelling
Language -Experience and the Way Forward. , Third International
Conference on Trust Management (iTrust'05)
Page 170 of 214
Webb, K, and White, T. (2005), UML as a cell and biochemistry modelling
language, Biosystems Vol. 80 Issue 3 pp. 283-302
Woodruff, J.M. (2005), Consequence and likelihood in risk estimation: A
matter of balance in UK health and safety risk assessment practice, Safety
Science Vol. 43 pp. 345-353
Wu, D. and Olson, D.L. (2008), Supply chain risk, simulation, and vendor
selection, International Journal Production Economics Vol. 114 pp. 646-
655
Yin (1998), The abridged version of case study research’, in Bickmen, L.
and Rog, D.J. (ed.), Handbook of applied social research methods, pp
229-284. Sage Publications
Zachman, J.A. (1997), Enterprise Architecture: The Issue of the Century,
Database Programming and Design,
Zwikael, O. and Sadeh, A. (2007), Planning effort as an effective risk
management tool, Journal of Operations Management Vol. 25 pp. 755-767
Page 171 of 214

A. - Restoration project study
IntroductionThis appendix provides an overview of the case study which investigated the
relevance of the CORAS tool to risk management outside of the IT Security
sector for which it was designed. In this case the tool has been applied to the
Kings Norton restoration project.
Restoration project business riskThe restoration project case study focuses on the use of Strengths
Weaknesses, Opportunities and Threats (SWOT) analysis as a basis for
defining a business case to justify the sustainable re-development of heritage
buildings.
The case study presents the workshop results and investigates the
relationships between the areas identified within the workshops. The analysis
uses mappings and weightings to priorities the strengths and opportunities for
inclusion in the business case.
The CORAS methodology (Vraalsen et al 2004) for carrying out security
analysis was also applied to this case study to analyse the ability to apply the
assessment tool outside its intended domain. This analysis was carried out by
Boiss (2005).
KN restoration
Kings Norton Parish is a diverse community with a range of incomes, living
standards and backgrounds. The Old Grammar School, Saracen’s Head, St
Nicolas Church, its churchyard and The Green together form one of the
largest complex of medieval buildings in Birmingham, and are therefore a
matter of immense pride and tradition for the local community. However,
funding and usage issues mean that the buildings are in need of repair,
restoration, conservation and maintanance.
The Kings Norton Parochial Church Council is responsible for these three
significant buildings. Together with the local community, the church created a
vision for restoring these buildings and improving the provision and utilisation
Page 172 of 214

of these facilities. The Kings Norton Restoration Project is the tangible form of
that vision and has grown out of many years of work by volunteers on the
buildings.
The project is particularly concerned with the restoration and conservation of
the Old Grammar School and the Saracen’s Head. The Old Grammar School
is a beautiful timber-framed structure that has sadly fallen into decay and is on
English Heritage's "at risk" register. After continuing as a school for
approximately two hundred years, the building fell into neglect at the
beginning of the 19th century. Repairs were made in 1910 when a new
external staircase was put in and again in 1951 after vandalism and further
decay had taken their toll.
The nearby Saracen's Head was quite possibly the largest house of the royal
manor during the 16th century. Currently being used as Parish offices and
structurally intact, the house boasts highly decorative medieval workmanship,
and the sophisticated building techniques confirm that the property held high
status.
Through the Restoration Project, the community, Church, Sponsors and all
well wishers hope to realise the dream tha t:
“The Grammar School would be restored and reopened as an educational
facility for school parties. Classes on local history and how children were
taught in the time of Thomas Hall would be held. In order for this scheme to
work, the Saracen's Head will also need restoring, to provide facilities,
disabled access, toilets, etc. The Saracen's Head will also function as a
mixed-use community facility for Parish and secular activities, serving the
people of Kings Norton.”
The core aims and goals of the Project can be broken down into four key
areas:
• Heritage: To conserve and restore all that is most valuable in the local
Page 173 of 214

heritage;
• Community: To develop full use for very varied church and community needs;
• Education & Training: To develop full access and interpretation of the
buildings and other local heritage; and
• Sustainability: Conserve and restore the rich local heritage and ensure
that the buildings have a sustainable future.
In August 2004 Kings Norton’s Saracen’s Head together with the Old
Grammar School won the second series of the BBC2 Restoration programme.
In addition to the money raised by this programme the Heritage Lottery Fund
(HLF) approved the restoration proposals for the HLF grant application Stage
1. The project team is currently working towards the Stage 2 grant application
which it was hoped would be completed towards the end of 2005 but is still
awaiting final approval.
The Restoration Project means a lot to the Church and the people living in
and around Kings Norton; Hence the considerable time, money and human
effort being invested in this project to produce effective results. This project
not only reflects the economic aspirations of the community but is also closely
woven into its emotional fabric. For a project of this scale which will have a
significant economic and quality of life impact on the whole community, it is
important to perform risk analysis and management, to prepare for and be
aware of the weaknesses and vulnerabilities in this project. The risk analysis
must be taken into acount in any decision making process related to the
project. Where the level of risk is high mitigating control measures should be
put in place.
Restoration Project Context Identification
At the heart and soul of this project is the need to restore and conserve
historic buildings, at the same time finding full use for them. Various groups of
people like the Church, Management Committee, Architects etc come
together to arrive at a Business Plan for the project. The plan is based on
various feasibility criteria and have to satisfy certain requirements along with
Page 174 of 214

R e q u ire m e n t^
Church & Community
Restoration and Sustenance Plan for the two buildings
Analysis Experts/ Consultants
Analysis Reports
Consultants/Surveyors
Builders/Architects
KNPCC Management Sponsors/Committee Financers
upholding the main aims of the project.
Figure A-1 - Project view
Figure A-1 uses UML models and text (Broendeland and Stolen 2004), the
requirements are those related to the ultimate customers of this project, such
as the Church and the local community.
Identify Context, as discussed in a paper on Risk Scenarios by Vraalsen et al
(2005), involves the activities below:
• Definition of Risk Management Context;
• Evaluation of Target;
• Stakeholder Identification;
• SWOT analysis; and
• Asset Identification and valuation.
Throught these activities the following will be identified:
• The target owners for risk analysis;
• Purpose of this analysis;
• Assets;
• Scope of the analysis; and
• Risk acceptance criteria.
Page 175 of 214

The first of these activities - definition of risk management context - involves
documenting meta information about the process and includes:
• Process Information;
• Domain metrics; and
• Risk acceptance criteria.
Process Information details how and when analysis is completed. For the
Restoration Project, the risk analysis and management process is based on
discussions with the local community and the management body. The
information obtained is used for analysis.
The Domain Metrics which need to be defined for the Restoration project are
as follows:
• Asset Values;
• Consequences Values;
• Frequency Values; and
• Risk Levels.
The final goal of the Restoration Project is the conservation and sustenance
of the medieval buildings. Due to the nature of the project and the intangible
nature of the assets, it is important to keep in mind that the values being
defined here are qualitative in nature rather than quantitative, being based on
historical and statistical data. Table A-1 shows the asset values identified for
the project as a result of analysis based on workshops carried out with
representatives of the people of the church.
Asset Value Description
Very Low If it does not in any way hurt or reflect the
sentiments of the community.
Low If it does not in any way hurt or reflect the
sentiments of the community.
High If it is associated with the sentiments of the
community.
Very High If it is associated with the sentiments of the
community and is important for the restoration of
the buildings.
Table A-1 Asset Values
Page 176 of 214

Time, Cost and Quality are three factors on which the Restoration project
cannot compromise. Hence the consequence values, shown in Table A-2, are
defined in terms of these three factors.
ConsequenceValue
Description
Insignificant If it does not in any way affect the cost, quality or length
of the project.
Minor If it does not in any way result in the loss of time, cost
or quality.
Moderate If it involves more costs than estimated.
Major If it delays the process and sabotages the chances of
grant approval.
Catastrophic If it causes delays, increases the costs of service and
also reduces the quality of work. E.g. Failure of Stage 2
Submission, Level of eligibility < 100%, failure of the
grant application, etc.
Table A-2 Consequence Values
Frequency values are ranges defined by quanatative data described through
examples or probabilities on a continuous scale. Table A-3 defines the
frequency values for the Restoration Project.
FrequencyValue
Description( Probability)
Rare The probability of which is not likely at all.
Unlikely The probability of which is not very likely.
Possible A situation which could happen within the application
period.
Likely Highly possible.
Certain Will happen within the application period.
Table A-3 Frequency Values
Page 177 of 214
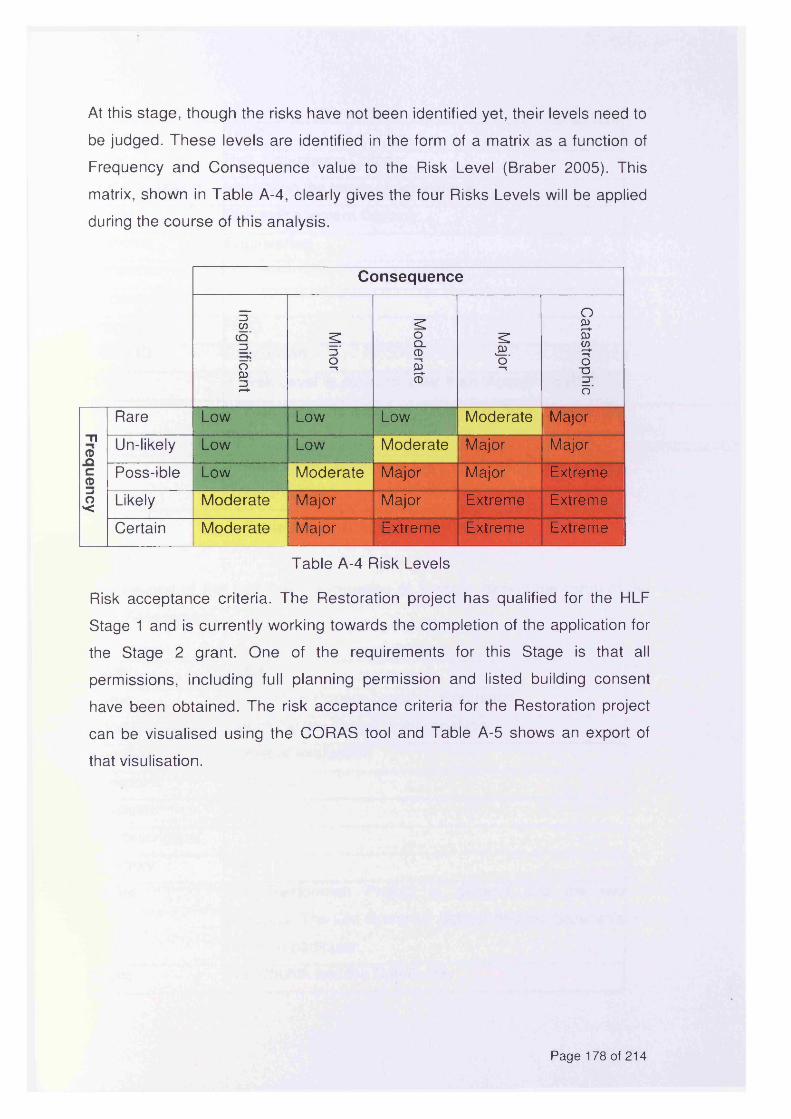
At this stage, though the risks have not been identified yet, their levels need to
be judged. These levels are identified in the form of a matrix as a function of
Frequency and Consequence value to the Risk Level (Braber 2005). This
matrix, shown in Table A-4, clearly gives the four Risks Levels will be applied
during the course of this analysis.
Consequence
Insignificant
Minor
Moderate
Major
Catastrophic
Rare Low Low Low Moderate MajorTl0o
Un-likely Low Low Moderate Major MajorC0
Poss-ible Low Moderate Major Major Extreme—jO< Likely Moderate Major Major Extreme Extreme
Certain Moderate Major Extreme Extreme Extreme
Table A-4 Risk Levels
Risk acceptance criteria. The Restoration project has qualified for the HLF
Stage 1 and is currently working towards the completion of the application for
the Stage 2 grant. One of the requirements for this Stage is that all
permissions, including full planning permission and listed building consent
have been obtained. The risk acceptance criteria for the Restoration project
can be visualised using the CORAS tool and Table A-5 shows an export of
that visulisation.
Page 178 of 214

Type: Table
Name: Risk Acceptance Criteria
Short description: Identifying the levels of acceptance
Concern: Risk management Context
Viewpoint: Engineering
Finalised:
Full description:
Category RMC
Criteria ID Description
C1 If ‘Risk Level’ is equal to ‘Low’ then ‘Accept the Risk’
C2 If ‘Risk Level’ is equal to ‘Moderate’ then ‘Monitor the
Risk’
C3 If ‘Risk Level’ is greater than or equal to ‘Major’ then
Treat the Risk’
Table A-5 Risk Acceptance Criteria
The second of the activities - Evaluation of Target - details the focus of the
Risk Assessment.
Type: Table
Name: Restoration Project-Target of Evaluation
Short description: Identifying the Target of this analysis
Concern: Target of evaluation
Viewpoint: Information
Finalised:
Full description:
Category ToE
Target The Restoration Project in general and the two
buildings, The Old Grammar School and the Saracen’s
Head, in particular
Client The Church and the Community
Page 179 of 214

Service/ Function Description of which parts of the system or organisation
in question are being analysed, including e.g.
references to diagrams or other relevant
documentation.
Quality aspects Restoration and Sustenance of these buildings, their
availability for community use.
Table A-6 Evaluation of Target
Using the CORAS Tool the evaluation of the target can be expressed in a
tabular form as shown in Table A-6. This clearly identifies and demarcates the
Target, Client, Service and Quality aspects involved in the project.
The third activity - Stakeholder Identification - is used to identify groups with
an interest in the project. Stakeholders can be catagorised into groups such
as Customer, Sponsor and Supplier and are defined in Figure A-2.
Stakeholderzs
Sponsor
;zvSupplier
Community Internal“ TV
External
is :
Church | | Architect | | Consultant |
Surveyor
Figure A-2 - StakeholdersThe CORAS tool allows an expansion of this diagram using a table to give
specific information about each stakeholder.
The fourth activity - SWOT Anaslysis - involves the understanding of
Strengths, Weaknesses, Opportunities and Threats from Stakeholder
perspectives. A workshop was conducted with Stakeholders in order to
understand the current position and best direction for the Project. The
objective was to identify the opportunities which can be successfully exploited
and any strengths which will aid in their exploitation.
Page 180 of 214

SWOT«E n terp rise Assets?>
Restoration o f the \buildings «Enterprise O pportunity»
Chances for increased Incorr and use o f the buildipgs
« S tak eh o ld e r»
Church
«E nterp rise Asset>s—■
Increased facilities and«E nterprise W eakness»
High maintenance costs of hejmildings
« S tak eh o ld e r»
Community
«Enterprise S trength»
Committed and Concerned local authorities and the
Community
«E nterp rise A s s e t»
Faith, Trust etc
«E nterp rise T h re a t»
Failure to be successful in die second stage of the HLF
Programme« E nterp rise A s s e t»
Historical/Architectural Significance
Figure A-3 - SWOT Analysis
The outcome of the SWOT workshop has been modelled using the CORAS
Tool. Figure A-3 shows the stakeholders to the right of the diagram, their
SWOT in the middle and Assets on the left. These Assets are the major areas
of interest highlighted by the SWOT.
Asset Identification and valuation, the last of the activities, identifies the
Target’s features requiring protection. These so called Assests are the basis
for the rest of the analysis (Braber 2006). The CORAS tool has been used to
classify the various assets of the Restoration Project as shown below in Table
A-7.
Type: Table
Name: Identified Assets
Concern: Assets
Viewpoint: Organisational
Full
description:
Identification and Valuation of the Assets
Asset ID Description Category Value
Historical
Significance
The buildings are part of one of
the largest complexes of
Medieval buildings in
Other Very High
Page 181 of 214
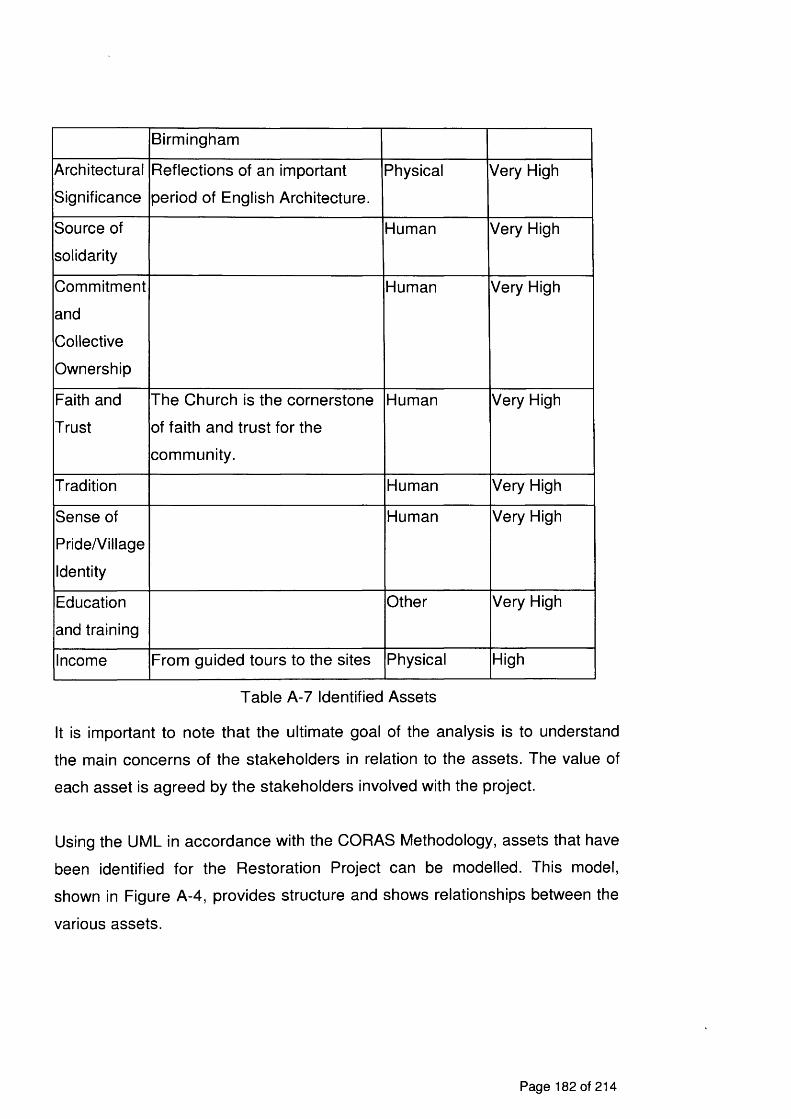
Birmingham
Architectural
Significance
Reflections of an important
period of English Architecture.
Physical Very High
Source of
solidarity
Human Very High
Commitment
and
Collective
Ownership
Human Very High
Faith and
Trust
The Church is the cornerstone
of faith and trust for the
community.
Human Very High
Tradition Human Very High
Sense of
Pride/Village
Identity
Human Very High
Education
and training
Other Very High
Income From guided tours to the sites Physical High
Table A-7 Identified Assets
It is important to note that the ultimate goal of the analysis is to understand
the main concerns of the stakeholders in relation to the assets. The value of
each asset is agreed by the stakeholders involved with the project.
Using the UML in accordance with the CORAS Methodology, assets that have
been identified for the Restoration Project can be modelled. This model,
shown in Figure A-4, provides structure and shows relationships between the
various assets.
Page 182 of 214

« A s s e O >
Restoration and Conservation « A s s e t »
Emotional A ttachm ent
« A s s e t »
Facilities and Services
t l i« A s s e t »
Income E duca tion and« A s s e t » « A s s e t »
Historic A rchitecturalSignificance Significance
T ra in in g
« A s s e t » Pride and
« A s s e t »TraditionSource of Com m itm ent and ^ i t h and T rust Village Identity
solidarity Collective Ownership
CHURCH C O M M U N IT Y
Figure A-4 - Asset DiagramFor the Restoration Project the stakeholders are the Church, the Community
and the Suppliers. The assets can be categoriesed into three groups
according to their nature. These are: Restoration and Conservation related to
the Church Stakeholder; Emotional Attachment related to the Community
Stakeholder; and Facilities and Services related to the Suppliers.
Restoration Project Risk Identification
Risk Identification in the CORAS methodology involves threat identification,
identification of vulnerabilities in the system and identification of unwanted
incidents. These three tasks involve structured brainstorming in the which
relevant stakeholders will participate. Applying this to the Restoration Project,
threats, see Table A-8, and vulnerabilities, see Table A-9, have been
identified. Now identified these threats and vulnerabilities must be analysed to
understand how threats may exploit the vulnerabilities resulting in Unwanted
incidents and Threat scenarios, also detailed in Table A-8.
Page 183 of 214

Type: Table
Name: Threat Table
Short description: Detailed Investigation
Concern: Threat
Viewpoint: Engineering
Finalised:
Full description:
Threat ID Scenario
Volunteers Volunteers losing interest due to the length of the
process, lack of motivation and by the level of
responsibility.
Community Having low confidence in the authorities but keeping
unrealistic expectations of the project.
Bad Weather Resulting in the delay in the surveys and analysis,
leading to inaccurate results.
Faulty Equipments Resulting in the delay in the surveys and analysis,
leading to inaccurate results.
Third Party Third Party consultants may be unavailable or may
not misunderstand the exigency of the tasks
Involvement of too
many people
May lead to sense of competitiveness and non-co-
operation amongst the various groups of people,
spreading resentment and unhappiness.
Criteria for eligibility Makes it appear a Herculean task, requiring huge
amounts of time, manpower (paid/unpaid) and other
resources.
Commercial-isation The actual aim being compromised due to the
project becoming a commercial enterprise.
Stretched
Resources
Due to the time required by the application process,
already-scanty resources being stretched.
Table A-8 Threat Table
Page 184 of 214

Type: Table
Name: Vulnerability Table
Short
description:Detailed Investigation
Concern: Vulnerabilities
Viewpoint: Engineering
Finalised:
Full description:
Vulnerability Asset
Lack of resources
Poor condition of the buildings
Poor access facilities
Time Constraints
Unfavourable Ground Conditions
Accuracy and effectiveness of the surveys
Motivation
Understanding and Co-operation between the people
involved.
Table A-9 Vulnerability Table
The way in which threats can exploit vulnerabilities is highlighted by the use of
the models and tables in the CORAS Tool and is depicted using threat
scenarios.
Page 185 of 214

« in it ia te s » «In c id en t S cen a rio »
Delay in Grant Approval
« i n c l u d e s »
« In c id e n t S c e n a rio » '
Delay in Submission of Stage 2 Application
« i n m a te s »
« T h re a t S cen a rio »
Resulting in the delay in the surveys and analysis and/or leading to inaccurate results.
'■■<;<includes»
« in itia te s» ..-
■-..<<initiates»
« T h re a t A g e n t»
Bad Weather
« In c id e n t S c e n a rio »
Eligibility< 100%
V ulnerabilities:
-Poor Condition of buildings
-Poor Access facilities
-Unfavourable Ground conditions
« In c id e n t S cen a rio »
Rejection/ Failure of Stage 2 Application.
itorical/Architecture Significance
«In c id en t S cen ario »
Reduction in the Grant Monies Income for Sustenance of
the buildings
« A s s e t »
Education and Training
Figure A-5 - Threat Scenario ‘Bad Weather’
Figure A-5 represents an unwanted incident model using the threat of Bad
Weather. Bad Weather exploits the weaknesses existing in the system such
as poor building conditions, poor access facilities to the buildings and
unfavourable ground conditions. These vulnerabilities, when exploited by bad
weather, aggravate the situation and this might result in the of delay in
ongoing surveys or in the inaccuracy of the results. This in turn might delay
the submission of the application or affect project eligibility causing rejection
of the application or the reduction of the grant money.
During this stage in the project, it becomes imperative to have a clear idea of
all possible dangers that the project may face and to plan countermeasures,
so that the project aims are not compromised and the project does not suffer
in terms of time, quality or costs. The modelling of unwanted incidents aids in
this, and once a clear picture of all possible threats has been drawn, it
becomes easier to prioritise these as risks and develop corrective treatment
measures.
Page 186 of 214

Restoration Project Risk Analysis
An unwanted incident which has been assigned a consequence and
frequency value is classified as a Risk. The Consequence and Frequency
Values which are used to calculate a Risk Level have already been decided
upon during Context Identification. The same values are now used during the
analysis to prioritise the risks and predict the extent of damage they may cause.
Risk to National Heritage
C« In c id e n t S c e n a rio »
Delay in Grant Approval
« A s s e t »
Education and Training
Figure A-6 - Risks and AssetsAn unwanted incident may harm many assets. However, according to the
CORAS Methodology, any risk is associated with only one asset. Depending
on the stakeholder perspective and the assets being considered, the
treatment measures can also vary. Due to the nature of the project it is wise to
consider all the opinions and prioritise them according to their impact and
level.
To understand the consequence and frequency of the risk we must take each
Asset - Unwanted Incident pair. Taking the example of the ‘Income’ Asset and
the ‘Failure to generate enough money for the sustenance of the buildings’
Unwanted Incident. This risk has been categorised as ‘Major’ from Table A-2,
and attributed a frequency of ‘Likely’ from Table A-3. Overall this equates to
the risk level of ‘Extreme’ based on the definitions in Table A-4.
It is expected that with this risk level the project will require further work to be
Historical/ArchitectureSignificance
Risk to the aims of
CHURCH
Page 187 of 214

completed in this area to fully understand what affects the risk and any
variations to the unwanted incidents. It is also possible that this risk will be
grouped with other risks which may, although affecting different assets, be
caused by similar Unwanted Incidents.
Restoration Project Risk Treatment
Having identified and acknowledged the risks that require corrective
measures, the next step is Treatment Identification and Implementation.
Treatment Identification is concerned with understanding and evaluating
possible ways to reduce the risk level; Implementation considers ways to
implement the chosen Treatment.
As discussed risk is a function of frequency and consequence. Hence, the
reduction of risk will be achieved through the reduction of either the
consequence or the frequency value associated with it. There are three
directed approaches to the treatment of risks:
• Reducing risks by reducing either the Frequency, Consequence or
both;
• Transferring Risks e.g. By Insurance; or
• Not performing the Risky Activities.
The first two options are plausible and logical but the third, in the case of the
Restoration Project, cannot be considered as it is imperative that all the
surveys and studies, which have major risks associated with them, need to be
successfully carried out.
The evaluation of these treatments involves taking each unwanted scenario
and modelling the treatments in the same way. Consider the threat of
‘Volunteers’ which poses a possible threat of ‘Losing interest in the process
due to the duration of the application procedure and the level of responsibility.’
If this unwanted scenario transforms into reality, it will directly or indirectly
affect the assets identified for this project. Suitable corrective measures for
this scenario could be:
• Regular meetings with the volunteers involved in the project which
involves exchanging views and keeping everyone up-to-date with the
status of the project;
Page 188 of 214
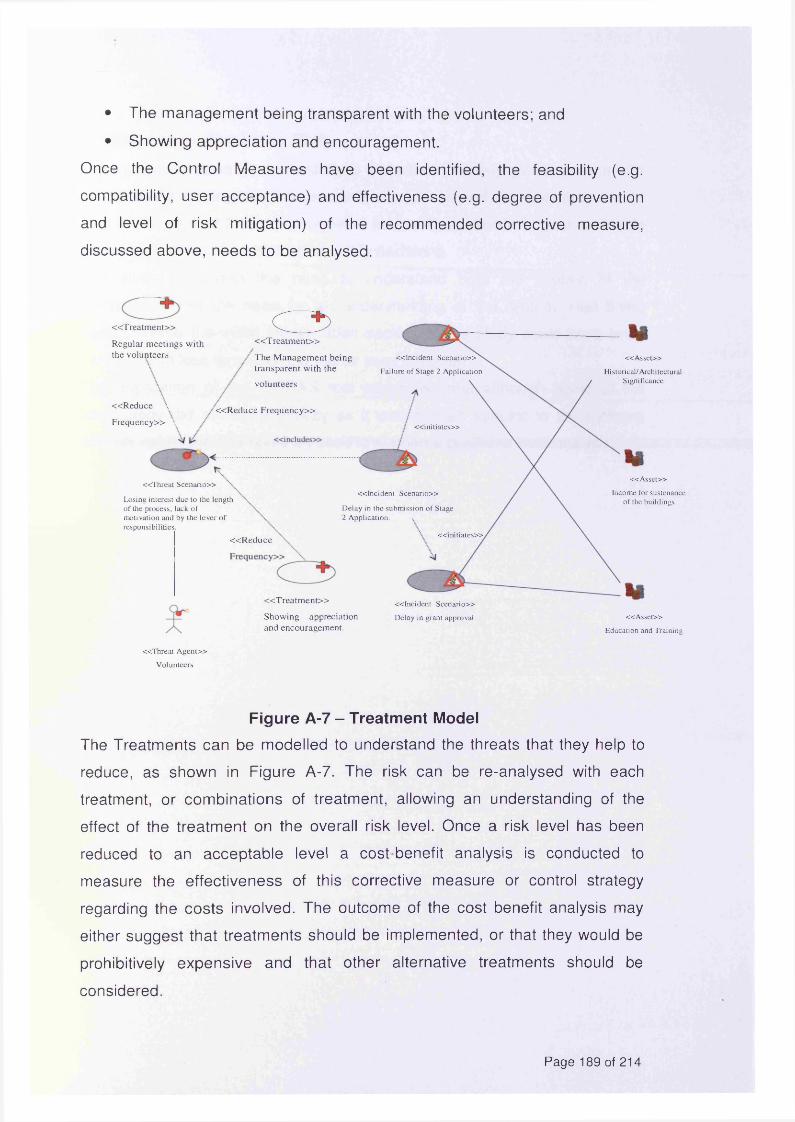
• The management being transparent with the volunteers; and
• Showing appreciation and encouragement.
Once the Control Measures have been identified, the feasibility (e.g.
compatibility, user acceptance) and effectiveness (e.g. degree of prevention
and level of risk mitigation) of the recommended corrective measure,
discussed above, needs to be analysed.
« A s s e t »
Education and Training
« A s s e t »
Historical/Architectural Significance
« A s s e t »
Income for sustenance of the buildings
c d n c id e n t S c e n a rio »
« in m a te s »
Delay in the submission of Stage 2 Application. •.
<<;T reatm en t» « In c id e n t S c e n a r io »
Showing appreciation Delay in grant approvaland encouragement.
« i n i t i a t e s »
« T h r e a t S c e n a r io »
Losing interest due to the length of the process, lack of motivation and by the lever o f responsibilities.
« R e d u c e
« T r e a tm e n t» o« T reatm en t»
« In c id e n t S c e n a r io »
Failure of Stage 2 Application
Regular meetings with the volunteers
« R e d u c e \
F requency» \
The Management being transparent with the
volunteers
« R e d u c e F req u en cy»
« T h r e a t A g e n t»
Volunteers
Figure A-7 - Treatment ModelThe Treatments can be modelled to understand the threats that they help to
reduce, as shown in Figure A-7. The risk can be re-analysed with each
treatment, or combinations of treatment, allowing an understanding of the
effect of the treatment on the overall risk level. Once a risk level has been
reduced to an acceptable level a cost-benefit analysis is conducted to
measure the effectiveness of this corrective measure or control strategy
regarding the costs involved. The outcome of the cost benefit analysis may
either suggest that treatments should be implemented, or that they would be
prohibitively expensive and that other alternative treatments should be
considered.
Page 189 of 214

Conclusions - Business Risk
The main conclusion from this study is that although many groups set out with
good intentions many risk assessments are not clear on the route they should
take to ensure that they are completed to a sufficient level of rigour to enable
sound arguments to be built up to justify decisions.
The study supported the need to understand both the context of the
assessment and the need for an understanding of the system. Had these
been in place the initial identification section of the study could have been
carried out in less time and to a higher level of rigour.
The application of the CORAS tool concluded that although some of the
terminology did not trace directly as it was domain specific to the software
security space the tool could be used to support a business level analysis.
Page 190 of 214

B. - Modelling Language Overview
Introduction
This Appendix provides an introduction to the constructs and usage of the
Unified Modelling Language (UML) and Systems Modelling Language
(SysML) diagrams. Initially it provides a brief overview of each of the thirteen
UML diagram and nine SysML diagrams. Following each overview is a more
detailed description of each of the diagrams used within this work.
The diagrams used within this work are:
UML
• Class
• Use Case
• Activity
• Sequence
• Deployment
SysML
• Parametric diagram
• Constraint block
Page 191 of 214

UML OverviewThis section provides an overview of each of the six structural and seven
behavioural diagrams
Structural Diagrams
Class 1Class 1
:Class2
Class 2Package 2
Class 3 Class 4
class diagram composite structure diagram
Nodal~|Qbi2: Class T
vz.Node 2
_j Obl4 Class ObiS
deployment diagramcomponent diagram
Behavioural Diagrams
Use case 1
j^Activrty inv 1 J ^ r
Use case 2Activity inv 2
^ State 2Actor 1
use case diagramactivity diagramstate machine diagram
ecLife linel message ► state 2 state 3state 1£
state 3:Life Iine2 refstate 2 Interaction 2state
interaction overview diagramtiming diagramcommunication diagramsequence diagram
Figure B-1 - UML Diagrams Overview
Page 192 of 214

Static Diagrams
The class diagram provides the ability to show entities and their relationships.
The relationships may be associations (including hierarchical), generalisations or dependencies.
The package diagram is generally used to show relationships within a model.
The composite structure diagram has two distinct purposes it realises
compositions and aggregations, and collaborations which identify
communications.
The object diagram shows instances of classes and relationships representing
real life examples of the related classes.
The component diagram shows the modules that would be found within a
system defined in terms of its interfaces.
The deployment diagram is used to define the location of components by
placing them on nodes which represent real world aspects or locations.
Behavioural Diagrams
State machine diagrams show the behaviour of a object also described as the
behaviour during the lifetime of a class. This is achieved by showing the order
and conditions under which things occur.
Activity diagrams are special types of state machine which are generally used
to show behaviour within an operation or state.
Use case diagrams are generally used to represent system requirements and
contexts. They also show interactions with external systems or stakeholders.
Sequence diagrams show life lines, the timeline of an object, and the
Page 193 of 214

messages passed between them with an emphasis on the logical timing of the messages
Communication diagrams also show life lines and messages but the
emphasis is on the layout or organisation rather than the timings.
Timing diagrams allows timing information to be added to interactions
showing the time at which a message is sent or a state change occurs.
Interaction overview diagrams allow construction of complex behaviours by
showing the interactions between many simpler behaviours described in
scenarios.
Class Diagram
The class diagram provides the ability to show entities and their relationships.
The relationships may be associations (including hierarchical), generalisations
or dependencies.
r relates together
OperationAttribute
cgraphic node* Interface
«diagram» Class diagram
Figure B-2 - Class Diagram Meta Model
Figure B-2 shows the meta model (definition) of a class diagram, which is
probably the most widely used diagram in the UML, it shows class and
interface as graphic nodes', it also shows relationship and the three types
described above. These relationships are dependency, association and
Page 194 of 214

generalisation. The association has two additional specialisations aggregation
and composition. An example of the use of each relationships is shown below.
Class name
Class nameattribute 1
attribute 2
operation 1 () operation 2()
O------
association name
*
<F
Class
Class with attributes & operations
Aggregation
Composition
Association
Dependency
Specialisation
Figure B-3 - Class Diagram Symbols
The basic symbols to be used on the class diagram are shown in Figure B-3
the class can be seen to be a box which can have attribute and operation
compartments added. The relationships are all in the form of lines; the
dependency is a dotted line with an arrow to show the direction of the
dependency, the generalisation/specialisation is a line with a triangle at the
end of the parent class and the association is a plain line which may
incorporate a name for the association. This line has a diamond added to the
parent class end to show the two special types of association.
Page 195 of 214
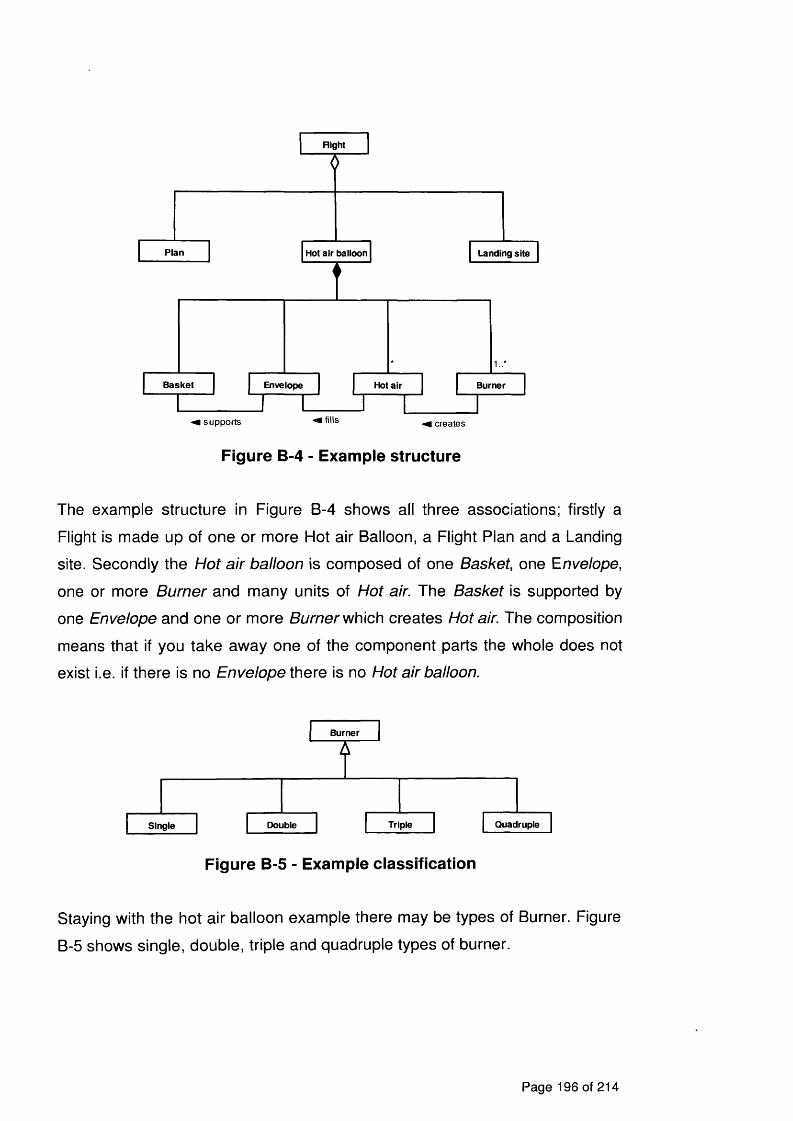
Right
Landing siteHot air balloon
BurnerHot airEnvelope
Plan
Basket
supports •+ fi'ls ^ creates
Figure B-4 - Example structure
The example structure in Figure B-4 shows all three associations; firstly a
Flight is made up of one or more Hot air Balloon, a Flight Plan and a Landing
site. Secondly the Hot air balloon is composed of one Basket, one Envelope,
one or more Burner and many units of Hot air. The Basket is supported by
one Envelope and one or more Burner which creates Hot air. The composition
means that if you take away one of the component parts the whole does not
exist i.e. if there is no Envelope there is no Hot air balloon.
QuadrupleTripleDoubleSingle
Burner
Figure B-5 - Example classification
Staying with the hot air balloon example there may be types of Burner. Figure
B-5 shows single, double, triple and quadruple types of burner.
Page 196 of 214

Aeroplane Hot air balloon
Hot air balloonAeroplane
Basket
Envelope
Hot air
Burner
Fuselage
Wing
Engine
supports
creates
fills
Figure B-6 - Example Mapping
Figure B-6 shows a mapping, an understanding of equivalence, using
dependencies or associations this shows that the Basket of the Hot air balloon
is maps to the Fuselage of an Aeroplane, the Envelope to the Wing and the
Burner to the Engine. This can be very useful for showing equivalence
between concepts used in different domains or applications.
Page 197 of 214

is a s s o c ia te d w ith ►
Classl Class2
Classl “is associated with” Class2
is a s s o c ia te d w ith ►
Classl Class2
Classl “is associated with” “one or more” Class2
Classl
Class2
Classl “is made up of” Class2
Classl
Class2
Classl “is composed of”
Class2
C lassl
~7S~
Class2
Classl “has types” Class2
Class2 “is a type of” Classl
« stereo type»C lassl
Classl “happens to be a” stereotype
Objectl : C lassl
Ni/C lassl
Objectl “is a real-life example of” Classl
Objectl “depends on” Classl
Classlis associated with ►
Class3
Class2
Classl “is associated with” Class2 “via” Class3
Figure B-7 - Class Relationships Overview
Figure B-7 provides a set of examples as an overview of the ways in which
the relationships used on a class diagram can be read.
Page 198 of 214

Activity
Activity diagrams are low level diagrams and are generally used to show
behaviour within an operation or state.
1. . *
((diagram# ^graphic node*Activity diagram ^ 1 * Region
75" £
••graphic node* «graphic path*Activity node Activity edge
«graphlc node# Activity invocation
«graphic node# Control node
5« interrupts
^graphic path* Control flow
«graphlc path# Object flow
•(graphic node# Object
••graphic node*Interruptibie
activity region
«graphic node* Activity partition
Figure B-8 - Activity Diagram Meta Model
Figure B-8 shows an extract of the meta model for the activity diagram. The
diagram shows Activity nodes and Regions as graphic nodes, it also shows
Activity edges these are the paths between the nodes.
^activ ity nam e^j
name:type
o
Activity invocation
Object node
Signal
Time signal
Decision or merge
Control fork or join
Activity initial node
# Activity final node
Flow final node
Partition shown as swimlane
Partition shown in activity nodef (partition name)I activity node
--------------- ^ Control or object flow
eventInterruptibie region
Figure B-9 - Activity Diagram Symbols
Figure B-9 shows the symbols used on the Activity diagrams. The activities
Page 199 of 214

are in the form of rounded boxes which are connected together via an arrow.
Consumer
[More to drink]
Glass
Glass
add ice to glass
top up with tonic
add gin to glass
Figure B-10 - Example Activity diagram
Figure B-10 shows the activity diagram for pouring a drink. This shows the bar
tender adding ice, adding a measure of gin and topping the glass up with
tonic. At this point the bar tender passes the drink to the consumer who takes
a drinks until they have finished enjoying each sip.
Page 200 of 214

Deployment
The deployment diagram is used to define the location of components by
placing them on nodes which represent real world aspects or locations.
1 is d ip io y& d on
i graphic path* Dependency
(graphic path# Deployment
i graphic node* Component
•graphic path* Generalisation
[graphic node’ Node
•graphic node# Deployment spec
•diagram# Deployment diagram
Figure B-11 - Deployment Diagram Meta Model
Figure B-11 shows an extraction of the meta model for a deployment diagram.
It shows that Nodes, Artefacts and Components are depicted as graphic
nodes whilst the relationships - similar to those in the class diagram - provide
the paths between nodes.
/ /Node name
/
• artefact*Artefact name
•deployment spec*Specification name
•deploys*
•manifests*
Node
Artefact
Deployment specification
Association
Deployment
Manifestation
Figure B-12 - Deployment Diagram Symbols
Page 201 of 214

The symbols used on deployment diagrams can be seen in Figure B-12. The
Node, the location, is shown as a 3D box onto which artefacts, components
and deployment specifications can be placed. The association is similar to
that used in the class diagram.
Allotment
0Bed 1 Bed 3
aBed 4 Bed 2
Figure B-13 - Example Deployment
Figure B-13 shows four planting beds in a crop rotation system. This shows
where each of the beds is positioned within the allotment. It would is expected
that deployment diagrams show either the current, past or future layout.
Sequence
Sequence diagrams show life lines, the timeline of an object, and the
messages passed between them with an emphasis on the logical timing of the
messages.
Page 202 of 214

represents ►
describes communication between ►describes oocurrance of ►
igraphic path)Rep»y
igraphic node* Stop
(graphic nodei Interaction
(graphic path Call
«graphic path* Event occurence
•diagram* Sequence diagram
•graphic node* Execution occurence
•graphic node* Interaction occurence
Figure B-14 - Sequence Diagram Meta Model
Figure B-14 shows an extract of the meta model for a sequence diagram. The
diagram shows Frames, Gates, Lifelines, Interactions and Interaction
occurrences occur as graphic nodes on the diagram. Messages provide the
paths between events on lifelines.
Interaction / frame
Interaction occurence
Life line
Life line with...
execution occurence and...
stop
Asynchronous message
Message call
Message reply (from a call)
Figure B-15 - Sequence Diagram Symbols
sd name J
ref ) interaction name
[ Life line (
Life line I
TI
Xasynchronous!)
caii(j ^
replyO
Page 203 of 214

The symbols which can be used on sequence diagrams are shown in Figure
B-15. This shows a lifeline as a box with a dotted line extending down the
page. The messages between life lines are shown as arrows.
$Water
loop y ;
[Until distance Achieved]
| Stroke()U *
111
1
I ^ | insert oar()
pull water() ^
1
!iiii1 —
[ extract oar()
i r
Figure B-16 - Example Sequence
Rower
Figure B-16 shows the sequence diagram for rowing. This shows the Cox
calling the strokes to the rower at regular intervals with the rower reacting but
inserting, pulling and removing the oar.

Use Case
Use case diagrams are generally used to represent system requirements and
contexts. They also show interactions with external systems or stakeholders.•diagram*
Use case diagram
•graphic node* Actor
1 *
__________ «graphtc node»Use case
« yields an observable result to A
0 . . *
Extension Point
0 ..*
0 . 1«graphic node*
System boundary
•graphic path* Relationship ZX—
•graphic path* Extend
defines condition for ►
x graphic path* Association
•graphic path* Include
Figure B-17 - Use Case Diagram Meta Model
Figure B-17 shows an extract from the meta model of a Use case diagram.
The diagram shows that Actors, Use cases and system boundaries can be
shown on diagrams as graphic nodes and relationships used to provide paths
between and across nodes. An association relates a Use case to an Actor
usually across a system boundary. The Include relationship shows a Use
case which always occurs when the source use case occurs.
Page 205 of 214
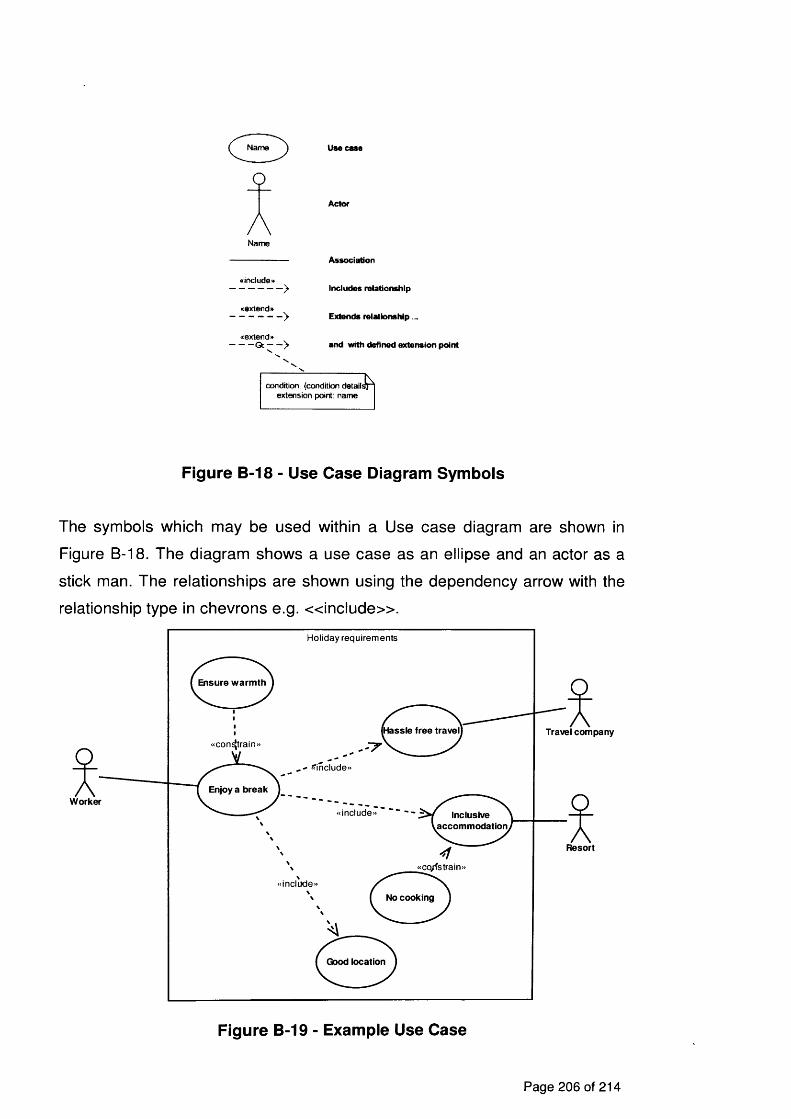
Name
O
AName
«include»
«extertd»
extend*
Use case
Actor
Association
Includes relationship
Extends relationship...
and with defined extension point
condition, {condition detail extension point: name
Figure B-18 - Use Case Diagram Symbols
The symbols which may be used within a Use case diagram are shown in
Figure B-18. The diagram shows a use case as an ellipse and an actor as a
stick man. The relationships are shown using the dependency arrow with the
relationship type in chevrons e.g. « in c lu d e » .
Holiday requirements
Ensure warmth
issle free travel Travel company; constrain
include;Enjoy a break )
Workerinclude Inclusive
.accommodation.
Resort
co/fstrain
includeNo cooking
Good location
Figure B-19 - Example Use Case
Page 206 of 214
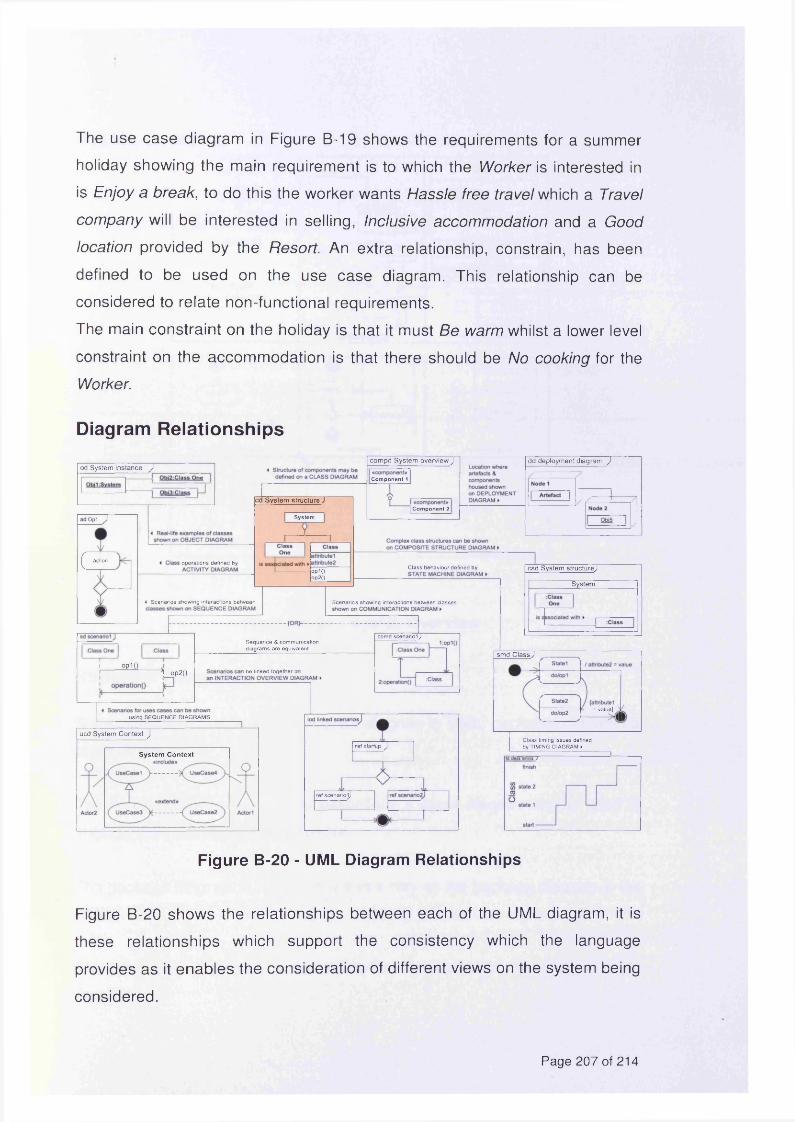
The use case diagram in Figure B-19 shows the requirements for a summer
holiday showing the main requirement is to which the W o rk e r is interested in
is E n jo y a b r e a k , to do this the worker wants H a s s le f re e t ra v e l which a T ra v e l
c o m p a n y will be interested in selling, In c lu s iv e a c c o m m o d a t io n and a G o o d
lo c a t io n provided by the R e s o r t . An extra relationship, constrain, has been
defined to be used on the use case diagram. This relationship can be
considered to relate non-functional requirements.
The main constraint on the holiday is that it must B e w a rm whilst a lower level
constraint on the accommodation is that there should be N o c o o k in g for the
W o rk e r.
Diagram Relationshipsdd deployment diagram )compd System overview )
od System instance )Component 1
cd System structure J| Component 2
Opl ) System
^ action operations defined byClass behaviour defined by csd System structureJop i()
°p2()System
i Scenarios showing interactions between Scenarios showing interactions between classes
comd scenarioijSequence & communication diagrams are equivalent
smd Class J
op1()■*!|o p 2 ( ) be linked together i
= value]using SEQUENCE DIAGRAMS
ucd System Context JClass timing issues defined by TIMING DIAGRAM ►ref startup J
System Context
ref scenariolj
Figure B-20 - UML Diagram Relationships
Figure B-20 shows the relationships between each of the UML diagram, it is
these relationships which support the consistency which the language
provides as it enables the consideration of different views on the system being
considered.
Page 207 of 214

SysML Overview
i_
The 5 SysML structural diagrams
diagram
Figure B-21 - SysML Overview
Structural Diagrams
Block definition is essentially the class diagram in UML, package and internal
block diagram are
The block definition diagram is essentially a class diagram and is used to
show system structure and hierarchy.
The package diagram is used in the same way as the package diagram in the
UML
The internal block diagram is essentially the composite structure diagram from
the UML
Page 208 of 214

The parametric diagram provides the ability to show mathematical constraints
and organise them into networks which can be exercised providing numerical and logical results.
The requirement diagram provides the ability to represent a requirement as a block or class.
Behavioural Diagrams
All of the behavioural diagrams in the SysML are commensurate with the
diagrams of the same name in the UML.
Parametrics
The Systems Modelling Language (SysML) has introduced a new construct to
the modelling toolbox, that of the constraint block and the associated
'parametric diagram'. Constraint blocks allow for the definition and use of
networks of constraints that represent rules that constrain the properties of a
system or that define rules that the system must conform to.
«constraint»Force
Nf: Newtons Parametersm: kga: m /s A2
constraints IX{f = m*a} Constraint definition
Figure B-22 - Parametrics - Definition Notation
A constraint block is defined using a block (essentially the same as a UML
class) stereotyped «constraint» and given a name by which the constraint can
be identified. The constraint block has two compartments - the constraints and
parameters compartment.
The constraints compartment contains an equation, expression or rule that
relates together the parameters given in the parameters compartment. The
example above defines a constraint called 'Force' that relates the three
Page 209 of 214

parameters T, 'm' and 'a' given in the parameters compartment by the
equation f = m x a', as shown in the constraints compartment. Such
constraints are defined on a SysML block definition diagram (essentially a
UML class diagram).
m _kg«constraintProperty»N ewton :Force
:m/sA2 f :Newtons Q
------------------Constraint use on a parametric diagram
Part containing the system elem ent to be constrained
Part Name :Part Type
Figure B-23 - Parametrics - Usage Notation
Constraint blocks are used on a parametric diagram using the notation shown
above. The small squares attached to the inside edge of the constraint
represent each parameter and provide connection points when linking
constraints to parts or other constraints.
When used on a parametric diagram a constraint block is referred to as a
constraint property and each constraint property should be named thus name
:Constraint name. This allows multiple copies of a constraint to be used on a
diagram.
Page 210 of 214

The Escapology Problem
Pum pcontroller
Pum p 0 start
• stop
0 reverse
CoffinEscapologist
Concrete
H ole
Figure B-24 - The coffin escape
This is a classic escapology stunt that has been performed by many people. It
is also a dangerous one, and escapologists have lost their lives performing it
because the constraints were not properly understood or evaluated. One such
performer was Joe Burrus who died 30th October 1990 when the weight of
the concrete crushed the coffin he was in.
Page 211 of 214
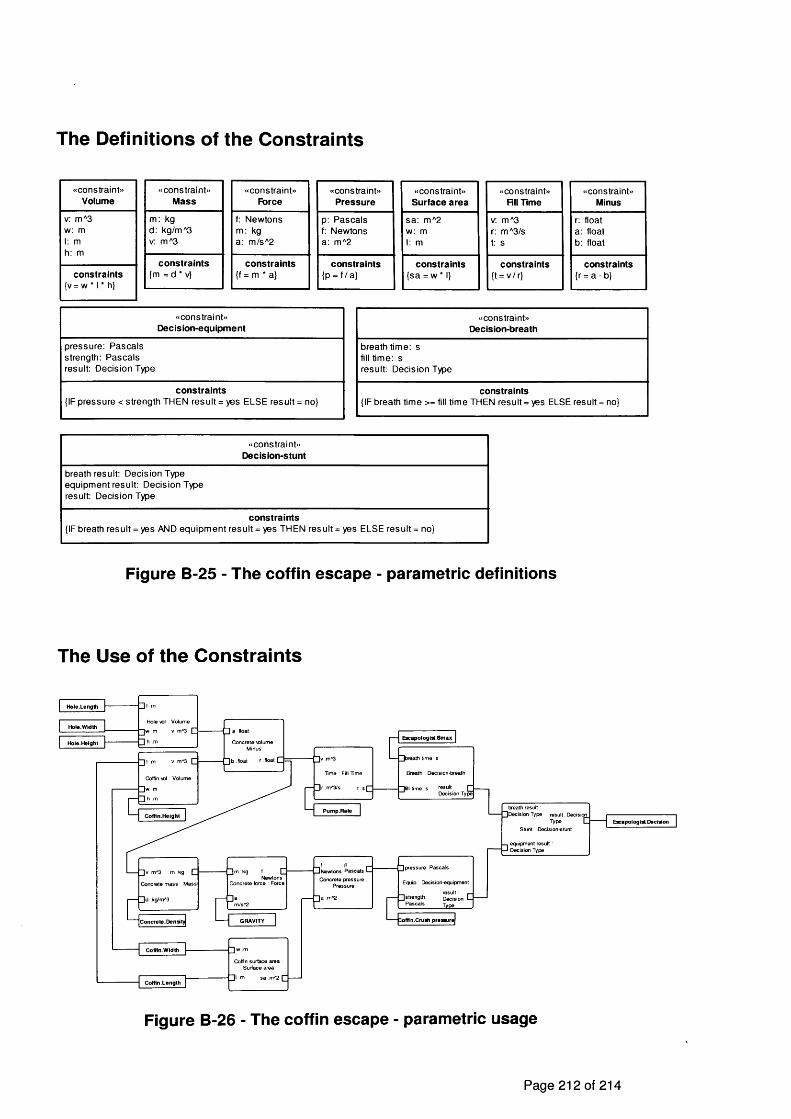
The Definitions of the Constraints
«constraint" Volume
v: m A3 w: m I: m h: m
constraints{v = w * I * h}
«constraint»Mass
m: kg d: kg/m A3 v: m A3
constraints{m = d * v}
«constraint»Force
f: Newtons m: kg a: m /sA2
constraints{f = m * a}
“Constraint”Pressure
p: Pascals f: Newtons a: m A2
constraints{P = f /a }
«constraint» Surface area
sa: m A2 w: m I: m
constraints{sa = w * 1}
«constraint» Fill Time
v: m A3 r: m A3/s t: s
constraints{t = v /r}
“constraint”Minus
r: float a: float b: float
constraints{r = a - b}
“constraint”Decision-equipment
pressure: Pascals strength: Pascals result: Decision Type
constraints{IF pressure < strength THEN result = yes ELSE result = no}
“constraint”Decision-breath
breath time: sfill time: sresult: Decision Type
constraints{IF breath time >= fill time THEN result = yes ELSE result = no}
“constraint”Decision-stunt
breath result: Decision Typeequipment result: Decision Typeresult: Decision Type
constraints{IF breath result = yes AND equipment result = yes THEN result = yes ELSE result = no}
Figure B-25 - The coffin escape - parametric definitions
The Use of the Constraints
Hole.Length
- ^ a float
^Decision Type result Decision Type E
Coffin.HeightEscapologist Decision
equipment result'
“i I-■ J Newtons Pascals *—
[]strength
Coffin.Length
Figure B-26 - The coffin escape - parametric usage
Page 212 of 214
The sizes of the hole and the coffin are calculated and used to determine the
amount of concrete needed to fill the hole. This volume and the pumping rate
of the pump are used to determine how long it will take to fill the hole. This
forms an input to a usage of the 'Decision-breath' heuristic constraint, along
with the length of time that the escapologist can hold his breath, which returns
a 'yes/no' decision indicating whether the escapologist can hold his breath long enough.
The volume of concrete needed is used, along with a constant defining the
acceleration due to gravity, to calculate the amount of force exerted by the
concrete. This force is converted to an exerted pressure using the surface
area of the coffin, with the pressure then being compared against the coffin
crush pressure in a usage of the 'Decision-equipment' heuristic constraint to
return a 'yes/no' result that indicates whether or not the coffin is safe to use.
Finally, the outcomes of these two decisions are used in a usage of the
'Decision-stunt' heuristic to decide whether the stunt should be performed,
setting the 'Decision' property of the 'Escapologist' block. In this way the
parametric constraints are used not only to specify constraints on the system
but also to allow system requirements to be validated. Indeed it may be
possible, if parametric constraints can be developed at an early stage of a
project, to use them to establish whether a project is even possible long
before detailed and costly development work has been undertaken.
It should be noted that this is only one possible parametric usage diagram and
is open to significant improvement. However, it gives a good indication of the
notation and the way that the constraint diagrams in SysML are used.
Page 213 of 214

SysML Diagram Relationships
bdd System structurej~
-o A2 V)
e £TO to
So* o
2 .4
•b lock*System
3 1i> °
nblockl)Blockl
is asst elated with ►
•b lock*B lock
-"I^FicwType
property 1 property2op1()op2()
§l § *1- $ o 2 cr c t -2 jnI Io < .Si ° -
bdd - Parametric Constraint definitionition j•constraint*
M assRelation•constraint*
N ewton's Law
constraints constraints{m = v * d} {f = m * a}
parameters parametersm : Mass f : Forcev : Volume m : Massd : Density a : Acceleration
par F iring R anged
f : Force
dnew ton: N ew ton’s Law|m : Mass
a A cce le ra tion
Cannon force
Shot acceleration
•constraint* m assRel: M assR e latio n
□ v Volumelrn : Mass 1—
d: Density
E *a m (ie shows two [ \ aircm anvc nolsw or* fee ccmstrant property UC«
Shot.volume
Shot, density
Figure B-27 - SysML Diagram Relationships
Figure B-27 shows the relationships between the SysML diagrams used in
this work. It shows the relationship to the SysML block definition diagram
which can be considered to be a class diagram for the purposes of this work.
The strength of the relationship between the class and block definition
diagrams provides a central point from which the SysML profile can be related
to the UML.
Page 214 of 214