a flume study 1c bes
TRANSCRIPT

Lindgren
AUG FROMA1C BESA FLUME STUDY OF RIPPLE GROWTH
IN FINE SAND
by
JOHN R. DINGLER
Submitted in Partial Fulfillment
of the Requirements for the
Degree of Master of Science
at the
MASSACHUSETTS INSTITUTE OF TECHNOLOGY
June, 1968
I
Signature of Author: . ..
Depart nt of Geology andGe physics
May 17, i68
Certified by: ........ ...... %. . ..... ........... ..
Thesis Supervisor
Accepted by:Head of Department
ABSTRACT
A FLUME STUDY OF RIPPLE GROWTH
IN FINE SAND
by
John R. Dingler
Submitted to the Department of Geology andGeophysics on May 17, 1968, in partial ful-fillment of the requirements for the degreeof Master of Science.
A recirculating flume 20' long by 6.5" wide by 13" deepwas used to study ripple propagation downstream of asmall mound manufactured on a bed of very fine sand (dm=0.125 mm). The mounds were of finite width and vary-ing relative height h/y 0 . The shape of the resultingcrests was studied and an explanation offered for thethree-dimensional nature of the crests. Ripple propa-gation was also investigated when the flow was lessthan that necessary to move the grains as bed load. Thecrest shape of the first few crests formed in each runwas two-lobed, with a transverse crest separating thelobes. Scour was strongestbehind the two lobes. Theripple shape was attributed to finite width of themound which produced a transverse velocity componentdownstream of the mound. Ripple growth was character-ized by crest spacing si vs. time for the first threeor four spacings (i= 1, 2, 3, and 4 respectively).Growth was rapid at first, but eventually decreased toa linear fate. Reproducibility was very good for sbut decreased as i increased. The growth rate increasedfor both increasing Re and h/yo. When Re < Rep.,ripples propagated if he relative mound hEight waslarge enough. This is contrary to the statements ofmost authors who Ueliv ethat a riLppled bed Will bcomeflat if Rep becomes less than Rep.'
Pro eQ q1f John B. ' auhar

Department of Geology and GeophysicsMassachusetts Institute of TechnologyCambridge, Massachusetts 02139May 17, 1968
Professor Edward N. HartleySecretary of the FacultyMassachusetts Institute of TechnologyCambridge, Massachusetts 02139
Dear Professor Hartley:
In accordance with the regulations of the Faculty,I herewith submit a thesis, entitled "A Flume Studyof Ripple Growth in Fine Sand," in partial fulfill-ment of the requirements for the degree of Masterof Science in Geology and Geophysics at the Massa-chusetts Institute of Technology.
Respectfully submpted,
Jokn R. Dingler
TABLE OF CONTENTS
INTRODUCTION
General
Background '
Objective
Acknowledgements
APPARATUS
Flume
Carriage
Sand
PROCEDURE
RESULTS
DISCUSSION OF RESULTS
Crest Shape
Ripple Growth; 1.66<
Ripple Growth; Re p <
CONCLUSIONS
SUGGESTIONS FOR FUTURE WORK
SUMIMARY
APPENDIX
A Notation
B Orifice Calibratio
C Summary of Data
BIBLIOGRAPHY
Re <2.50p
Repc
Page
8
8
10
19
20
21
21
23
25
28
33
46
46
52
59
61
62
63
68
68
70
72
82
na

LIST OF FIGURES
Number Title Page
la Liu curve with transposed Shields 15curve
lb Shields Diagram 15
2 Relationship of bed forms to flow 16regime for fine sand
3 Recirculating flume 22
4 Instrument carriage 24
5 Sieve analysis 26
6 Photomicrograph of the sand 27
7 .Mound at time zero 30
8 Crest spacing s vs. time for Run 1 35Sn=4 Rep = 2.15, h/yo = 0.071
9 Crest spacing s vs. time for Run 2 36s , Rep = 2.15, h/y0 = 0.071
10 Crest spacing s vs. time for Run 3 37s , Rep = 2.15, h/yo = 0.071
11 Crest spacing s vs. time for Run 4 38sn- , Rep = 1.74, h/yo = 0.062
12 Crest spacing s vs. time for Run 5 39s54 Re = 1.74, h/y = 0.08
13 Crest spacing s vs. time for Run 6 40s 4 Re = 1.74, h/y = 0.107
14 Crest spacing s vs. time for Run 7 41
sn-4 Rep = 1.73, h/yo = 0.091
15 Crest spacing s vs. time for Run 8 42s 4 9 Re = 2.04, h/y = 0.090
16 Crest spacing s vs. time for Run 9 43s , n4Re = 2.25, h/yo = 0.089
17 Crest spacing s vs. time for Run 11 44s , Re = 1.43, h/y = 0.23n=3 P
LIST OF TABLES
Title
Flow conditions and mound geometriesfor the runs
Change in growth rate for variableRe and constant h/yp 0 d
Summary of data - Run 1
Number
1
2
3
4
5
6
7
8
9
10
11
12
of
of
of
of
of
of
of
of
of
data
data
data
data
data
data
data
data
data
- Run
- Run
- Run
- Run
- Run
-Run
- Run
- Run
- Run
2
3
4
5
6
7
8
9
10
Pages
34
Summary
Summary
Summary
Summary
Summary
Summary
Summary
Summary
Summary
57
72
73
74
75
76
77
78
79
80
81

LIST OF FIGURES (continued)
Number Title Page
18 Crest height vs time for Run 10 45Crests 1 - 4, Rep = 1.7?
19a-f Stages of ripple growth below mound 49
20 Growth of a rippled bed; typical "V" 49shape
21a,b Propagation of asymmetry 49
22 Cross-section showing shape of trans- 50verse crest
23 Flume coordinate system 51
24 Reproducibility of sl for different runs 54
25 Reproducibility of s2 for different runs 55
26 Reproducibility of s 3 for different runs 56
27 Variations in s for variable h/yo and 58constant Rep
28 Effects of relative mound height on 60ripple propagation
29 Typical two-lobed ripple with transverse 65crest
30 Growth of crest spacing s with time 66
31 Regions of ripple propagation 67
32 Orifice calibration 71

INTRODUCTION
General
Knowledge of the formation and preservation of
bed forms is of interest to both geologists and hy-
draulic engineers. Geologists use the preserved bed
forms --ripple marks and cross-bedding-- and associated
sedimentary structures in interpreting ancient environ-
ments, while hydraulic engineers Use information on
alluvial channel resistance in order to properly design
channels and to predict sediment transport rates.
Ripples form in noncohesive sediments under flow
conditions prevalent in nature. Geologists have long
recognized their usefulness as indicators of bedding
sequence and current direction, but only recently
have they realized that ripple marks might also be
used to interpret the paleo-flow regime; comparison
of bed forms found in the field-with bed forms produced
in controlled flume experiments should help in such
interpretations.
Ripple marks are primary sedimentary structures
which form as quasi-periodic undulations on a sedi-
mentary surface due to fluid motion. To some extent
they characterize the kind of fluid --air and water
being the two types of fluids encountered in nature--
and the kind of fluid motion acting on the bed -- grav-
ity waves or unidirectional currents. Except in spe-

cial cases (Inman and Bowen, 1963), flume studies have
been concerned with water-formed current ripples. These
are characterized by asymmetrical shape, with a long,
gentle stoss slope and a shorter, steeper lee slope.
Hydraulic engineers are interested in the sediment-
transport and flow-resistance characteristics of ripples.
The friction factor for a rippled bed is five to six
times larger than that for a flat bed at the same shear
velocity. Thus, design of earth channels and predic-
tion of sediment transport rates in rivers depends
largely on ability to predict the bed configuration.
Hydraulic engineers have studied ripple properties
in controlled experiments in laboratory flumes. Two
kinds of flumes are in general use: recirculating
flumes, which recycle both sediment and water, and once-
through flumes, to which sediment and water must be added
continuously at the upstream end. Except for small vari-
ations attributable to flume design, flumes can accurate-
ly reproduce conditions found in nature. From these
studies much information has been collected on sediment
transport and changes in flow resistance due to the for-
mation and growth of ripples (for example, Barton and
Liu (1955), Brooks (1958), Colby (1961), Simons and
Richardson (1962) and Hill (1965)). Some work has been
done on predicting ripple initiation (for example, Shields
(1936), Rubey (1948), and Liu (1957)), but this aspect

10
of ripples is still poorly understood. Much of the
problem here is due to an inability to predict the role
of turbulence at the water-sediment boundary in initia-
tion of motion.
Background
The concept of a turbulent boundary layer and a
laminar sublayer was introduced by Prandtl (Schlichting,
1960). Next to the fluid-bed boundary layer there is a
region of laminar flow where viscous effects predominate
over turbulent effects. The thickness of the laminar
sublayer, 6, is proportional to V/ U, where
V =,/e is the kinematic viscosity.e.is the fluid density.p is the absolute viscosity.U (is the shear velocity.
'= gRS is the bed shear stress.g is the acceleration due to gravity.R is the hydraulic radius of the channel.
R is taken to be equal to the mean depth,yo, in this study.
S is the slope of the energy gradient and isapproximately equal to the bed slope.
Outside the laminar sublayer turbulent shear effects
predominate over viscous ones with the result that eddies
form and fluid mixing is greatly enhanced.
If the thickness of the laminar sublayer is greater
than the size of any protrusions at the boundary, the
boundary is called smooth. Correspondingly, if the
protrusions extend through the laminar sublayer, the
boundary is called rough. There is a transition region

11
where only some of the bed elements protrude into the
turbulent boundary layer.
The usual method of characterizing the three types
of boundaries is in terms of a particle Reynolds number
Rep:
Re p = k U* /y(1
where ks is the hypothetical roughness elevation accord-
ing to Nikuradse (Schlichting, 1960) and is approximately
equal to the mean sand diameter dm. These roughness
relations were developed from pipe-flow data, but they
are applicable to open channels if four times the hydraul-
ic radius is substituted for the pipe diameter in all
the pertinent equations. The three regions are deline-
ated as follows:
smooth: dm U* /V< 3,
transition: 3 ( dm U, /;470,
turbulent: dm U* / > 70.
Einstein (1942) suggested that a bed hydraulic
radius, Rb, be used instead of the total hydraulic rad-
ius. Rb is essentially a correction for sidewall rough-
ness, and its value approaches y0 for smooth walls and
a small depth-to-width ratio. As both these conditions
were met in this study, y was used in all cases where
the hydraulic radius term appeared.
The number of experimental studies on flow resis-

12
tance and grain motion is far too large to permit
discussion of all of them. A few of the more perti-
nent ones will be discussed below. Chien (1957) gave
a good summary of work done up to 1957, while the ASCE
Task Committee.on Preparation of Sedimentation Manual
(1966) covered work through 1966. Plate (1957) gave
a good summary of foreign work through 1957.
The first definitive work on sediment transport
in alluvial channels was by Gilbert (1914). Using a
wooden flume 31.5 ft. long by 1.96 ft. wide, the capa-
city for hydraulic traction was compared with slope,
depth and width of current, and particle size. He used
both uniform and mixed materials. Traction is the term
that he used for bed-load movement. In conjunction with
transport by traction, he discussed saltation and the
forces and conditions necessary for particle movement.
First of all, he assumed that the flow is turbulent,
since laminar flow is impossible with velocities compe-
tent for traction. He hypothesized that the saltated
grains are given an upward lift by pivoting on grains
immediately downstream. Furthermore, he theorized that
the amount of grain roll influences the height and length
of the grain trajectory; the greater the momentum gained
in rolling, the higher and farther it travels before
striking the bed. Such would be the saltation of grains
without the influence of eddies. When turbulence is strong

13
enough to produce a significant number of eddies near
the bed, the grain trajectories will be altered to con-
form with the eddy movements.
When water flows over a bed of sand, it exerts
forces on the grains which tend to cause the grains to
move. The chief forces in the initiation of motion are
lift and drag forces, which tend to move the particles,
and the weight of the particles (relative to the water),
which tends to keep the grains stationary. Critical
conditions exist when the flow conditions are such that
any small increase in them will result in particle
motion. The following discussion will consider the
lift as being negligible compared to the other two
forces (White, 1940). Although neglecting the lift force
in the theoretical development may not have proper justi-
fication, it is not neglected in actual measurements.
American Society of Civil Engineers (1966) points out
that the effect of lift is automatically considered,
since it depends on the same variables as drag and since
the constants in the resulting theoretical equations are
determined experimentally.
Particle motion will begin when the drag force, fd,
equals the resistance of the particle, fr* f is ex-r r
pressed in terms of the particle fall velocity, w.2 2
fd C ('/ 4) dm U* /2 (2)
2 2f = C2(7/4) dm w /2 (3)

Thus,2 2 2 2
C2 (/4) dm w /2 = C1 (7'/4)dmeU, /2 (4)
where C, and C2 are functions of Rep and some shape
factor of the grains. If the shape factor is neglected,
U* / w= 0 1 (U* dm V) (5)
This criterion for ripple formation was developed by
Liu (1957) and further studied by Plate (1957). It is
essentially a variation of the equation of particle mo-
tion developed by Shields (1936). Shields found that
he could describe the beginning of particle motion by
the equation
'K / g dm S 02 (U* dm/9 ) (6)
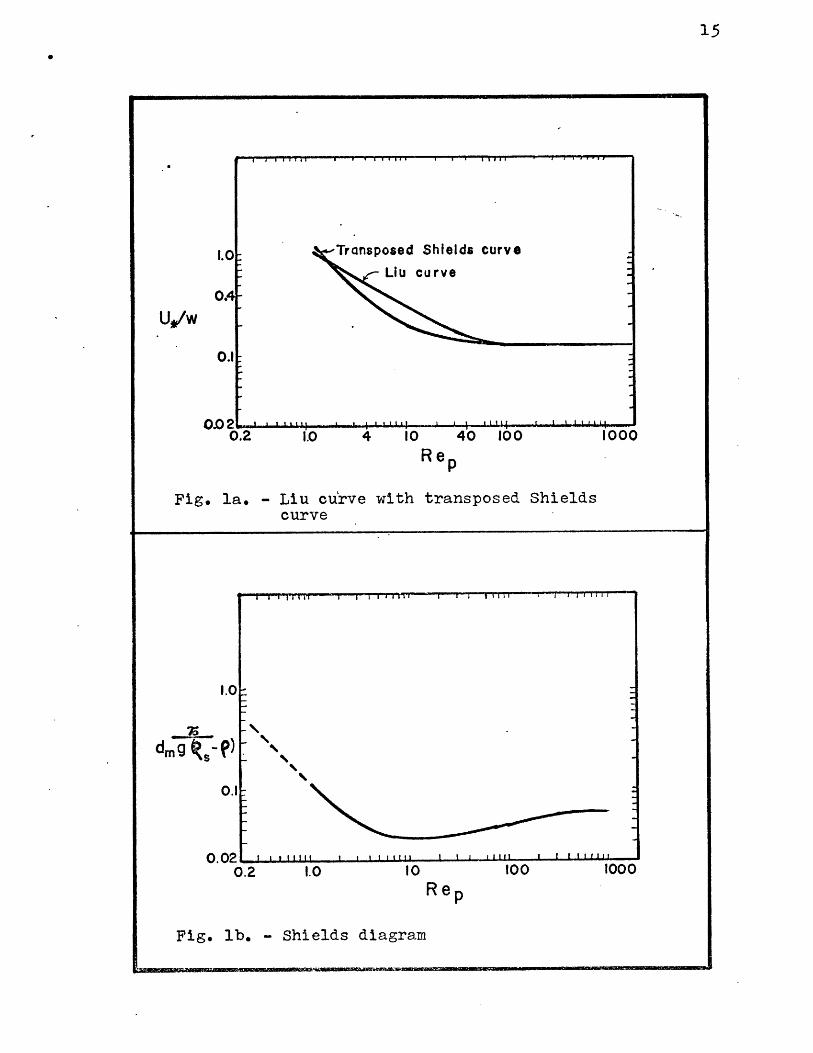
where e is the particle density. Plots of Eqns. (5)
and (6) are given in Figs. 1 a and b, respectively. The
extrapolation to the left of Rep = 1 is a suggestion by
Shields and not based on data. Note that the Shields
diagram is linear in the laminar region, Rep< 3.
According to Liu, ripples cannot form in the region
below his curve, and if flow conditions over a rippled
bed change to a value in the lower region, the bed will
eventually revert to a flat condition.
Brooks (1958) used a recirculating flume with a
bed of fine sand to investigate the factors governing
the equilibrium rate of sand transport. He found that
the use of the mean velocity and depth as independent
variables and the slope as the dependent variable led to
14
1.
0.
U,/w
0
0O00.2
Fig. la.
0.2
I.D 4 10 40 10oRe
- Liu cu'rve with transposedcurve
100R e
- Shields diagram
15
Transposed Shields curveLiu curve
4-
.1
1000
Shields
1.0:
OA-
0.|I
1000
dm9g s
0.
Fig. lb.

16
an orderly relationship between the pertinent variables.
Simons and Richardson (1962) did experiments in a
flume 150 ft. long by 8 ft, wide. From this study they
developed a relation between the Froude number, Fr, and
the kind of bed forms produced (Fig. 2).
Fr = U /4 0 (7)
where U is the mean flow velocity.
6 O9
0
D 2)
U vo
Fr
0.5 1.0y, (f t.)
Fig. 2 - Relationship of bed forms to flow regimefor fine sand (dM = 0.45 mm)
Kennedy (1963) developed an analytical model to
predict the kind of bed form in the different flow
regimes. He suggests that initiation of particle mo-
tion and ripple formation are synonymous, and that once
the critical conditions are reached, the bed is spon-
taneously deformed into ripples. He also states that
any grains piled above the mean level will initiate

17
ripple growth if the flow is at the critical stage.
Raudkivi (1963) compared a sediment ripple to a
negative step in that flow patterns were comparable
between the region in the lee of the ripple crest and
the region downstream of a negative step. Further, he
observed that bed deformation began at some point and
gradually spread downstream. The point (or points) of
initiation appeared because of a random piling up of
the grains. This effect occurred once there was some
particle motion. He attributed the piling up to differ-
ential particle movement due to: (1) sheltering of
grains by other grains, (2) intermittency due to eddies
touching the bed, and (3) nonuniform grain sizes.
Once the ripples form, occasional grains are carried
over the brink and land five to six crest heights down-
stream. Such grains either move up the next slope or
displace other grains which then move downstream.
The work of Jopling (1965) sheds light on the ac-
tion of grains as they are carried over the ripple crest.
He made a flume study of the formation of a microdelta;
a process comparable to the movement of grains over a
ripple crest. At low flows, the grains move as bed
load, pile up on the upper foreset, and finally slide
down the foreset. At higher flows the above occurs, but
there are also some grains which are carried into suspen-
sion and over the front. These grains are acted on by

18
two forces: gravity and flow drag. The distance these
grains travel as suspended load depends on the relative
magnitude of the forces and the hetght of the crest above
the downstream trough. If the grains travel less than
some distance downstream (perhaps the five or six crest
heights suggested by Raudkivi, 1963) they are actually
carried back toward the delta face after settling on
the bed. This phenomenon of reverse grain movement is
the result of a recirculation eddy in front of the leading
foreset; the eddy is caused by flow expansion over the
crest. If the strength of the reverse flow is great
enough, reverse ripples can actually form immediately
downstream of the foreset.
Raichlen and Kennedy (1965) and Sutherland and
Hwang (1965) found that the bed friction factors, ripple
wave lengths, and dune amplitudes reached over 80% :of
their equilibrium value in about one-half the development
time. The latter authors observed that crests and troughs
formed symmetrically at first but then, the troughs changed
their vertical dimension faster than did the crests.
At the same time, the crests spread out more in the hori-
zontal direction (longitudinally). They attributed these
affects to "decapitation" of the crests by the flow.
Sutherland and Hwang (1965) also compared ripple
growth from a flat bed and from one "scratched" perpen-
dicular to the flow every few feet. Under the same flow
MONOWNWk-

19
conditions, they found that the ripples initially grew
faster on the scratched bed, but that both obtained the
same equilibrium configuration. On the scratched bed
ripple growth began at the scratches and propagated
downstream, whereas initial formation was random on the
unscratched bed.
Rathbun and Guy (1967), studying sediment trans-
port in a small recirculating flume, observed that (1)
there was no particle movement on the plane bed before
ripple formation, and (2) the mean velocity for cess-
ation of particle movement on the ripple bed was about
one-half that at which first movement occured on the
plane bed.
Objective
The objective of this study is threefold:
1. To study ripple propagation downstream of a
sediment mound made on the bed for flows above
the critical point for particle movement.
2. Repeat (1) for flows below the critical point
for particle movement to see if ripples can
form under such circumstances.
3. If ripples do sometimes form as in part (2),
to develop a technique for predicting the flow
conditions and mound geometries necessary for
propagation.
It should be noted that Liu (1957) and Kennedy (1963)
- __ __ - 'NOWNW61"

20
suggest that plane-bed grain motion is necessary for
ripples to form and propagate even if the bed has irreg-
ularities. Rathbun and Guy (1967), on the other hand,
observe that grains move on a rippled bed under velocities
up to one-half those necessary for plane-bed particle
movement.
Acknowledgements
The author wishes to thank Professor John B.
Southard for his suggestion of this thesis topic and
for his helpful advice throughout the course of the
study.
My wife, Janet, deserves special thanks for her
encouragement during the course of the work and for
the typing of this thesis.

APPARATUS
The apparatus used in this study consisted of a
recirculating flume with a bed of fine sand, and an
instrument carriage.
Flume
The flume consisted of a rectangular channel and
a return pipe (Fig. 3). The channel was constructed
of 3/8 " plexiglas walls and bottom with steel sup-
porting beams and braces. Its inside dimensions were
237" long, 6 1/2" wide, and 13 1/8" deep. A 1 1/2"
by 38" false bottom was placed in the upstream end to
minimize upstream end effects on the sand bed. A dif-
fuser made of aluminum honeycomb was located immediately
upstream of the false bottom.
A pair of steel carriage rails, each offset from
the longitudinal center line by 5" and supported by
adjustable bolts set in the steel bracing, ran the length
of the flume. The level of the rails was adjusted so
that they were parallel to a motionless water surface
when the flume slope was zero.
Both water and sediment were recirculated from
the downstream end of the flume by means of a centrifu-
gal pump through a two-inch galvanized pipe. A centri-
fugal pump assures uniform flow without pulses for
all discharges.
The discharge was controlled by two valves located
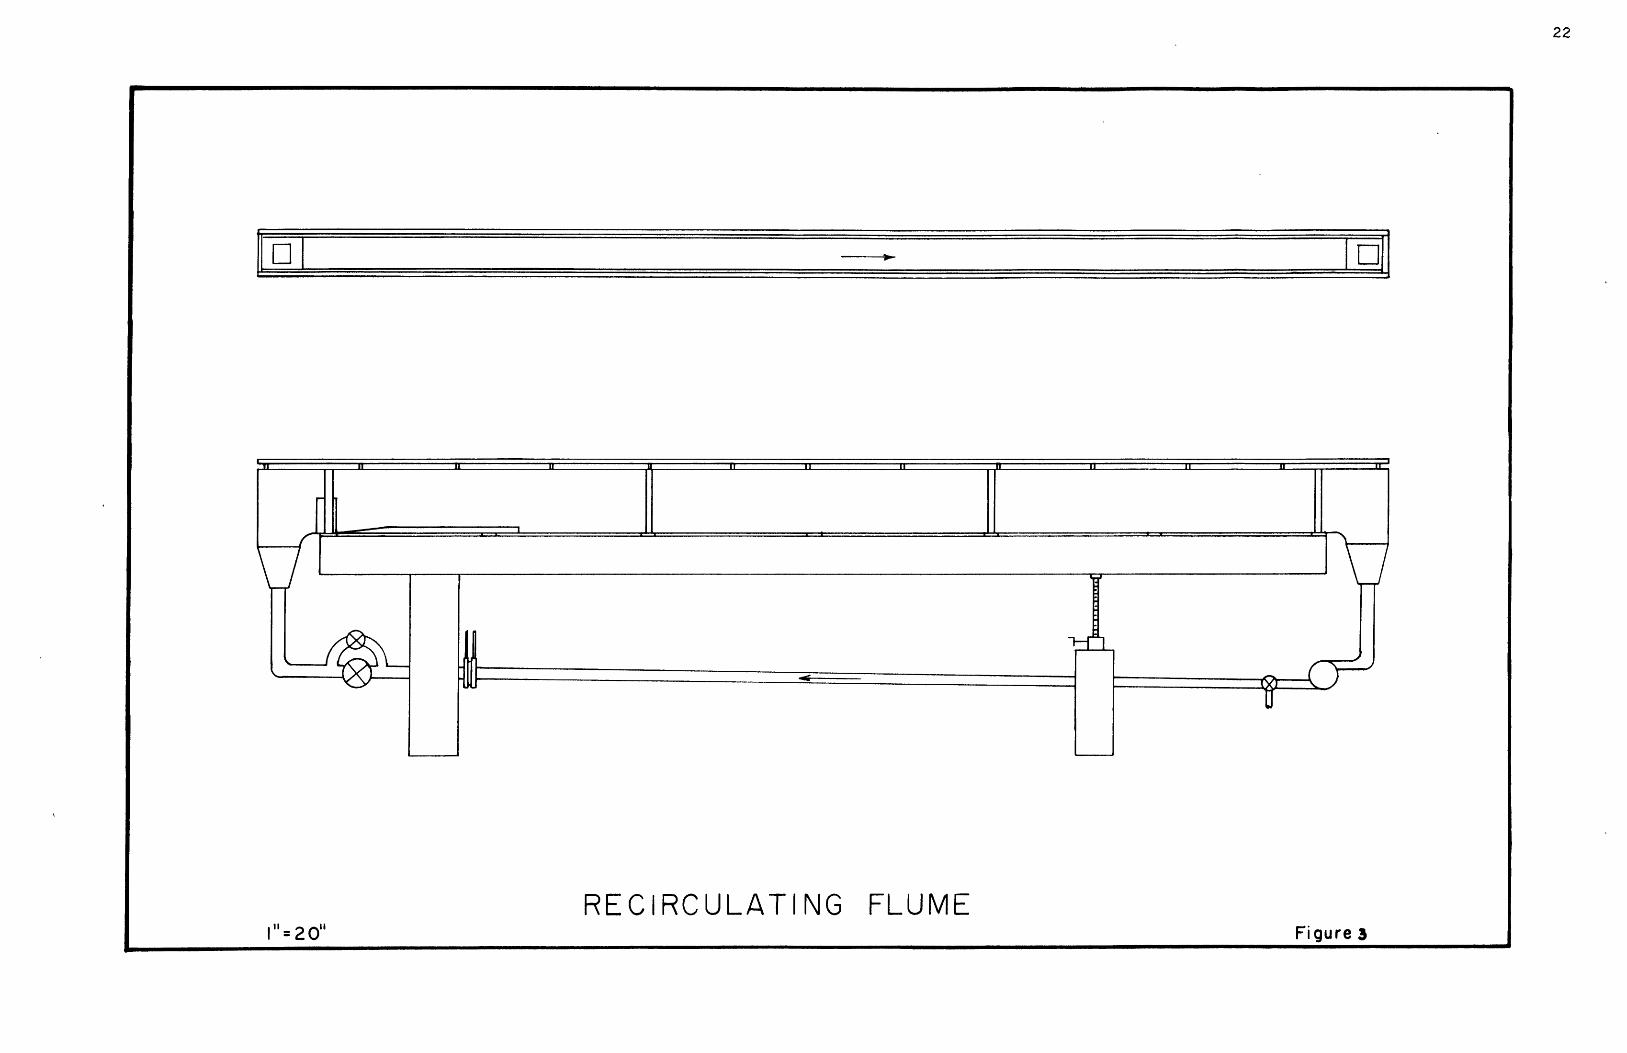
oW v-l
RECIRCULATING FLUME,II = 2 Oil Figure 3 WOMENNOW1 "= 20" i Figure3

23
at the downstream end of the return pipe. Use of
valves allowed both fine and coarse control of the dis-
charge.
The discharge was measured with a sharp-edged ori-
fice meter (1.L40 " dia.) with flange taps. The orifice
was located far enough downstream in the return pipe
so that a standard calibration curve could be used(Appen-
dix B). The pressure dr6p was measureion a water man-
ometer or a mercury manometer, depending on the discharge.
The channel slope was varied by means of a pair of
hydraulic jacks at the downstream channel support. The
slope could be increased continuously from zero to a
maximum value greater than any needed during the study.
Carriage
Except for the orifice meter, all measuring devices
were mounted on the instrument carriage. The carriage
(Fig. 4) was constructed of steel. The point gage sup-
port on the carriage front could slide on a flange, allow-
ing depth measurements at any point of the flume. The
pointer rode above a meter scale attatched to the top
of the angle iron supporting the carriage rails. Distance
measurements could be read to within 1 mm and could be
estimated to 0.1 mm.
A 35 mm Nikkormat camera with a Micro-Nikkor Auto
55 mm, f3.5 lens was used for all pictures. Its height,
18 " above the carriage, permitted a field of approxi-

m
amera support(18")
Point gage support
INSTRUMENT CARRIAGE(3/16)"= I" Fi 4
no
25
mately 30 cm along the flume and completely across it.
When the point gage was removed, a bed leveler
could be mounted on the point-gage support. The leveler
consisted of two rectangular pieces of 3/8 " plexiglas
with a rubber spacer flush with the edges. The leveler
could be adjusted to any height and could reproduce bed
heights to better than 0.1 mm.
Sand
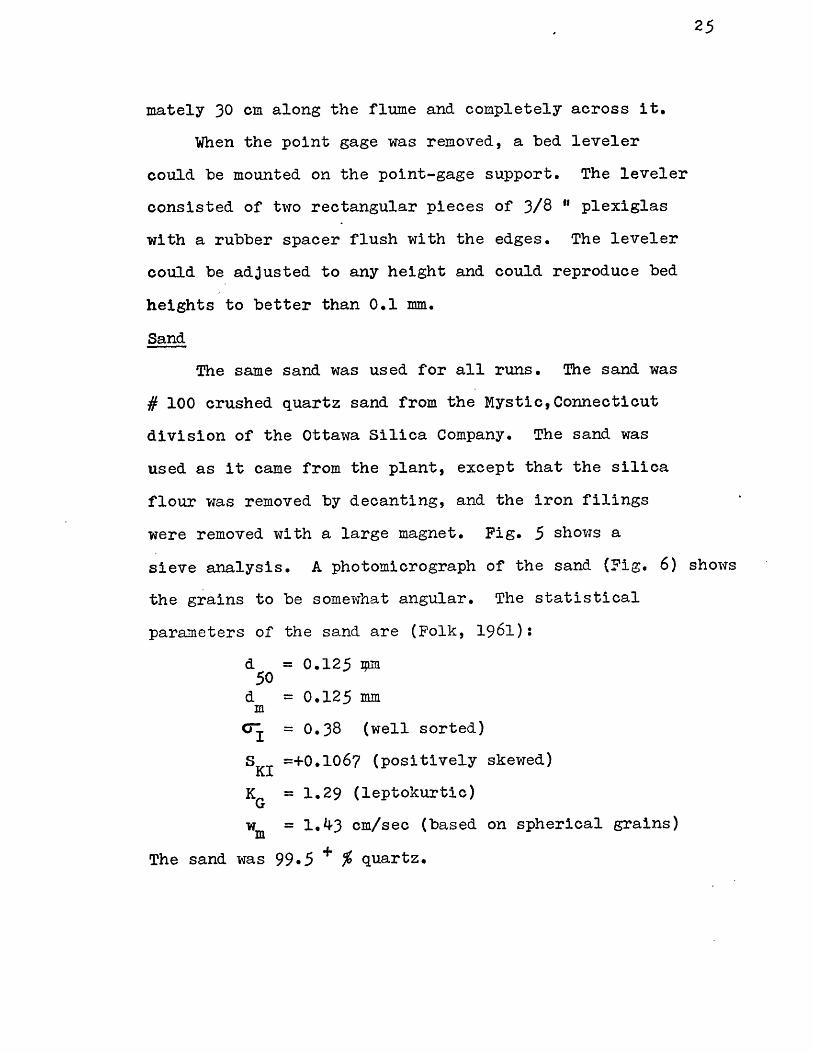
The same sand was used for all runs. The sand was
# 100 crushed quartz sand from the Mystic,Connecticut
division of the Ottawa Silica Company. The sand was
used as it came from the plant, except that the silica
flour was removed by decanting, and the iron filings
were removed with a large magnet. Fig. 5 shows a
sieve analysis. A photomicrograph of the sand (Fig. 6) shows
the grains to be somewhat angular. The statistical
parameters of the sand are (Folk, 1961):
d50 = 0.125 rm
d = 0.125 mmm
c-j = 0.38 (well sorted)
SKI =+0.1067 (positively skewed)
KG = 1.29 (leptokurtic)
w = 1.43 cm/sec (based on spherical grains)M
The sand was 99.5 + % quartz.

100
80
60
40
20
PHI SCALE
Fig. 5. - Sieve Analysis
26
w(9
Hzw0wa-HI(9i:~i
w
H':1:-J
0
4.0

27
Fig. 6 - Photomicrograph of the sand

28
PROCEDURE
The procedure, the same for all runs, consisted
of the following steps:
(1) Level the bed.
(2) Set the water depth.
(3) Adjust the slope.
(4) Form a sand mound.
(5) Set the discharge and start the timer.
(6) Stop the flow to make height and spacing
readings and to take pictures.
(7) Repeat (5) and (6) several times.
(8) Check the water slope intermittently.
The bed was leveled with the pump off and with
several inches of water in the flume. First the bed
was stirred up to remove any packing inhomogeneities
caused by the ripples of the previous run. Then the
bed leveler was lowered to the false bottom, set at that
position, and the carriage slowly drawn downstream. Low
spots were filled with sand from the downstream end of
the bed. This process was repeated until a flat bed of
the same height as the false bottom was obtained every-
where in the flume. The bed height was reproducable
to the accuracy of the point-gage measurements, 0.01 cm.
The false bottom eliminated the time-consuming
process of tapering the upstream end of the bed. The
honeycomb diffuser immediately upstream of the false

29
bottom eliminated any irregularities which might have
been introduced by the return pipe. Observation indi-
cated that the combination of the two eliminated any
entrance irregularities.
The water depth was set with the pump off. First,
water was drained out until the water surface level was
slightly below the chosen depth. Then the point-gage
was set along the longitudinal center line of the flume
.nd the required depth set on the gage scale. Water
was slowly run into the flume until the water surface
reached the tip of the point-gage. Finally, the water
surface level was read and recorded at the upstream and
downstream ends of the flume and the actual depth
calculated. In this manner, the actual depth was with-
in 0.01 cm of the desired depth.
The slope was adjusted to approximately uniform
flow. The discharge was brought to the desired value
and the water surface level measured at several points
along the flume centerline. Then the flume was raised
or lowered until the water surface was parallel with
the rails. Conditions were such that no-ripples formed
during this time.
Once the slope had been adjusted, the flow was
turned off and the water surface allowed to come to rest.
At this point, the actual slope of the bed could be cal-
culated by measuring, at both ends of the flume, the

water surface elevation relative to the rails. Thus,
S = AH /Ax (8)
where S is the flume slope for uniform flow, A H is
the difference in elevation between the two points, and
Ax is the distance separating the two points parallel
to the carriage rails.
A mound was then manufactured on the bed. The
point gage was lowered into the sand along the center-
line of the flume and in the upstream part of the bed.
The carriage was then drawn downstream a few centi-
meters and the point gage removed. This left a curved
mound as shown in Fig. 7.
Figure 7 Mound at time zero
The height and position of the crest were then
recorded. If a mound of a certain height was required,
the above process was repeated until the height was
reached. Such heights could be reproduced to 0.01 cm.
with little effort.
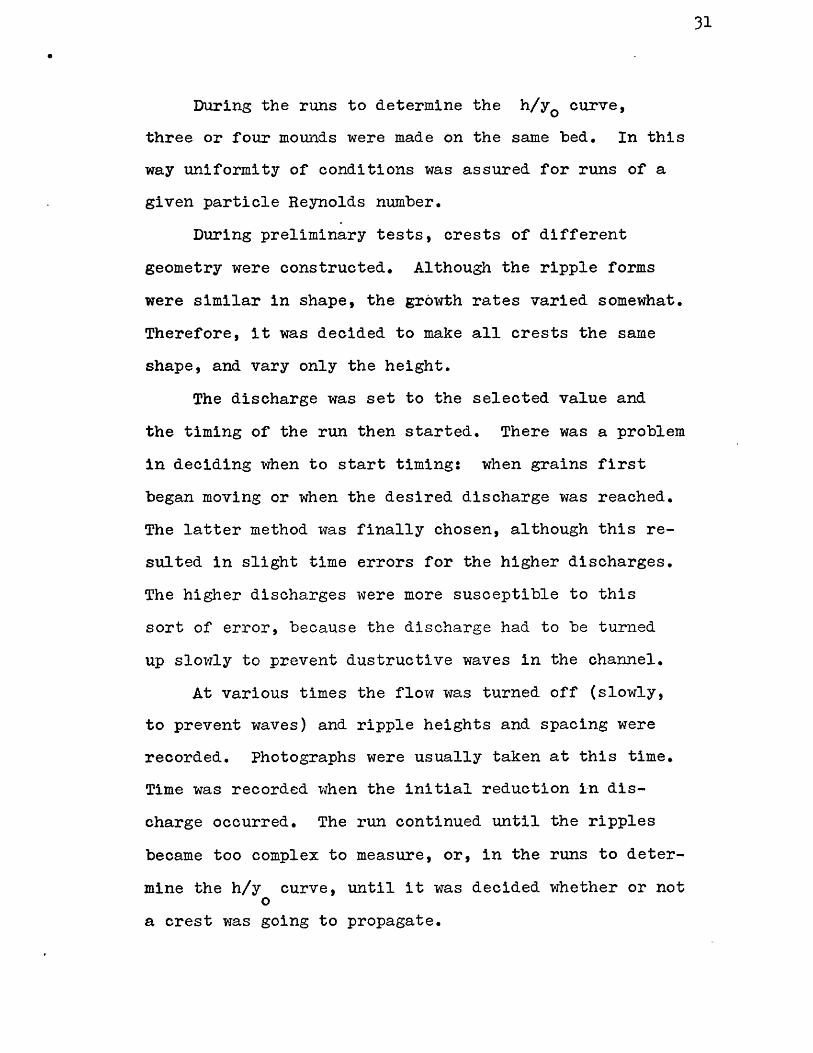
During the runs to determine the h/yo curve,
three or four mounds were made on the same bed. In this
way uniformity of conditions was assured for runs of a
given particle Reynolds number.
During preliminary tests, crests of different
geometry were constructed. Although the ripple forms
were similar in shape, the growth rates varied somewhat.
Therefore, it was decided to make all crests the same
shape, and vary only the height.
The discharge was set to the selected value and
the timing of the run then started. There was a problem
in deciding when to start timing: when grains first
began moving or when the desired discharge was reached.
The latter method was finally chosen, although this re-
sulted in slight time errors for the higher discharges.
The higher discharges were more susceptible to this
sort of error, because the discharge had to be turned
up slowly to prevent dustructive waves in the channel.
At various times the flow was turned off (slowly,
to prevent waves) and ripple heights and spacing were
recorded. Photographs were usually taken at this time.
Time was recorded when the initial reduction in dis-
charge occurred. The run continued until the ripples
became too complex to measure, or, in the runs to deter-
mine the h/y curve, until it was decided whether or not0
a crest was going to propagate,

32
Intermittently, the water surface slope was
checked for deviations from uniform flow due to changes
in the flow resistance caused by the growth of the bed
forms. If necessary, the slope was readjusted until
uniform flow was obtained. Insuring uniform flow was
the greatest problem encountered, since the shortness
of the flume limited the ability to measure depth vari-
ations accurately while the run was in progress.

33
RESULTS
The results of this study are presented in
Table 1 and in Figs. 8 - 21 and in Fig. 27. Table 1
lists flow conditions for the runs. Figs. 8 - 17 show
crest spacings as a functions of time; they are arranged
to correspond to the section of discussion of results
(p. 46). One graph (Fig. 18) shows crest height as a
function of time, and another (Fig. 27) shows h/yo
vs. Rep; these are placed in the discussion of results
(p. 46 ) for ease of evaluation. The photographs (Figs.
19, 20, and 21) are also placed in the discussion of
results (facing p.49 ) to permit easy reference while
reading the sub-section on crest shape (p. 46 ).
Intermediate data can be found in Appendix C.

34
Table 1 - Flow conditions and mound geometries for theruns
(a) Re P RePC
Run
123456789
10
(b) Re (
11
12
13
14
15
U (cm/sec) y0 (cm)
15.415.415.413.813.813.811.815.016.713.0
4.824.824.824.874.874.873.955.154.823.19
RepPC
10*1
10.5
8.7
44?0
4.76
3.91
5.3
4.4 2.50
S (x10 ) U* (cm/sec) ho (cm)
5.965.965.963.853.853.854.715.006.535.95
2.70
3.08
1.70
0.96
1.15
1.681.681.681.361.361.361.351.591.761.38
1.12
1.20
0.81
0.67
0.53
0.340.340.340.300.390.520.360.460.430.26
0.47,0.95,0.09,0.38.0.760.75,1.89.2.38,3.33,0.97,1.74,
0*721.080.250.50
1.151.532.883.811.502.00

35
0 60time (min.)
Fig. 8. - Crest spacing s vs. time for Run 1;sn=4, Rep = 2.15, h/yo = 0.071
s(cm)

s (cm)
6-
4-
2-
0 20
Fig. 9. - Crestsn=4,
40 60time (min.)
80
spacing s vs. time for Run 2;Rep = 2.15, h/yo = 0.071
36
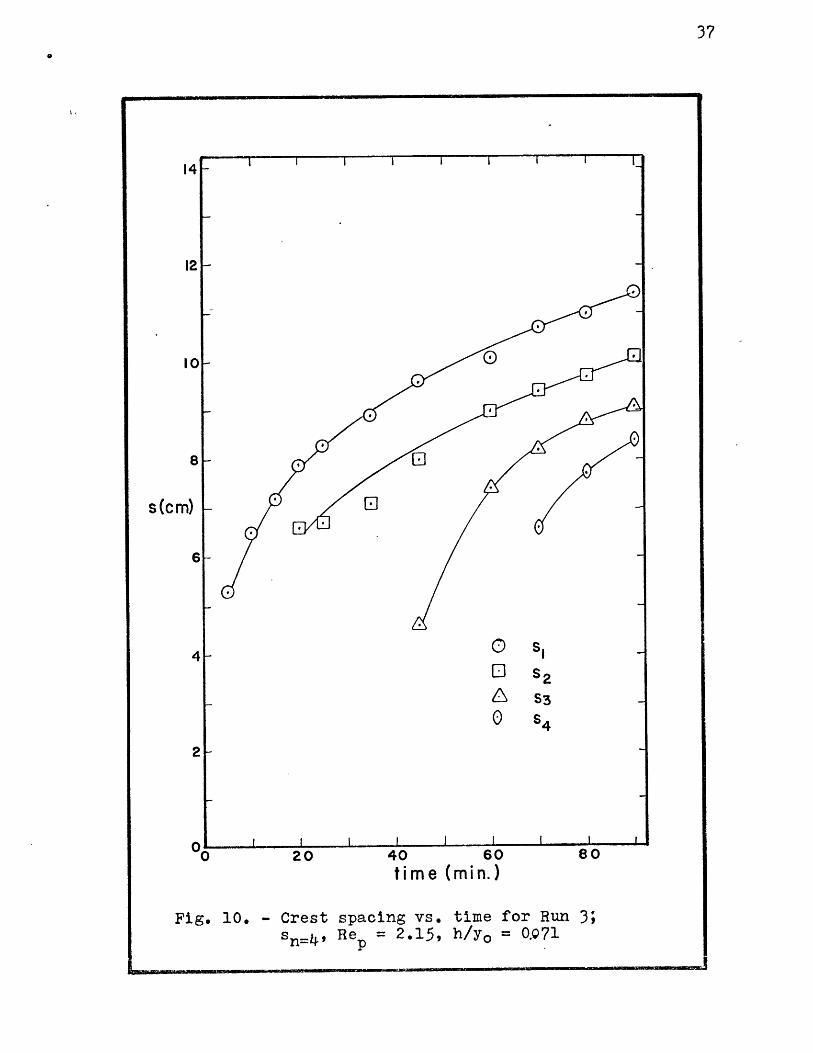
40 60time (min.)
Fig. 10. - Crest spacing vs.sn=4, Rep = 2.15,
time for Runh/yo = OQ71
37
s(cm)
3;

38
14
10
8
s(cm)-~
6-
4- 0 SO sl S 2
L SS
2
0 -0 100 200 300 400
time (min.)
Fig. 11. - Crest spacing s vs. time for Run 4;Sn=3, Rep = 1.?4, h/yo = 0.062

14
12
10
8
s (cm)
61
4 - - i
E S2
La S30 S4
2-
n I I i100 200 300
time (min.)
Fig. 12. - Crests n 4 ,
spacing s vs. timeRep = 1.74, h/y0 =
for Run 5;0.08
400

40
I I I i I 1 1 , I 1.
121-
0 s2
0 S4
2F
O' I I I I I -
100 200time (ml
300n.)
400
Fig. 13. - Crestsn=
4,
spacing s vs. timeReP = 1.74, h/y0 =
for Run 6,0.107
10
8
s(c m)
6
4
f% I

I I I I I I I I I~J
12 F
o s1El S2t S3
I I I I I ~ I
40 60time (min.)
80
Fig. 14. - Crest spacing s vs. time for Run 7;sn=4, Rep = 1.73, h/yo = 0.091
s(cm)
21 -
0U0 20
I I I I I I I I -. L

42
s(cm) -
6-
0 s2£NS3
U s4
2
00 20 40 60 80
time (min.)
Fig. 15. - Crest spacing s vs. time for Run 8;s , Re 2.04, h/y 0 =0'9.n=49 p 0

43
II I I 1 . 1 1 1-
12F
101-
8
s(cm)
6
Si
S2
S3
S4
I I I I I I I
20time
30(min.)
40
Fig. 16. - Crests -4
spacing s vRe = 2.25,
s. timeh/yo =
for Run 9;0.089

44

45

46
DISCUSSION OF RESULTS
Crest Shape
Normally, ripples grow across the entire width
of the flume and are initially two-dimensional --
except near the flume walls. The ripples formed in
this study started with three-dimensional crests and
had a width less than the flume width. The difference
in shape is a result of the mound,- which does not span
the flow. Fig. 19 shows photographs of a typical run.
Figs. 20 and 21 show other aspects of the shape. A
brief discussion of the figures follows.
At time zero a mound is formed with its center
on the longitudinal centerline of the flume (see Pro-
cedure, p.30 ). (All subsequent measurements were made
along the centerline of the flume). Because of the
manner of formation, the mound is curved in shape (Fig.
19a), Theimound becomes two-dimensional when the flow
starts. At this time there is active grain movement
on the stoss slope and in front of the mound.
Within a short time, scour begins just downstream
of the mound. The most active areas are downstream
of the lateral extremes of the mound; scour marks ap-
pear in these two areas (Fig. 19b). Grains move both
downstream and toward the flume centerline. Erosion
along the centerline is much weaker, with the result
that there is a net accumulation of the grains along
the centerline.

47
Soon, the scoured grains begin to organize into
the two lobed feature. At first the lobes are separate,
each downstream of one of the scoured areas, but even-
tually they join (Fig. l9b). The intersection point
lies on the centerline, and marks the downstream end of
a transverse crest. This forms a doubly curved crest
symmetrical about the centerline. The lateral extremes
tail off until they are indistinguishable from the flat
bed. The width of a crest is invariably greater than
the width of the preceding crest.
The first crest downstream of the mound retains
its lobed shape throughout the run (Fig. 19e), the only
changes being that the lobes become angular and that
the longitudinal separation between the intersection
point and the lobe front decreases. The high point of
the crest is not on the front, but just back of the in-
tersection point on the tranverse crest. A longitudinal
cross-section(Fig. 22) clearly shows the shape of the
transverse crest.
After the first crest begins to grow, scour begins
anew and a second crest appears (Fig. 19c). In this
way the rippled bed grows one crest at a time (Fig. 19d).
As more ripples appear, ther are variations in ripple
shape. The variations can be attributed to two factors:
(1) widening of the rippled bed with sucessive crests,
and (2) variations in growth rate between the lobes of
a crest.

48
The widening of the ripples continues until they
reach the flume walls. This imparts a "v" shape to
the rippled bed when it is viewed in its entirety (Fig.
20). The widening leads to two changes in the ripple
geometry: either the lobes stay on the lateral extremes
and do not join (Figs. 19e,f), or the number of lobes
increases by a factor of two with the addition of an-
other transverse crest per pair of lobes (Figs. 19 e,f).
In some cases both effects are seen on the same crest.
When the lobes remain on the extremes of a crest,
the interior part of the crest becomes linear. Charac-
teristically, there are no transverse crests in the
interior region, and the grains move directly downstream,
as in grain movement in two-dimensional ripples. When
the extra pairs of lobes form, they usually appear such
that the transverse crest (extended) intersects a high
point of the previous crest. As before, grain motion
is both downstream and toward the transverse crest.
Asymmetry develops when one part of a crest grows
faster than the rest. Usually this occurs in such a
way that the outside lobes of later-formed crests
grow faster than the central, planar portion (Figs.19 e,f)
Sometimes one lobe forms before the other, with the
result that symmetry of the lobal pair is destroyed
(Fig.21a). The asymmetry is accentuated in later ripples
even though the crest which first showed the asymmetry
becomes approximately symmetrical again (Fig. 21b).

Fig. l9a. - t = 0 min
Fig. l9b. - t = 2 min
Fig. 190. - t = 5 min
Figs. 19(a-f). - Stages bf ripple growth below a mound.Flow from left to right.

Fig. 19d. - t - 7 min
Fig. 19e. - t = 12.5 min(mound at far left)
Fig. 19f. - t = 20 min (secondformed crest on left)
Run 9 U w 16.7 cm/seo, yo - 4.82cm
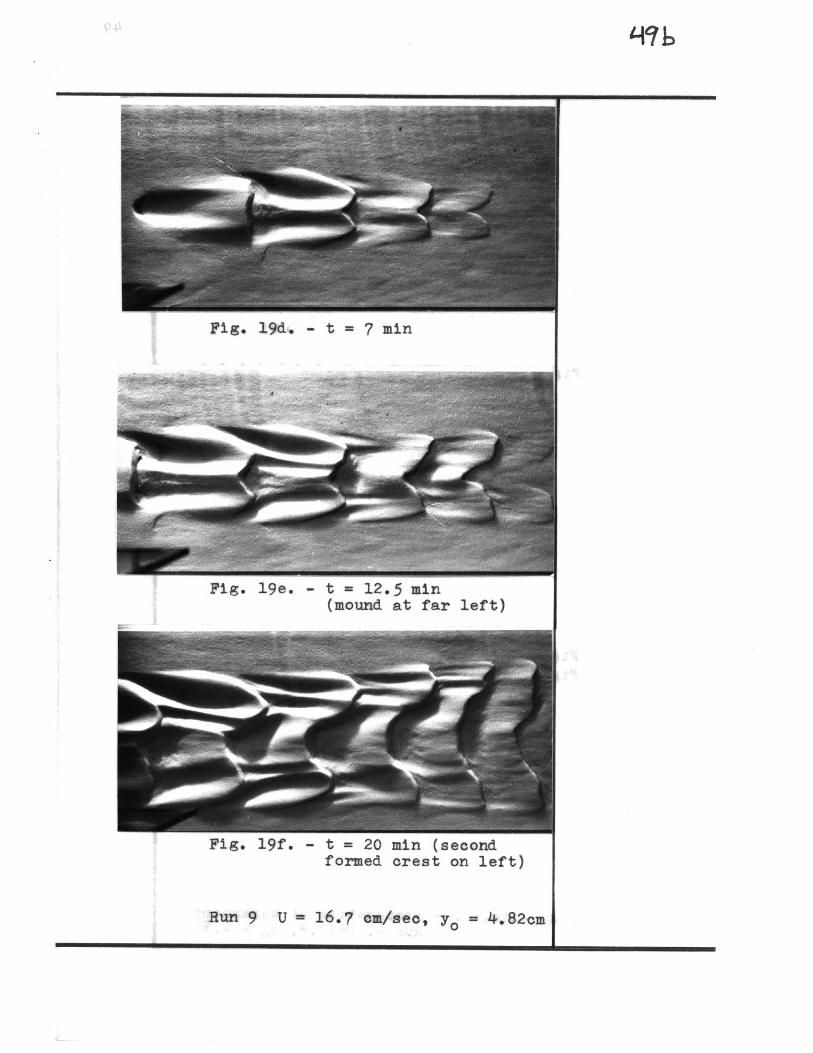
Fig. 19di. - t = 7 min
Fig. 19e. - t = 12.5 min(mound at far left)
Fig. 19f. - t = 20 min (secondformed crest on left)
Run 9 U = 16.7 cm/seo, yo = 4.82cm

Fig. 20. - Growth of a rippled bed belowa mound; typical "V" shapeRun 10, U = 13.0, yo = 3.19
Fig. 21a. - t = 240 min-Fig. 21b. - t = 420 min
Fig. 21(ab). - Propagation of asymmetryRun 4, U=13.8, yo = 4.87

Flow
Transverse crest Intersectionpoint withnormal crest
Me b-ecLetevqto-n
-Depth of adjacent
Fig. 22 - Cross-section ciowing shape of transverse crest
scour
-x

No theory is offered here to explain the shape of
the ripples. Instead, a qualitative explanation, based
upon the observed grain paths, is offered. When the
ripple crest is infinitely wide, the only path for the
water is over the crest. After it passes over the crest
it forms a zone of separation in the lee of the crest.
This phenomenon has been discussed in the Introduction
(p. 17).
Fig. 23. - Flume coordinate system
When the crests have a finite width, the flow can
pass not only over the crest tbp, but also around the
ends of the crest. Consider a coordinate system (Fig.
23) with x, y, and z coordinates as shown. Looking
along the x-axis, the mound appears as a hemisphere in
the yz plane. When the flow encounters this shape it
must not only curve upward (increasing y) but also out-
ward (increasing iz); the relative magnitude depends
on where the flow crosses the hemisphere. The down-
stream result is convergence both downward ( - y ) and
inward ( - jzi), with the flow subsequently impinging on
the bed. The consequence is grain movement which is

inward and downstream. Since motion is symmetrical
about, and inward toward the centerline, grains will
be piled up along it. Thus, lobes with transverse
crests will appear downstream of crestal highs, while
linear crests form downstream of crests of uniform
height.
Ripple Growth; 1.66<ReP < 2.50
The critical particle Reynolds number RePC is
1.66 for sand with dm = 0.125 mm in 700F water. The
value is obtained by a trial-and-error solution of the
Shields diagram as modified by Liu (1957), Given
enough time, if Re P RePC ripples will form on a flat
bed. For the range of Re studied, the time for the
appearance of ripples is of the order of hours. Use
of a mound speeds ripple formation and permits study
of the sequential developement of crests without encoun-
tering the problems of random appearance.
The data have been arranges to illustrate three
aspects of ripple developemnt: (1) reproducibility
of bed forms under constant flow conditions and ripple
geometries, (2) effect of variations in mount height
at constant flow conditions, and (3) effect of varying
flow conditions on mounds of constant relative height
h/y .
For ease of discussion, crest spacing will be de-
noted by s,, i = 1, ... , n with s1 being the space

53
between the mound and the first crest, s2, the mound
spacing between the first and second crests, and so on.
The expression sn=r designates all of the crest spacings
through number r, while sr designates only the rth spac-
ing.
All the runs bhow some general growth characteris-
tics. First, the crests always appear in succession;
two or more crests never form simultaneously. Second,
the rate of ripple growth, in terms of s vs. t for a
given i, is initially rapid and then drops off to some
limiting value; this limiting constant growth rate is
indicated by m . In oneof' the longer runs the growth
rate appears to decrease again, such that mi approaches
zero. This is expected because there is an equilibrium
ripple wavelength; it was not further investigated.
Third, mi increases with increasing i for a given run.
Finally, at some time the height of the ith crest be-
comes greater than the height of the (i-l)th crest for
at least the first few crests (Fig. 18, p. 45 )*
The flow conditions and mound geometry of run 1
were repeated in runs 2 and 3 to determine the degree
of reproducibility of ripple growth. Fig. 24 shows the
increase in s for the three runs, while Figs. 25 and
26 show the increase in s2 and s 3 respectively. The
data for si could easily be fit to a curve. Some devi-
ations appear in the s2 plot but a curve still fit all

54
si(cm) -~
6-
4 0 runtGi run 2i? run 3
2
0 I I I I I0 20 40 60 80
time (min.)
Fig. 24. - Reproducibility of sl for different runs.Re- = 2.15, h/yo = 0.71

s2(cm) -
6-
4
2
0
Fig. 25.
40 60time (min.)
- Reproducibility or s2 for difrerent runs.Rep = 2.15, h/yo = 0.71
55

56
12 1-
lo-
0 4L
0 run IEJ r un 2A run 3
I I I
20 40 60time (min.)
I I I I
80
Fig. 26. - Reproducibility of s3 forRep = 2.15, h/y0 = 0.7
different runs.
81-
s5(c m)
I I
RMAK9
61-
the data. The variations in the data for s are
large enough to prevent representation by a curve.
Reproducibility is expected to decrease as i increases,
because of increased chance for asymmetry, but the plots
nevertheless indicate that the ripple propagation is
a deterministic process instead of a random one.
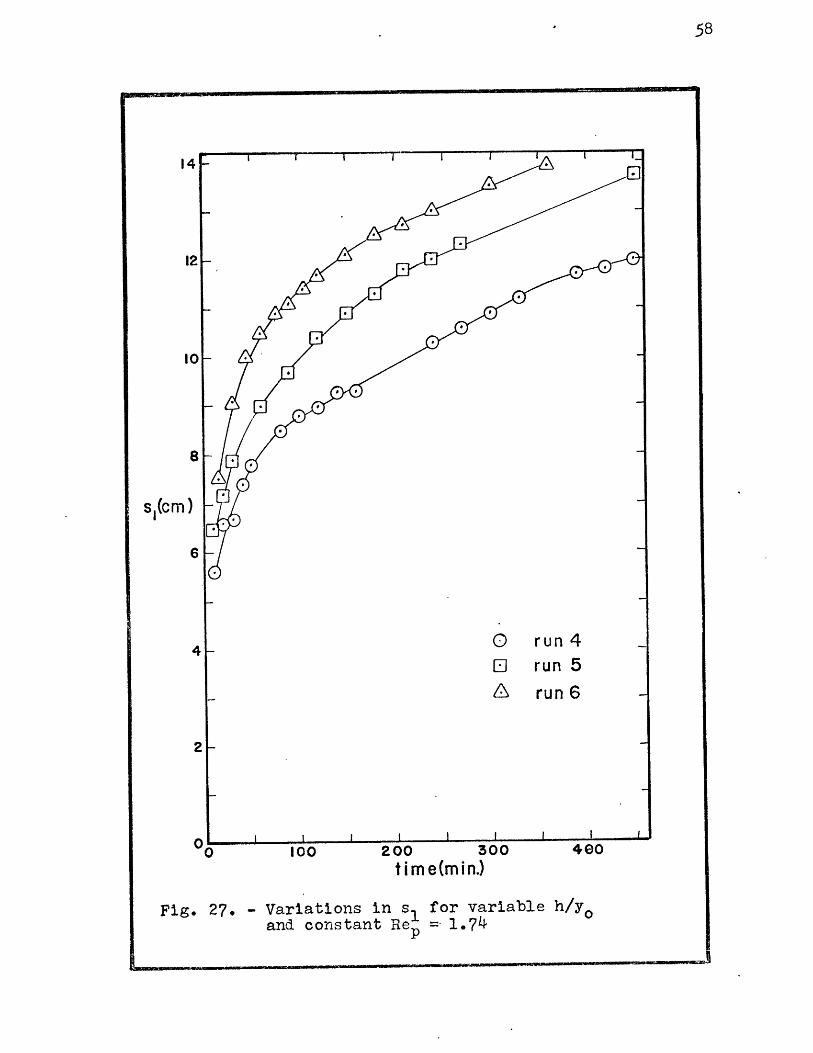
Runs 4, 5, and 6 compare growth rates under con-
stant Rep and varying h/y . The increase in s for the
three runs is compared in Fig. 27. Although the three
curves have the same slope, they are displaced from
each other along the abscissa, with larger h/y corre-0
sponding to larger: . Since reproducibility of the increase
in s1 has been shown for constant Rep and h/y , the dis-
placement is related to change in h/y0
Growth rates change when Rep is varied and h/y
is held constant. Table 2 lists m for runs 7, 8, and
9. In general, m increases as Re increases for a given
s. Exact values of m 3 and m4 must be held suspect, but
the relative values are acceptable to show this Rep effect.
Table 2
Change in Growth Rate for Variable Reand Constant h/yo (=0.9)
Run Rep M 1 m2 i 3 in
7 1.73 0.05 0.045 0.05 0.065
8 2.04 0.09 0.12 0.18 0.25
9 2.25 0.16 0.18 0.11 --
300e(min.)
Fig. 27. - Variations in sand constant Rep
for variable h/y0=- 1.74
58
s,(cm
200tim

Ripple Growth; ReP < Rep.
For certain values of h/y a rippled bed forms0
even though there is no flat-bed grain motion. The
geometrical and growth characteristics of these ripples
are similar to those of ripples formed when Rep Rep,
(Fig. 17, p. 44). As would be expected, the growth
time was of the order of days. There were some mound
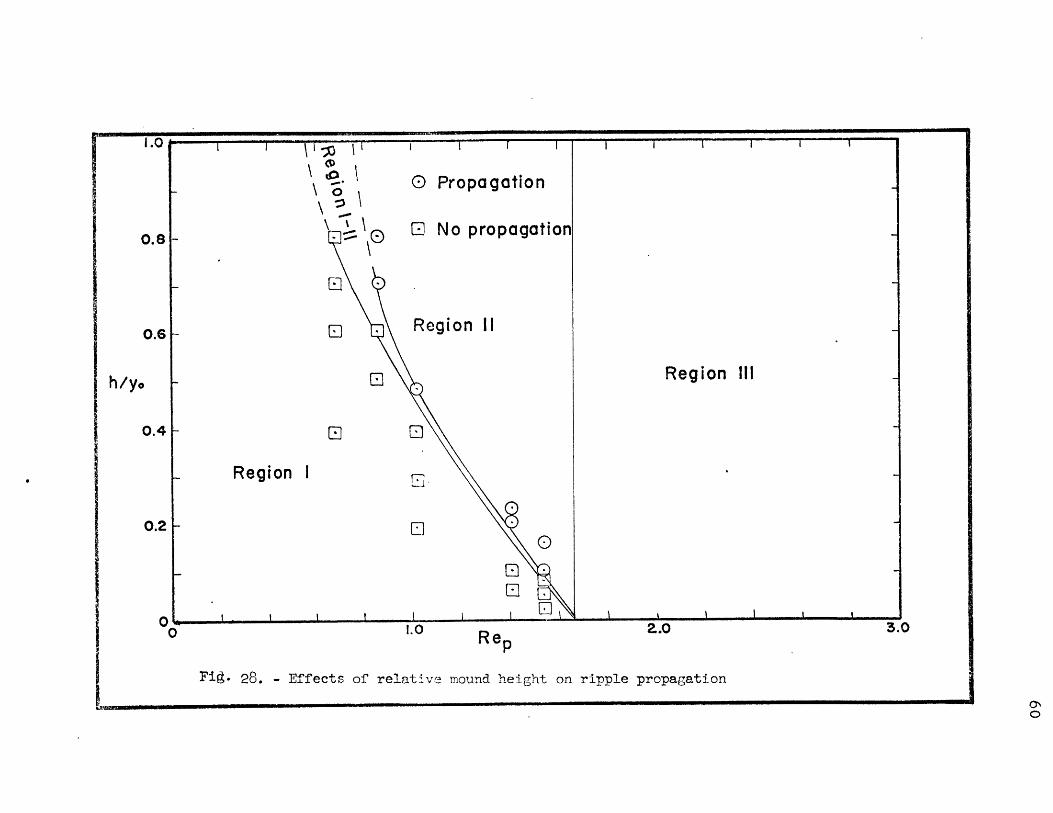
heights which did not produce a rippled bed (Fig. 28);
these mounds invariably caused some initial scour, but
the growth eventually ceased. Fig. 2$ is divided into
three distinct regions and a transition region according
to the nature of the ripple propagation.
In Region III a rippled .bed forms .at all values
of h/y0, since Re P7 Rep., Of course, the ripples will
form sooner if there is a mound, but the purpose of the
graph is to show regions of growth and non-growth, and
not rate of growth.
In Region II ripples will propagate downstream of
a mound even though ReP < Re PC There is no ripple
propagation in Region I. The experimental method pre-
vented an exact determination of the curve- separating
Regions I and II. Therefore, a region of uncertainty,
Region I-II, is shown. This region is bounded by curves
through the points of minimum propagation and maximum
non-propagationi as determined in this study.
1.0 I f I I I
0.8- - -
0.8- E . Region 11
h/y. - Region
0.4- E
Region I
0.2- El0
0o ' I I I ' - 'I0 1.0 Re P Z.R
Fig- 28. - Effects of relative mound height on ripple propagation

CONCLUSIONS
(1) Ripples propagate downstream of a mound for the
following conditions:
(a) ReP-> Re and any h/yo value.
(b) Re < Repc and h/y greater than some
limiting value.
(2) Crests forming downstream of a mound of finite
width are three-dimensional in shape, with two
lobes separated by a transverse crest.
(3) The scour characteristics downstream of a mound and
downstream of crestal highs are the result of the
kind of flow expansion. The velocity vector has
x, y, and z components, whereas the velocity vec-
tor over an infinitely wide crest has only x and
y components.
(4) The spacing between adjacent crests grows in a
predictable manner.
(5) The limiting growth rate (for the times studied)
increases as i increases for a given run.
(6) For a given si, the growth rate increases for
both increasing Re and h/yp o
(7) The shortness of the flume prevented accuracy
at values of Re less than 0.78 because of largep
inaccuracies in determining the slope at such
small slopes.

62
SUGGESTIONS FOR FUTURE WORK
(1) The nature of the flow around a crest of finite
width should be studied quantitatively.
(2) Other mound geometries should be studied and
compared with the geometry used in this study.
(3) A longer flume should be used to study the nature
of ripple propagation for values of Re ( 0.6.

63
SUMMARY
Of some interest in the ripple problem is the
prediction of the flow conditions necessary to pro-
duce a rippled bed; i.e., the critical flow conditions
for a given shear velocity and sediment size. Shields
(1936) and Liu (1957) experimentally derived curves
which predict ripple initiation in terms of the beginning
of particle motionunder the main assumption that ripples
form when sediment of the mean diameter is in motion on
a flat bed. Until recently (Rathbun and Guy, 1967),
most authors have believed that a rippled bed would
revert to a flat bed if conditions dropped below the
critical point.
Although some investigators have observed ripple
propagation due to bed irregularities, the writer knows
of no detailed studies on this aspect of ripple growth.
This study investigates ripple initiation and growth
downstream of a-mound of bed material. All the work
was done in the range ReP< 3, for which ripples propa-
gate more rapidly because of the mound than they grow
and propagate from a completely flat bed. The study is
extended into the flow regime with no flat-bed particle
movement to determine whether a rippled bed would still
develop. The possibility of a bed becoming rippled be-
low a mound for such flows has important implications
for both geologists and hydraulic engineers. A river'bed
does not start flat, but has irregularities of various
shapes on it. Thus, a rippled bed may not always indi-

64
cate flow conditions greater than some minimum value,
or a channel designed for velocities less than those
necessary for flat-bed particle motion may not remain flat.
All the work was done with fine quartz sand (dm
0.125 mm) in a recirculating flume 20 ft. long, 6.5"
wide, and 13" deep. Flow rates were measured with an
orifice meter, and spacing and height were measured
from a movable carriage. The bed -was leveled before
each run, and a mound was made on the bed along the
flume centerline. Uniform flow as obtained by setting
the water depth and flow rate and then adjusting the
flume slope, and was maintained by checking the water
depth during the run and changing the slope whenever
necessary.
At various times during the run, the flow was
stopped and crest spacing and crest height measurements
were made. Photographs were taken throughout the run.
The data were divided into three parts corres-
ponding to three major aspects of the study. The first
part consists of a description of the ripple shape pro-
duced downstream of a mound of finite width. The second
part is the analysis of ripple growth when the particle
Reynolds number is greater than critical. The third
part presents the conditions necessary to propagate
ripples when the particle Reynolds number is less than
critical.
When water flows over a crest of infinite width,

it produces a separation zone in the region in the lee
of the crest. At some distance downstream of the crest,
the water impinges on the bed and moves sand grains
downstream. The grains aggregate at a point further
downstream, and another crest begins to form. When the
water encounters a mound it flows not only over it but
also around it. When the water passes into the lee
region of the mound, it has downward and inward velocity
components. This causes nonuniform scour on the bed,
with two active areas of scour just inside and down-
stream of the lateral extremes of the mound. The result-
ing crest is two-lobed with a transverse crest along
its longitudinal centerline (Fig. 29).
Fig. 29. - Typical two-lobed ripple withtransverse crest
The transverse crest forms because the velocity has a
component directed inward toward the centerline of the
bed in the lee of the mound. This crest shape also
appears whenever the upstream crest is of nonuniform
height.

66
Data on growth of these ripples are presented
in the form
s =f (t) (10)
where s is the crest spacing between successive crests,
i and i-l (i = 0 for the artificial mound), and t is time.
Two trends and the degree of reproducibility are analyzed..
For a given h/y and ReP the degree of reproducibil-
ity decreases with increasing i. The first spacing was
reproduced quite well for three runs; the second spacing
approximately fit a single curve; the third spacing
could not be fit to a curve.
A plot of s vs. t for a given i shows a growth
that is initially rapid, but soon decreases to a rate
which remains linear over the rest of the r'un (Fig. 30).
SiS
t--
Fig. 30. - Growth of drest spacing s with time
For a given run mi, the limiting slope of the curve,
increases slightly as i increases. For runs in which
Re was held -constant and h/y was variedA the curves
for i = 1 have the same slopes but are displaced up
the si axis with increasing h/yo. For runs in which h/y0
was held constant and Re was varied, the m. increasesp1
67
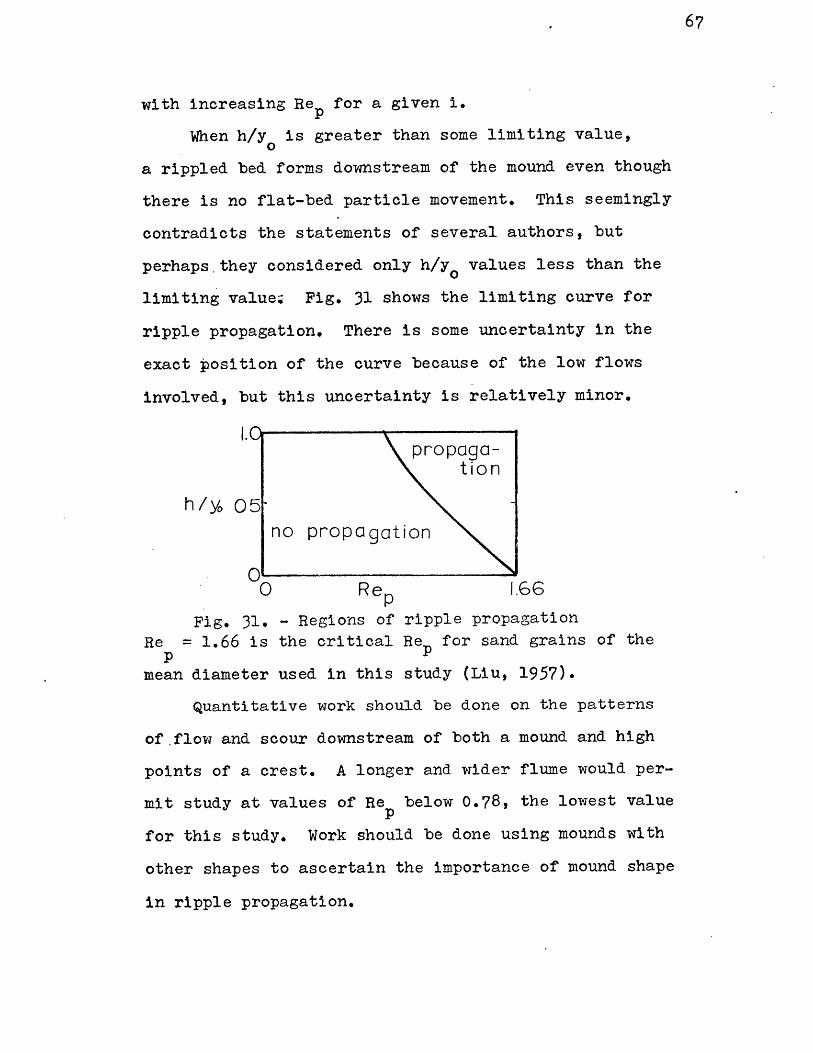
with increasing Rep for a given i.
When h/y0 is greater than some limiting value,
a rippled bed forms downstream of the mound even though
there is no flat-bed particle movement. This seemingly
contradicts the statements of several authors, but
perhaps,they considered only h/y values less than the
limiting value Fig. 31 shows the limiting curve for
ripple propagation. There is some uncertainty in the
exact position of the curve because of the low flows
involved, but this uncertainty is relatively minor.
1.Cpropaga-
tion
h/y 05no propagation
010 Re 1>6
Fig. 31. - Regions of ripple propagation
Re = 1.66 is the critical Re for sand grains of thepp
mean diameter used in this study (Liu, 1957).
Quantitative work should be done on the patterns
of flow and scour downstream of both a mound and high
points of a crest. A longer and wider flume would per-
mit study at values of Re below 0.78, the lowest value
for this study. Work should be done using mounds with
other shapes to ascertain the importance of mound shape
in ripple propagation.

68
APPENDIX A
Notation
b flume width
C1, C2 shape factor
d 50 median grain size
dm mean grain size
Fr Froude Number
f , drag force on a particle
f resistance force of a particle
g acceleration due to gravity
H water level reading on point gage
h mound height
K Graphic Kurtosis
k, shypothetical roughness elevation
mi limiting value of si vs. t curve
R channel hydraulic radius
Rb bed hydraulic radius
ReP particle Reynolds Number
Re g n value of Re necessary to just movepcgrains of P dm
S Energy slope = bed slope for uniformflow
SKI Inclusive Graphic Skewness
s icrest spacing between ith and (i-l)thcrests
t time
U mean velocity

69
U* shear velocity
w particle fall velocity
w fall velocity of grains of dm m
x longitudinal flume coordinate
y vertical flume coordinate
YO normal water depth
z transverse flume coordinate
thickness of laminar sublayer
/4 absolute viscosity
kinematic viscosity
ZT 3.1428
density
s sediment density
Inclusive Graphic Standard Deviation
bed shear stress

70
APPENDIX B
Orifice Calibration
The orifice was calibrated by using a standard
equation (tquation (11)) for a sharp edges orifice with
flange taps.23
U y b = 0.0438 d c VT. ft /sec (11)
whered = orifice opening
hm = difference in heights between legs ofmanometer
C is a factor which is a function of theflow Reynolds Number
is the water density based on T = 70 OF.
c is a constant when Re > 10 5. The flows for this
study were all in the region Re (105 so that equation
(11) had to be solved by interpolation with a Re vs. c
graph. The result is shown in Fig. 32.

140
120
100
Uyocm2( sec
A H (cm H.0)
Fig. 32. - Orifice Calibration
W4

72
APPENDIX C
Summary of Data
Table 3 - Run 1
t (mi n)
05
1015203040506o708090
3.0343.0593.0673.0733.0773.0833.0893.0943.0983.1013.1053.107
0.340.260.260.250.250.270.280.280.290.300.300.33
3 h305
10152030405060708090
3.3273.3543.3783.3963.4143.430
0.010.170.390.520.650.??
3.1143.1313.1443.1563.1723.1833.1943.2033.2103.2183.223
x4
3.4423.4203.4993.528
0.070*120.230.250.330.400.450.470.500.530.58
3.2183.2423.2633.2803.2953.3073.3183.329
0.010.150.260.360.490.520.580.66
'5
0.150.350.510.80
x6 h6
3.3543.5753.611
X8
0.240.450.58
h8
3.575 0.043.640 0.373.685 0.47
3.6883 745
0.080. - 3.791 0.10
05
10152030405060708090
X. (m) , hi (cm)
h 7

390 1i7/1tCZC~o ezveZO00 650*C
84OCgo
198oz Z500'
009? 11 i *0U49Z1 9C0"
~1~/9Z11109o110
zx 0I t
9909C5T0*CC966o
69*z
T99 z
-cx
(tao) T4' (M) Ix
3 unH -j, a qaL
98
9z8q
61417 0oceo
6569zqz6*Z
Co8% Tfj * 0~ZV0
818
890009*0
9T 0ez 0IT 0
6zvo2300
93*0
04
809 z
ox
88
8L
0(UTta)
47X c T1

74
Table 5-Run 3
X, (m), h (cm)
t (min)
05
10152025354560708090
X0 h
2.5002.5242.5312.5372.5402.5432.5482.5522.5582.5602.5632.565
0.340.260.250.240.240.240.250.260.270.270.270.29
h3
2.5772.5962.6092.6192.6262.6362.6482.6502.6672.6732.679
X4
0.080.150.200.230.260.310.360.410.410.420.42
x2
2.6852.6932.7072.7282.7502.7612-7702.780
x3
10152025354560708090
t
05
10152025354560708090
2.??42.8242.8432.8582.871
x6
0.00.210.330.440.49
h6
2.9092.9352.955
x7
0.130.340.48
2.9893.030
0.00.00.100.240.350.410-450.50
h5
0.160.38
h7
3.090 0.28 3.134 0.0
h4 x 5

Table 6 -
t (min)
0102030405080
100120140160240270300330390420450480510
0102030405080
10012014016024027030033039042045048o510
Run 4
x i.(m), hi (cm)
X h x
2.4532.4652.4682.4732.4732.4742.4772.4792.4802.4802*4822.4832.4842.4842.4852.4862.4872.4872.4872.487
0.330.300.290.270.260.260.270.280.280.290.290.290.300.300.310.320.320.330.320.33
2.5212.5342.5402.5472.5532.5622.5672.5702.5732.5752.5862.5902.5932.5972.6032.6052.6072.6082.609
x3 h3 x4
2.791 0.052.865 0.162.817 0.252.831 0.34 2.9172.844 Q.39 2.932
75
o.o60.090.130.150.150.220.220.240.260.270.380.390*410,420.450.470.460.470.49
2.6622.6722.6812.6902.7082.7152.7202.7252.731
0.030.120.200.290.430.480.520.550.59
0.00.0

76
Table 7 -Run5
X. (m), h, (cm)
t (min)
01020306090
120150180210240270450
2.4532.4632.4652.4672..4712.4752.4782.4802.4832.4842.4872.4882.500
0.350.390.410.410.440.430.440.440.450.440.420.430.44
xl
2.5282.5372.5462.5612.5722.5822.5892.5962.6022.6072.6112.637
0.020.090.140.230.310.360.400.450.500.530.570.59
2.6592.6762.6922.7032.7112.7212.?71
h 2
0.120.250.480.440.520.580.58
h3
2.738 0.02.767 0.142.789 0.342.806 0.452.822 0.572.895 0.57
2.884 0.232.902 0.493.018 ---
01020306o90
120150180210240270450
2.9793.146
0.26
h 1 x 2

7?
Table 8 - Run 6
x i (in), h i (cm)
xl
2.6162.6322.6412.6462.6512.5632.6562.6592.6632.6672.6702.6732.6782.682
hl -x 2
0.120.180.210.250.240.270.29 2.7190.30 2.7380.32 2.7470.32 2.7600.38 2.7700.36 2.7770.38 2.7900.41 2.802
0.00.060.190.280.360.400.500.54
2.839 0.072.857 0.242.890 0.452.915 0.48
2.9663.308
0.250.41 3.090 0.42
16 3.158 0.15 h6
t (min) X0 ho
01530456o7790
105120150180210240300360
2.5332.5412.5412.5412.5412.5422.5422.5422.5422.5422.5422.5432.5432.5432.543
0.520.460.460.470.470.460.460.460.450.450.440.430.430.420.42
S3 h
01530456o
105120150120150180210240300360
h 5x4

- Run 7
S0 h
1.9381.9561.9661.9741.9771.9791.976
0.360.330.260.260.290.290.33
x3 h
2.2242.2492.2642.275
0.280.430.470.54
2.477 0.422.533 0.55
2.520 0.162.606 0.49 2.657 0.44
Table 9
78
t (min)
072034465566
x
2.0242.0542.0692.0782.0852.086
0.120.180.270.340.350.44
2.0342.1192.1522.1672.1782.183
0.00.130.300.380.410.51
xk
2034465566
2.2872.3222.3442.362
0.100.320. 5Q0.56
2.3772.4212.448
x7
07
2034465566
0.210.530.57
h8x8
Xi (m), h I(cm)
h 1 X2
x6 h 6

79
Table 10 - Run 8
x i(mn), hi (cm)
x 0 h 0 1
2.4682.5032.5082.5122.5162*521
2.7272.8012.8542.936
0.490.340.310.320.330*29
0.150.420.720.32
x6 h6
2.9463.0343.275
0.120.140.28
2.5892.6072.6282.6432.665
2.7652.8722.9323.083
x7
2.9733.0663.350
0.230.330.370.420*48
0.140.440.25
hp
0.010*270.43
2.6352.6752.7202.7522.799
2.9112.9903.188
x8
0.040.260.420.440.33
h5
0.180.480.96
h8
3.017 0.203.400 0.67
t (min)
01017304364
17304364
01017304364
h1
x5
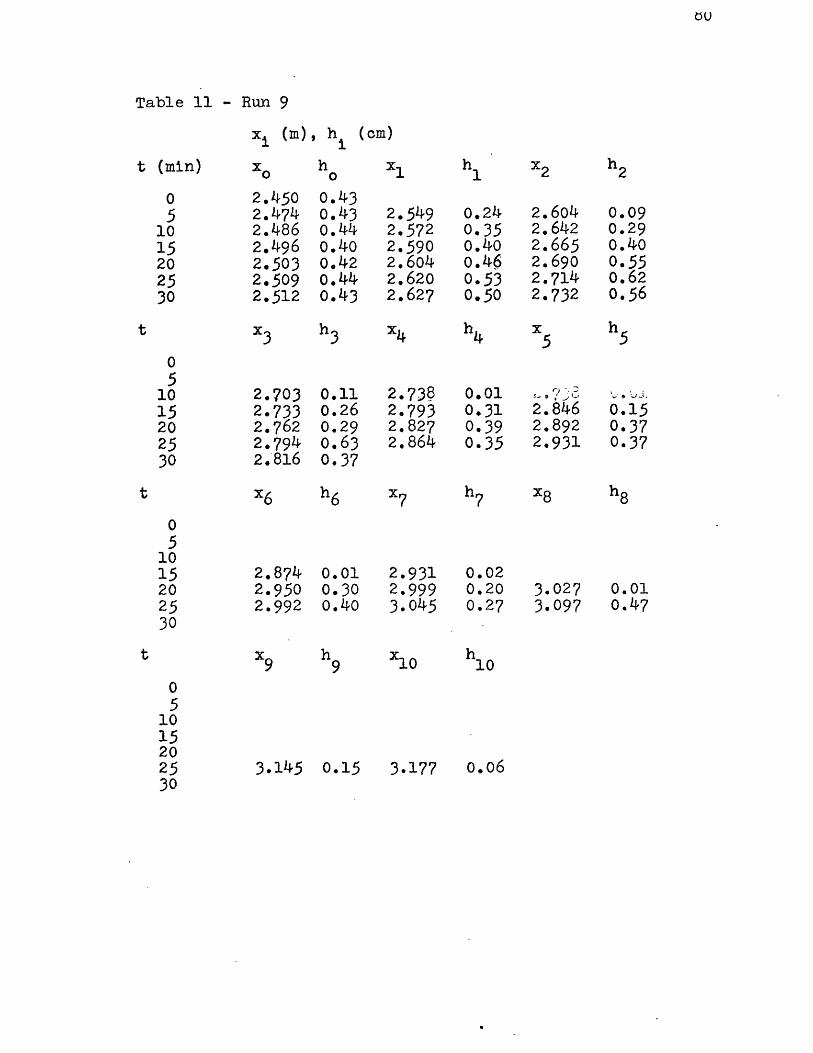
Table 11 - Run 9
xj (m), h (cm)
t (min)
05
1015202530
x 0
2.4502.4742.4862.4962.5032.5092.512
0.430.430.440.400.420.440.43
X3 h 3
51015202530
2.7032.7332.7622.7942.816
0.110.260.29o.630.37
2.5492.5722.5902.6042.6202.627
x4
2.7382.7932.8272.864
0.010.300.40
2.8742.9502.992
9 h 9
3.145 0.15
2.9312.9993.045
x10
0.020.200.27
h10
3.027 0.013.097 0.47
3.177 0.06
x2h1
0.240.35o.40o.460.530.50
2.6042.6422.6652.6902.7142.732
0.090.290.400.550.620.56
55
0.010.310.390.35
2.8462.8922.931
S. J
0.150.370.37
x8
1015202530
05
1015202530
MONMIANowwwwwo-
x 1
x6 h6 ?

Table 12 - Run 10
xi (M), h (cm)
h x
2.4822.4962.5062*5122.5172.5212.5272.5272.5312.533
x3
2.7532.7892.8202.8352.8472.866
0.260.230.210.190.210.21o.160.230.170.19
h 3
0.040.270.400.490.48o.57
x6 h 6
3.007 0.073.074 0.383.100 0.413.153 0.58
t (min) hi x2
07
23436479
100113122143
0.100.190.230.290.310.350.390.380.40
h2
0.050.240.330.410.460.480.50
2.6652.6952.7122.7322.7432.7502.763
x5
2.5572.5842.6002*6142.6222.6322.6352.6402.648
x4
2.8442.8982.9212.9342.961
3.1383.1743.236
723436479
100113122143
07
23436479
100113122143
2.9652.9993.0183.059
0.290.420.410.81
h8
o.o40.360.460.530.74
h7.
0.290.400.51
3.1823.2383.312
0.120.350.51

BIBLIOGRAPHY
American Society of Civil Engineers, Task Committee on
Preparation of Sediment Manual, 1966, Sediment trans-
portation mechanics: initiation of motion: Proc.,
Am. Soc. Civil Engr., Jour. Hyd. Div., v. 92, no. HY2,
p. 291-314.
Barton, J.R. and Lin, P.N., 1955, A study of the sediment
transport in alluvial channels, Fort Collins, Colo.,
Colorado A. & M., Civil Engr. Dept. Report # 55JRB2,
43 p.
Brooks, N.H., 1958, Mechanics of streams with movable
beds of fine sand: Am. Soc. Civil Engrs., Trans.,
v. 123, p. 526 - 594.
Chien, N., 1956, The present status of research on sediment
transport: Am. Soc. Civil Engrs., Trans., v. 121,
p. 833-868.
Colby, B.R., 1961, Effect of depth of flow on discharge of
bed material: U.S. Geol. Surv., Water Supply Paper
1498-D.
Einstein, H.A., 1942, Formulas for the transportation of bed
load: Am. Soc. Civil Engrs., Trans., v. 107, p. 561-
597.
Folk, R.L., 1961, Petrology of sedimentary rocks, Austin,
Texas, Hemphill's, 159 p.
Gilbert, G.K., 1914, Transportation of debris by running
water: U.S. Geol. Surv., Prof. Paper 86, 262 p.
83
Hill, H.M., 1965, Bed forms due to a fluid stream; Proc.,
Am. Soc. Civil Engrs., Jour. Hyd. Div., v. 9, no. HY2,
p. 127-144.
Inman, D.L. and Bowen, A.J., 1963, Flume experiments on
sand. transport by waves and currents: in Proc. of
8th Conf. on Coastal Eng., J.W. Johnson, ed., Council
on Naval Research, the Eng. Foundation, p. 137-150.
Jopling, A.V., 1965, Hydraulic factors controlling the
shape of laminae in laboratory deltas: J. Sediment.
Petrol., v. 35, p. 777-791.
Kennedy, J.F., 1963, The mechanics of dunes and antidunes
in erodible-bed channels, J. Fluid Mech., v. 16,
p. 521-544.
Liu, H.K., 1957, Mechanics of sediment ripple formation:
Proc., Am. Soc. Civil Engrs., v. 83, no. HY2, p. 1-23.
Plate, E.J., 1957, Laboratory studies of the beginning of
sediment ripple formation in an alluvial channel:
M.S. thesis, Colorado State U., Fort Collins, Colo.
Raichlen, F. and Kennedy, J.F., 1965, The growth of sedi-
ment bed forms from an initially flattened bed: Inter-
national Assoc. for Hydraulic Research, Eleventh Intl.
Congress, Leningrad, paper 3.7.
Rathbun, R.E. and Guy, H.P., 1967, Measurement of hydraulic and
sediment transport variables in a small recirculating
flume: U.S. Geol. Surv., Water Resources Research,
v. 3, #1, p. 107-122.

84
Raudkivi, A.J., 1963, Study of sediment ripple formation:
Proc., Am. Soc. Civil Engrs., Jour. Hyd. Div., v. 89,
no. HY2, p. 1 - 23.
Rubey, W.W., 1948, The forces required to move particles
on a stream bed: U.S. Geol. Surv., Prof. Paper 189E,
p. 121-142.
Schlichting, H., 1960, Boundary layer theory, New York,
McGraw-Hill.
Shields, A., 1936, Anwendung der Ahnlichkeitsmechanik und
der turbulenzforschung auf die Geschiebebewegung;
Berlin, Preussich Versuchanstalt fur Wasserbau and
Schiffbau, Mitteilungen, Heft 26.
Simons, D.B. and Richardson, E.V., 1962, Resistance to
flow in alluvial channels; Am. Soc. Civil Engrs., Trans.,
v. 127, p. 927-954.
Sutherland, A.J. and Hwang, L.S., 1965, A study of dune
geometry and dune growth: W.M. Keck Lab, of Hydr.
and Water Res., Tech. memo 65-5, 35 p.
White, C.., 1940, The equilibrium of grains on the bed
of an alluvial channel: Proc., Roy. Soc. (London),
Ser. A, vol 174, p. 322-338.