a fiscal profile of cvusd - chino.k12.ca.us
TRANSCRIPT

A Fiscal Profile of CVUSD
Business Services May 28, 2015

A Journey Through…
Common School Financial Terms
California’s Education Funding
CVUSD Revenue & Expenditure Trends
Governor’s May Revise
Budget Assumptions and 3-Year Projection
Next Steps
2

Common School Financial Terms
3
Average Daily Attendance (ADA) Average number of pupils actually attending classes. Excused absences do
not count towards ADA. Deficit Spending Current-year expenditure in excess of current-year revenues Multi-Year Budget Current-year budget and two subsequent years Local Control Funding Formula (LCFF) New education funding allocated based on grade-span ADA and an
unduplicated percentage of students who are foster youth, English learners, or low-income (Replaces “Revenue Limit”)
Gap Funding The gap between a District’s target funding in 2020/21 and 2014/15 funding
level. Each year the Governor determines the appropriation amount towards funding the gap.
27,000
27,500
28,000
28,500
29,000
29,500
30,000
30,500
31,000
31,500
32,000
2007/08 2008/09 2009/10 2010/11 2011/12 2012/13
15/16 16/17 17/18
$130,000,000
$140,000,000
$150,000,000
$160,000,000
$170,000,000
$180,000,000
$190,000,000
$200,000,000
$210,000,000
2007/082008/092009/102010/112011/122012/132013/142014/15
Base Revenue
Limit
Base Grant
Supplement Grant
State Categoricals
$100,000,000
$150,000,000
$200,000,000
$250,000,000
LCFF Target 2012/13 Funding
Gap Funding

Changes in California’s Education Funding
4
Before LCFF With LCFF
Revenue Limit
Federal Revenue
Other State Revenue
Other Local Revenue
Revenue Limits – A base amount per Average Daily Attendance computed using previous year’s base amount and adjusted with COLA and Deficit Factor. Each District has a different amount.
Categorical Funding – State grants for specialized programs regulated and controlled by the State. Over 40 programs.
Base Funding – Base amount per Average Daily Attendance differentiated by grade span.
Adjustment Funding – Additional % over base amount for K-3 CSR and 9-12 CTE.
Supplemental and Concentration Funding – Additional funding for unduplicated count of English Learners, Low Income and Foster Youth.
50% Unduplicated Count
LCFF Federal
Other State
Other Local
Base Revenue Limit
Base Grant
Supplement Grant
State Categoricals
CSR
Transportation
CTE Transportation
TIIG
TIIG
$100,000,000
$150,000,000
$200,000,000
$250,000,000
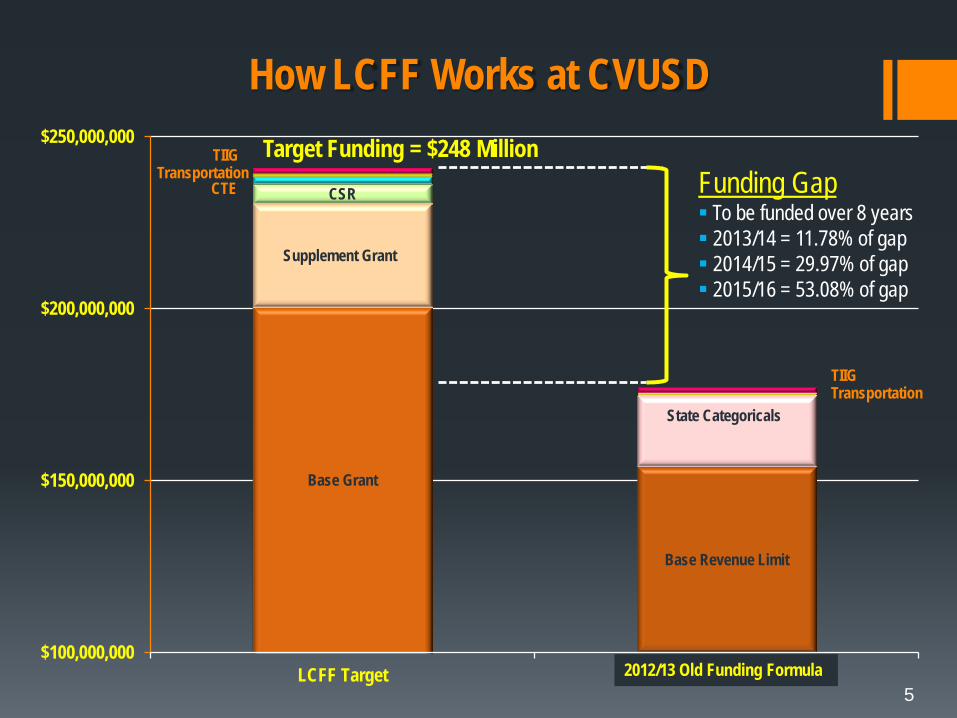
LCFF Target 2012/13 Funding2012/13 Old Funding Formula
Funding Gap To be funded over 8 years 2013/14 = 11.78% of gap 2014/15 = 29.97% of gap 2015/16 = 53.08% of gap
5
How LCFF Works at CVUSD Target Funding = $248 Million
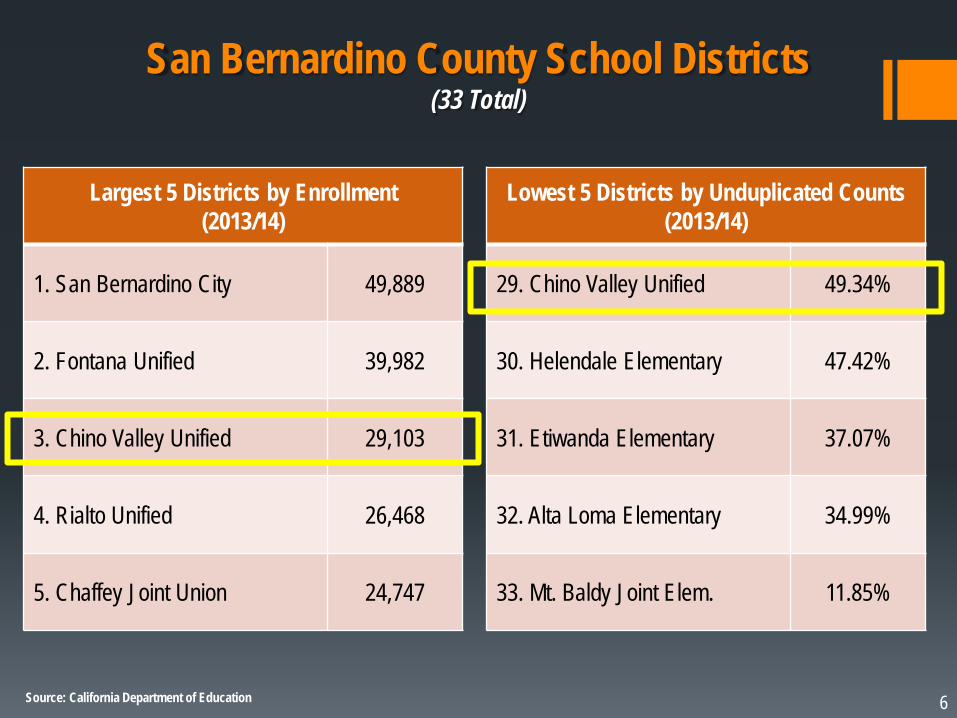
San Bernardino County School Districts (33 Total)
6
Largest 5 Districts by Enrollment (2013/14)
1. San Bernardino City 49,889
2. Fontana Unified 39,982
3. Chino Valley Unified 29,103
4. Rialto Unified 26,468
5. Chaffey Joint Union 24,747
Lowest 5 Districts by Unduplicated Counts (2013/14)
29. Chino Valley Unified 49.34%
30. Helendale Elementary 47.42%
31. Etiwanda Elementary 37.07%
32. Alta Loma Elementary 34.99%
33. Mt. Baldy Joint Elem. 11.85%
Source: California Department of Education

General Fund Total Revenues Trend
$244,172,929
$203,664,721 $200,650,084
$235,549,227
$255,271,225
$226,024,970 $224,825,667
$190,000,000
$200,000,000
$210,000,000
$220,000,000
$230,000,000
$240,000,000
$250,000,000
$260,000,000
2007/08 2008/09 2009/10 2010/11 2011/12 2012/13 2013/14 2014/15SecondInterim
Total Revenues - Unrestricted & Restricted
Adopted Budget Unaudited Actuals
7 Threat of
$246/ADA cut Threat of
$260/ADA cut Threat of $55 cut/ADA and $370/ADA cut
Threat of $441/ADA cut
Proposition 30 passes!
May 2010 July 2011 Mar. 2012 May 2012 Nov. 2012 Budget Roller-coaster

Revenue Limit/LCFF Sources Unrestricted & Restricted
$130,000,000
$150,000,000
$170,000,000
$190,000,000
$210,000,000
2007/08 2008/09 2009/10 2010/11 2011/12 2012/13 2013/14 2014/15SecondInterim
Unrestricted Funds
Unaudited Actuals
$-
$1,000,000
$2,000,000
$3,000,000
$4,000,000
$5,000,000
2007/08 2008/09 2009/10 2010/11 2011/12 2012/13 2013/14 2014/15SecondInterim
Restricted Funds
Unaudited Actuals
8
Increase in Unrestricted LCFF sources due to: LCFF base and “supplemental” all accounted for as unrestricted despite stringent spending requirements Accounting structure for “other state” as part of LCFF changed Accounting of Special Ed transfers changed from restricted to unrestricted Even though Unrestricted Revenues increased, most funds are already committed to existing programs

Enrollment vs. Attendance
26,000
27,000
28,000
29,000
30,000
31,000
32,000
33,000
2007/08 2008/09 2009/10 2010/11 2011/12 2012/13 2013/14 2014/15 2015/16Projected
Enrollment Average Daily Attendance
2007/08 Enrollment = 32,916 ADA = 31,633 2014/15 Enrollment = 28,657 ADA = 27,760
Down ~12%
Note: ADA is based on P2 collection period. 9

General Fund Total Expenditures Trend
$250,392,473
$237,653,691
$211,586,096
$259,178,089
$210,000,000
$220,000,000
$230,000,000
$240,000,000
$250,000,000
$260,000,000
$270,000,000
2007/08 2008/09 2009/10 2010/11 2011/12 2012/13 2013/14 2014/15SecondInterim
Total Expenditures & Other Uses - Unrestricted & Restricted
Unaudited Actuals
10
+$39.6 Million

Budgeted Revenues and Actual Expenditures/Uses Unrestricted Funds
$160,000,000
$170,000,000
$180,000,000
$190,000,000
$200,000,000
$210,000,000
2007/08 2008/09 2009/10 2010/11 2011/12 2012/13 2013/14 2014/15budgeted
Budgeted Revenues Actual ExpendituresAdopted Budget
If REVENUES actually came in as budgeted per State’s projection, the actual EXPENDITURES incurred by the District would have exhausted all of the District’s one-time ending balance and put us back in fiscal crisis.
Deficit Spending
11

12
Revenues 2014/15 General Fund at Second Interim
TOTAL $235,549,227
Note: Numbers may not add due to rounding
LCFF Sources $198,853,453
Other State Revenue
$6,623,922
Other Local Revenue
$2,834,335
Federal Revenue
$12,840,166
Other State Revenue
$4,641,626
Other Local Revenue
$9,755,725
Restricted $27,237,517
Unrestricted $208,311,710

$222,361,432 13
Expenditures & Other Uses/Sources 2014/15 General Fund at Second Interim
Note: Numbers may not add due to rounding
TOTAL $259,178,090
Salaries & Benefits
$167,779,659 87%
Other $25,696,948
13%
Other
Books and Supplies $7,456,924
Services and Other Operating Expenses $16,075,565
Capital Outlay $879,544
Other Outgo $4,470,784
Transfer of Indirect Costs ($3,185,869)
Other Financing Uses $28,884,824
Other Financing Sources $28,683,789
Restricted Expenditures $65,500,447
Unrestricted Expenditures $193,476,608
$36,816,658
Other $28,435,535
43%
Salaries & Benefits
$37,064,911 57%
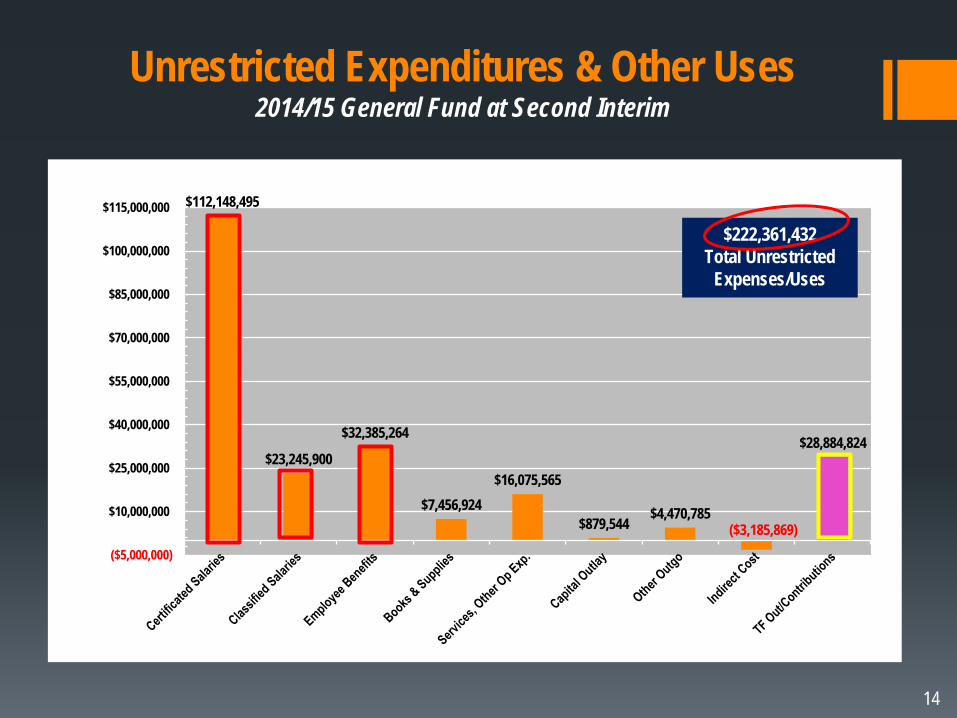
Unrestricted Expenditures & Other Uses
2014/15 General Fund at Second Interim
$112,148,495
$23,245,900
$32,385,264
$7,456,924 $16,075,565
$879,544 $4,470,785 ($3,185,869)
$28,884,824
($5,000,000)
$10,000,000
$25,000,000
$40,000,000
$55,000,000
$70,000,000
$85,000,000
$100,000,000
$115,000,000
$222,361,432 Total Unrestricted
Expenses/Uses
14

15
Superintendent Asst. Supts. Principals Assistant Principals Directors Coordinators Managers Supervisors Psychologists Program Specialists Occupational Therapists Conf. Admin. Secretaries Conf. Technician
Note: Numbers may not add due to rounding
Salary and Benefits 2014/15 Total General Fund at Second Interim
TOTAL $204,844,570
A.C.T. Salaries $113,628,466
55%
CSEA Salaries $32,207,961
16%
CHAMP Salaries $19,008,815
9%
Statutory Benefits $23,599,416
12% Health & Welfare $14,035,974
7%
Retiree Benefits $2,363,938
1%

16 Note: Numbers may not add due to rounding
Multi-year Projection at Second Interim Unrestricted Fund
2013/14 2014/15 Second Interim 2015/16 2016/17
Beginning Balance 50,905,961 50,766,209 36,716,485 30,038,218
Revenue 191,024,691 208,311,710 219,017,634 219,781,201
Expenditure 191,164,443 222,361,432 225,695,901 231,143,871
Net Increase/Decrease (139,752) (14,049,722) (6,678,267) (11,362,670)
Ending Balance 50,766,209 36,716,485 30,038,218 18,675,549
Revolving Cash 100,000 100,000 100,000 100,000
Equity 49,889 49,889 49,889 49,889
Economic Uncertainty 19,912,028 19,729,958 19,729,958 19,729,958 Common Core/Technology 4,443,447
Potential Add’l costs 3,200,000
Unappropriated Amount 23,060,844 16,836,638 10,158,371 (1,204,298)
Projected Deficit Spending

Actual Revenues and Expenditures/Uses Unrestricted Funds
$207,705,997
$180,264,941
$208,311,710
$203,594,929
$175,913,237
$222,361,432
$170,000,000
$180,000,000
$190,000,000
$200,000,000
$210,000,000
$220,000,000
$230,000,000
2007/08 2008/09 2009/10 2010/11 2011/12 2012/13 2013/14 2014/15SecondInterim
Actual Revenues Actual Expenditures
13/14 Revenues = $191,024,691 13/14 Expenses = $191,164,443
Deficit Spending = $139,752
17
After salary negotiations 14/15 Expenses = $222,361,432 Deficit Spending = $14,049,722
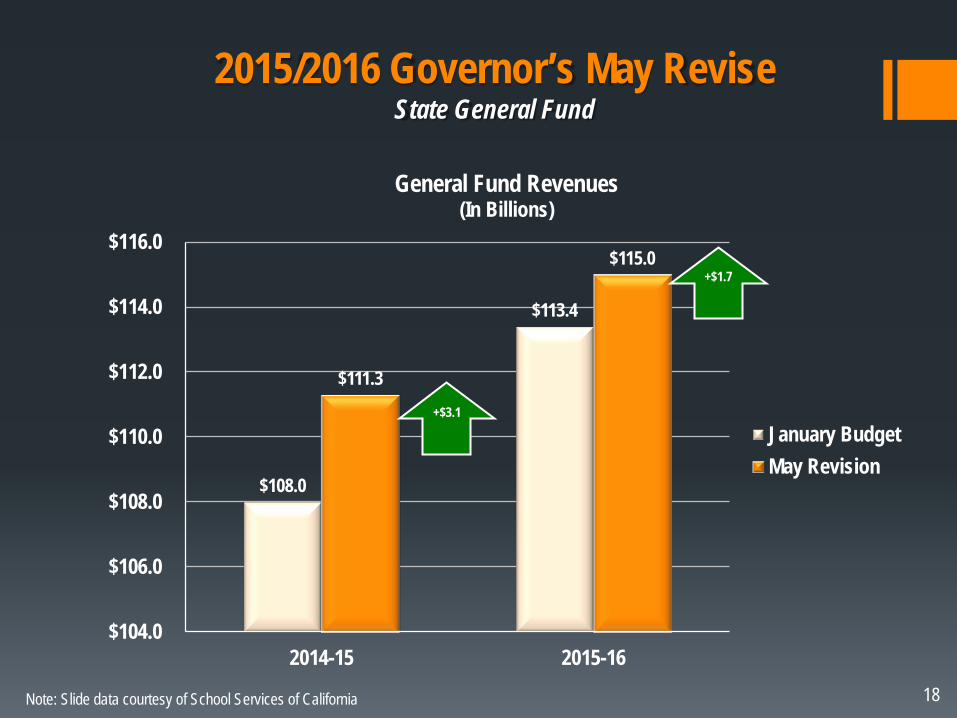
2015/2016 Governor’s May Revise State General Fund
18
$108.0
$113.4
$111.3
$115.0
$104.0
$106.0
$108.0
$110.0
$112.0
$114.0
$116.0
2014-15 2015-16
General Fund Revenues (In Billions)
January BudgetMay Revision
Note: Slide data courtesy of School Services of California
+$3.1
+$1.7

2015/2016 Governor’s May Revise
19 Note: Slide data courtesy of School Services of California
Item January Budget May Revision
LCFF Gap Funding Percentage 32.19% 53.08%
Proposition 98 Minimum Funding Guarantee
2014-15 2015-16
$63.2 billion $65.7 billion
$66.3 billion $68.4 billion
2015-16 COLA 1.58% 1.02%
One-time Discretionary Funds for 2015-16
$1.1 billion $180 per ADA
$3.1 billion $601 per ADA

2015/2016 Governor’s May Revise Progress Towards LCFF Implementation
20 Note: Slide data courtesy of School Services of California
0
10
20
30
40
50
60
70
80
90
100
2013-14 2014-15 2015-16 2016-17 2017-18 2018-19 2019-20 2020-21
Trend Actual
Full LCFF Implementation
2020-21
2015-16 Governor’s State Budget: 70% Cumulative
Gap Closure
2015-16 Trend Line
Janu
ary
May
%
%
%
%
%
%
%
%
%
%
%

REVENUE
EXPENDITURE
2015/2016 Estimated funded average daily attendance = 27,730 Estimated LCFF funding gap @ 53.08% COLA: 1.02% Estimated 2014/15 Restricted carryover revenues from
categorical funds Estimated reduction of other state/federal revenues due to
declining enrollment
2016/2017 Estimated loss of 500 ADA Estimated LCFF gap funding of 12.62% COLA: 1.6% Estimated reduction of other state/federal revenues due to
declining enrollment 2017/2018 Estimated loss of 500 ADA Estimated LCFF gap funding of 18.24% COLA: 2.48% Estimated reduction of other state/federal revenues due to
declining enrollment
2015/2016 Estimated 2014/15 Restricted carryover expenditures Step/Column increases for all groups CalSTRS employer contribution of 10.73% (+1.85%) CalPERS employer contribution of 11.847% (+0.076%) Estimated increase of Certificated staffing due to
implementation of CSR at K-3 grades Increased staffing for Special Education Common Core one-time expenditures LCAP actions/services Utility rate increases 2016/2017 Step/Column increases for all groups Estimated increase of Certificated staffing due to
implementation of CSR at K-3 grades Est. CalSTRS employer contribution of 12.58% (+1.85%) Est. CalPERS employer contribution of 13.05% (+1.2%) LCAP actions/services Utility rate increases 2017/2018 Step/Column increases for all groups Estimated increase of Certificated staffing due to
implementation of CSR at K-3 grades CalSTRS employer contribution of 14.43% (+1.85%) CalPERS employer contribution of 16.6% (+3.55%) LCAP actions/services Utility rate increases
New Multi-year Budget Assumptions General Fund
22
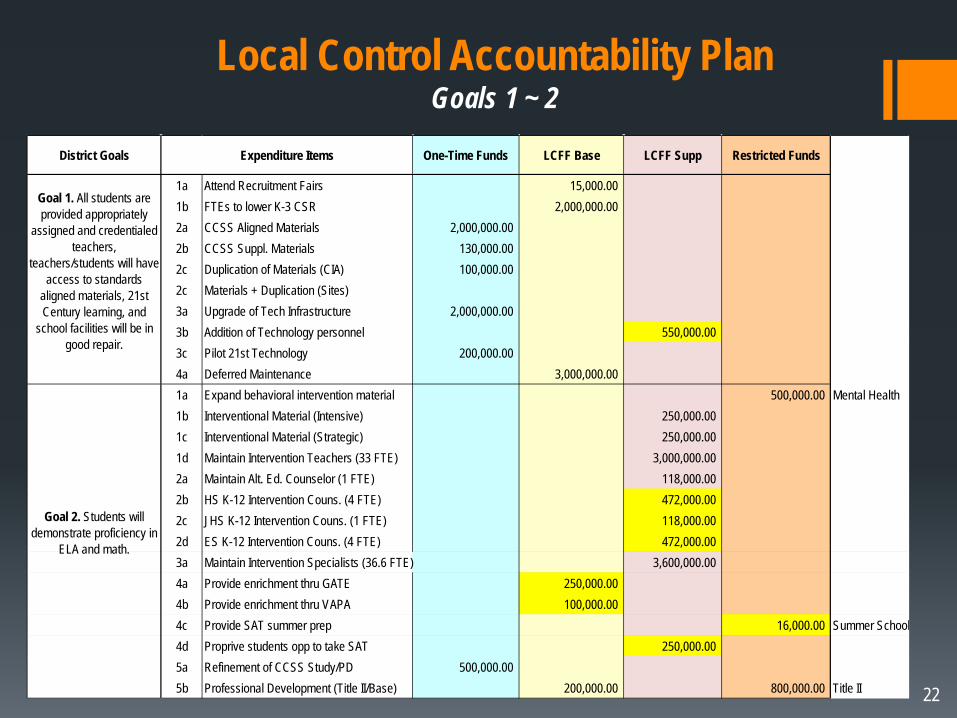
Local Control Accountability Plan Goals 1 ~ 2
District Goals One-Time Funds LCFF Base LCFF Supp Restricted Funds
1a Attend Recruitment Fairs 15,000.001b FTEs to lower K-3 CSR 2,000,000.002a CCSS Aligned Materials 2,000,000.002b CCSS Suppl. Materials 130,000.002c Duplication of Materials (CIA) 100,000.002c Materials + Duplication (Sites)3a Upgrade of Tech Infrastructure 2,000,000.003b Addition of Technology personnel 550,000.003c Pilot 21st Technology 200,000.004a Deferred Maintenance 3,000,000.001a Expand behavioral intervention material 500,000.00 Mental Health1b Interventional Material (Intensive) 250,000.001c Interventional Material (Strategic) 250,000.001d Maintain Intervention Teachers (33 FTE) 3,000,000.002a Maintain Alt. Ed. Counselor (1 FTE) 118,000.002b HS K-12 Intervention Couns. (4 FTE) 472,000.002c JHS K-12 Intervention Couns. (1 FTE) 118,000.002d ES K-12 Intervention Couns. (4 FTE) 472,000.003a Maintain Intervention Specialists (36.6 FTE) 3,600,000.004a Provide enrichment thru GATE 250,000.004b Provide enrichment thru VAPA 100,000.004c Provide SAT summer prep 16,000.00 Summer School4d Proprive students opp to take SAT 250,000.005a Refinement of CCSS Study/PD 500,000.005b Professional Development (Title II/Base) 200,000.00 800,000.00 Title II
Expenditure Items
Goal 1. All students are provided appropriately
assigned and credentialed teachers,
teachers/students will have access to standards
aligned materials, 21st Century learning, and
school facilities will be in good repair.
Goal 2. Students will demonstrate proficiency in
ELA and math.

23
Local Control Accountability Plan Goals 3 ~ 4
District Goals One-Time Funds LCFF Base LCFF Supp Restricted Funds
1a Align new courses to A-G 0.001b Align current courses to A-G 0.001c Review courses to ensure CC readiness 0.001d Align pathway courses to A-G 0.001e Increase AP courses/Increase students 0.001f Increase number of students taking AP 0.002a Maintain FTE to Ramona & Magnolia 0.00 160,000.002b Explore Signature Practices Ramona 2,500.002b Explore Signature Practices Magnolia 2,500.003a Maintain certificated FTEs for pathways 320,000.003b PD for Linked Learning 50,000.003c Classified community/business liaison 75,000.003d Exterships/Interships for teachers/stud. 10,000.003e Material support for pathway classes 150,000.00 150,000.00 Perkins4a Offer and encourage 11th grade take EAP 0.005a Increase AP offerings 0.001a Summer EL Jumpstart for Elem Sites 180,000.001b ELD daily 30/45 minutes 0.001c Site college nights to underserved (4 HS) 10,000.002a SES - Foster Youth & Homeless Youth 200,000.002b Provide AVID to underserved 250,000.003a TOA - Parent Trainer 100,000.003a TOA - Materials 100,000.003b Expand Parent Resource Center 500,000.003c Maintain TYKES program 50,000.00 221,000.00 TYKES3d Maintain Family Literacy Program 119,000.00 First 53e Maintain CVUSD Health Clinic 300,000.003f Bilingual Clerks 306,000.003g Bilingual Translation 200,000.003h Interv. Support to CHS/DAL/BVHS 900,000.00 Title I in-lieu4a Ongoing training of staff for Foster intake 0.004b Counselof for Foster Youth 118,000.004c Clerical support for Foster Youth mgmt 60,000.00
Expenditure Items
Goal 3. Students will have access to a broad course
of subject areas which leads to graduation and success in college and
career.
Goal 4. English learners, low income students, and
foster youth receive services to ensure their
readiness for college and career.

24
Local Control Accountability Plan Goals 5 ~ 7
District Goals One-Time Funds LCFF Base LCFF Supp Restricted Funds
1a Enhance CVUSD's web hosting 40,000.001b Look into development of CVUSD APP 10,000.002a Parent Information Night (Drug/Bully) 4,000.002b Parent Academies 15,000.002c Facilitator Services 12,000.002d District-Wide Site Based - Suveys 1,000.002e District-Wide Site Based - Forums 1,000.001a Saturday School (Existing) 20,000.001b Attendance Incentives (Existing) 20,000.001c Banners & Flyers (Existing) 15,000.002a CWA Coordinator (Existing) 123,000.002b Community Outreach (Existing) 55,000.002c Probation Officers (Existing) 165,000.001a Provide PD on Alt. means of correction 0.002a Provide PD on Alt. means of correction 0.003a Parent Information Night (Drug/Bully) 4,000.003b SROs at selected JHS 70,000.00
5,215,000.00 6,445,000.00 12,514,000.00 1,806,000.00
25,980,000.00
Goal 5. Students, parents, staff and community
receive ongoing and timely communication.
Goal 6. Increase student attendance rates and
graduation rates to reduce the number of student drop
outs.
Goal 7. Provide safe and secure school environment.
Expenditure Items
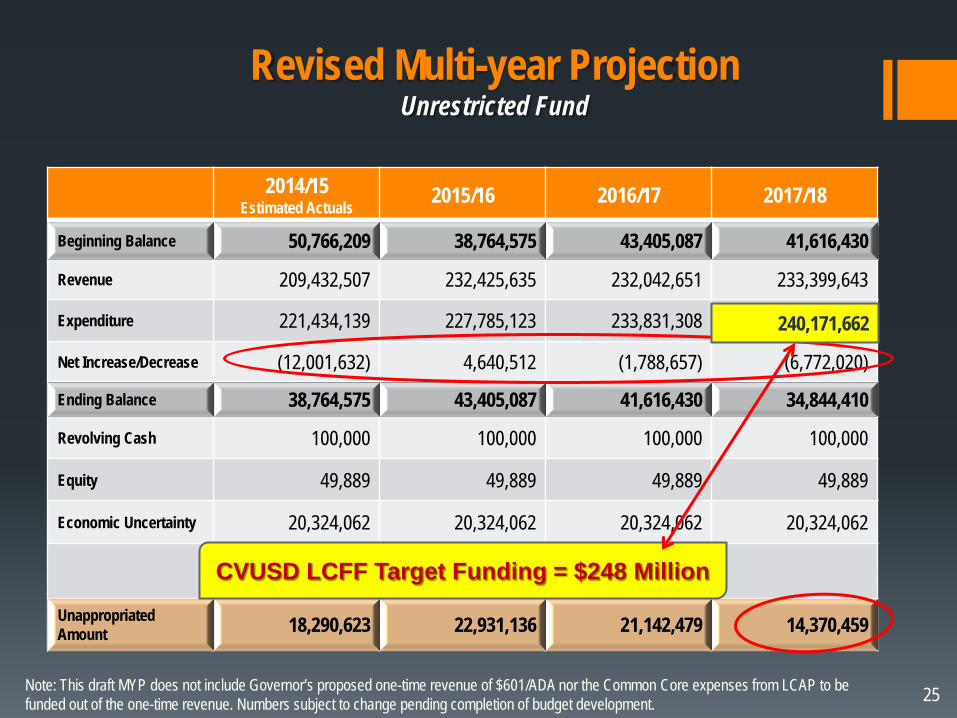
25 Note: This draft MYP does not include Governor’s proposed one-time revenue of $601/ADA nor the Common Core expenses from LCAP to be funded out of the one-time revenue. Numbers subject to change pending completion of budget development.
Revised Multi-year Projection Unrestricted Fund
2014/15 Estimated Actuals 2015/16 2016/17 2017/18
Beginning Balance 50,766,209 38,764,575 43,405,087 41,616,430
Revenue 209,432,507 232,425,635 232,042,651 233,399,643
Expenditure 221,434,139 227,785,123 233,831,308 240,171,662
Net Increase/Decrease (12,001,632) 4,640,512 (1,788,657) (6,772,020)
Ending Balance 38,764,575 43,405,087 41,616,430 34,844,410
Revolving Cash 100,000 100,000 100,000 100,000
Equity 49,889 49,889 49,889 49,889
Economic Uncertainty 20,324,062 20,324,062 20,324,062 20,324,062
Unappropriated Amount 18,290,623 22,931,136 21,142,479 14,370,459
240,171,662
CVUSD LCFF Target Funding = $248 Million

2015/2016 Governor’s May Revise One-Time Funds
26
Growth in 2014/15 State revenues yielded $3.1 billion in one-time funds for education spending.
Estimated $601 per student = $16.7 Million
Governor suggests districts prioritize these funds for professional development, instructional materials, and technology.
District LCAP Common Core Expenditures
Common Core Aligned Materials
Upgrade of Technology Infrastructure
Pilot 21st Century Technology
Refinement of ELA Units of Study
Professional Development

Ending Balance vs. Unappropriated
$15,000,000
$20,000,000
$25,000,000
$30,000,000
$35,000,000
$40,000,000
$45,000,000
$50,000,000
$55,000,000
2007/08 2008/09 2009/10 2010/11 2011/12 2012/13 2013/14 2014/15SecondInterim
Unrestricted Fund
Ending Balance Unapprop.
Factors contributing to growth in fund balance: Large infusions of federal one-time dollars One-time state categorical sweeps Threatened cuts from the state that didn’t
materialize Districts have proactively slowed down or
reduced spending Recent salary increases will dip into one-time
ending balances
27
What is Ending Balance? Beginning Balance + Revenues – Expenditures = Ending Balance

28
Recap 2014/15 – Year of Investment in students, instruction and CVUSD staff
August 2014 – Present Implementation of LCAP actions & services at school sites ELA Units of Study at all schools Math Textbook adoptions Continuous professional development Deployment of new technology infrastructure & equipment
October 2014 Ratification of ACT Tentative Agreement & Me-Too clauses
2013/14 2014/15 ACT 3% Add’l 4% + 1% off schedule 7% ongoing
CSEA 3% Add’l 3% + 1% off schedule + 10% HW 6% ongoing + HW CHAMP 3% Add’l 2% + 1% off schedule + 10% HW +
Principal/Director salary reorg 5% ongoing + HW
$18.7 million over two years ~$13 million

29
Board Approved Budget Restorations
• Grade level department stipends • School nurses (15 FTE) • Elementary music program (9 FTE) • HS counselors (23 FTE) • Intervention counselors at JHS (5.4 FTE) • Adult education teachers
Certificated
Classified
• Elementary assistant principals (20 FTE) • Junior HS assistant principals (3 FTE) • Work year for psychologists restored from 185 to 195 • Work year for 3 directors restored from 221 to 226 and 256 to 261 • Work year for 7 coordinators restored from 221 to 226 and 256 to 261
Management
• Video-taping of board meetings • Home to school transportation 7-12 • Athletic and band transportation • Elementary library/media aides (20 positions) • Attendance clerk at HS (3.75 FTE) • Typist clerk II at HS (4 FTE) • Custodian I at HS (4 FTE) • Student personnel specialist (1 FTE) • Maintenance II/painter (2 FTE) • Maintenance III/locksmith (1 FTE) • Maintenance II/carpenter (1 FTE)
• Maintenance III/HVAC (1 FTE) • Grounds worker I (3 FTE) • Increase HS AP secretaries to 3 per HS (4 FTE) • HS AP secretaries work year from 175 to 213 • HS receptionists work year from 185 to 200 • HS counseling assistants work year from 208 to 213 • JHS counseling assistants work year from 208 to 213 • JHS secretaries work year from 210 to 215 • ES secretaries work year from 210 to 215 • Duplicating department work year from 11 to 12 months • Increase work hours for 6 SPED aides from 5 to 6 hours

30
CSEA Requested Restorations
CSEA RESTORATION – MAY 2015 Restore Months and Days FROM
2
DISTRICT MEDIA CTR CLERK
11 Mos 12 Mos $ 5779.04
1 DISTRICT MEDIA CNTR OPER TECH 11 Mos 12 Mos $ 3,038.24 1 RECEPTIONIST
12 Mos $ 39,296.16
1 DISTRICT SECRETARY/DIST. SECURITY
12 Mos $ 44,453.52 4 SCHOOL SECRETARY II
11 MONTHS 12 Mos $ 9,070.88
2 SECURITY PERSON
12 Mos $ 8,674.56
1 SUPPL. INST. SUPPORT TECHNICIAN 11 Mos 12 Mos $ 2,168.64
Restore Positions
1
ADMINISTRATIVE SECRETARY I
CURRICULUM / ELEMENTARY $ 54,684.72
1 ADMINISTRATIVE SECRETARY I
HUMAN RESOURCES $ 54,684.72
1 ADMINISTRATIVE SECRETARY I
PURCHASING
$ 54,684.72
1 DISTRICT SECRETARY / GATE
CURRICULUM
$ 44,453.52
1 DISTRICT SECRETARY
SPECIAL ED
$ 44,453.52 1 TYPIST CLERK II
ACCESS & EQUITY $ 41,676.48
1 TYPIST CLERK II
TRANSPORTATION $ 41,676.48 1 STUDENT PERSONNEL SPECIALIST STUDENT SUPPORT $ 43,367.76 2 MAINT. III - PAINTERS
MAINTENANCE $ 109,369.44
1 MAINT. III - SPRINKLER TECH III
MAINTENANCE $ 58,902.48
1 MAINT. III - ELECTRICIAN
MAINTENANCE $ 54,789.12
1 MAINT. III - HVAC
MAINTENANCE $ 60,405.84
2 COUNSELING ASSISTANTS Alt Ed Increase 15 Days $ 10,402.88
1 CUSTODIAN
Alt Ed 11 Mos 12 Mos $ 3,956.00 28
$ 787,988.72

District Budget Calendar
31
July 1st District’s Adopted Budget due to the County/State
September 15th Unaudited Actuals Financial Report due to the County/State
December 15th First Interim Financial Report due to the County/State
January Governor’s Proposed State Budget for 2015/16
March 15th Second Interim Financial Report due to the County/State
May 14th Governor’s May Revise for 2015/16
June 11th Public Hearing of District LCAP (15/16, 16/17, 17/18) Public Hearing of District Budget (15/16, 16/17, 17/18)
June 25th Adoption of District LCAP (15/16, 16/17, 17/18) Adoption of District Budget (15/16, 16/17, 17/18)

32
Declining enrollment Charter School(s) CalSTRS increasing employer contribution CalPERS increasing employer contribution Affordable Care Act compliance penalties AB 1522 Healthy Workplaces, Healthy Families Act Proposition 30 sunsets within the next 3 years
(0.25% Sales Tax expires in 2016; Personal Income Tax expires in 2018)
Cap on District Reserves (Prop 2)
Budget Impacts

© 2015 School Services of California, Inc.
Note: Cartoon courtesy of School Services of California; Figures are fictitious. 33

Discussions & Questions
34