a first look at cellular network performance during ...mshafiq/files/crowded_sigmetrics.pdfa first...
TRANSCRIPT

A First Look at Cellular Network Performance duringCrowded Events
M. Zubair Shafiq†, Lusheng Ji‡, Alex X. Liu†, Jeffrey Pang‡, Shobha Venkataraman‡, Jia Wang‡
†Department of Computer Science and Engineering, Michigan State University, East Lansing, MI, USA‡AT&T Labs – Research, Florham Park, NJ, USA
{shafiqmu,alexliu}@cse.msu.edu, {lji,jeffpang,shvenk,jiawang}@research.att.com
ABSTRACTDuring crowded events, cellular networks face voice and datatraffic volumes that are often orders of magnitude higherthan what they face during routine days. Despite the use ofportable base stations for temporarily increasing communi-cation capacity and free Wi-Fi access points for offloadingInternet traffic from cellular base stations, crowded eventsstill present significant challenges for cellular network oper-ators looking to reduce dropped call events and improve In-ternet speeds. For effective cellular network design, manage-ment, and optimization, it is crucial to understand how cel-lular network performance degrades during crowded events,what causes this degradation, and how practical mitigationschemes would perform in real-life crowded events. This pa-per makes a first step towards this end by characterizingthe operational performance of a tier-1 cellular network inthe United States during two high-profile crowded eventsin 2012. We illustrate how the changes in population dis-tribution, user behavior, and application workload duringcrowded events result in significant voice and data perfor-mance degradation, including more than two orders of mag-nitude increase in connection failures. Our findings suggesttwo mechanisms that can improve performance without re-sorting to costly infrastructure changes: radio resource allo-cation tuning and opportunistic connection sharing. Usingtrace-driven simulations, we show that more aggressive re-lease of radio resources via 1-2 seconds shorter RRC time-outs as compared to routine days helps to achieve bettertradeoff between wasted radio resources, energy consump-tion, and delay during crowded events; and opportunisticconnection sharing can reduce connection failures by 95%when employed by a small number of devices in each cellsector.
Categories and Subject DescriptorsC.2.3 [Computer System Organization]: Computer Com-munication Networks—Network Operations
KeywordsCellular Network, Crowded Events, Performance
Permission to make digital or hard copies of all or part of this work forpersonal or classroom use is granted without fee provided that copies arenot made or distributed for profit or commercial advantage and that copiesbear this notice and the full citation on the first page. To copy otherwise, torepublish, to post on servers or to redistribute to lists, requires prior specificpermission and/or a fee.SIGMETRICS ’13, June 17-21, 2013, Pittsburgh, PA, USA.Copyright c© 2013 978-1-4503-1900-3/13/06 ... $15.00.
1. INTRODUCTIONCrowded events, such as football games, public demon-
strations, and political protests, put an extremely highdemand for communication capacity on cellular networksaround the duration of the events [5]. Cellular networks arefacing unprecedent challenges in dealing with such spiky de-mand. First, cellular network utilization has already beenrapidly approaching its full capacity throughout the worlddue to the increasing prevalence of cellular devices such assmartphones, tablets, and Machine-to-Machine (M2M) de-vices. Even in the United States, cellular network usageis at an all-time high even under normal operating condi-tions and projections show that traffic volume will furtherincrease by 26 times by 2015 as compared to 2010 [3, 4].Second, the spiky demand caused by crowded events is of-ten extremely high because there maybe a large number (of-ten tens of thousands) of users gathered in a small region(such as a football stadium) that is covered by only a smallnumber of cell towers. Even worse, people tend to use theircellular devices more than usual during the events to eithertalk with their friends or access the Internet (such as upload-ing a photo to Facebook or a video clip to YouTube duringa football game). Third, it is critical for cellular networksto cope with such high demand during crowded events be-cause poor performance will affect a large number of peopleand cause widespread user dissatisfaction. Although cellularnetwork operators have deployed remediation solutions, suchas portable base stations called Cells on Wheels (COWs) fortemporarily increasing communication capacity and free Wi-Fi access points for offloading Internet traffic from cellularbase stations, crowded events still remain a major challengefor cellular network operators.
To the best of our knowledge, this paper presents the firstthorough investigation of cellular network performance dur-ing crowded events. Based on the real-world voice and datatraces that we collected from a tier-1 cellular network inthe United States during two high-profile crowded events in2012, we aim to answer the following three key questions.
• How does cellular network performance degradeduring crowded events as compared to routine days?To answer this question, we characterize cellular networkperformance during both the pre- and post-connectionphases, which helps us to understand user experience be-fore and after acquiring radio resources. For pre-connectionphase, we find that pre-connection failures dramatically in-crease during the crowded events by 100-5000 times as com-pared to their average on routine days. These failures oc-cur because when too many users attempt to acquire ra-

dio resources at the same time, they exhaust the limitedbandwidth of the signaling channel resulting in connectiontimeouts and failures. We find that this resource exhaustionoccurs not only at the event venue, but also as far as 10miles around the event as users arrive and depart. More-over, some failures, such as dropped and blocked voice calls,are most likely to occur in bursts just before, after, and dur-ing event intermissions. For post-connection phase, we findthat voice network performance in terms of dropped andblocked calls degrades during crowded events by 7-30 times,and data network performance in terms of packet loss ratioand round trip time (RTT) degrades during crowded eventsby 1.5-7 times, compared to their average on routine days.
• What causes the performance degradation?To answer this question, we analyze user traffic patterns interms of both aggregate network load and user-level sessioncharacteristics. For aggregate network load, we find that up-link traffic volume increases by 4-8 times, and both downlinktraffic volume and the number of users increase by 3 times,during the crowded events as compared to their average onroutine days. We conclude that the large number of userstrying to access radio resources at the same time is a ma-jor cause of the observed excessive pre-connection failures.For user-level session characteristics, we find that the aver-age byte volume per session decreases by 0.5 times duringthe events even though the average session length increases.Our investigation suggests that this change in workload isdue to a change in application usage during these events,such as the increased use of online social networks. We con-clude that lower byte volume per session, despite an increasein average session length, is a major cause of the waste ofradio resources in the post-connection phase.
• How would practical mitigation schemes performin real-life?To answer this question, we investigate two practical mitiga-tion schemes that do not require making significant changesto the cellular infrastructure: radio resource allocation tun-ing and opportunistic connection sharing. Radio resourceallocation tuning addresses the issue of inefficient radio re-source allocation in the post-connection phase by adjustingcellular network resource allocation parameters. Cellularnetworks allocate resources to each user using a Radio Re-source Control (RRC) state machine, which is synchronouslymaintained by the network and devices. Different states ofthe RRC state machine correspond to different amount ofradio resources allocated by the network and energy con-sumption by cellular devices. Since a large number of userscontend for limited radio resources during crowded events,we show that more aggressive release of radio resources via1-2 seconds shorter RRC timeouts helps to achieve a bettertradeoff between wasted radio resources, energy consump-tion, and delay during crowded events. Note that cellularnetwork operators often know the time and location of largecrowded events beforehand; thus, it is practical for themto adjust cellular network parameters before events and re-store them after events. Opportunistic connection sharingaddresses increased pre-connection failures by aggregatingtraffic from multiple devices into a single cellular connec-tion. That is, by having some devices share their cellularconnection with nearby devices over their Wi-Fi or Blue-tooth interface (i.e., “tethering”), opportunistic connectionsharing should reduce the number of overall cellular connec-
NodeBs
NodeBs
NodeBs
Internet
External Networks
UEs
UEs
UEs
Radio link
Radio Access Network (RAN)
Core Network (CN)
Gn
GnRadio link
Radio link
SGSN
RNC
RNC
RNC
GGSN
SGSN
Figure 1: Cellular network architecture
tion requests, thereby reducing request congestion and con-nection failures. Using trace-driven simulations, we showthat connection sharing can reduce connection failures bymore than 95% when employed by a small number of devicesin each cell sector. Although much work has been done onopportunistic connection sharing to address issues such asmobility, energy use, and incentives [1,11,17], no prior workhas demonstrated the significant benefit that such connec-tion sharing can achieve based on real-life cellular networkdata.
The rest of this paper is organized as follows. In Section2, we present details of the data collection process. Section3 presents the characterization of performance issues duringthe crowded events and Section 4 presents various aspectsof user traffic patterns to study the underlying causes ofperformance issues. We conduct trace-driven simulations toevaluate radio network parameter tuning and opportunisticconnection sharing in Section 5. Section 6 reviews relatedwork and the paper is concluded in Section 7.
2. DATA SET
2.1 BackgroundA typical cellular network, shown in Figure 1, can be vi-
sualized as consisting of two major components: Radio Ac-cess Network (RAN) and Core Network (CN). RAN consistsof NodeBs and Radio Network Controllers (RNCs). EachNodeB has multiple antennas, where each antenna corre-sponds to a different cell sector. CN consists of ServingGPRS Support Nodes (SGSNs) facing the user and Gate-way GPRS Support Nodes (GGSNs) facing the Internet andother external networks. A user via user equipment (UE)connects to one or more cell sectors in the RAN. The trafficgenerated by a UE is sent to the corresponding NodeB bycell sectors. Each RNC controls and exchanges traffic withmultiple NodeBs, each of which serves many users in its cov-erage area. RNCs manage control signaling such as RadioAccess Bearer (RAB) assignments, transmission scheduling,and handovers. RNCs send traffic from NodeBs to SGSNs,which then send it to GGSNs. GGSNs eventually send traf-fic to external networks, such as the Internet.
RAN dynamically allocates resources to a UE. Specifically,every UE negotiates allocation of radio resources with theRAN based on a wide range of factors, such as availableradio resources and signal strength [7]. Every UE followsthe RRC protocol for dynamic acquisition and dropping ofradio resources. The RRC state machine of each user issynchronously maintained by the UE and network. Differ-ent states in the RRC state machine correspond to differentamounts of allocated radio resources by the network and en-

DCH
PFACH ≈ 0.5 PDCH
PPCH ≈ 0.01 PDCH
PIDLE ≤ 0.01 PDCH
IDLE
PCH
FACH
Figure 2: RRC protocol state transitions
ergy consumption by UEs. Figure 2 shows all RRC protocolstate transitions. According to RRC protocol, a UE transi-tions to Dedicated Channel (DCH) state or Forward AccessChannel (FACH) state for uplink or downlink data trans-fer. RAN assigns a dedicated or shared channel for DCHand FACH states, respectively. If a UE does not have anydata to transfer, it transitions to Paging Channel (PCH)state before the transition to IDLE state. Generally, statepromotions are controlled by data buffer size thresholds andstate demotions are controlled by inactivity timeouts. Fur-thermore, the energy consumption by a UE is roughly in-versely proportional to the amount of allocated radio re-sources. The energy consumption by a UE is maximum inDCH state, which is about halved when it transitions toFACH state, and is reduced to less than 1/100th in PCHand IDLE states [20].
2.2 Data CollectionThe data set used in this study contains anonymized logs
collected from RAN and CN of a tier-1 cellular network inthe United States serving over 100 million customers. Ourdata set consists of two separate collections, each covering ametropolitan area during a high-profile event in 2012. Thecollections include information from hundreds of thousandsof users and thousands of cell locations over multiple days in-cluding the event days. The first event, referred to as EventA hereafter, is a sporting event that consists of two segmentsof activities separated by an intermission. The second event,referred to as Event B hereafter, is a conference event thatconsists of multiple segments of activities separated by inter-missions of varying lengths. In terms of publicly availableattendance statistics, event A is roughly twice the size ofevent B. The activity segments in both events are illustratedby gray bars in all timeseries figures presented in this paper.Furthermore, it is noteworthy that free Wi-Fi service wasprovided to all users during both of the events to offload asmuch cellular network traffic as possible. However, we donot have measurements on the network traffic that was of-floaded to these Wi-Fi services; thus, we acknowledge thatour results may be biased by this offloading.
The anonymized logs collected at an RNC in RAN con-tain throughput and RRC protocol request/response infor-mation. Using RRC requests from UEs and responses fromthe RNC, the RAB status of all UEs can be monitored. Theanonymized logs collected from the CN contain TCP headerinformation of IP flows carried in PDP context tunnels.They are collected from the Gn interfaces between SGSNsand GGSNs in the core network. They contain timestamp,per-flow traffic volume, content publisher, RTT computedduring TCP handshake [13], and estimated packet loss ratio
for each TCP flow aggregated in 5 minute bins. All de-vice and user identifiers (e.g., IMSI, IMEI) are anonymizedto protect privacy without affecting the usefulness of ouranalysis. The data set does not permit the reversal of theanonymization or re-identification of users. We note thatlogs collected at RNCs encompass both voice and data traf-fic, whereas logs collected from the CN contain only datatraffic information.
Next, we characterize performance issues during the afore-mentioned two high-profile events in Section 3. To study theunderlying causes of the identified performance issues, wethen correlate network performance with various aspects ofuser traffic patterns in Section 4. Throughout, we present re-sults of the event day in relation to a routine day for baselinecomparison. We normalize the actual measurement valuesby their mean values on the routine day (unless stated oth-erwise); our results thus effectively represent how the eventdiffers from routine conditions. We omit absolute numbersfrom some non-normalized plots due to proprietary reasons.
3. CHARACTERIZING PERFORMANCEISSUES
Generally speaking, a user’s experience about networkperformance can be divided into two phases. The pre-connection phase is characterized by the UE attempting toestablish a connection with the cellular network, or in otherwords establishing a RAB. In this phase, the user waits forconnection establishment, while not being able to exchangetraffic at this time. The post-connection phase starts after aRAB is assigned. In this phase, user experience is related tomore traditional voice call performance metrics such as calldrop and block rate or end-to-end TCP performance met-rics, such as delay and packet loss. Below, we separatelydiscuss both pre- and post-connection network performanceexperienced by users during both events.
3.1 Pre-connection Network PerformanceUsers may experience difficulty in establishing RABs in
the pre-connection phase due to a wide variety of reasons.Every time a request to allocate more radio resources is de-nied by the RNC, a RRC failure and its underlying reasonis logged by our measurement apparatus. In our analysis,we study the logs of various types of RRC failures that arecollected at the RNC. Each type of RRC failure correspondsto a specific problem in the cellular network operation. The3 most common types of failures observed in our data setare the following.
1. Radio link setup failures occur when a user’s request tosetup a radio link is not served due to poor RF channelquality, which is often caused by increased interference.
2. Radio link addition failures occur when a user’s requestto add a radio link to an existing radio connection forsoft handovers is denied.
3. Too many serving cell users indicates blocking for newusers which results when all available RABs are occu-pied by existing users.
Figure 3 plots the timeseries of the most common types ofRRC failures on the event and routine days for both events.We observe that RRC failures increase sharply on the eventdays, whereas they are negligible (and steady) on the rou-tine days for both events. For both events, RRC failures

0 1 2 3 4 5 6 7 8 9 10111213141516171819202122230
50
100
150
200
250
300
350
400
450
t (hour)
Rad
io L
ink
Set
up F
ailu
re
EventRoutine
0 1 2 3 4 5 6 7 8 9 10111213141516171819202122230
100
200
300
400
500
600
700
800
t (hour)
Rad
io L
ink
Add
ition
Fai
lure
EventRoutine
0 1 2 3 4 5 6 7 8 9 10111213141516171819202122230
20
40
60
80
100
120
t (hour)
Too
Man
y S
ervi
ng C
ell U
sers
EventRoutine
(a) Event A
0 1 2 3 4 5 6 7 8 9 10111213141516171819202122230
500
1000
1500
2000
2500
t (hour)
Rad
io L
ink
Set
up F
ailu
re
EventRoutine
0 1 2 3 4 5 6 7 8 9 10111213141516171819202122230
50
100
150
t (hour)
Rad
io L
ink
Add
ition
Fai
lure
EventRoutine
0 1 2 3 4 5 6 7 8 9 10111213141516171819202122230
1000
2000
3000
4000
5000
6000
t (hour)
Too
Man
y S
ervi
ng C
ell U
sers
EventRoutine
(b) Event B
Figure 3: (Normalized) Timeseries of common types of RRC failures
10−1
100
101
10−2
10−1
100
101
102
103
Before Event
Distance from Venue (mi)
Eve
nt F
ailu
res/
Rou
tine
Fai
lure
s
10−1
100
101
10−2
10−1
100
101
102
103
During Event
Distance from Venue (mi)
Eve
nt F
ailu
res/
Rou
tine
Fai
lure
s
10−1
100
101
10−2
10−1
100
101
102
103
After Event
Distance from Venue (mi)
Eve
nt F
ailu
res/
Rou
tine
Fai
lure
s
(a) Event A
10−1
100
101
10−2
100
102
104
106
Before Event
Distance from Venue (mi)
Eve
nt F
ailu
res/
Rou
tine
Fai
lure
s
10−1
100
101
10−2
100
102
104
106
During Event
Distance from Venue (mi)
Eve
nt F
ailu
res/
Rou
tine
Fai
lure
s
10−1
100
101
10−2
100
102
104
106
After Event
Distance from Venue (mi)
Eve
nt F
ailu
res/
Rou
tine
Fai
lure
s
(b) Event B
Figure 4: RRC failure ratios plotted as a function of distance to the venue and for time intervals before,during, and after the event
start occurring around noon and generally reach their peakeither just before or during the event. Specifically, radio linkaddition failures peak at more than 700x their average onthe routine day for event A and too many serving cell userspeak at more than 5000x their average on the routine dayfor event B.
The nature of RRC failures for both events indicates thattheir potential root cause is high network load and conges-tion due to a large number of competing users at cell sectorlevel. Therefore, we next analyze RRC failures at cell sectorlevel before, during, and after the events as a function ofdistance from the venue. Figure 4 shows the scatter plotsbetween the distance of cell sectors from the venue (in miles)
and the ratio of the number of RRC failures on the eventday to that on the routine day. The horizontal dashed lineat y = 1 is a reference for the data points where RRC fail-ures on the event and routine days are equal. So the datapoints above the reference line represent cell sectors thathave more RRC failures on the event day than the routineday. Likewise, the data points below the reference line rep-resent cell sectors that have less RRC failures on the eventday than the routine day. Both x- and y-axes are convertedto logarithmic scale for the sake of clarity. Note that thereare many cell sectors equidistant from the venue, especiallythose cell sectors that are close to the venue. These cell sec-tors are mounted at the same cell tower but face different
0 1 2 3 4 5 6 7 8 9 10111213141516171819202122230
5
10
15
20
25
30
35
40
t (hour)
# V
oice
Cal
ls D
ropp
ed
EventRoutine
0 1 2 3 4 5 6 7 8 9 10111213141516171819202122230
5
10
15
20
25
30
35
40
t (hour)
# V
oice
Cal
ls B
lock
ed
EventRoutine
1 2 3 4 5 6 7 8 9 10 11 12 13Error Code Index
Cou
nt
EventRoutine
(a) Event A
0 1 2 3 4 5 6 7 8 9 10111213141516171819202122230
5
10
15
t (hour)
# V
oice
Cal
ls D
ropp
ed
EventRoutine
0 1 2 3 4 5 6 7 8 9 10111213141516171819202122230
1
2
3
4
5
6
7
8
t (hour)
# V
oice
Cal
ls B
lock
ed
EventRoutine
1 2 3 4 5 6 7 8 9 10 11 12 13Error Code Index
Cou
nt
EventRoutine
(b) Event B
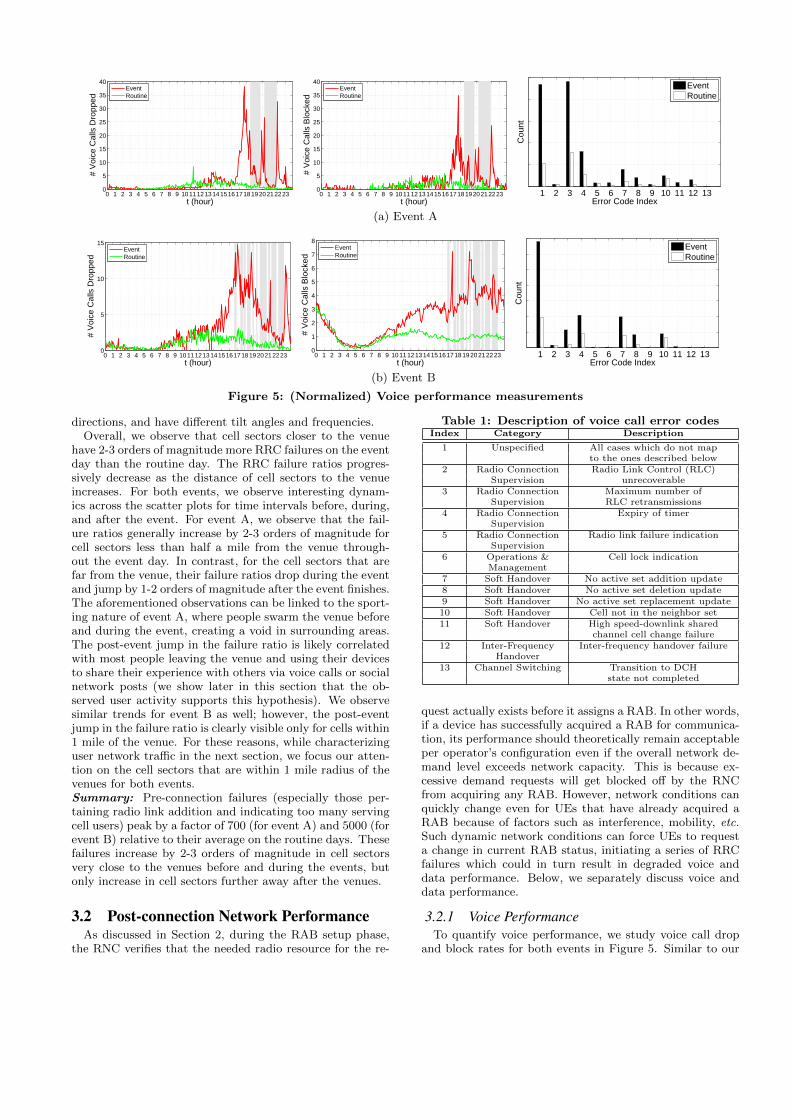
Figure 5: (Normalized) Voice performance measurements
directions, and have different tilt angles and frequencies.Overall, we observe that cell sectors closer to the venue
have 2-3 orders of magnitude more RRC failures on the eventday than the routine day. The RRC failure ratios progres-sively decrease as the distance of cell sectors to the venueincreases. For both events, we observe interesting dynam-ics across the scatter plots for time intervals before, during,and after the event. For event A, we observe that the fail-ure ratios generally increase by 2-3 orders of magnitude forcell sectors less than half a mile from the venue through-out the event day. In contrast, for the cell sectors that arefar from the venue, their failure ratios drop during the eventand jump by 1-2 orders of magnitude after the event finishes.The aforementioned observations can be linked to the sport-ing nature of event A, where people swarm the venue beforeand during the event, creating a void in surrounding areas.The post-event jump in the failure ratio is likely correlatedwith most people leaving the venue and using their devicesto share their experience with others via voice calls or socialnetwork posts (we show later in this section that the ob-served user activity supports this hypothesis). We observesimilar trends for event B as well; however, the post-eventjump in the failure ratio is clearly visible only for cells within1 mile of the venue. For these reasons, while characterizinguser network traffic in the next section, we focus our atten-tion on the cell sectors that are within 1 mile radius of thevenues for both events.Summary: Pre-connection failures (especially those per-taining radio link addition and indicating too many servingcell users) peak by a factor of 700 (for event A) and 5000 (forevent B) relative to their average on the routine days. Thesefailures increase by 2-3 orders of magnitude in cell sectorsvery close to the venues before and during the events, butonly increase in cell sectors further away after the venues.
3.2 Post-connection Network PerformanceAs discussed in Section 2, during the RAB setup phase,
the RNC verifies that the needed radio resource for the re-
Table 1: Description of voice call error codesIndex Category Description
1 Unspecified All cases which do not mapto the ones described below
2 Radio Connection Radio Link Control (RLC)Supervision unrecoverable
3 Radio Connection Maximum number ofSupervision RLC retransmissions
4 Radio Connection Expiry of timerSupervision
5 Radio Connection Radio link failure indicationSupervision
6 Operations & Cell lock indicationManagement
7 Soft Handover No active set addition update8 Soft Handover No active set deletion update9 Soft Handover No active set replacement update10 Soft Handover Cell not in the neighbor set11 Soft Handover High speed-downlink shared
channel cell change failure12 Inter-Frequency Inter-frequency handover failure
Handover13 Channel Switching Transition to DCH
state not completed
quest actually exists before it assigns a RAB. In other words,if a device has successfully acquired a RAB for communica-tion, its performance should theoretically remain acceptableper operator’s configuration even if the overall network de-mand level exceeds network capacity. This is because ex-cessive demand requests will get blocked off by the RNCfrom acquiring any RAB. However, network conditions canquickly change even for UEs that have already acquired aRAB because of factors such as interference, mobility, etc.Such dynamic network conditions can force UEs to requesta change in current RAB status, initiating a series of RRCfailures which could in turn result in degraded voice anddata performance. Below, we separately discuss voice anddata performance.
3.2.1 Voice PerformanceTo quantify voice performance, we study voice call drop
and block rates for both events in Figure 5. Similar to our

0 1 2 3 4 5 6 7 8 9 10111213141516171819202122230.6
0.8
1
1.2
1.4
1.6
1.8
2
2.2
t (hour)
Pac
ket l
oss
ratio
EventRoutine
0 1 2 3 4 5 6 7 8 9 10111213141516171819202122230.5
1
1.5
2
2.5
3
3.5
4
t (hour)
I−R
TT
EventRoutine
0 1 2 3 4 5 6 7 8 9 1011121314151617181920212223
0.8
0.9
1
1.1
1.2
1.3
t (hour)
R−
RT
T
EventRoutine
(a) Event A
0 1 2 3 4 5 6 7 8 9 1011121314151617181920212223
1
2
3
4
5
6
7
t (hour)
Pac
ket l
oss
ratio
EventRoutine
0 1 2 3 4 5 6 7 8 9 1011121314151617181920212223
0.8
1
1.2
1.4
1.6
1.8
t (hour)
I−R
TT
EventRoutine
0 1 2 3 4 5 6 7 8 9 10111213141516171819202122230.7
0.8
0.9
1
1.1
1.2
1.3
1.4
t (hour)
R−
RT
T
EventRoutine
(b) Event B
Figure 6: (Normalized) Data performance measurements
observations about pre-connection network performance, thenumber of voice call drops and blocks increase substantiallyon the event days as compared to the routine days for bothevents. Specifically, we observe peak increases of more than30x and 7x relative to their average on the routine days forevents A and B, respectively. It is noteworthy that voice calldrop and block rates peak just before the start of the events,during the intermissions, and at the end of the events. Thisobservation is consistent with our expectation that users areless likely to make voice calls during event activities andmore likely to make voice calls either before the start ofevents, after the end of events, or during intermissions be-tween event activities. To further investigate the root causesof voice call blocks and drops, we also plot the histogram oftheir error codes in Figure 5. The error code descriptionsin Table 1 indicate that the two most common categoriesof error codes for both events are related to radio connec-tion supervision and soft handovers, which in turn point tointerference and mobility as the root cause.
3.2.2 Data PerformanceTo quantify data performance, we study two key end-to-
end TCP performance metrics: packet loss ratio and RTTfor both events.1 Packet loss ratio quantifies network re-liability. We only have packet loss ratio measurements forTCP flows, which constitute approximately 95% of all flowsin our data set. RTT quantifies network delay and is de-fined as the duration of time taken by a packet to reachthe server from the UE plus the duration of time taken bya packet to reach the UE from the server. It is importantto note that RTT measurements are biased by differencesin the paths between different UEs and the external serversthey communicate with. Similar to packet loss ratio mea-surements, we only have RTT measurements for TCP flows.
1Because end-to-end TCP performance also involves addi-tional parameters such as back-haul bandwidth and evenremote server load, we leave a more detailed investigation ofTCP performance to future work.
RTT measurements for TCP flows are estimated by SYN,SYN-ACK, and ACK packets in the TCP handshake. Ina cellular network, RTT essentially consists of two compo-nents: radio network RTT and Internet RTT. Radio networkRTT (R-RTT) is the time duration between the SYN-ACKpacket from server passing the Gn interface and the ACKpacket from the UE passing the Gn interface. Internet RTT(I-RTT) is the time duration between the SYN packet fromthe UE passing the Gn interface and the SYN-ACK packetfrom the server passing the Gn interface. Thus, RTT =R-RTT + I-RTT.
Figure 6 shows the timeseries plots of packet loss ratio, In-ternet RTT, and radio network RTT for both events. Packetloss ratio peaks at 2x and 7x relative to its average on theroutine days for events A and B, respectively. We observedifferent trends for radio network RTT and Internet RTTfor both events. There is only a minor increase in radio net-work RTT on the event days. Internet RTT increases dur-ing the intermissions for both events; however, this increaseindicates congestion at remote servers caused by increasedevent-driven traffic. Overall, data performance results in-dicate that users experience data connection performanceissues to varying extents during the two events.Summary: Post-connection performance degradation is ob-served for both voice and data network during the events.Specifically, voice call failures (dropped calls and call blocks)increase by a factor of as much as 30 (for event A) and 7 (forevent B). Moreover, packet loss ratio increases by a factor of2 (for event A) and 7 (for event B); while the RTT increasesby a factor of 3.5 (for event A) and 1.5 (for event B). Whilethese indicate a degradation in performance experienced byusers already connected to the network, this is substantiallysmaller than the pre-connection failures discussed in Section3.1. Overall, pre- and post-connection network performanceresults highlight that limited radio resources are the majorbottleneck during crowded events.

0 1 2 3 4 5 6 7 8 9 10111213141516171819202122230
1
2
3
4
5
6
7
8
9
t (hour)
Tup
EventRoutine
0 1 2 3 4 5 6 7 8 9 10111213141516171819202122230
0.5
1
1.5
2
2.5
3
t (hour)
Tdo
wn
EventRoutine
0 1 2 3 4 5 6 7 8 9 10111213141516171819202122230
0.5
1
1.5
2
2.5
3
3.5
4
t (hour)
U
Event (AC)Event (RAB)Event (DCH)Routine (AC)Routine (RAB)Routine (DCH)
(a) Event A
0 1 2 3 4 5 6 7 8 9 10111213141516171819202122230
1
2
3
4
5
t (hour)
Tup
EventRoutine
0 1 2 3 4 5 6 7 8 9 10111213141516171819202122230
0.5
1
1.5
2
2.5
3
t (hour)
Tdo
wn
EventRoutine
0 1 2 3 4 5 6 7 8 9 10111213141516171819202122230
0.5
1
1.5
2
2.5
3
t (hour)
U
Event (AC)Event (RAB)Event (DCH)Routine (AC)Routine (RAB)Routine (DCH)
(b) Event BFigure 7: (Normalized) Network load measurements
4. UNDERSTANDING PERFORMANCEISSUES
Next, we characterize user network traffic to identifypatterns that correlate with the observed pre- and post-connection performance degradation during the events. Us-ing the insights obtained from this characterization, we aimto identify network optimization opportunities that can po-tentially improve end-user experience in crowded locations.We characterize network traffic in terms of both aggregatenetwork load and user-level session characteristics.
4.1 Aggregate Network LoadWe quantify aggregate network load in terms of the follow-
ing two metrics: throughput and user counters. Through-put or bit-rate is sampled for all UEs at the RNC everycouple of seconds. Based on the direction of traffic, we cansplit the throughput into uplink throughput (Tup) and down-link throughput (Tdown). Figure 7 plots the timeseries ofuplink and downlink throughput on the event and routinedays for both events. For the routine days, both uplink anddownlink throughput peak around the noon time and de-cline steadily afterwards, reaching the bottom during latenight and early morning. We observe a different trend foruplink throughput on the event days. For instance, the peakuplink throughput on the event day is more than 8x and 4xthe average throughput on the routine day for events A andB, respectively. We also observe that the uplink throughputpeaks and event activities are approximately aligned. Forinstance, uplink throughput sharply increases at the startand end of the second segment for event A. Similar, thoughless pronounced, patterns are also observable for event B. Incontrast to the uplink throughput, increases in the downlinkthroughput timeseries are steadier for both events.
To further analyze traffic volume characteristics, we plotthe traffic flow count histograms for top content publishers inFigure 8. We focus on flows rather than bytes to avoid biastowards high volume applications, such as video streaming.We observe that flow counts of social networking contentpublishers more than double on the event day as compared
0 0.5 1 1.5 2 2.5
social 1
social 2
social 3
video
audio
search
cdn 1
cdn 2
cdn 3
Flow Count Ratio
social 1
social 2
social 3
video
audio
search
cdn 1
cdn 2
cdn 3
Flow Count on the Event Day
(a) Event A
0 0.5 1 1.5 2 2.5
social 1
social 2
social 3
video
audio
search
cdn 1
cdn 2
cdn 3
Flow Count Ratio
social 1
social 2
social 3
video
audio
search
cdn 1
cdn 2
cdn 3
Flow Count on the Event Day
(b) Event B
Figure 8: Flow count histograms for top contentpublishers in our data set
to the routine day for event A. Likewise, social networkingcontent accounts for most flows on the event day for eventB. Our further investigation (not shown here) revealed thatsocial networking content is at least 2x more upstream heavyas compared to other content types, which explains the in-crease in uplink throughput during both events.
We also analyze user counters for the event and routinedays for both events. Users are classified into the followingoverlapping categories based on their RRC states: admis-sion control (AC), radio access bearer (RAB), and dedicatedchannel (DCH). AC category includes the users who havecompleted the admission control procedure. RAB categoryincludes the users who have been assigned a RAB after ad-
1 2 3 4 5 6 7 8 9 10111213141516171819202122230
0.5
1
1.5
2
2.5
3
3.5
4
t (hour)
Ses
sion
Cou
nt
EventRoutine
1 2 3 4 5 6 7 8 9 10111213141516171819202122230.7
0.8
0.9
1
1.1
1.2
1.3
1.4
1.5
t (hour)
Ave
rage
Ses
sion
Len
gth
EventRoutine
0 1 2 3 4 5 6 7 8 9 10111213141516171819202122230.5
1
1.5
t (hour)
Avg
. Ses
sion
Inte
r−ar
rival
Tim
e
EventRoutine
(a) Event A
1 2 3 4 5 6 7 8 9 10111213141516171819202122230
0.5
1
1.5
2
2.5
3
3.5
4
t (hour)
Ses
sion
Cou
nt
EventRoutine
1 2 3 4 5 6 7 8 9 10111213141516171819202122230.8
0.85
0.9
0.95
1
1.05
1.1
1.15
t (hour)
Ave
rage
Ses
sion
Len
gth
EventRoutine
0 1 2 3 4 5 6 7 8 9 10111213141516171819202122230.5
1
1.5
t (hour)
Avg
. Ses
sion
Inte
r−ar
rival
Tim
e
EventRoutine
(b) Event BFigure 9: (Normalized) Session Count, Average Length, Average Inter-arrival Time
1 2 3 4 5 6 7 8 9 10111213141516171819202122230
0.5
1
1.5
2
t (hour)
Bdo
wn
EventRoutine
0 1 2 3 4 5 6 7 8 9 10111213141516171819202122230.5
1
1.5
2
t (hour)
Bup
EventRoutine
0 1 2 3 4 5 6 7 8 9 1011121314151617181920212223−1
−0.5
0
0.5
1
1.5
t (hour)lo
g(B
dow
n/Bup
)
EventRoutine
(a) Event A
0 1 2 3 4 5 6 7 8 9 10111213141516171819202122230.5
1
1.5
t (hour)
Bdo
wn
EventRoutine
0 1 2 3 4 5 6 7 8 9 10111213141516171819202122230.5
1
1.5
2
t (hour)
Bup
EventRoutine
0 1 2 3 4 5 6 7 8 9 10111213141516171819202122230
0.5
1
1.5
t (hour)
log(
Bdo
wn/B
up)
EventRoutine
(b) Event B
Figure 10: (Normalized) Per-Session Downlink Bytes (Bdown), Uplink Bytes (Bup), Ratio (Bdown/(Bup)
mission control. Such users are typically in either FACHor DCH state. Finally, DCH category only includes theusers who are in DCH state. Let U denote the numberof users, also let UAC , URAB , and UDCH denote the numberof users in the aforementioned categories. As a general rule,UAC ≥ URAB ≥ UDCH . Figure 7 plots the timeseries ofnumber of users in AC, RAB, and DCH categories. Thesetimeseries show a trend similar to the throughput measure-ments. All user counters have higher values on the eventsdays as compared to the respective routine days for bothevents. Specifically, the number of users with admission con-trol peaks at more than 3x during the events as comparedto its average on the routine days.Summary: Both aggregate uplink and downlink through-put increase during the event days; uplink throughput in-creases by a factor of as much as 8 and 4 (for events A and
B respectively), while downlink throughput increases by afactor of 3 (for both events). Moreover, there is a substan-tial increase in the traffic volume of social networking con-tent during the events, which is relatively more upstreamheavy. Likewise, number of users with admission control in-crease by a factor of 3 for both event days. Overall, our ag-gregate network load characterization shows that increaseduser activity during the events, specifically in terms of uplinkthroughput and user counters, is correlated with increasedpre-connection failures. To reduce the impact of increasednetwork load during crowded events, we will investigate theeffectiveness of opportunistic connection sharing in Section5.2.
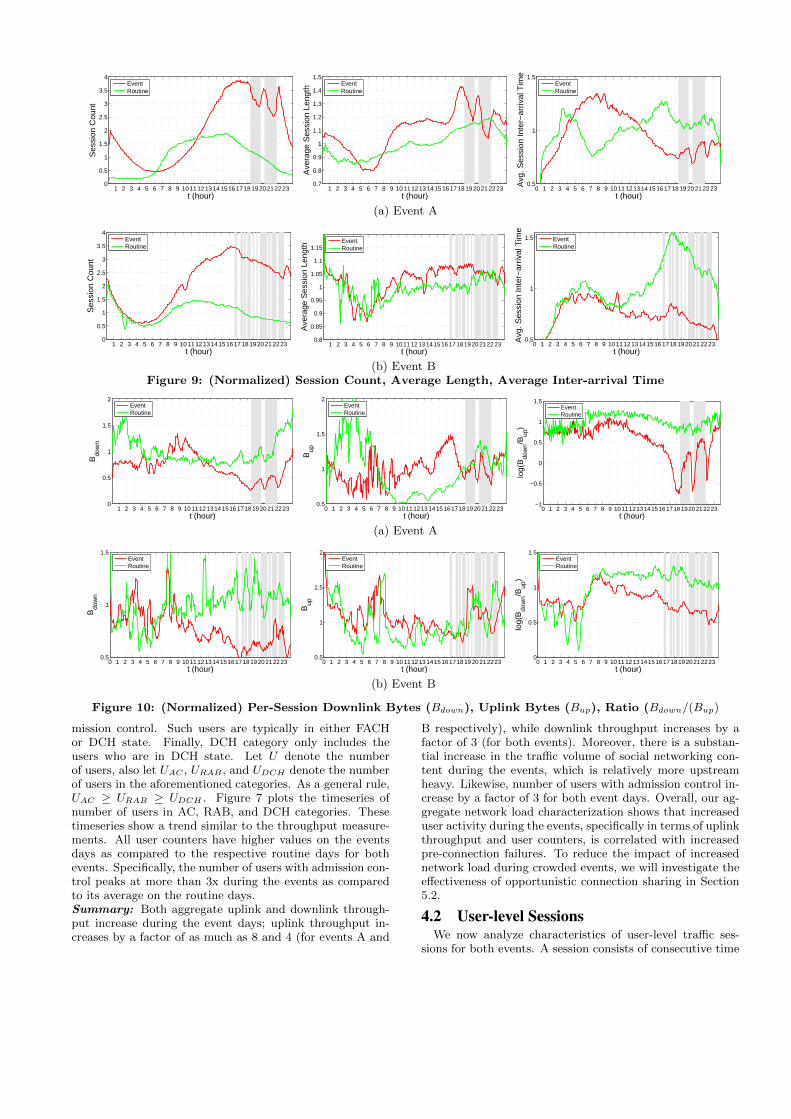
4.2 User-level SessionsWe now analyze characteristics of user-level traffic ses-
sions for both events. A session consists of consecutive time

1 2 3 4 5 6 7 8 9 1011121314151617181920212223t (hour)
TD
CH
−ID
LE
α=2α=4α=6α=8α=10
1 2 3 4 5 6 7 8 9 1011121314151617181920212223t (hour)
Pro
mot
ion
dela
y
α=2α=4α=6α=8α=10
1 2 3 4 5 6 7 8 9 1011121314151617181920212223t (hour)
Pow
er
α=2α=4α=6α=8α=10
(a) Event A
1 2 3 4 5 6 7 8 9 1011121314151617181920212223t (hour)
TD
CH
−ID
LE
α=2α=4α=6α=8α=10
1 2 3 4 5 6 7 8 9 1011121314151617181920212223t (hour)
Pro
mot
ion
dela
y
α=2α=4α=6α=8α=10
1 2 3 4 5 6 7 8 9 1011121314151617181920212223t (hour)
Pow
er
α=2α=4α=6α=8α=10
(b) Event BFigure 11: Experimental results for radio network parameter tuning
intervals with uplink or downlink byte transfer and its endis marked by an inactivity timeout of τ seconds. The re-sults presented in this section are computed for τ = 5 sec-onds. Changing the value of τ does not qualitatively af-fect the analysis results. Figure 9 shows the timeseries ofsession count, average session length, and average sessioninter-arrival time for both events. Session count follows asimilar trend to the earlier aggregate network load metrics –at peak, there is more than 3.5x increase relative to the av-erage on the routine days for both events. Furthermore, weobserve an increase in average session length on the eventdays as compared to the routine days, e.g., there is morethan 1.4x increase for event A. On the contrary, average ses-sion inter-arrival time decreases sharply on the event days ascompared to the routine days – this indicates that users areinitiating sessions much more frequently during the events.To further investigate the nature of changing session pat-terns, we plot the timeseries of average downlink bytes persession (Bdown), average uplink bytes per session (Bup), andthe average ratio of downlink bytes to uplink bytes per ses-sion in Figure 10. We observe that average downlink bytesper session sharply decreases up to 0.5x during the eventdays; whereas, average uplink bytes per session exhibits amixed trend. The ratio (Bdown/Bup) also sharply decreasesduring the events, which is due to the increased traffic vol-ume of upstream-heavy social networking content.Summary: User sessions are on average longer during bothevents (by a factor of as much as 1.4) – as well as morenumerous and more frequently initiated. However, users ex-change only as much as half the bytes per session on av-erage. This change in workload is due to a change in theapplication usage during these events, such as greater pro-portion of social networking flows observed earlier. Thesetrends point to potential waste of radio resources by UEs,which can be mitigated by tuning radio network parame-ters. Towards this end, we will investigate the effectivenessof varying RRC timeouts in Section 5.1.
5. EVALUATING MITIGATION SCHEMESIn this section, we evaluate two proposals to mitigate
cellular network performance degradation during crowdedevents.
5.1 Radio Network Parameter TuningWe first investigate whether tuning radio network param-
eters can result in more efficient radio resource usage duringcrowded events. As mentioned in Section 2, UEs acquireand release radio resources by transitioning to different RRCstates. A UE is promoted to a higher energy state dependingon buffer occupancy and it is demoted to a lower energy statedepending on timeouts. Here, we study how RRC timeoutscan be tuned for more efficient radio resource utilization,without explicit feedback from individual UEs. Recall fromFigures 9 and 10 that average bytes per session decreasesduring the events, despite the increase in average sessionlength. This observation highlights potential waste of radioresources and UE energy consumption in crowded locations.Therefore, a natural suggestion would be to reduce RRCtimeouts to mitigate the radio resource wastage. However,reducing RRC timeouts can result in more frequent statepromotions, which can introduce state promotion delays re-sulting in degraded user experience [14, 20]. Hence, there isa tradeoff between performance and resource efficiency.
5.1.1 Simulation SetupWe conduct trace-driven simulations to quantitatively
study the tradeoffs involved in changing RRC timeouts. Wesimulate the RRC state machine of every user using the RNClogs while focusing on the DCH state, which has the highestallocated radio resources and energy consumption among allRRC states. Specifically, we study DCH→FACH RRC time-out parameter, which is denoted by α hereafter. As men-tioned earlier, changing RRC timeouts introduces tradeoffsamong radio resource wastage, user experience, and UE en-ergy consumption. We use the following three performancemetrics to quantify these factors. (1) The DCH state idle oc-
cupation time, denoted by TDCH-IDLE, quantifies the radioresources wasted by UEs in DCH state. (2) The promo-tion delay quantifies the additional delay caused when UEstransition to DCH state from FACH state. (3) The powerconsumption quantifies the total energy consumed by UEsduring DCH state occupation and in FACH to DCH transi-tions. We use the following simulation parameters in our ex-periments (inferred by Qian et al. in [20]): (1) FACH→DCHpromotion radio power = 700mW, (2) DCH state power= 800mW, (3) FACH→DCH promotion delay = 2 sec, and(4) RLC buffer threshold = 500 bytes.
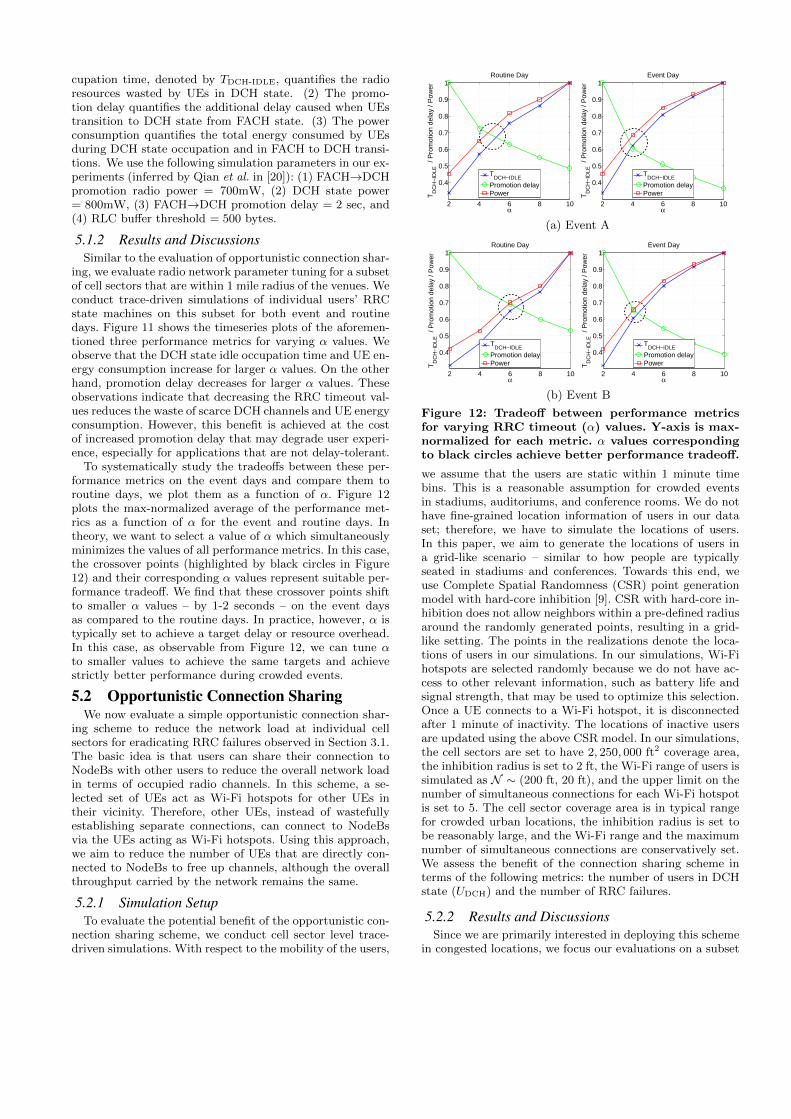
5.1.2 Results and DiscussionsSimilar to the evaluation of opportunistic connection shar-
ing, we evaluate radio network parameter tuning for a subsetof cell sectors that are within 1 mile radius of the venues. Weconduct trace-driven simulations of individual users’ RRCstate machines on this subset for both event and routinedays. Figure 11 shows the timeseries plots of the aforemen-tioned three performance metrics for varying α values. Weobserve that the DCH state idle occupation time and UE en-ergy consumption increase for larger α values. On the otherhand, promotion delay decreases for larger α values. Theseobservations indicate that decreasing the RRC timeout val-ues reduces the waste of scarce DCH channels and UE energyconsumption. However, this benefit is achieved at the costof increased promotion delay that may degrade user experi-ence, especially for applications that are not delay-tolerant.
To systematically study the tradeoffs between these per-formance metrics on the event days and compare them toroutine days, we plot them as a function of α. Figure 12plots the max-normalized average of the performance met-rics as a function of α for the event and routine days. Intheory, we want to select a value of α which simultaneouslyminimizes the values of all performance metrics. In this case,the crossover points (highlighted by black circles in Figure12) and their corresponding α values represent suitable per-formance tradeoff. We find that these crossover points shiftto smaller α values – by 1-2 seconds – on the event daysas compared to the routine days. In practice, however, α istypically set to achieve a target delay or resource overhead.In this case, as observable from Figure 12, we can tune αto smaller values to achieve the same targets and achievestrictly better performance during crowded events.
5.2 Opportunistic Connection SharingWe now evaluate a simple opportunistic connection shar-
ing scheme to reduce the network load at individual cellsectors for eradicating RRC failures observed in Section 3.1.The basic idea is that users can share their connection toNodeBs with other users to reduce the overall network loadin terms of occupied radio channels. In this scheme, a se-lected set of UEs act as Wi-Fi hotspots for other UEs intheir vicinity. Therefore, other UEs, instead of wastefullyestablishing separate connections, can connect to NodeBsvia the UEs acting as Wi-Fi hotspots. Using this approach,we aim to reduce the number of UEs that are directly con-nected to NodeBs to free up channels, although the overallthroughput carried by the network remains the same.
5.2.1 Simulation SetupTo evaluate the potential benefit of the opportunistic con-
nection sharing scheme, we conduct cell sector level trace-driven simulations. With respect to the mobility of the users,
2 4 6 8 10
0.4
0.5
0.6
0.7
0.8
0.9
1Routine Day
α
TD
CH
−ID
LE /
Pro
mot
ion
dela
y / P
ower
TDCH−IDLE
Promotion delayPower
2 4 6 8 10
0.4
0.5
0.6
0.7
0.8
0.9
1Event Day
α
TD
CH
−ID
LE /
Pro
mot
ion
dela
y / P
ower
TDCH−IDLE
Promotion delayPower
(a) Event A
2 4 6 8 10
0.4
0.5
0.6
0.7
0.8
0.9
1Routine Day
α
TD
CH
−ID
LE /
Pro
mot
ion
dela
y / P
ower
TDCH−IDLE
Promotion delayPower
2 4 6 8 10
0.4
0.5
0.6
0.7
0.8
0.9
1Event Day
α
TD
CH
−ID
LE /
Pro
mot
ion
dela
y / P
ower
TDCH−IDLE
Promotion delayPower
(b) Event B
Figure 12: Tradeoff between performance metricsfor varying RRC timeout (α) values. Y-axis is max-normalized for each metric. α values correspondingto black circles achieve better performance tradeoff.
we assume that the users are static within 1 minute timebins. This is a reasonable assumption for crowded eventsin stadiums, auditoriums, and conference rooms. We do nothave fine-grained location information of users in our dataset; therefore, we have to simulate the locations of users.In this paper, we aim to generate the locations of users ina grid-like scenario – similar to how people are typicallyseated in stadiums and conferences. Towards this end, weuse Complete Spatial Randomness (CSR) point generationmodel with hard-core inhibition [9]. CSR with hard-core in-hibition does not allow neighbors within a pre-defined radiusaround the randomly generated points, resulting in a grid-like setting. The points in the realizations denote the loca-tions of users in our simulations. In our simulations, Wi-Fihotspots are selected randomly because we do not have ac-cess to other relevant information, such as battery life andsignal strength, that may be used to optimize this selection.Once a UE connects to a Wi-Fi hotspot, it is disconnectedafter 1 minute of inactivity. The locations of inactive usersare updated using the above CSR model. In our simulations,the cell sectors are set to have 2, 250, 000 ft2 coverage area,the inhibition radius is set to 2 ft, the Wi-Fi range of users issimulated as N ∼ (200 ft, 20 ft), and the upper limit on thenumber of simultaneous connections for each Wi-Fi hotspotis set to 5. The cell sector coverage area is in typical rangefor crowded urban locations, the inhibition radius is set tobe reasonably large, and the Wi-Fi range and the maximumnumber of simultaneous connections are conservatively set.We assess the benefit of the connection sharing scheme interms of the following metrics: the number of users in DCHstate (UDCH) and the number of RRC failures.
5.2.2 Results and DiscussionsSince we are primarily interested in deploying this scheme
in congested locations, we focus our evaluations on a subset

1 2 3 4 5 6 7 8 9 1011121314151617181920212223t (hour)
UD
CH
N=0N=2N=4N=6N=8N=10
1 2 3 4 5 6 7 8 9 1011121314151617181920212223t (hour)
# R
RC
Fai
lure
s
N=0N=2N=4N=6N=8N=10
(a) Event A
1 2 3 4 5 6 7 8 9 1011121314151617181920212223t (hour)
UD
CH
N=0N=2N=4N=6N=8N=10
1 2 3 4 5 6 7 8 9 1011121314151617181920212223t (hour)
# R
RC
Fai
lure
s
N=0N=2N=4N=6N=8N=10
(b) Event B
Figure 13: Experimental results for opportunisticconnection sharing
of cell sectors in our data set that are within 1 mile radius ofthe venues. We evaluate the opportunistic connection shar-ing scheme using trace-driven simulations on this subset onthe event days. The results plotted in Figure 13 are the aver-age of 1000 independent simulation runs. We plot the time-series of the number of occupied DCH channels (UDCH) forvarying number of Wi-Fi hotspots per cell sector (denotedby N). As expected, we observe that UDCH values becomesmaller for larger values of N , freeing up DCH channels thatare now available for UEs unable to transition to the DCHstate due to RRC failures. We also plot the number of RRCfailures for varying values of N in Figure 13. Again, as ex-pected, we observe that RRC failures decrease for increas-ing values of N . Consequently, based on instantaneous loadconditions, the cellular network can dynamically vary therequired number of users acting as Wi-Fi hotspots to min-imize RRC failures. We note that this connection sharingscheme successfully eradicates more than 95% RRC failuresfor both events when N = 10. This substantial reductionin the number of RRC failures in congested cell sectors willlikely result in improved performance for users.
5.2.3 Practical IssuesBelow, we discuss some practical issues of opportunistic
connection sharing.• Wi-Fi Hotspot Selection: The selection of Wi-Fi hotspotscan be mediated by the cellular network based on a vari-ety of factors, such as battery life and signal strength. UEsacting as Wi-Fi hotspots may experience high energy drainand may run out of battery power. To address this issue,the role of Wi-Fi hotspot can be periodically rotated amongthe user pool by the cellular network. The cellular networkshould prefer UEs with better signal strength because UEsconsume significantly more energy and suffer reduced effec-tive bit rate when the signal strength is poor [22]. On theother hand, the UEs that are unable to get RAB assignmentscan discover Wi-Fi hotspots in their range using the stan-dard Wi-Fi discovery methods. In case of multiple options,UEs should prefer hotspots with better signal strength.• Initial Connection Delay : After a device connects to a Wi-Fi hotspot, similar to RRC protocol, it disconnects after apre-defined inactivity timer expires. However, the value ofthis timer should be set much higher than the correspond-
ing RRC timers so that the device does not have to incurinitial delay, which is up to several seconds, for every datatransfer. In our simulations, the inactivity timer was set tobe 1 minute.• Out of Range: A device has to request RAB assignmentwhen it moves out of a hotspot’s Wi-Fi range. If it is unableto get a RAB due to congestion then the RNC can dynami-cally assign more Wi-Fi hotspots in the cell sector to provideconnectivity to more users.• Radio Technologies: Opportunistic connection sharing isonly usable when a majority of devices in the cellular net-work have built-in Wi-Fi capability. In our simulations, weassume that all devices have Wi-Fi capability. In case Wi-Fi is not available, other technologies such as Bluetoothcan also be used. Bluetooth has lower power consumption,smaller radio range, and supports less data rate as comparedto Wi-Fi. Consequently, it can be used as a low power alter-native for small transmissions such as tweets.•Wi-Fi-Cellular Handovers: Working extensions to the Wi-Fi standard already address the issue of smooth handoversbetween Wi-Fi and cellular networks, including 3GPP Ac-cess Network Discovery and Selection Function (ANDSF),Hotspot 2.0 initiative [18], and other techniques [2].• Voice Traffic Offloading : In this opportunistic connectionsharing scheme, voice traffic can be tunneled via the Wi-Ficonnection using the well-known Voice over Wi-Fi solutions,such as Wi-Fi certified Voice-Enterprise [6].• Incentives: Cellular network operators may provide billingbased incentives to users for participating in this opportunis-tic connection sharing scheme.
5.3 LimitationsBelow, we briefly mention two limitations of our trace-
driven simulation evaluations. First, our simulation basedevaluations cannot account for changes in traffic workloadresulting from different network conditions due to our pro-posed mitigation schemes. Second, they also cannot accountfor low-level dependencies between performance metrics andnetwork load. For example, some types of RRC failures areimpacted by interference, which in turn is a function of net-work load. Addressing these limitations requires experimentson operational cellular networks, which are beyond the scopeof this work. However, despite these limitations, we believethat the sheer magnitude of the improvements observed inour simulations indicates that the mitigation schemes dis-cussed in this paper would accrue some benefit in practice.
6. RELATED WORKWe divide related work into the following categories.
Cellular Performance Characterization: The areas ofcellular performance characterization have recently receivedmuch attention by the research community. For example,small-scale studies have characterized application perfor-mance [12,26] and fairness [7]. Large-scale studies have char-acterized throughput and airtime [19], smartphone traffic[25], M2M device traffic [24], smartphone app traffic [23,27],and heavy users [10]. In contrast to these studies, we believethat we are the first to analyze cellular performance changesspecifically during crowded events.Radio Network Parameter Tuning: Prior work on radionetwork parameter tuning study the impact of RRC timerson network performance and smartphone energy consump-tion. Most prior work is based on user-end measurements

performed using a few cellular devices. For instance, Liu etal. characterized performance in a 1xEV-DO network us-ing measurements obtained from two laptops equipped withSierra Wireless data cards [16]. Balasubramanian et al. pro-posed a UE based approach, called TailEnder, to alter trafficpatterns based on the prior knowledge of RRC state ma-chine [8]. Some studies are based on theoretical analysisand simulation. For instance, Liers et al. proposed a schemeto adaptively tune RRC timeout parameters based on thedemand and load situation, and validated it using simula-tions [15]. Yeh et al. proposed a scheme to tune RRC timeoutparameters using analytical models based on available radioresources, energy consumption, quality of service, and pro-cessing overheads of the radio access network [28]. Qian etal. conducted trace-driven RRC state machine simulationsusing network-end measurements to investigate the optimal-ity of RRC timeout parameters [20]. Furthermore, they pro-posed an application-aware tail optimization protocol to si-multaneously optimize radio and energy resources [21]. Simi-lar to the prior work by Qian et al. [20,21], our analysis of ra-dio network parameter tuning is based on trace-driven RRCstate machine simulations. However, we focus on network-end tuning of RRC timeouts without any cooperation fromUEs.Opportunistic Connection Sharing: We build on exist-ing work on opportunistic traffic offloading [11, 17]. Luo etal. proposed a unified architecture, where mobile clients useboth 3G cellular link and Wi-Fi based peer-to-peer linksfor routing packets via peer-to-peer links to the appropriatedestinations [17]. Han et al. proposed content-specific op-portunistic communication scheme to offload cellular trafficvia Wi-Fi or Bluetooth [11]. However, neither of these pro-posals were evaluated using real-world traces, and both ap-proaches require architectural changes to network protocolsand hardware. Our work complements these proposals byshowing that their simplest and most practical instantiation— a simple one-hop connection sharing scheme that doesnot require architectural changes — can be very effective inreal-life crowded events. To the best of our knowledge, thispaper is the first to evaluate practical connection sharingtechniques on real-world traces.
7. CONCLUSIONThis paper presents the first performance characterization
of an operational cellular network during crowded events.We make three key contributions in this study based on thereal-world voice and data traces that we collected from atier-1 cellular network in the United States during two high-profile crowded events in 2012. First, we measured how cellu-lar network performance degrades during crowded events ascompared to routine days. Second, we analyzed what causesthe observed performance degradation. Third, we evaluatedhow practical mitigation schemes for the observed perfor-mance degradation would perform in real-life crowded eventsusing trace-driven simulations. Our findings from this studyare crucial for cellular design, management, and optimiza-tion during crowded events.
8. REFERENCES[1] Architecture enhancements for non-3GPP accesses.
http://www.3gpp.org/ftp/Specs/html-info/23402.htm.
[2] Offload service. http://www.devicescape.com/offload-service.
[3] Wireless networks are near capacity.http://www.pcworld.com/businesscenter/article/235964/survey_wireless_networks_are_near_capacity.html.
[4] Cisco Visual Networking Index: Global Mobile Data TrafficForecast Update, 2010-2015. Cisco White Paper, February,2011.
[5] Actix Press Release. http://www.actix.com/sites/www.actix.com/files/Actix_Hotspots_Study_Findings.pdf, June2012.
[6] Wi-Fi CERTIFIED Voice-Enterprise, Delivering Wi-Fi voice tothe enterprise. White Paper, May 2012.
[7] V. Aggarwal, R. Jana, K. Ramakrishnan, J. Pang, andN. Shankaranarayanan. Characterizing fairness for 3G wirelessnetworks. In IEEE LANMAN, 2011.
[8] N. Balasubramanian, A. Balasubramanian, andA. Venkataramani. Energy consumption in mobile phones: Ameasurement study and implications for network applications.In ACM IMC, 2009.
[9] R. S. Bivand, E. J. Pebesma, and V. Gomez-Rubio. AppliedSpatial Data Analysis with R. Springer, 2008.
[10] A. Botta, A. Pescape, G. Ventre, E. Biersack, and S. Rugel.Performance footprints of heavy-users in 3G networks viaempirical measurement. In International Symposium onModeling and Optimization in Mobile, Ad Hoc and WirelessNetworks (WiOpt), 2010.
[11] B. Han, P. Hui, V. S. A. Kumar, M. V. Marath, G. Pei, andA. Srinivasan. Cellular traffic offloading through opportunisticcommunications: A case study. In ACM MobiCom Workshopon Challenged Networks, 2011.
[12] J. Huang, Q. Xu, B. Tiwana, Z. M. Mao, M. Zhang, andV. Bahl. Anatomizing application performance differences onsmartphones. In ACM MobiSys, 2010.
[13] H. Jiang and C. Dovrolis. Passive estimation of TCP round-triptimes. SIGCOMM CCR, 32(3), 2002.
[14] P. P. C. Lee, T. Bu, and T. Woo. On the detection of signalingDoS attacks on 3G wireless networks. In IEEE Infocom, 2007.
[15] F. Liers and A. Mitschele-Thiel. UMTS data capacityimprovements employing dynamic rrc timeouts. In 16th IEEEInternational Symposium on Personal, Indoor and MobileRadio Communications (PIMRC), 2005.
[16] X. Liu, A. Sridharan, S. Machiraju, M. Seshadri, and H. Zang.Experiences in a 3G network: Interplay between the wirelesschannel and applications. In ACM MobiCom, 2008.
[17] H. Luo, R. Ramjeey, P. Sinhaz, L. E. Liy, and S. Lu. UCAN: Aunified cellular and adhoc network architecture. In ACMMobiCom, 2003.
[18] B. Orlandi and F. Scahill. Wi-Fi Roaming – Building onANDSF and Hotspot 2.0. Technical report, Alcatel-Lucent andBT, 2012.
[19] U. Paul, A. P. Subramanian, M. M. Buddhikot, and S. R. Das.Understanding traffic dynamics in cellular data networks. InIEEE Infocom, 2011.
[20] F. Qian, Z. Wang, A. Gerber, Z. M. Mao, S. Sen, andO. Spatscheck. Characterizing radio resource allocation for 3Gnetworks. In ACM IMC, 2010.
[21] F. Qian, Z. Wang, A. Gerber, Z. M. Mao, S. Sen, andO. Spatscheck. TOP: Tail optimization protocol for cellularradio resource allocation. In IEEE ICNP, 2010.
[22] A. Schulman, V. Navda, R. Ramjee, N. Spring, P. Deshpande,C. Grunewald, K. Jain, and V. N. Padmanabhan. Bartendr: Apractical approach to energy-aware cellular data scheduling. InACM MobiCom, 2010.
[23] M. Z. Shafiq, L. Ji, A. X. Liu, J. Pang, and J. Wang.Characterizing geospatial dynamics of application usage in a3G cellular data network. In IEEE INFOCOM, 2012.
[24] M. Z. Shafiq, L. Ji, A. X. Liu, J. Pang, and J. Wang. A firstlook at cellular machine-to-machine traffic - large scalemeasurement and characterization. In ACMSIGMETRICS/Performance, 2012.
[25] M. Z. Shafiq, L. Ji, A. X. Liu, and J. Wang. Characterizing andmodeling Internet traffic dynamics of cellular devices. In ACMSIGMETRICS, 2011.
[26] M. P. Wittie, B. Stone-Gross, K. Almeroth, and E. Belding.MIST: Cellular data network measurement for mobileapplications. In IEEE BROADNETS, 2007.
[27] Q. Xu, A. Gerber, Z. M. Mao, J. Pang, and S. Venkataraman.Identifying diverse usage behaviors of smartphone apps. InACM IMC, 2011.
[28] J.-H. Yeh, J.-C. Chen, and C.-C. Lee. Comparative analysis ofenergy saving techniques in 3GPP and 3GPP2 systems. IEEETransactions on Vehicular Technology, 58(1):432–438,January, 2009.