a final year project report on vehicle over speed detection and...
TRANSCRIPT
i
TRIBHUVAN UNIVERSITY
INSTITUTE OF ENGINEERING
PULCHOWK CAMPUS
A FINAL YEAR PROJECT REPORT ON VEHICLE OVER SPEED DETECTION
AND RECOGNITION
By:
Prashnna K.Gyawali (Roll No. 067/BEX/427)
Robin Chatatut (Roll No. 067/BEX/431)
Shailesh Acharya (Roll No. 067/BEX/437)
Sizen Neupane (Roll No. 067/BEX/438)
A PROJECT WAS SUBMITTED TO THE DEPARTMENT OF ELECTRONICS AND
COMPUTER ENGINEERING IN PARTIAL FULLFILLMENT OF THE
REQUIREMENT FOR THE BACHELORS DEGREE IN ELECTRONICS &
COMMUNICATION ENGINEERING
DEPARTMENT OF ELECTRONICS AND COMPUTER ENGINEERING
LALITPUR, NEPAL
August 28, 2014
I
COPYRIGHT
The author has agreed that the Library, Department of Electronics and Computer Engineering,
Pulchowk Campus, Institute of Engineering may make this report freely available for
inspection. Moreover, the author has agreed that permission for extensive copying of this
project report for scholarly purpose may be granted by the supervisors who supervised the
project work recorded herein or, in their absence, by the Head of the Department where in the
project report was done. It is understood that the recognition will be given to the author of this
report and to the Department of Electronics and Computer Engineering, Pulchowk Campus,
Institute of Engineering in any use of the material of this project report. Copying or
publication or the other use of this report for financial gain without approval of to the
Department of Electronics and Computer Engineering, Pulchowk Campus, Institute of
Engineering and author’s written permission is prohibited. Request for permission to copy or
to make any other use of the material in this report in whole or in part should be addressed to:
Head Department of Electronics and Computer Engineering
Pulchowk Campus, Institute of Engineering
Lalitpur, Kathmandu
Nepal
II
PAGE OF APPROVAL
TRIBHUVAN UNIVERSITY
INSTITUTE OF ENGINEERING
PULCHOWK CAMPUS
DEPARTMENT OF ELECTRONICS AND COMPUTER ENGINEERING
The undersigned certify that they have read, and recommended to the Institute of Engineering
for acceptance, a project report entitled "Vehicle over speed detection and recognition
“submitted by Prashnna K. Gyawali, Robin Chatatut, Shailesh Acharya, Sizen Neupane in
partial fulfillment of the requirements for the Bachelor’s degree in Electronics &
Communication / Computer Engineering.
______________ __________________________________
Supervisor, Er.Anil Verma
Associate Professor
Electronics and Computer Engineering
DATE OF APPROVAL: 24 AUG 2014

III
ACKNOWLEDGEMENT
We would like to express our gratitude and appreciation to all those who gave us the
possibility to complete this report. We express our sincere thanks to the Dr. Diwakar Raj Pant,
Head of Department, Department of Electronics and Computer Engineering, and Dr. Nanda
Bikram Adhikari, Deputy Head of Department, Department of Electronics and Computer
Engineering for extending their support for our project idea.
We would also like to thank our supervisor Mr. Anil Verma for his guidance and supervision.
We are thankful to Mr. Bal Krishna Bal for his valuable suggestion on image processing and
character recognition. We would also thank our institution and our faculty members without
whom this project would not have been possible. We also extend our heartfelt thanks to our
friends, elder brothers and well-wishers.
I would also like to acknowledge with much appreciation the crucial role of the staff of
Electronics and Computer Engineering Department, who gave the permission to use all
required equipments and the necessary resources to complete the project.
Prashnna K.Gyawali (Roll No. 067/BEX/427)
Robin Chatatut (Roll No. 067/BEX/431)
Shailesh Acharya (Roll No. 067/BEX/437)
Sizen Neupane (Roll No. 067/BEX/438)

IV
ABSTRACT
Road accidents have been very common in the present world with the prime cause being the
careless driving. The necessity to check this has been very essential and different methods
have been used so far. However with the advancement in the technology, different governing
bodies are demanding some sort of computerized technology to control this problem of over
speed driving.
At this scenario, we are proposing a system to detect the vehicle which are being driven above
the given maximum speed limit that the respective roads or highway limits.
The overall project is divided in three categories; speed detection, image acquisition and
transfer and image processing. Speed detecting device works on the principle of Doppler
Effect using microwave Doppler radar sensor. The speed is compared with the preset threshold
and camera is triggered if the speed limit exceeds. Acquisition and transfer of image is done by
a HD camera interfaced with raspberry pi. Raspberry pi is connected to the server via internet.
The server runs an Image processing program which isolates the license plate from picture
frame. The characters in the number plate is digitized and sent to the authority residing in the
next station where the vehicle is heading.
Keywords: Doppler Radar, Doppler Effect, Image Processing, Acquisition and Transfer
V
TABLE OF CONTENTS
PAGE
`
COPYRIGHT ...................................................................................................................... I
PAGE OF APPROVAL ...................................................................................................... II
ACKNOWLEDGEMENT .................................................................................................. III
ABSTRACT ...................................................................................................................... IV
TABLE OF CONTENTS .................................................................................................... V
LIST OF FIGURES ........................................................................................................ VIII
LIST OF TABLES ............................................................................................................ IX
LIST OF ABBREVIATION ............................................................................................... X
1.INTRODUCTION ........................................................................................................... 1
1.1 National statistical trends in road accident .......................................................................... 2
1.2 Statement of problem ........................................................................................................... 3
1.3Objectives ............................................................................................................................. 4
1.4Scope .................................................................................................................................... 4
2.LITERATURE REVIEW ................................................................................................ 5
3.BACKGROUND THEORY .............................................................................................. 7
3.1HB100 sensor ........................................................................................................................ 7
3.1.1Why Hb100 sensor for speed detection? .................................................................................................. 8
3.1.2Operation .................................................................................................................................................. 8
3.1.2.1 Doppler Effect .................................................................................................................................. 8
3.1.2.2Frequency Variation .......................................................................................................................... 9
3.1.2.3 Radiation Pattern ............................................................................................................................ 11
3.1.3Output of the sensor ............................................................................................................................... 11
3.2Amplifier ............................................................................................................................ 12
3.2.1Features .................................................................................................................................................. 13
3.2.2Advantages ............................................................................................................................................. 14
3.2.3Operational Amplifier ............................................................................................................................ 14
3.2.3.1 Open loop ....................................................................................................................................... 15
3.2.3.2Closed loop ..................................................................................................................................... 16
3.2.4Non Inverting Configuration .................................................................................................................. 16
3.2.5Inverting Configuration and low pass filter ............................................................................................ 17
VI
3.3Arduino platform for atmega 328 ....................................................................................... 18
3.3.1Features .................................................................................................................................................. 19
3.3.2Atmega 328 ............................................................................................................................................ 20
3.4Raspberry pi ....................................................................................................................... 21
3.4.1Hardware ................................................................................................................................................ 23
3.4.1.1 RAM .............................................................................................................................................. 23
3.4.1.2 Networking .................................................................................................................................... 23
3.4.1.3 Peripherals...................................................................................................................................... 24
3.4.2Model B Features ................................................................................................................................... 24
3.4.3 Why raspberry pi? ............................................................................................................................. 25
3.4.4Setting up Raspberry pi .......................................................................................................................... 25
3.4.5Python Programs with IDLE in raspberry pi .......................................................................................... 27
3.4.6Raspberry pi Camera .............................................................................................................................. 27
3.4.6.1 Installing camera module ............................................................................................................... 29
3.5LCD .................................................................................................................................... 30
3.6Number plate recognition ................................................................................................... 33
3.6.1 Nepali Vehicle License Plate ................................................................................................................. 33
3.6.2Image Processing and Recognition......................................................................................................... 38
3.6.2.1Image Acquisition ........................................................................................................................... 38
3.6.2.2Preprocessing .................................................................................................................................. 39
3.6.2.3 Localization of the numbers ........................................................................................................... 39
3.6.2.4Connected Component algorithm ................................................................................................... 41
3.6.2.5Segmentation ................................................................................................................................... 41
3.6.2.6Character Recognition ..................................................................................................................... 43
4.SOFTWARE AND TOOLS USED ....................................................................................... 45
4.1Tools used for circuit design ............................................................................................... 45
4.1.1KiCAD ................................................................................................................................................... 45
4.1.2PCB Wizard ............................................................................................................................................ 45
4.2Tools Used for Simulation................................................................................................... 46
4.2.1Proteus VSM .......................................................................................................................................... 46
4.3Software used ..................................................................................................................... 46
4.3.1PuTTY .................................................................................................................................................... 46
4.3.2Real VNC ............................................................................................................................................... 47
4.3.3Arduino IDE ........................................................................................................................................... 47
4.3.4Python (programming language) ............................................................................................................ 47
4.3.5MATLAB ............................................................................................................................................... 48
5.METHODOLOGY ........................................................................................................ 49
5.1System Block diagram ........................................................................................................ 49
5.1.1Diagram Description .............................................................................................................................. 49

VII
5.2Flow chart .......................................................................................................................... 51
5.3Speed Detection .................................................................................................................. 52
5.4Amplification of signal ........................................................................................................ 53
5.4.1Non-Inverting stage ................................................................................................................................ 54
5.4.2Inverting stage ........................................................................................................................................ 55
5.5Measurement of frequency ................................................................................................. 56
5.5.1Algorithm for measuring frequency ....................................................................................................... 56
5.6Display ................................................................................................................................ 57
5.7Socket programming in python: ......................................................................................... 58
5.8Number Plate recognition ................................................................................................... 59
5.8.1Number plate extraction ......................................................................................................................... 59
6.EXPERIMENTAL RESULTS ....................................................................................... 64
6.1Accuracy in frequency measurement .................................................................................... 64
6.2Calculation of speed ............................................................................................................ 65
6.3Accuracy in speed measurement ............................................................................................................... 65
6.4Connected component analysis ................................................................................................................. 67
6.COST ESTIMATION .................................................................................................... 70
8.PROBLEM FACED ...................................................................................................... 71
8.1Sensor ................................................................................................................................. 71
8.2Camera ............................................................................................................................... 71
8.3Number Plate recognition ................................................................................................... 72
8.LIMITATION AND FUTURE ENHANCEMENT ......................................................... 74
10.CONCLUSION ........................................................................................................... 75
11.REFERENCES ........................................................................................................... 76
12.APPENDIX ................................................................................................................. 79
Appendix A .............................................................................................................................. 79
Appendix B ............................................................................................................................. 81
Appendix C ............................................................................................................................. 82

VIII
LIST OF FIGURES
FIGURE 1.1 VEHICLE OVER SPEED DETECTION AND RECOGNITION ...................................................... 1
FIGURE 3.1 HB100 SENSOR ................................................................................................................................. 7
FIGURE 3.2 BLOCK DIAGRAM AND CONNECTION ..................................................................................... 10
FIGURE 3.3 RADIATION PATTERN OF SENSOR ............................................................................................ 11
FIGURE 3.4 LM324 BLOCK DIAGRAM ............................................................................................................. 13
FIGURE 3.5 OP-AMP REPRESENTATION......................................................................................................... 15
FIGURE 3.6 INVERTING OP-AMP...................................................................................................................... 16
FIGURE 3.7 INVERTING AMPLIFIER WITH LOW PASS FILTER ................................................................. 17
FIGURE 3.8 ARDUINO UNO ............................................................................................................................... 19
FIGURE 3.9 ATMEGA 328 PIN DIAGRAM ........................................................................................................ 21
FIGURE 3.10 RASPBERRY PI ............................................................................................................................. 22
FIGURE 3.11 FEDORA ARM IMAGE INSTALLER ........................................................................................... 26
FIGURE 3.12 VNC VIEWER LOGIN ................................................................................................................... 27
FIGURE 3.13 RASPBERRY PI CAMERA ........................................................................................................... 28
FIGURE 3.14 RASPBERRY PI WITH CAMERA MODULE FITTED ............................................................... 30
FIGURE 3.15 LCD JHD162A ................................................................................................................................ 31
FIGURE 3.16 VEHICLE IDENTIFIER ................................................................................................................. 36
FIGURE 3.16(A) VEHICLE IDENTIFIER ............................................................................................................ 37
FIGURE 3.16(B) VEHICLE IDENTIFIER ............................................................................................................ 37
FIGURE 3.17 IMAGE PROCESSING AND RECOGNITION ............................................................................ 38
FIGURE 3.18 SEGMENTATION ......................................................................................................................... 42
FIGURE 5.1 BLOCK DIAGRAM OF THE SYSTEM ......................................................................................... 50
FIGURE 5.2 SYSTEM FLOW DIAGRAM ........................................................................................................... 51
FIGURE 5.3 SIMPLIFIED DIAGRAM SPEED DETECTION ............................................................................. 52
FIGURE 5.4 AMPLIFIER DESIGN ....................................................................................................................... 54
FIGURE 5.5 NUMBER PLATE EXTRACTION .................................................................................................. 60
FIGURE 5.5(A) NUMBER PLATE EXTRACTION ............................................................................................. 61
FIGURE 5.5(B) NUMBER PLATE EXTRACTION ............................................................................................. 62
FIGURE 5.5(C) NUMBER PLATE EXTRACTION ............................................................................................. 63
FIGURE 6.1 REGION EXTRACTION .................................................................................................................. 68
FIGURE 6.2 ANALYSIS THROUGH HISTOGRAM .......................................................................................... 69
FIGURE 8.1 REAL TIME IMAGE ........................................................................................................................ 73
FIGURE 12.1 AMPLIFIER SCHEMATIC ............................................................................................................ 79
FIGURE : 12.2 LCD INTERFACE SCHEMATIC ................................................................................................ 80
FIGURE 12.3 ARDUINO SHIELD SCHEMATIC ................................................................................................ 80
FIGURE 12.4 LCD INTERFACE CIRCUIT PCB DESIGN ................................................................................. 81
FIGURE 12.5 AMPLIFIER PCB DESIGN ............................................................................................................ 81
FIGURE 12.6 AMPLIFIER .................................................................................................................................... 82
FIGURE 12.7 LCD INTERFACE .......................................................................................................................... 82
IX
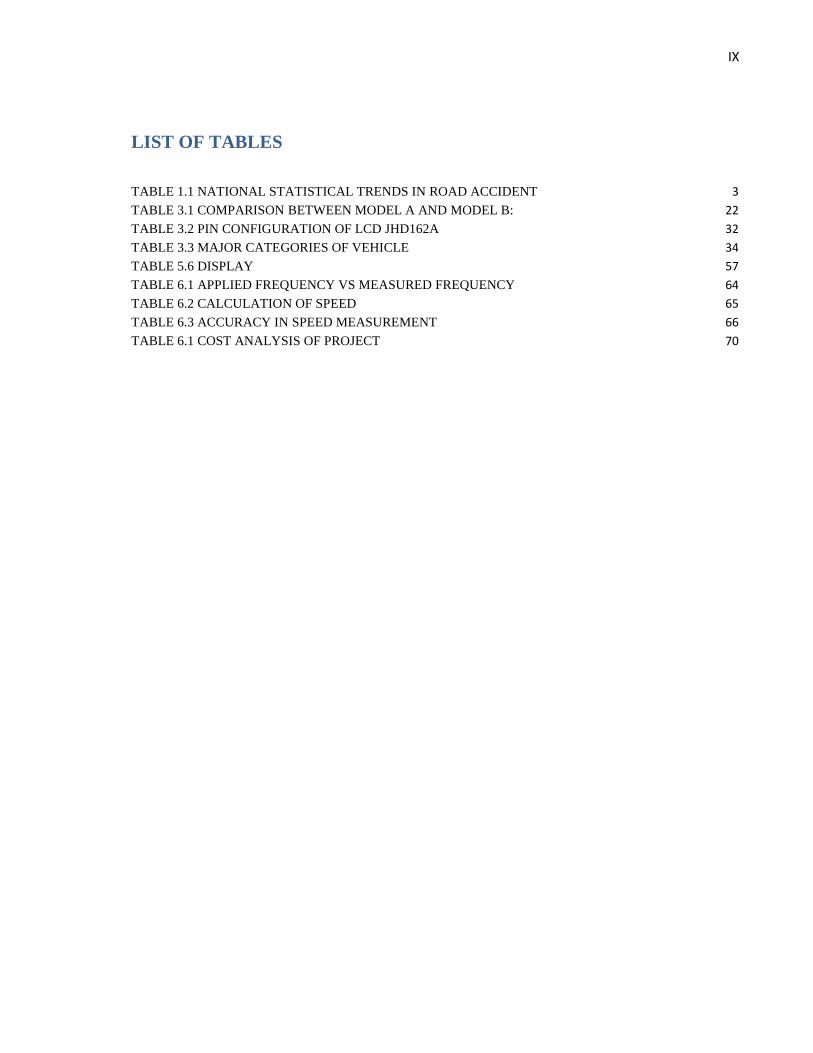
LIST OF TABLES
TABLE 1.1 NATIONAL STATISTICAL TRENDS IN ROAD ACCIDENT 3
TABLE 3.1 COMPARISON BETWEEN MODEL A AND MODEL B: 22
TABLE 3.2 PIN CONFIGURATION OF LCD JHD162A 32
TABLE 3.3 MAJOR CATEGORIES OF VEHICLE 34
TABLE 5.6 DISPLAY 57
TABLE 6.1 APPLIED FREQUENCY VS MEASURED FREQUENCY 64
TABLE 6.2 CALCULATION OF SPEED 65
TABLE 6.3 ACCURACY IN SPEED MEASUREMENT 66
TABLE 6.1 COST ANALYSIS OF PROJECT 70

X
LIST OF ABBREVIATION
ANPR Automatic Number Plate Recognition
ARM Acron RISC Machine
AVR Advanced Virtual RISC
CPU Central Processing Unit
CRS Computer Recognition System
DRO Dielectric Resonant Oscillation
EEPROM Electrically Erasable Programmable Read-Only Memory
EGAD Electronic Ground Automatic Destruct
GFLOPS Giga Floating Point operation per Second
GND Ground
GPIO General Purpose Input/Output
GPU Graphics Processing Unit
HD High Definition
HDML Handheld Device Markup Language
HPBW Half Power Beam Width
IC Integrated Circuit
IDE/IDLE Integrated Development Program
IOE Institute of Engineering
LCD Liquid Crystal Display

XI
LAN Local Area Network
LED Light Emitting Diode
LPR License Plate Recognition
MIPI Mobile Industry Processor Interface
MMC Multi Media Card
NPN Negative-Positive-Negative
PAL Phase Alternating Line
PCB Printed Circuit Board
PNP Positive-Negative-Positive
PIC Peripheral Interface Controller
RAM Random Access Memory
RISC Reduced Instruction Set Computer
RS Resistor Select
SCP Service Control Point
SD Secure Digital
SDIO Secure Digital Input/output
SPI Serial Peripheral Interface
SPICE Simulation Program with Integrated Circuit Emphasis
SRAM Static Random Access Memory
SSH Secure Shell
TTL Transistor - Transistor Logic
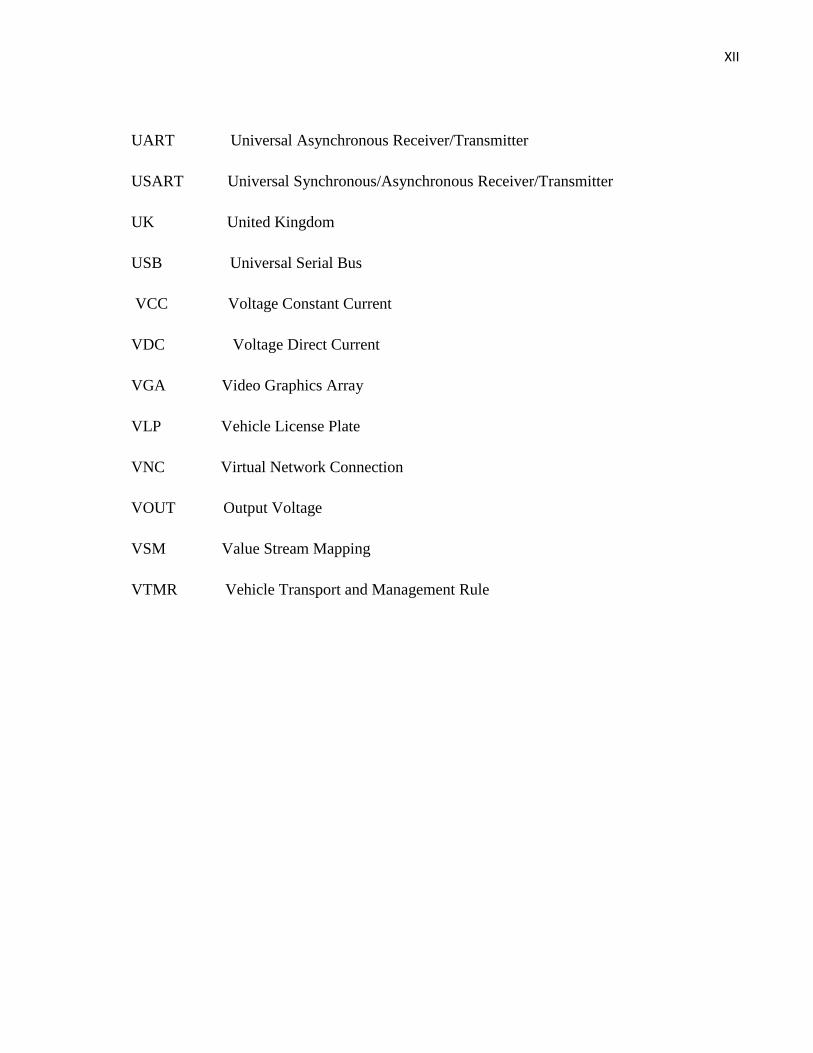
XII
UART Universal Asynchronous Receiver/Transmitter
USART Universal Synchronous/Asynchronous Receiver/Transmitter
UK United Kingdom
USB Universal Serial Bus
VCC Voltage Constant Current
VDC Voltage Direct Current
VGA Video Graphics Array
VLP Vehicle License Plate
VNC Virtual Network Connection
VOUT Output Voltage
VSM Value Stream Mapping
VTMR Vehicle Transport and Management Rule

1
1
1.INTRODUCTION
Over speeding vehicles are major issues for road safety and needs proper addressing to
minimize the accidents. Excessive Speed is a factor in one third of all fatal crashes.
Vehicle speed detection is based on the use of Dopplar Radar to find the speed of the moving
vehicles. Dopplar effect can be exploited to measure the speed of vehicles and identify those
crossing speed limit. The shift in frequency between the transmitted and reflected high
frequency wave is the key factor used to calculate speed. The dopplar radar based speed
detector can be interfaced to a microprocessor based system for measurement and comparison.
HD camera attached to the system can be used to provide a real time view of the road. The
system can be connected to the server via internet and the images from the road can be
transmitted to the server for processing.
Figure 1.1 Vehicle over speed detection and recognition
2
2
Automatic number plate recognition is an image processing technology that uses number plate
to identify the vehicle. The objective is to isolate the number plate of the vehicle from the
image and use optical character recognition to identify the characters of the number plate.
Moreover, the digitize number plate will be transmitted to the next station where it will be
displayed in LCD panel.
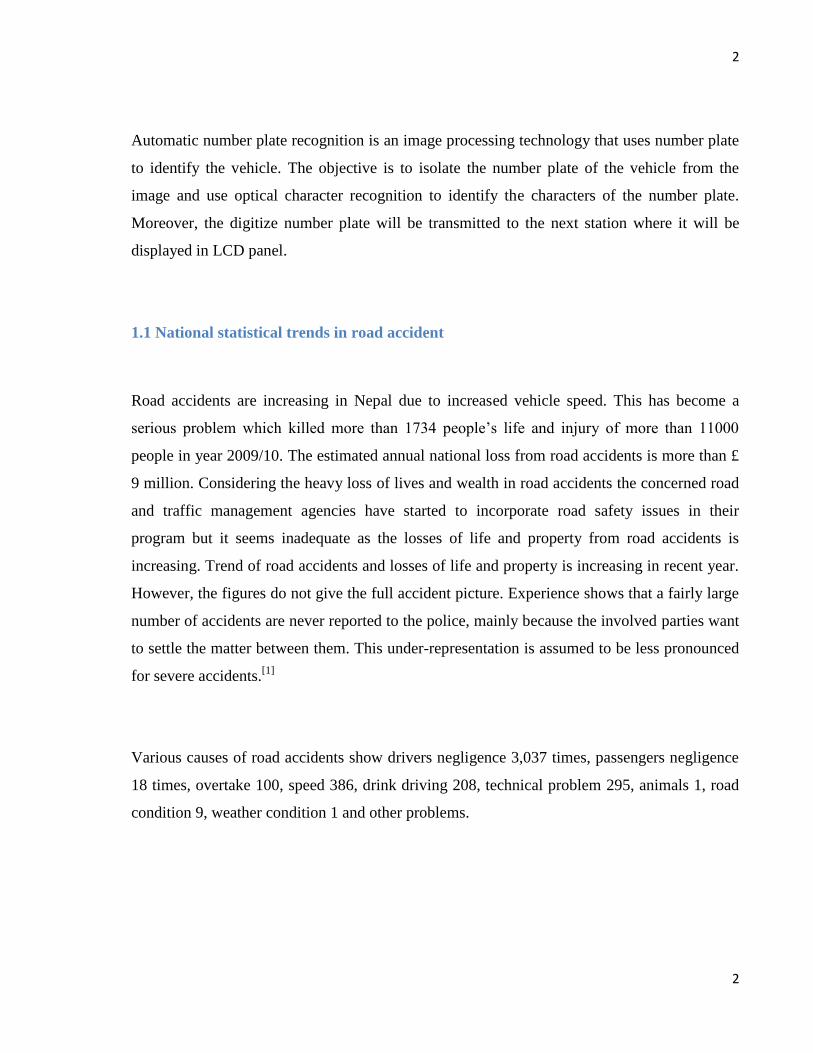
1.1 National statistical trends in road accident
Road accidents are increasing in Nepal due to increased vehicle speed. This has become a
serious problem which killed more than 1734 people’s life and injury of more than 11000
people in year 2009/10. The estimated annual national loss from road accidents is more than £
9 million. Considering the heavy loss of lives and wealth in road accidents the concerned road
and traffic management agencies have started to incorporate road safety issues in their
program but it seems inadequate as the losses of life and property from road accidents is
increasing. Trend of road accidents and losses of life and property is increasing in recent year.
However, the figures do not give the full accident picture. Experience shows that a fairly large
number of accidents are never reported to the police, mainly because the involved parties want
to settle the matter between them. This under-representation is assumed to be less pronounced
for severe accidents.[1]
Various causes of road accidents show drivers negligence 3,037 times, passengers negligence
18 times, overtake 100, speed 386, drink driving 208, technical problem 295, animals 1, road
condition 9, weather condition 1 and other problems.

3
3
Table 1.1 National statistical trends in road accident[1]
1.2 Statement of problem
Number of ways are being implemented to check and identify the over speeding vehicle. But
no automatic system has been developed so far that can perform the task of speed detection
and vehicle identification without human assistance. The major issues seen at the present
context are :
Road accidents are increasing day by day with prime cause being the over speeding
of the vehicle.
The use of human resources to check this issue can be very tedious and time
consuming and sometimes become irrelevant.
Commercially available automatic LPR systems are very costly and difficult to
implement for the Nepali license number plate due to its character being in
Devanagari script (mostly).

4
4
1.3Objectives
The objective of our project is to address the issues discussed above. The objectives are as
follows:
To design an automatic and versatile system that addresses the issues of over speeding
without use of human resources.
To detect the speed of the over speeding vehicle and digitize number plate using image
processing.
To establish the networking between different systems to exchange the information
among them.
1.4Scope
1. Road safety: The timely checking of the over speeding vehicle will reduce high
percentage of road accidents.
2. Automation in law enforcement: The system being completely automatic, reduces the
number of traffic police officers needed to deploy in the real field for checking speeding
vehicles.
With very few enhancements in the proposed system new features can be easily
incorporated such as:
Vehicle security: The lost out cases of the vehicle are increasing day by day, the stolen
vehicle can be easily detected by comparing with the registered entry of stolen
vehicles.
Parking: The vehicles can be easily registered using automatic system with this
system in the parking lounge or similar purpose complexes.
Visitor management: This system can be effectively used to assist visitor
management systems in recognizing guest vehicles.
5
5
2.LITERATURE REVIEW
Many projects addressing similar problems have been done in international level. One such
approach has been discussed in the research paper by Leo Cetinski and David Dawson. [13]
Use
of speed gun for speed detection and LPR software for vehicle recognition has been explained
in the paper.
A number of different approaches have been used by many researchers to detect speed of
moving vehicle. One of the most popular ways of speed detection is based on LASER
crossing. Two LASER lights placed on the path of a moving vehicle can be used to determine
the speed by measuring the time difference between the crossings.
However this approach is now less frequently used for speed detection after the advent of
Doppler radar guns. Speed detection using Doppler sensor is based on the principle of Doppler
Effect. [17, 30]
Commercially available speed guns are based on this approach of speed detection
and provide high degree of accuracy.
The history of automatic vehicle number detection dates back to mid 1970s. In 1976, the
Police Scientific Development Branch in the UK first invented this system. Systems were
working by 1979, and contracts were let to produce industrial systems, first at EMI
Electronics, and then at Computer Recognition Systems (CRS) in Wokingham, UK. Early trial
systems were deployed on the A1 road and at the Dartford Tunnel. However it did not become
widely used until new developments in cheaper and easier to use software was pioneered
during the 1990s.
The issue of Number Plate Detection is still not solved completely because the accuracy in
Number Plate digitization achieved so far is not satisfiable. Different approaches for LPR have
been developed but the research still continues for the best result. Initial approaches were
based on boundary line properties. Gradient filters were used to enrich boundary lines.
Algorithm such as Hough transform was then used to detect boundary lines.two sets of lines
parallel to each other were then considered as boundary of the plate. [29]

6
6
Another approach focused on some properties of plate images such as their position,
dimension ratio, brightness, symmetry, angles, etc.[28]
Morphological processings were done to
detect similar properties in the image so as to locate the position of number plate. Another
approach was by using statistical properties of the characters in the plate. This approach is
based on finding the regions for Number Plate character based on the the variance of gray
level, number of edges, edge densities in the region.[28]
This method is very accurate if the
number of characters on the plate is fixed.. The research and upgrading of these algorithms
continue with many researchers working on the project over a long time.
In the case of our country, very few works have been done in this field in the past. One such
project on Digitization of Nepali Number Plate was done by the students of IOE, Pulchowk
campus.[9]
The paper[9]
explains the use of neural network in digitization of characters of
Nepali Number Plate and the accuracy achieved in Digitization of each character
Similar uses have been implemented in many more developed countries so far with the success
rate being low. However, in the underdeveloped countries like Nepal; the overall system that
we are proposing is not even in the discussion.

7
7
3.BACKGROUND THEORY
3.1HB100 sensor
HB100 Miniature Microwave Sensor is a X-Band Bi-Static Doppler transceiver module. Its
built-in Dielectric Resonator Oscillator (DRO) and a pair of Microstrip patch antenna array,
make it ideal for use in motion and speed detection. [2]
Figure 3.1 HB100 Sensor[2]
Features:
•Low current consumption
•Simplicity in interfacing
• Continuous Wave or Pulse operation
• Detection range of 10m
•Application in motion detection and speed measurement

8
8
3.1.1Why Hb100 sensor for speed detection?
Modern speed detectors like speed gun use radar sensor built in to their circuit. It is difficult to
hack one of them to use the sensor part for our purpose. As a separate unit, very few sensors
are available in market that works on the principle of Doppler effect for speed detection.
HB100 is one such sensor which meets most of our requirement and is a low cost device.
There are other sensors like Xb100 with range of upto 100m but are expensive for use in this
project.
3.1.2Operation
The sensor woks on the principle of Doppler Effect.
3.1.2.1 Doppler Effect
Doppler Effect was proposed by Australian physicist Christian Doppler in 1842. Doppler
effect is the difference between the observed frequency and emitted frequency of a wave for an
observer moving relative to the source of waves. The most commonly seen example of
Doppler effect is the change in frequency of the sound heard when a vehicle with siren is
approaching and passes by. This variation in frequency depends on the relative direction and
velocity of wave between the source and the observer. It is maximum when the source is
moving directly toward or away from the observer and diminishes with increasing angle
between the direction of motion and the direction of the waves, until when the source is
moving at right angles to the observer, there is no shift.
When a stationary source projects wave of certain frequency towards a moving object the
frequency of the reflected wave changes. The reflected wave has a frequency slightly higher if
the object is moving towards the source and it is slightly lower if the object is moving away
relative to the source. The shift in frequency between the emitted wave and the reflected wave

9
9
is the factor that determines the speed of the object. This phenomenon is exploited in Doppler
radar sensors to measure the speed of vehicles or any other object.
3.1.2.2Frequency Variation
If c be the velocity of light v the target velocity then the shifted frequency ( ) can be
expressed as a function of the original frequency ( )[3]
:
Assuming the direction of the source and the direction of motion of the target is perfectly
aligned, Change in the frequency between the transmitted and reflected wave, (Doppler
frequency) ( ), is thus:
Since for most practical applications of radar, , so . We can then write:
If the direction of the moving object makes a certain angle with the source direction, Doppler
frequency is reduced by a value equal to the cosine of the angle between source and target’s
direction.

10
10
Figure 3.2 Block diagram and connection[2]
The sensor circuit consists of a Dielectric Resonator Oscillator, microwave Mixer and patch
antenna. The transmit frequency and power of the module is set by factory. There is no user
adjustable part in this device. The module is a low power radio device (LPRD) or intended
radiator. The Oscillator produces a sinusoidal wave of frequency 10.525 Ghz. The patch
antenna connected to the oscillator radiate the wave towards the target. The reflected wave is
received by another set of patch antenna built in the circuit. The microwave mixer mixes these
two signals to generate a sinusoidal wave with frequency equal to the difference between the
two.
11
11
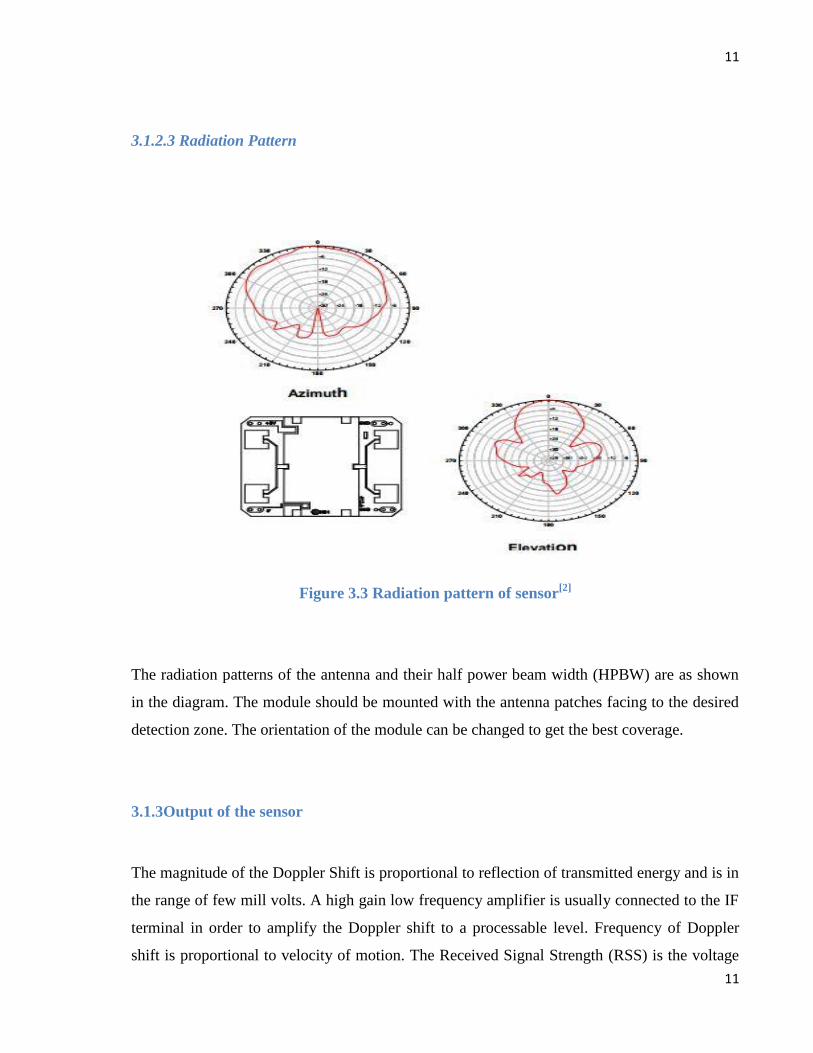
3.1.2.3 Radiation Pattern
Figure 3.3 Radiation pattern of sensor[2]
The radiation patterns of the antenna and their half power beam width (HPBW) are as shown
in the diagram. The module should be mounted with the antenna patches facing to the desired
detection zone. The orientation of the module can be changed to get the best coverage.
3.1.3Output of the sensor
The magnitude of the Doppler Shift is proportional to reflection of transmitted energy and is in
the range of few mill volts. A high gain low frequency amplifier is usually connected to the IF
terminal in order to amplify the Doppler shift to a processable level. Frequency of Doppler
shift is proportional to velocity of motion. The Received Signal Strength (RSS) is the voltage
12
12
measured of the Doppler shift at the IF output. It can be used to predict the distance between
the source and the target. Target closer to the source produce a hifh level of RSS. But the exact
value may vary greatly depending on the type of the surface and reflection coefficient of the
target.
Noises are of major concern when designing an amplifier. Noise may be the result of the
internal circuitry of the sensor and amplifier or due to fluctuation in the power supply. High
frequency noise from power supply may affect the output significantly.
3.2Amplifier
Wide ranges of amplifiers are available for use in the circuit and the one that best fits the
system requirement needs to be used. . The amplifier IC used for this purpose is the LM324
Quad op amp. This IC has four operational amplifiers.
The LM324-N series consists of four independent, high gain, internally frequency
compensated operational amplifiers which were designed specifically to operate from a single
power supply over a wide range of voltages. Operation from split power supplies is also
possible and the low power supply current drain is independent of the magnitude of the power
supply voltage.
Large differential input voltages can be easily accommodated and, as input differential voltage
protection diodes are not needed, no large input currents result from large differential input
voltages. The differential input voltage may be larger than V+ without damaging the device.
Protection should be provided to prevent the input voltages from going negative more than
−0.3 VDC (at 25°C). An input clamp diode with a resistor to the IC input terminal can be used.
To reduce the power supply drain, the amplifiers have a class A output stage for small signal
levels which converts to class B in a large signal mode. This allows the amplifiers to both
source and sink large output currents. Therefore both NPN and PNP external current boost
transistors can be used to extend the power capability of the basic amplifiers. The output

13
13
voltage needs to raise approximately 1 diode drop above ground to bias the on-chip vertical
PNP transistor for output current sinking applications. For ac applications, where the load is
capacitively coupled to the output of the amplifier, a resistor should be used, from the output
of the amplifier to ground to increase the class A bias current and prevent crossover distortion.
Figure 3.4 LM324 block diagram[4]
3.2.1Features
•Internally frequency compensated for unity gain
• Large DC Voltage Gain 100 dB
• Wide Bandwidth (Unity Gain) 1 MHz (Temperature Compensated)
• Low Input Biasing Current 45 nA (Temperature compensated)
• Wide Power Supply Range:
o Single Supply 3V to 32V
o Dual Supplies ±1.5V to ±16V
• Very Low Supply Current Drain (700 μA) (Essentially Independent of Supply voltage)
• Low Input Offset Voltage 2 mV and Offset Current: 5 nA

14
14
• Input Common-Mode Voltage Range Includes ground
• Differential Input Voltage Range Equal to the power supply voltages
• Large Output Voltage Swing 0V to V+ − 1.5V
3.2.2Advantages
• Eliminates Need for Dual Supplies
• Four Internally Compensated Op Amps in a Single Package
• Allows Directly Sensing Near GND and VOUT
(Temperature Compensated) also Goes to GND
• Compatible with All Forms of Logic
• Power Drain Suitable for Battery Operation
3.2.3Operational Amplifier
An operational amplifier (op-amp) is a high-gain electronic voltage amplifier with a
differential input and, usually, a single-ended output. In this configuration, an op-amp
produces an output potential (relative to circuit ground) that is typically hundreds of thousands
of times larger than the potential difference between its input terminals. The op-amp is one
type of differential amplifier. Other types of differential amplifier are made by using one or
more op-amps.
15
15
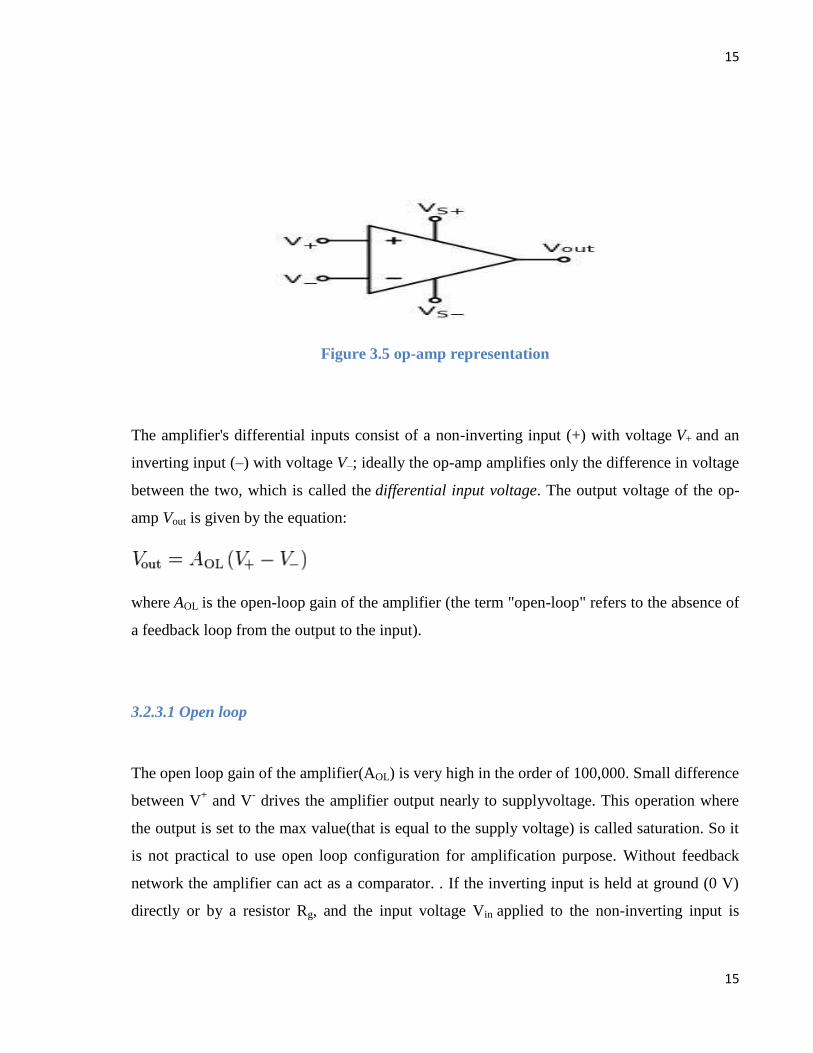
Figure 3.5 op-amp representation
The amplifier's differential inputs consist of a non-inverting input (+) with voltage V+ and an
inverting input (–) with voltage V−; ideally the op-amp amplifies only the difference in voltage
between the two, which is called the differential input voltage. The output voltage of the op-
amp Vout is given by the equation:
where AOL is the open-loop gain of the amplifier (the term "open-loop" refers to the absence of
a feedback loop from the output to the input).
3.2.3.1 Open loop
The open loop gain of the amplifier(AOL) is very high in the order of 100,000. Small difference
between V+ and V
- drives the amplifier output nearly to supplyvoltage. This operation where
the output is set to the max value(that is equal to the supply voltage) is called saturation. So it
is not practical to use open loop configuration for amplification purpose. Without feedback
network the amplifier can act as a comparator. . If the inverting input is held at ground (0 V)
directly or by a resistor Rg, and the input voltage Vin applied to the non-inverting input is
16
16
positive, the output will be maximum positive; if Vin is negative, the output will be maximum
negative.The circuit's gain is just the AOL of the op-amp.
3.2.3.2Closed loop
For practical purposes feedback loops are used to control the performance of the amplifier.
Generally negative feedback is used, by applying a portion of the output voltage to the
inverting input. This controls the overall gain and response of the circuit which is determined
mostly by the feedback network, rather than by the op-amp characteristics. If the feedback
network is made of components with values small relative to the op amp's input impedance,
the value of the op-amp's open loop response AOL does not seriously affect the circuit's
performance. Transfer functions are used to characterize the response of the op-amp with its
input output and feedback circuit.
Generally op-amps are used in one of the two configurations inverting configurarion and Non
inverting configuration.
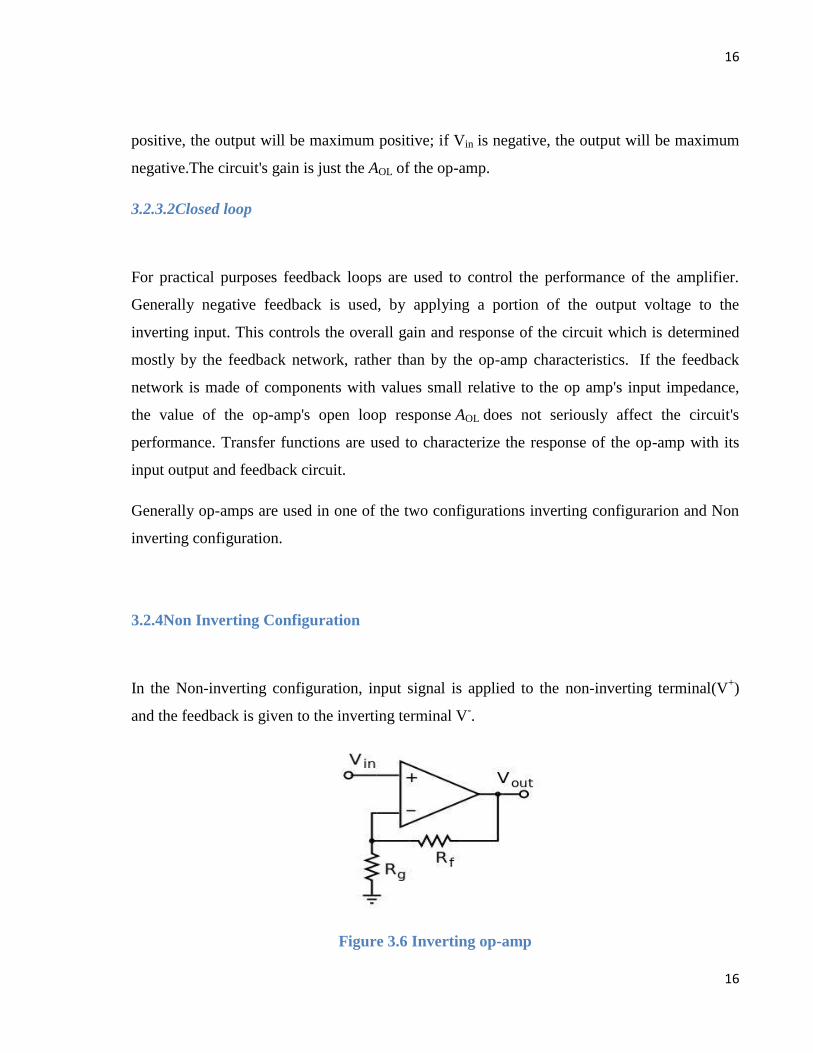
3.2.4Non Inverting Configuration
In the Non-inverting configuration, input signal is applied to the non-inverting terminal(V+)
and the feedback is given to the inverting terminal V-.
Figure 3.6 Inverting op-amp
17
17
The presence of negative feedback via the voltage divider Rf, Rg determines the closed-loop
gainACL = Vout / Vin. The voltage gain of this configuration is given as 1 + Rf/Rg. There is no
reversal of phase between the input and the output.
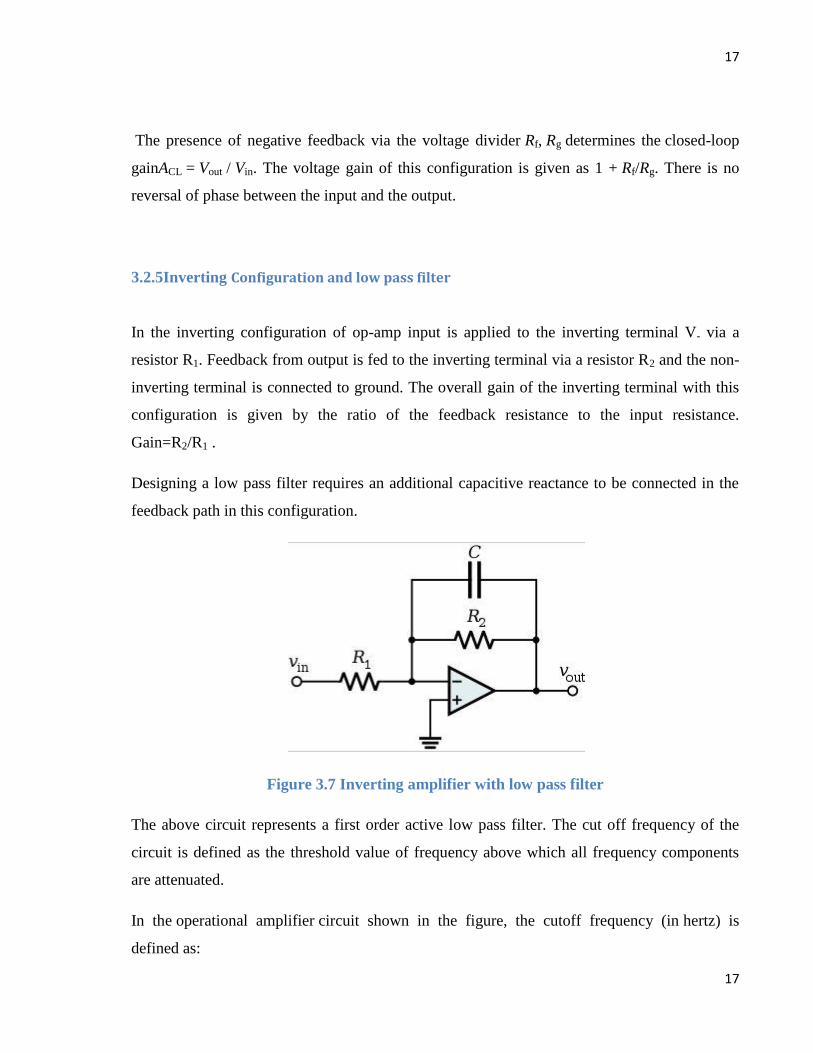
3.2.5Inverting Configuration and low pass filter
In the inverting configuration of op-amp input is applied to the inverting terminal V- via a
resistor R1. Feedback from output is fed to the inverting terminal via a resistor R2 and the non-
inverting terminal is connected to ground. The overall gain of the inverting terminal with this
configuration is given by the ratio of the feedback resistance to the input resistance.
Gain=R2/R1 .
Designing a low pass filter requires an additional capacitive reactance to be connected in the
feedback path in this configuration.
Figure 3.7 Inverting amplifier with low pass filter
The above circuit represents a first order active low pass filter. The cut off frequency of the
circuit is defined as the threshold value of frequency above which all frequency components
are attenuated.
In the operational amplifier circuit shown in the figure, the cutoff frequency (in hertz) is
defined as:

18
18
or equivalently (in radians per second):
The gain in the passband is −R2/R1 and all frequency above fc value is attenuated.
The gain of the op-amp can be increased to sufficiently high value so that it operates in the
saturation region. The output at such case is a near digital pulse than can be fed into the digital
I/O pin of any TTL device.
The frequency of the output signal from the amplifier can be measured using the digital pin of
microcontroller. Microcontroller can be used to measure frequency, calculate the speed and
make necessary comparisons. The output is displayed on the display device interfaced with the
microcontroller.
3.3Arduino platform for atmega 328
Arduino is a single-board microcontroller, intended to make the application of interactive
objects or environments more accessible. The hardware consists of an open-source
hardware board designed around an 8-bit Atmel AVR microcontroller, or a 32-bit Atmel
ARM. Current models feature a USB interface, 6 analog input pins, as well as 14 digital I/O
pins which allow the user to attach various extension boards. It comes with a
simple integrated development environment (IDE) that runs on regular personal computers and
allows users to write programs for Arduino using C or C++.
19
19
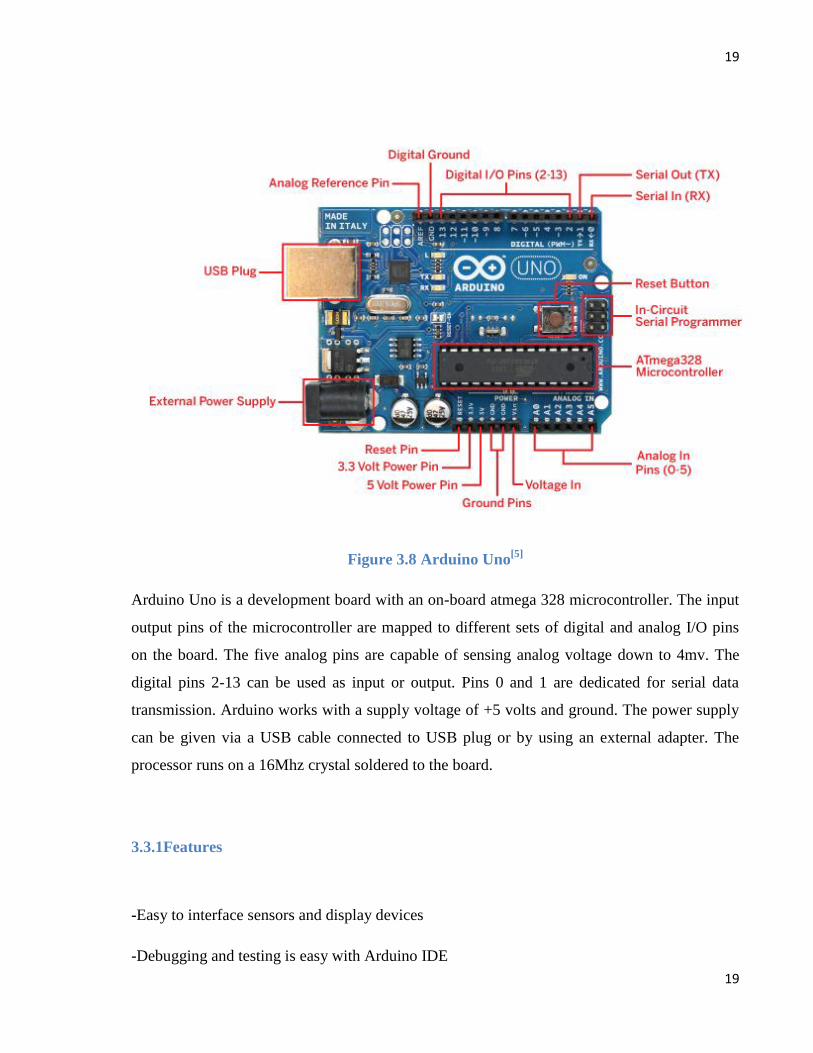
Figure 3.8 Arduino Uno[5]
Arduino Uno is a development board with an on-board atmega 328 microcontroller. The input
output pins of the microcontroller are mapped to different sets of digital and analog I/O pins
on the board. The five analog pins are capable of sensing analog voltage down to 4mv. The
digital pins 2-13 can be used as input or output. Pins 0 and 1 are dedicated for serial data
transmission. Arduino works with a supply voltage of +5 volts and ground. The power supply
can be given via a USB cable connected to USB plug or by using an external adapter. The
processor runs on a 16Mhz crystal soldered to the board.
3.3.1Features
-Easy to interface sensors and display devices
-Debugging and testing is easy with Arduino IDE

20
20
- Easy to program in the target circuit using USB cable
-Open source project
-Wide range of libraries available in the repository for interfacing commonly used peripherals
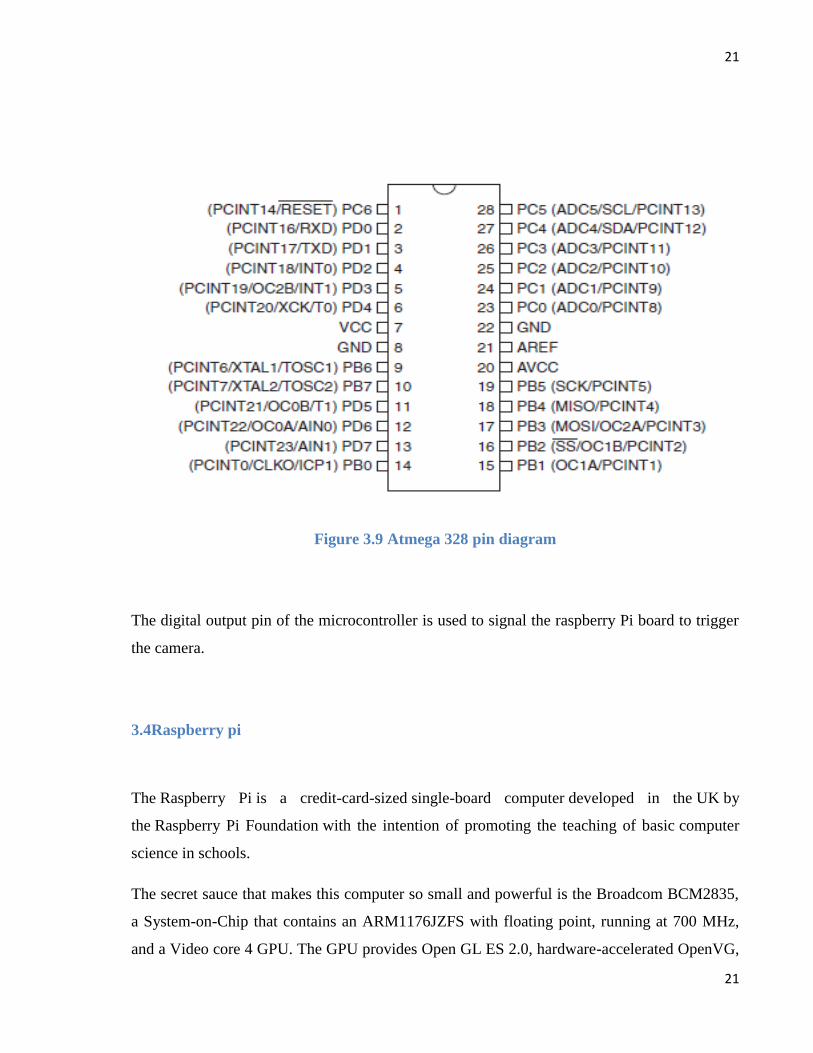
3.3.2Atmega 328
Atmega 328 is the microcontroller unit attached to the board and performs all the processing.
The high-performance Atmel 8-bit AVR RISC-based microcontroller combines 32KB ISP
flash memory with read-while-write capabilities, 1KB EEPROM, 2KB SRAM, 23 general
purpose I/O lines, 32 general purpose working registers, three flexible timer/counters with
compare modes, internal and external interrupts,serial programmable USART, a byte-oriented
2-wire serial interface, SPI serial port, 6-channel 10-bit A/D converter. programmable
watchdog timer with internal oscillator, and five software selectable power saving modes. The
device operates between 1.8-5.5 volts.
21
21
Figure 3.9 Atmega 328 pin diagram
The digital output pin of the microcontroller is used to signal the raspberry Pi board to trigger
the camera.
3.4Raspberry pi
The Raspberry Pi is a credit-card-sized single-board computer developed in the UK by
the Raspberry Pi Foundation with the intention of promoting the teaching of basic computer
science in schools.
The secret sauce that makes this computer so small and powerful is the Broadcom BCM2835,
a System-on-Chip that contains an ARM1176JZFS with floating point, running at 700 MHz,
and a Video core 4 GPU. The GPU provides Open GL ES 2.0, hardware-accelerated OpenVG,
22
22
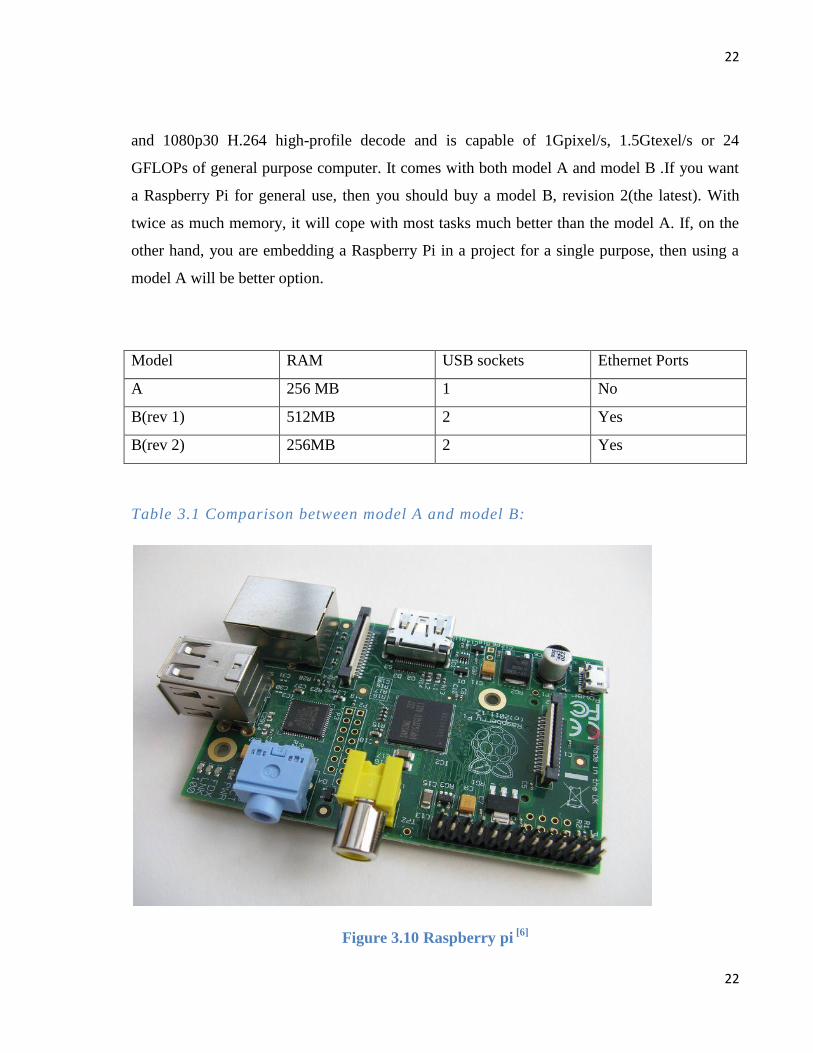
and 1080p30 H.264 high-profile decode and is capable of 1Gpixel/s, 1.5Gtexel/s or 24
GFLOPs of general purpose computer. It comes with both model A and model B .If you want
a Raspberry Pi for general use, then you should buy a model B, revision 2(the latest). With
twice as much memory, it will cope with most tasks much better than the model A. If, on the
other hand, you are embedding a Raspberry Pi in a project for a single purpose, then using a
model A will be better option.
Model RAM USB sockets Ethernet Ports
A 256 MB 1 No
B(rev 1) 512MB 2 Yes
B(rev 2) 256MB 2 Yes
Table 3.1 Comparison between model A and model B:
Figure 3.10 Raspberry pi [6]
23
23
3.4.1Hardware
It does not come with a real time clock so the operating system must use network time.
3.4.1.1 RAM
On the older boards 128 MB RAM was allocated by default leaving 128 MB for CPU. Later
256 MB RAM raspberry pi was released which was sufficient for 1080p decoding, or for
simple 3D. 224 MB was for Linux only, with just a 1080p frame buffer, and was likely to fail
for any video or 3D. 128 MB was for heavy 3D, possibly also with video decoding .For the
new model B with 512 MB RAM initially there were new standard memory split files
released( arm256_start.elf, arm384_start.elf, arm496_start.elf) for 256 MB, 384 MB and
496 MB CPU RAM (and 256 MB, 128 MB and 16 MB video RAM).
Processor:
Broadcom SoC is used is raspberry pi. It operated at 700Mhz default which is equal to 0,041
GFLOPS. On a computer level it is similar to 700 MHz Pentium II computer. It does not
require heat sink or some sort of cooling.
3.4.1.2 Networking
The Model A does not have an RJ45 Ethernet port, it can connect to a network by using an
external user-supplied USB Ethernet or Wi-Fi adapter. On the model B the Ethernet port is
provided by a built-in USB Ethernet adapter.

24
24
3.4.1.3 Peripherals
Generic USB keyboards and mice are compatible with the Raspberry Pi.
3.4.2Model B Features
Dimensions: 85.60mm x 56mm x 21mm
Broadcom BCM2835 SoC
700 MHz ARM1176JZF-S core CPU
Broadcom VideoCore IV GPU
512 MB RAM
2 x USB2.0 Ports
Video Out via Composite (PAL and NTSC), HDMI or Raw LCD (DSI)
Audio Out via 3.5mm Jack or Audio over HDMI
Storage: SD/MMC/SDIO
10/100 Ethernet (RJ45)
Low-Level Peripherals:
o 8 x GPIO
o UART
o I2C bus
o SPI bus with two chip selects
o +3.3V
o +5VGround
Power Requirements: 5V @ 700 mA via MicroUSB or GPIO Header
Supports Debian GNU/Linux, Fedora, Arch Linux, RISC OS and More!

25
25
3.4.3 Why raspberry pi?
The biggest advantage of raspberry pi is its small size as credit card. it works as if a
normal computer at a relatively low price.
One of other advantage of raspberry pi is usually speeding: problems can be solved in
‘hardware’ rather than in software, make use of parallelization.
Lower power consumption. By replacing linear regulators with switching ones power
consumption is reduced by between 0.5W and 1W.
3.4.4Setting up Raspberry pi
The Raspberry Pi is not generally supplied with an operating system. To setup raspberry pi
Download an iso disk image for the from raspberry site then extract the folder contained in
the zip file to some convenient location. Eject any external hard disks or USB flash drives
and insert the SD card then use the Fedora ARM Installer to put it onto an SD card. Run
fedora-arm-installer.exe as a user who has administrator rights.

26
26
Figure 3.11 Fedora ARM Image installer
Login from the widows computer network requires putty to start an SSH session. Computer
should be connected to the network where raspberry pi is connected. For a graphical
environment to control pi remotely VNC can also be used . To run VNC run the following
commands
$ sudo apt-get update
$ sudo apt-get install tightvncserver
Having installed the VNC server, run it using the command:
$ vncserver :1
The first time you run this, you will be prompted to create a new password, so anyone
connecting remotely has to enter the password before being granted access to the Pi. To
connect to the Pi from a remote computer, you will need to install a VNC client.

27
27
Figure 3.12 VNC viewer login
3.4.5Python Programs with IDLE in raspberry pi
The common Raspberry Pi distributions come with the IDLE Python development tool. In
both the Python and Python 3 versions. If you are using Raspbian or Occidentalis. You will
find shortcuts to both versions of IDLE on your Raspberry Pi desktop. We have used python
programming to transfer captured image of vehicle which has crossed speed limits.
3.4.6Raspberry pi Camera
RPI CAMERA BOARD plugs directly into the CSI connector on the Raspberry Pi. It's able to
deliver a crystal clear 5MP resolution image or 1080p HD video recording at 30fps with latest
v1.3. Board features a 5MP (2592 × 1944 pixels) Omni vision 5647 sensor in a fixed focus
module. The module attaches to Raspberry Pi, by way of a 15 pin Ribbon Cable, to the

28
28
dedicated 15 pin MIPI Camera Serial Interface (CSI), which was designed especially for
interfacing to cameras. The CSI bus is capable of extremely high data rates, and it exclusively
carries pixel data to the BCM2835 processor.
Figure 3.13 Raspberry pi camera [6]
Features
Fully compatible with both the Model A and Model B Raspberry Pi
5MP Omni vision 5647 camera module
Still picture resolution of 2592 x 1944
Video supports 1080p at 30fps, 720p at 60fps and 640x480p 60/90 recording
15 pin MIPI camera serial interface plugs directly into the Raspberry Pi Board
Size is 20mm x 25mm x 9mm
Weight of 3g
29
29
3.4.6.1 Installing camera module
The Raspberry Pi camera module is attached to a Raspberry Pi by a ribbon cable. This cable
attaches to a special connector just behind the Ethernet socket. To fit it, pull up the levers on
either side of the connector, so that they unlock, and then press the cable into the slot with the
connector pads of the cable facing away from the Ethernet socket. Press the two levers of the
connector back down to lock the cable in place. The camera module also requires some
software configuration. For that run the following command in terminal session:
$ sudo raspi-config
Then from the options there select camera option and enable it. Two commands are available
for capturing still images and videos: raspiStill and raspivid. To capture a single still image,
use the raspiStill command as shown here:
$ raspistill -o image1.jpg
A preview screen displays for about five seconds and then takes a photograph and stores it in
the file image1.jpg in the current directory.
To capture video, use the command raspivid:
$ raspivid -o video.h264 -t 10000
The number on the end is the recording duration in milliseconds in this case, 10
seconds.

30
30
Figure 3.14 Raspberry Pi with camera module fitted [6]
3.5LCD
LCD (Liquid Crystal Display) screen is an electronic display module and find a wide range of
applications. A 16x2 LCD display is very basic module and is very commonly used in various
devices and circuits. These modules are preferred over seven segments and other multi
segment LEDs. The reasons being LCDs are economical; easily programmable; have no
limitation of displaying special & even custom characters (unlike in seven
segments) animations and so on.
A 16x2 LCD means it can display 16 characters per line and there are 2 such lines. In this
LCD each character is displayed in 5x7 pixel matrix. This LCD has two registers, namely,
Command and Data.
1. 16 Characters x 2 Lines
2. Built-in HD44780 Equivalent LCD Controller
31
31
3. Works directly with ATMEGA, ARDUINO, PIC amd many other microcontroller/kits.
4. 4 or 8 bit data I/O interface
5. Low power consumption
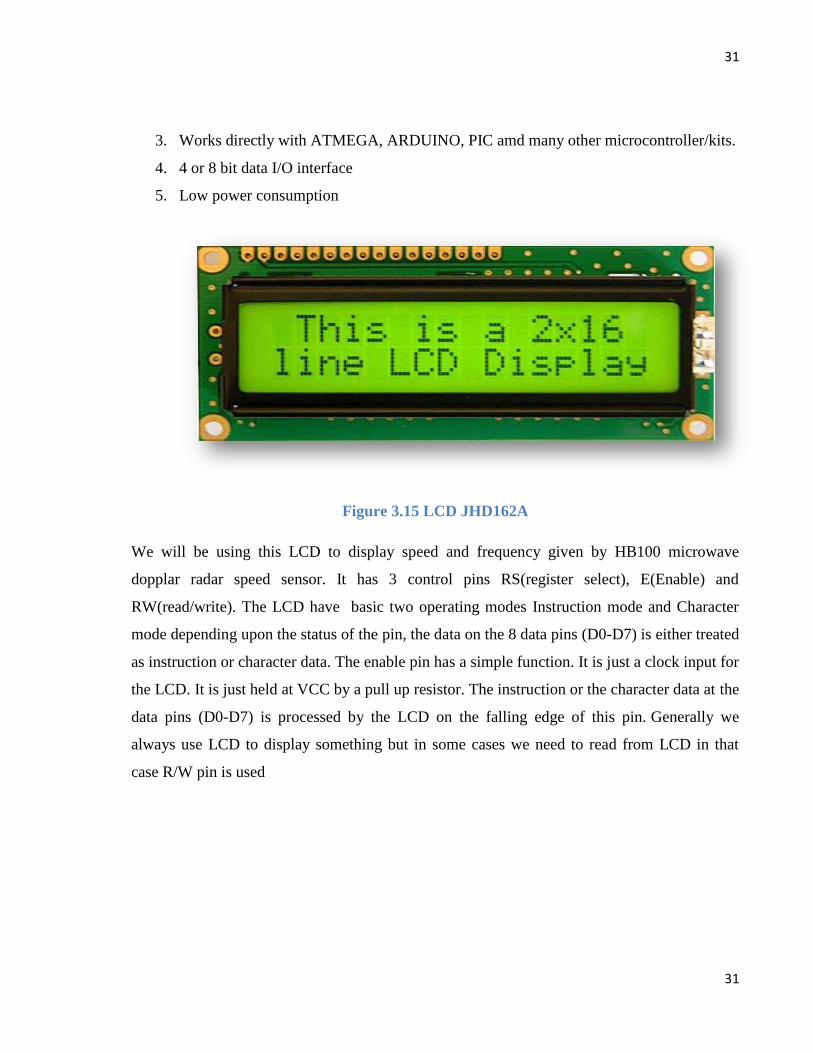
Figure 3.15 LCD JHD162A
We will be using this LCD to display speed and frequency given by HB100 microwave
dopplar radar speed sensor. It has 3 control pins RS(register select), E(Enable) and
RW(read/write). The LCD have basic two operating modes Instruction mode and Character
mode depending upon the status of the pin, the data on the 8 data pins (D0-D7) is either treated
as instruction or character data. The enable pin has a simple function. It is just a clock input for
the LCD. It is just held at VCC by a pull up resistor. The instruction or the character data at the
data pins (D0-D7) is processed by the LCD on the falling edge of this pin. Generally we
always use LCD to display something but in some cases we need to read from LCD in that
case R/W pin is used
32
32
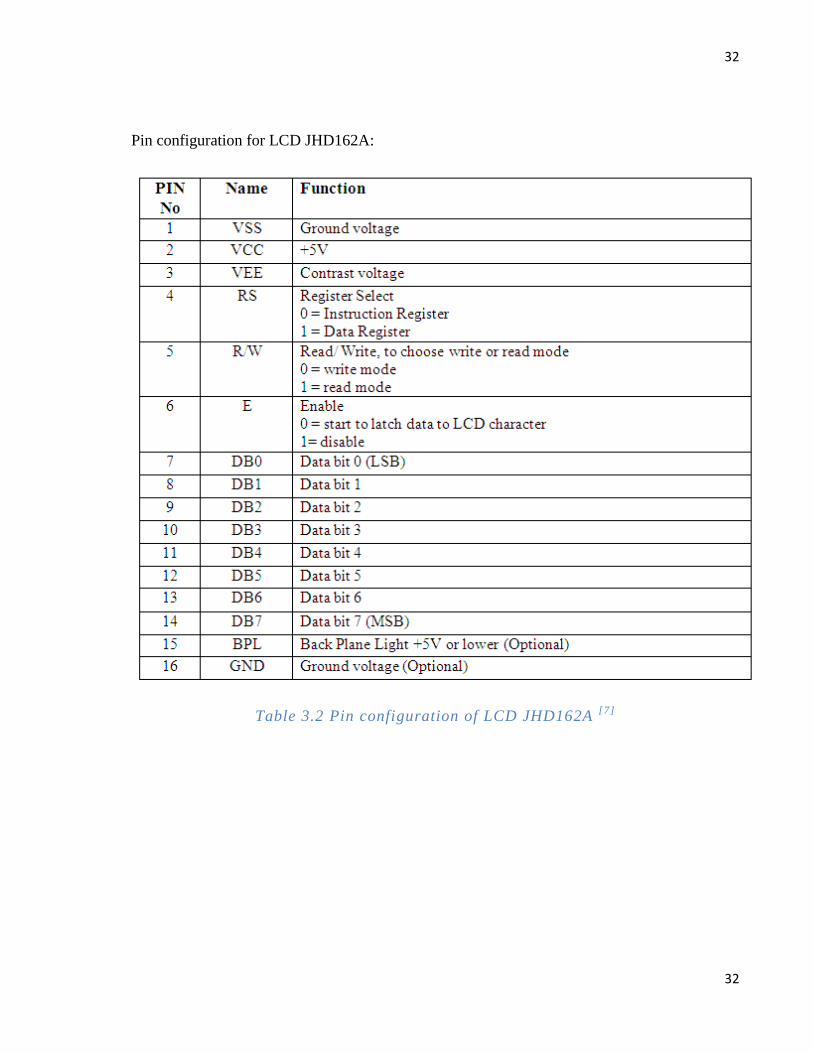
Pin configuration for LCD JHD162A:
Table 3.2 Pin configuration of LCD JHD162A [7]
33
33
3.6Number plate recognition
After detection of speed of the vehicle, the system checks for the over speed according to the
threshold set and if crossed it will trigger to capture the moment of the event. The positioning
of the camera will be structured previously to get the image of back part of over speeding
vehicle. The image thus captured will be send to the sever to detect and recognize the license
plate of the vehicle.
3.6.1 Nepali Vehicle License Plate
License plate is the identification plate where unique numbers for each vehicle is printed. The
registration number of the vehicle is binded with the chasis number of the vehicle. The VLP
(Vehicle License Plate), issued by the by the zonal level Transport Management Office, a
government agency under the Ministry of Transportation. The VLP must be placed on both
front and back side of the vehicle. The plates are required to be either in Devanagari or Latin
script. In practice, the registration plates of Nepal are bilingual. The Traffic Police Division
issued the guidelines that the plate must not be reflective and digitally printed.
For the purpose of vehicle registration Vehicle & Transport Management Act, 2049
(1992) and Vehicle & Transport Management Rule, 2054 (1997) of Nepal, classifies vehicles
into the following 5 main categories on the basis of size and capacity [8]
:
Heavy and medium-sized vehicle: This includes bus, truck, dozer, dumper, loader,
crane, Fire engine, tanker, roller, pick-up, van, mini bus, mini truck, minivan etc.
having the capacity to carry more than 14 people (for passenger vehicle) or more than 4
tons (for cargo vehicle).
Light vehicle: This includes car, jeep, van, pick-up, micro bus, etc. having the capacity
to carry less than 24 people or less than 4 tons.

34
34
Two-wheeler: This includes vehicle having two wheels like motor cycle, scooter etc.
Tractor and power-trailer:
Three-wheeler: This includes vehicle having three wheels like tempo, auto-rickshaw
etc.
The above mentioned each categories are further divided into 5 sub categories on the basis of
ownership and service-type which are as follows:
Type of vehicle Heavy size Middle size Motorcycle,
scooter
Government
ग झ ब
Private
क च प, त
Local
ख ज थ
Tourist
य य
Government
Organization/ Institution
घ ञ
Diplomatic
सिडी सिडी सिडी
Constitutional
झ
Table 3.3 Major Categories of Vehicle [9]

35
35
Private vehicle: The vehicles which are for entirely personal purpose and uses a red
license plate with the letters written in white.
Public vehicle: The vehicles which are for public purpose and use black license plate
with the letters written in white or white license plate with the letters written in black.
Government vehicle: The vehicles owned by the government agencies and
constitutional bodies such as ministries, departments, directorates, along with police,
military etc. falls under this category which uses white plate with the letters written in
red.
National Corporation vehicle: The vehicles which are registered under the name of
public corporations fully or partially owned by the government fall under this category.
These vehicles use yellow plate with the letters written in blue.
Tourist vehicle: The special vehicles to make proper transportation arrangement for
internal and external tourists in the nation.
The vehicles are provided with the letter as shown in the Table 3.3 with these being major
categories of the vehicle so that the visual distinction can be made. Every development region
in Nepal follows the same trend for vehicle classification except the region has own identifier
described below.
The 4 identifiers are:
The license plate of Nepal is more detailed in comparison with other countries. The current
license plate format for vehicles in Nepal consists of 4 parts composed of letters and digits in
the LL NN LL NNNN format:

36
36
Figure 3.16 Vehicle Identifier
The identifier of the vehicle shown in Figure 3.16 is described as:
1) the zone code, signifying the zone in which the vehicle is registered.
2) the set number which is prefixed when the four digit number runs out from the last
part.
3) the type of vehicle like private, public, governmental, national corporation, tourist etc.
as well as the class of vehicle like two-wheeler, light vehicle, heavy and medium-sized
vehicle etc.
4) the last part signifies four digits running in sequence.
And the color of the background and foreground represent the owned type of vehicle like
public, private, government, diplomatic vehicle, etc.
1 2 3
4
37
37
All 14 zones of Nepal have their own abbreviated code for reference purpose. These codes are
normally single letter in Nepali and two letters (sometimes three letters also, but the third letter
'a' can be omitted) in English which are shown in the Figure 3.16.
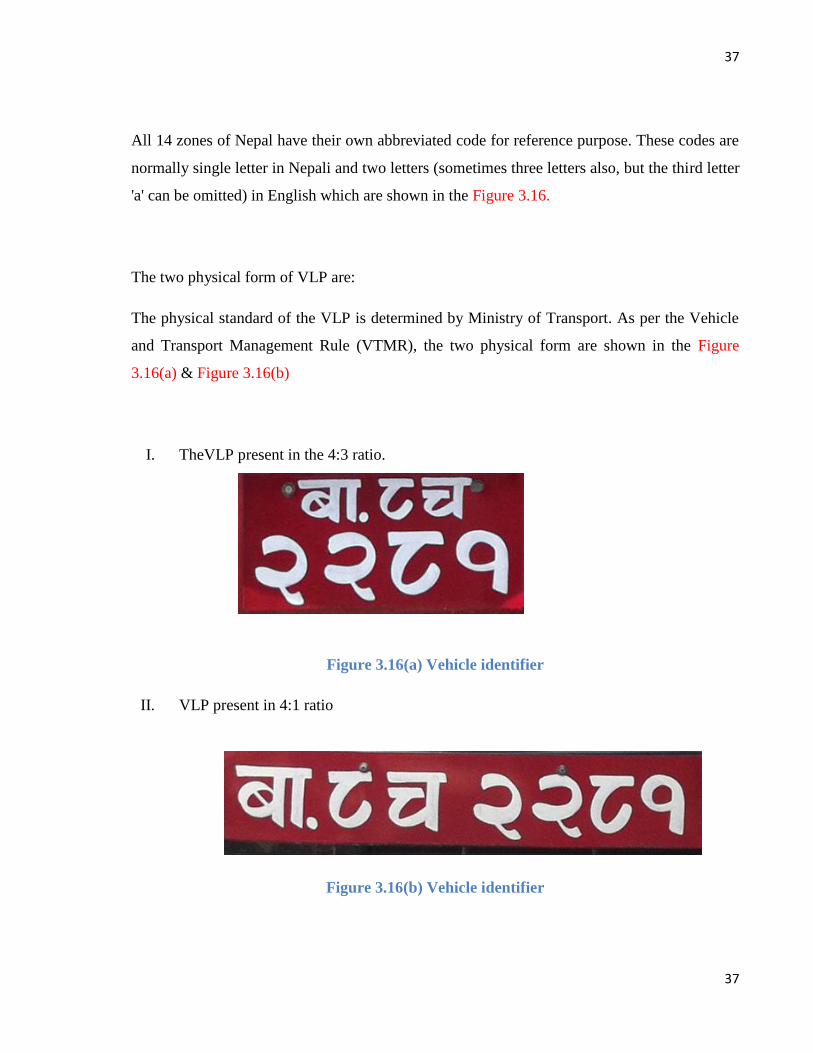
The two physical form of VLP are:
The physical standard of the VLP is determined by Ministry of Transport. As per the Vehicle
and Transport Management Rule (VTMR), the two physical form are shown in the Figure
3.16(a) & Figure 3.16(b)
I. TheVLP present in the 4:3 ratio.
Figure 3.16(a) Vehicle identifier
II. VLP present in 4:1 ratio
Figure 3.16(b) Vehicle identifier
38
38
According the VMTR, the character and number are written inside the number plate by leaving
½ inch of space around the border for heavy and middle size four wheeler as for two wheeler
bikes, scooter the space are made at ¼ inch. The distance between the number and the
character must be ¼ inch and the distance between upper line and lower line of character must
be ½ inch [9].
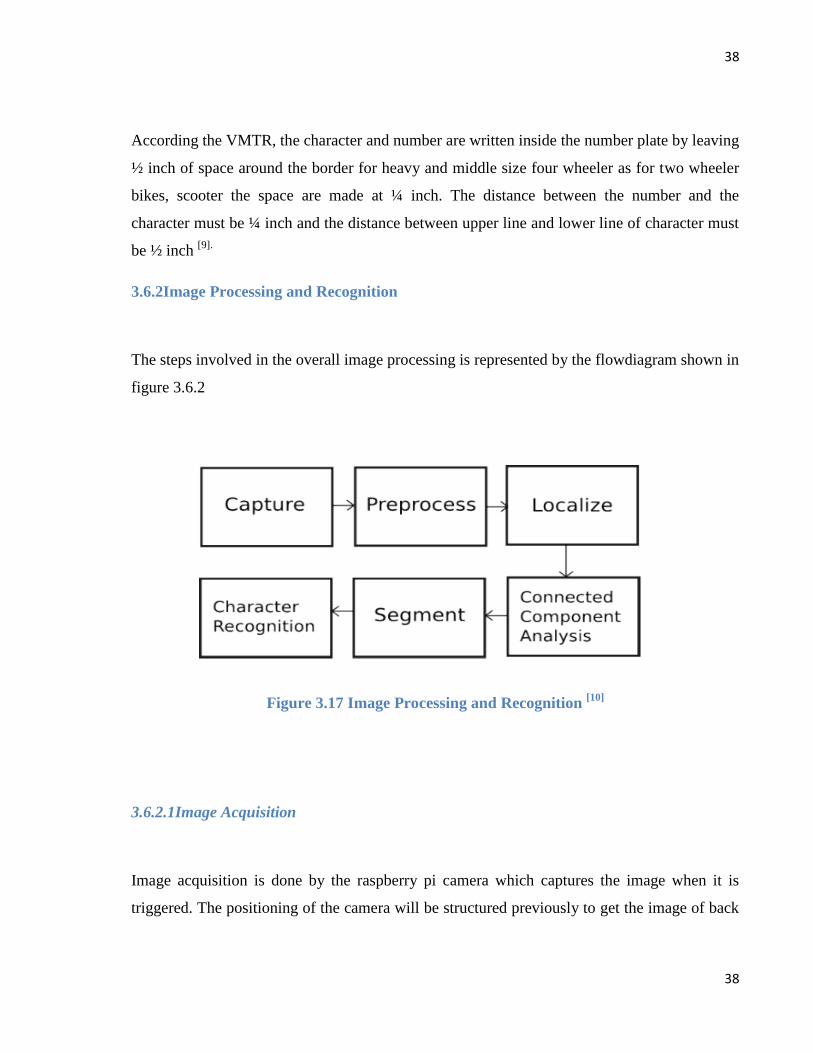
3.6.2Image Processing and Recognition
The steps involved in the overall image processing is represented by the flowdiagram shown in
figure 3.6.2
Figure 3.17 Image Processing and Recognition [10]
3.6.2.1Image Acquisition
Image acquisition is done by the raspberry pi camera which captures the image when it is
triggered. The positioning of the camera will be structured previously to get the image of back
39
39
part of over speeding vehicle. The feature of the image and properties of the camera is
discussed in 3.4.6 Raspberry pi camera. A better choice is an HD Infrared (IR) camera.
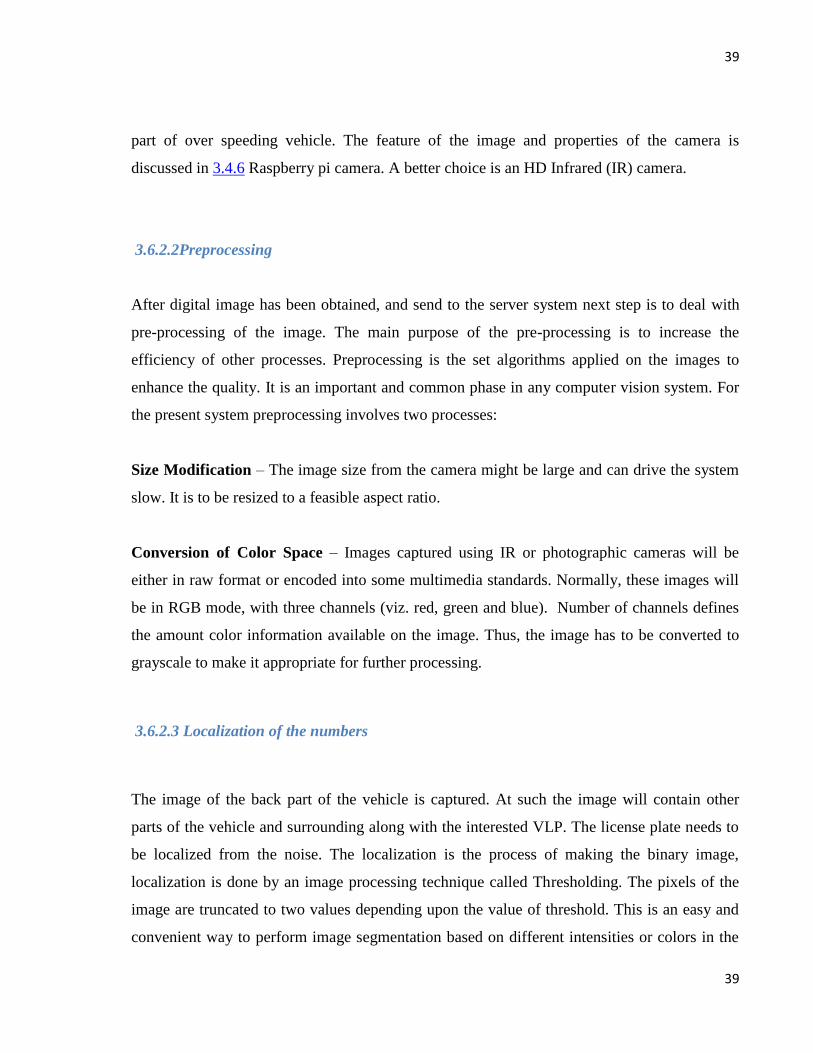
3.6.2.2Preprocessing
After digital image has been obtained, and send to the server system next step is to deal with
pre-processing of the image. The main purpose of the pre-processing is to increase the
efficiency of other processes. Preprocessing is the set algorithms applied on the images to
enhance the quality. It is an important and common phase in any computer vision system. For
the present system preprocessing involves two processes:
Size Modification – The image size from the camera might be large and can drive the system
slow. It is to be resized to a feasible aspect ratio.
Conversion of Color Space – Images captured using IR or photographic cameras will be
either in raw format or encoded into some multimedia standards. Normally, these images will
be in RGB mode, with three channels (viz. red, green and blue). Number of channels defines
the amount color information available on the image. Thus, the image has to be converted to
grayscale to make it appropriate for further processing.
3.6.2.3 Localization of the numbers
The image of the back part of the vehicle is captured. At such the image will contain other
parts of the vehicle and surrounding along with the interested VLP. The license plate needs to
be localized from the noise. The localization is the process of making the binary image,
localization is done by an image processing technique called Thresholding. The pixels of the
image are truncated to two values depending upon the value of threshold. This is an easy and
convenient way to perform image segmentation based on different intensities or colors in the

40
40
foreground and background part of an image. Not all images can be segmented successfully
into foreground and background using simple thresholding. Its accuracy depends on the
distribution of the intensity histogram. If the intensity distribution of foreground objects is
quite distinct from the intensity distribution of background, it will be clear to apply
thresholding for image segmentation. In this case, we expect to see distinct peaks in the
histogram corresponding to numbers in VLP, so that threshold values can be picked to isolate
those peaks accordingly. If such a peak does not exist, it is unlikely that simple thresholding
can achieve a good segmentation.
Morphological image processing is a collection of non-linear operations related to the shape or
morphology of features in an image. According to Wikipedia, morphological operations rely
only on the relative ordering of pixel values, not on their numerical values, and therefore are
especially suited to the processing of binary images. Morphological operations can also be
applied to grayscale images such that their light transfer functions are unknown and therefore
their absolute pixel values are of no or minor interest.
Morphological techniques probe an image with a small shape or template called a structuring
element. The structuring element is positioned at all possible locations in the image and it is
compared with the corresponding neighborhood of pixels. Some operations test whether the
element "fits" within the neighborhood, while others test whether it "hits" or intersects the
neighborhood.
A morphological operation on a binary image creates a new binary image in which the pixel
has a non-zero value only if the test is successful at that location in the input image.
Binary dilation is performed to the source binary image using different shaped structural
elements.

41
41
3.6.2.4Connected Component algorithm
After localization of the image, connected component algorithm is applied to eliminate
undesired areas of the image. This connected-component labeling is alternatively referred as
connected-component analysis, blob extraction, region labeling, blob discovery, or region
extraction is an algorithmic where subsets of connected components are
uniquely labeled based on a given heuristic. This algorithm is used in computer vision to
detect connected regions in binary digital images, although color images and data with higher
dimensionality can also be processed. When integrated into an image recognition system
or human-computer interaction interface, connected component labeling can operate on a
variety of information. In this case blob extraction is performed on the resulting binary
image from a thresholding step. Blobs may be counted, filtered, and tracked. Here, each of the
connected components (blobs) is labeled and extracted.
3.6.2.5Segmentation
Image segmentation is the process of partitioning a digital image into multiple segments
(sets of pixels, also known as super pixels). The goal of segmentation is to simplify and/or
change the representation of an image into something that is more meaningful and easier to
analyze. Image segmentation is typically used to locate objects and boundaries (lines, curves,
etc.) in images. More precisely, image segmentation is the process of assigning a label to every
pixel in an image such that pixels with the same label share certain characteristics. Example of
image segmentation is shown in the figure below

42
42
Figure 3.18 Segmentation [11]
The result of image segmentation is a set of segments that collectively cover the entire image,
or a set of contours extracted from the image (see edge detection). Each of the pixels in a
region are similar with respect to some characteristic or computed property, such as
color, intensity, or texture. Scissoring algorithm is used which performs by scanning the image
vertically and cropping out white versions in the image. This technique is fast and efficient
than compared to other predefined image cropping techniques. . Segmentation phase also
involves classification of the collected blobs and recording only the essential ones.
Undesirable blobs occur even after segmentation. These are removed by two methods:
1) Aspect ratio based elimination.
2) Pixel coordinate based selection.
Aspect ratio based elimination: The aspect ratio (row/column) of each blob is calculated and
recorded. A binarized candidate is sure of containing more characters than unwanted blobs.

43
43
The mean of the aspect ratios are calculated and compared to all the blobs in turn. If anyone of
them has a larger deviation, that blob is removed from the candidate.
Pixel coordinate based selection: This algorithm thrives on the fact that license numbers are
occurring in the plate in a single set of rows. Effectively, we can detect the edge of the license
plate, and select the blobs coming between the minimum and maximum row coordinates. This
can reduce the amount of unwanted blobs and make the system more accurate. However, in
our case, as we are capturing the back part of the vehicle numbers are in two rows, this
algorithm is not used.
3.6.2.6Character Recognition
After the blob region has been selected, the blobs are tested to recognize the character
associated with it. Template matching is a technique in digital image processing for finding
small parts of an image which match a template image. It can be used in manufacturing as a
part of quality control, a way to navigate a mobile robot or as a way to detect edges in images.
Feature based approach
If the template image has strong features, a feature-based approach may be considered; the
approach may prove further useful if the match in the search image might be transformed in
some fashion. Since this approach does not consider the entirety of the template image, it can
be more computationally efficient when working with source images of larger resolution, as
the alternative approach, template-based, may require searching potentially large amounts of
points in order to determine the best matching location.

44
44
Template Approach
For templates without strong features, or for when the bulk of the template image constitutes
the matching image, a template-based approach may be effective. As aforementioned, since
template-based template matching may potentially require sampling of a large number of
points, it is possible to reduce the number of sampling points by reducing the resolution of the
search and template images by the same factor and performing the operation on the resultant
downsized images (multi resolution, or pyramid, image processing), providing a search
window of data points within the search image so that the template does not have to search
every viable data point, or a combination of both.
Algorithm
Correlation of the input image with every image in the template for the best matching.
Image correlation is an optical method that employs tracking and image registration
techniques for accurate 2D and 3D measurements of changes in images.[12]
Record the value of correlation for each template’s character.
Find the index which corresponds to the highest matched character.

45
45
4.SOFTWARE AND TOOLS USED
4.1Tools used for circuit design
4.1.1KiCAD
KiCAD is an open source software suite for electronic design automation. It facilitates the
design of schematics for electronic circuits and their conversion to PCB designs. KiCAD uses
an integrated environment for all of the stages of the design process schematic capture, PCB
layout, Gerber file generation/visualization and library editing. KiCAD has a built-in basic
auto router. Tools exist within the package to create artwork and 3D view of the PCB. KiCAD
is also across platform.
4.1.2PCB Wizard
The PCB Wizard is a powerful and a highly innovative package for designing single side and
double side PCBs. It provides a comprehensive range of tools covering all the traditional steps
in PCB production, including schematic drawing, schematic capture, component placement,
automatic routing. Circuit diagrams are drawn using circuit symbol components connected
with wires. Components are simply dragged, dropped and arranged in the working window
and necessary connections are made between the component terminals.
46
46
4.2Tools Used for Simulation
4.2.1Proteus VSM
The Proteus VSM combines mixed mode SPICE circuit simulation, animated components and
microcontroller models to facilitate co-simulation of complete microcontroller based design. It
is possible to develop and test such designs before a physical prototype is constructed. This is
possible because interaction with the design is possible using circuit indicators like LED,
display panels, actuators etc. It also provides extensive debugging facility by employing
breakpoints, single stepping and variable display of both assembly code and high level
language source code.
4.3Software used
4.3.1PuTTY
PuTTY is a free and open-source terminal emulator, serial console and network file transfer
application. It supports several network protocols, including SCP, SSH, Telnet, rlogin, and raw
socket connection.
Some features of PuTTY are:
The storing of hosts and preferences for later use.
Control over the SSH encryption key and protocol version.
Public key authentication support.
Support local serial port connection.
Self-contained executables required mo installation.

47
47
4.3.2Real VNC
It is a company that provides remote access software. The software consists of a server and
client application for the Virtual Network Computing (VNC) protocol to control another
computer's screen remotely. RealVNC clients using can vncviewer run in full-screen mode
they use the F8 function-key as the default key for bringing up an options menu. The server
component of RealVNC allows a computer to be remotely controlled by another computer.
The software can be installed for legitimate purposes, but it can also be installed from a remote
location by an attacker with malicious intent.
4.3.3Arduino IDE
The Arduino development environment contains a text editor for writing code, a message area,
a text console, a toolbar with buttons for common functions, and a series of menus. It connects
to the Arduino hardware to upload programs and communicate with them. It has many built in
libraries along with libraries for LCD display. We can also install third party library in the
latest IDE of Arduino.
4.3.4Python (programming language)
Python is a widely used general purpose high level programming language which emphasizes
program readability and reduces complexity in coding. Its syntax allows programmers to
express concepts in fewer lines of code than would be possible in other languages. The
language provides constructs intended to enable clear programs on both a small and large
scale. It supports multiple programming including object oriented, imperative and functional
programming. It has feature like automatic memory management and has a large library.
48
48
Python uses dynamic typing and a combination of reference counting and a cycle-
detecting garbage collector for memory management. An important feature of Python is
dynamic name resolution (late binding), which binds method and variable names during
program execution.
Features of python programming language:
Simple ,easy to learn, free and open source
Interpreted
Object Oriented
Extensible.
Python is indeed an exciting and powerful language. It has the right combination of
performance and features that make writing programs in Python both fun and easy.
4.3.5MATLAB
MATLAB is a high level technical computing language and interactive environment for
algorithm development, data visualization, data analysis, and numeric computation. It can be
used in a wide range of applications, including signal and image processing, communications,
control design, test and measurement, financial modeling and analysis, and computational
biology.
MATLAB was used to test the algorithms and then to model the system. MATLAB has a
variety of toolboxes for different purposes. In this case Image Processing toolbox is used.
49
49
5.METHODOLOGY
5.1System Block diagram
The overall system has a number of components, with specific tasks, working together.
Connection of the different components is as shown in the block diagram Figure 5.1
5.1.1Diagram Description
Firstly, the HB100 sensor is a major part of the system. It senses the moving vehicle and
produces output sinusoidal signal. The output signal is amplified by a very high gain amplifier.
The output of the amplifier is fed to the digital pin of Arduino. The microcontroller measures
the frequency of the input signal and calculates the speed of the vehicle from the value of
frequency. The value of speed is displayed on the LCD panel. It also checks if the speed limit
is exceeded and signals raspberry pi if the speed limit is crossed. The raspberry pi triggers the
camera attached to the board. The image is then sent to the server via internet connection. The
server processes the image to extract the characters in the License plate. The extracted
character is then sent to the next station.

50
50
Figure 5.1 Block diagram of the system
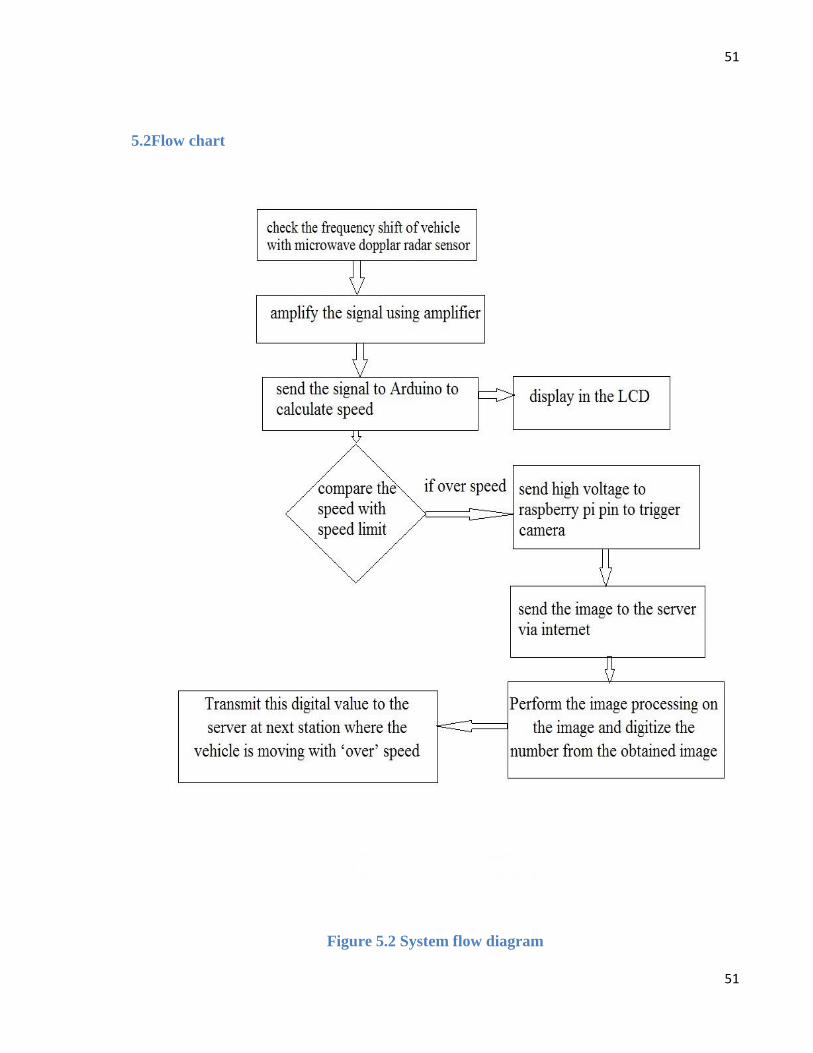
51
51
5.2Flow chart
Figure 5.2 System flow diagram

52
52
The overall system can be broadly divided into three parts.
5.3Speed Detection
Radar sensor was used to detect the speed of the vehicles. Among the various methods
researched for speed detection, radar detection seemed to be the most accurate way of
detecting speed of vehicles. It is widely used in the commercial speedgun used by Traffic
Police for checking on speeding vehicle. The radar sensor has a built in oscillator and mixer.
The oscillator outputs a sinusoidal signal of frequency 10.525 Ghz and radiates the signal to a
direction using microstrip patch antenna. The signal strikes the moving vehicle and reflected
back to the sensor with shift in frequency according to Doppler principle. The mixer generates
a signal that is the difference between the transmitted and the received signal and the
frequency of the output signal is proportional to the speed of vehicle. The output is a low
amplitude frequency signal in audio range.
The sensor is a 3 pin circuit. Vcc, Gnd and output pin. +5 volt is supplied between Vcc and
Gnd and the output is taken from the output pin and Gnd.
+5volt
Ground
Output
Figure 5.3 Simplified diagram speed detection
Microwave dopplar radar
sensor
(10.525 Ghz)

53
53
Using the dopplar shift equation to calculate the relation between the shift in frequency and
velocity of the moving object.
fd =2*cosA* f * v/c
Where fd= shift in frequency in Hz (i.e. frequency of the output signal from radar )
v=velocity of moving object
c=velocity of electromagnetic wave in vacuum
f=frequency of transmitted wave from the sensor (10.525 Ghz)
Assuming the object is directly ahead so that the value of angle cosA=1, the expression for
velocity of the object reduces to :
v= fd/19.49074 km/hour
For v=0, fd=0
For speed limit of 60 Km/hr, i.e. v=60 Km/hr, output frequency fd=1169.428Hz.
If the output signal of the sensor has frequency exceeding 1169.444Hz, the vehicle exceeds the
speed limit of 60 km/hr.
5.4Amplification of signal
The output of the sensor is sinusoidal wave with very small amplitude and needs to be
amplified before further processing. The output of sensor is in the audio frequency range.
However we are concerned with the frequency below the speed limit. i.e nearly 1.1 Khz. So an
audio amplifier with low pass active filter is desired for the design. The amplifier IC used for
this purpose is the LM324 Quad op amp. This IC has four operational amplifiers
The output signal from the radar is in the range of few millivolt. So high gain of the amplifier
is needed to shift the voltage level to the point that is able to drive a TTL logic. The

54
54
amplification is achieved in two stages to minimize the effect of noise. The complete diagram
of the amplifier circuit used is as shown below.
Figure 5.4 Amplifier Design
Amplification of the radar output is achieved using two of the four stages of LM324 IC.
5.4.1Non-Inverting stage
The first stage is configured as Non-inverting amplifier. The output of the sensor has a small
dc value (0.01 to 0.2 Vdc)and so AC coupling of the output is necessary. The input is supplied
to the non inverting terminal via a capacitor(4.7 µF) and a resistor(12K) is connected to the
ground. Dc offset of nearly 2.5 volts is generated using a resistive divider network. Two
resistors of 100K are connected between +5 volt and Ground to generate 2.5volt at the centre.

55
55
The gain of the first stage is given by the values of the resistor in the feedback path(1M) and
the resistor from the inverting terminal to ground(10k). The gain in the non inverting amplifier
is
Gain= (1+1M/10K) = 100
5.4.2Inverting stage
The output of first stage is a sinusoidal signal with a small dc offset. The dc component at the
output is filtered by the capacitor at the output terminal. The second stage is a op-amp
configured as inverting amplifier. The signal is applied to the inverting terminal via 8.2K
resistor and dc offset of 2.5 volt is supplied to the non-inverting terminal. The gain for this
stage is given by the values of the feedback resistor (1M) and the resistor at the inverting input
terminal (8.2 K). The gain in this stage is given by the equation
Gain= -1M/8.2K =122
The 2.2nF capacitor in the feedback path of the amplifier makes this configuration an active
low pass filter. The high frequency noises are filtered and the accuracy of the system is
improved.
The two stages are cascaded to achieve the overall gain of the amplifier. The overall gain is
given by the product of the gain in individual stages.
Overall gain of amplifier= 100 * 122 =12,200
The gain of the amplifier is so high that the op-amp in the second stage reaches saturation.
Since we are concerned only with the frequency of the signal and not the shape of the wave
form, the output is driven to saturation point with very high gain. The second stage acts as a
comparator and the output produced is a digital waveform that can be sensed by the digital pin
of a microcontroller.

56
56
5.5Measurement of frequency
Frequency of the signal is the factor representing the speed of the moving object. So the next
stage is the measurement of the frequency of the incoming pulse from the amplifier. Output
from the amplifier is connected to the external interrupt pin of atmega 328 .The corresponding
pin in arduino Uno is digital pin 8. Counter of atmega328 is used for the measurement of the
frequency of input signal. External interrupt pin of atmega328 can be programmed to work
with either rising edge or falling edge. So, Interrupt pin can be used to detect rising edge in the
input signal. The rising edge of the input signal provides interrupt to the microcontroller. The
interrupt subroutine starts the counter. On the next rising edge the counter stops. The
frequency of the input signal can be obtained from counted value and the clock of the counter.
A number of such measurements can be taken and averaged for better accuracy.
5.5.1Algorithm for measuring frequency
1) Enable external interrupt and check for rising edge in the input signal
2) At rising edge, start counter
3) Wait for next rising edge
4) At next rising edge, stop counter
5) Divide clock frequency of counter by output of counter
6) Repeat steps 1-5 for a number of times and take average
The microcontroller is run with a 16 Mhz crystal. So if the counter inside it counts ‘n’ between
two successive rising edges of the input signal then the frequency of the input signal is 16/n
Mhz. This approach of measuring frequency is accurate when the frequency of the input signal
is very small compared to the clock of microcontroller.
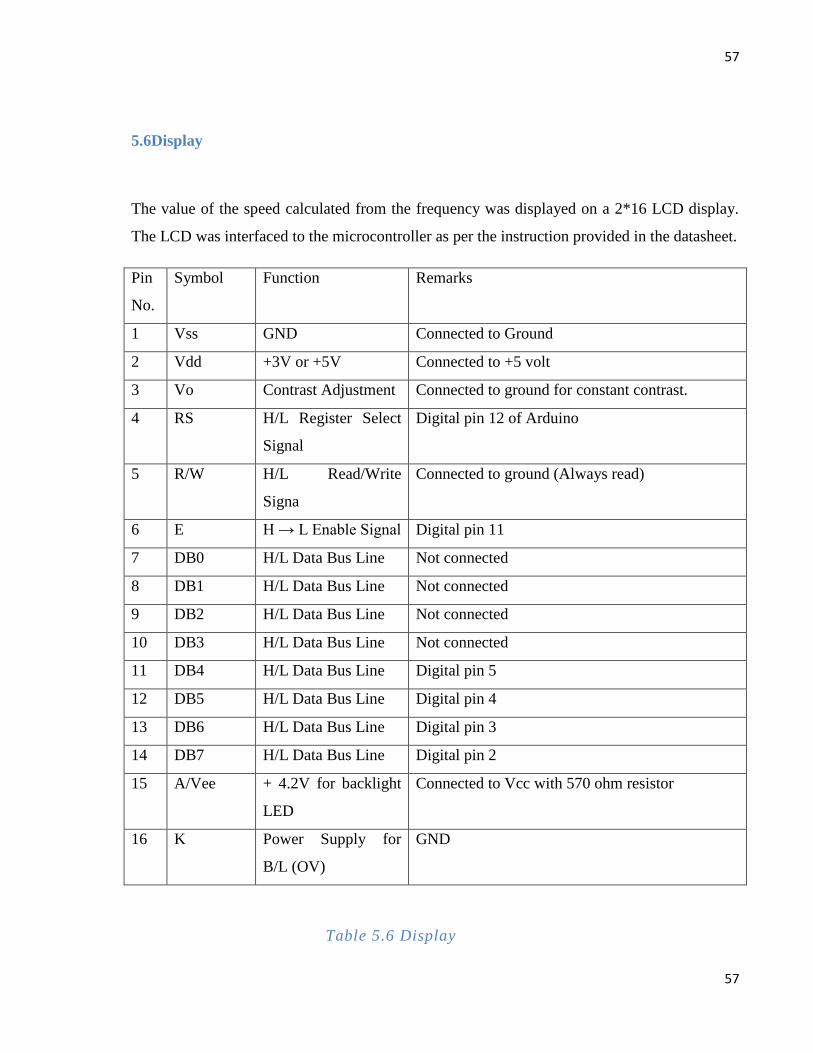
57
57
5.6Display
The value of the speed calculated from the frequency was displayed on a 2*16 LCD display.
The LCD was interfaced to the microcontroller as per the instruction provided in the datasheet.
Pin
No.
Symbol Function Remarks
1 Vss GND Connected to Ground
2 Vdd +3V or +5V Connected to +5 volt
3 Vo Contrast Adjustment Connected to ground for constant contrast.
4 RS H/L Register Select
Signal
Digital pin 12 of Arduino
5 R/W H/L Read/Write
Signa
Connected to ground (Always read)
6 E H → L Enable Signal Digital pin 11
7 DB0 H/L Data Bus Line Not connected
8 DB1 H/L Data Bus Line Not connected
9 DB2 H/L Data Bus Line Not connected
10 DB3 H/L Data Bus Line Not connected
11 DB4 H/L Data Bus Line Digital pin 5
12 DB5 H/L Data Bus Line Digital pin 4
13 DB6 H/L Data Bus Line Digital pin 3
14 DB7 H/L Data Bus Line Digital pin 2
15 A/Vee + 4.2V for backlight
LED
Connected to Vcc with 570 ohm resistor
16 K Power Supply for
B/L (OV)
GND
Table 5.6 Display

58
58
The Arduino board not only calculates and displays speed but also compares it with a preset
threshold. The threshold for our design is 60 km/hr. When it detects overspeed, Digital Pin 8 is
set high for a short instance. Output pin of microcontroller is connected to raspberry Pi to
signal the Pi to trigger the camera whenever speed limit is crossed. Direct connection between
atmega328 and raspberry Pi cannot be made due to difference of logic level for the two
processors. So a resistive voltage divider network is used to shift voltage level of 5V at output
pin to 3.3V. The output pin of atmega is connected to ground via two resistors 270 ohm and
470 ohm in series. Voltage across 470 ohm resistor and ground is fed as input to raspberry Pi’s
digital pin. Digital pin 23 of raspberry Pi is configured as input pin. When the digital pin in
raspberry pi goes high it triggers its HD camera and captures image of the approaching
vehicle.
5.7Socket programming in python:
Raspberry pi comes with a Linux based operating system and python is the official
programming language supported. The board needs to communicate to the server to transfer
the image file for further processing. Each time a vehicle crosses the speed limit the Pi board
captures the image, connects to the server and sends it. The connection between server and the
pi board is via internet. The Pi has a LAN interface and is capable of connecting to the internet
directly through LAN cable. The server on the other side continually monitors for any
incoming request and handles it. Both the client and server are programmed in python.
The server creates a socket and listens for any incoming connection in the designated
port.
The client program running on the Pi board continuously checks for High signal in its
input pin.
When high, it triggers the camera and saves the image in its memory.
The client then requests for a connection with the server.
The server accepts the connection.

59
59
The Client then sends the image to the server and disconnects the socket.
The client again starts monitoring its input pin.
The server saves the image along with the current date and time.
The server again starts listening for any incoming connection
5.8Number Plate recognition
Initially using MATLAB platform the image processing was performed which include
following steps.
5.8.1Number plate extraction
Take a image
Resize the image keeping the aspect ratio same
Convert to gray scale
Apply median filtering to remove noise

60
60
Figure 5.5 Number plate extraction
Find the structural element
Dialating the gray image with the structural element
Eroding the gray image with structural element
Morphological Gradient for Edge enhancement
Converting the class to double

61
61
Figure 5.5(a) Number plate extraction
Convolution of the double image for brightening the edges
Intensity scaling between the range 0 to 1
Conversion of the class from double to binary
Eliminating the possible horizontal lines from the output image of region grow that
could be the edges of a license plate

62
62
Figure 5.5(b) Number plate extraction
Subtracting the recent image from binary image
Filling all the regions of the image
Thinning the image to ensure character isolation
Selecting all the regions that are of pixel area more than 100
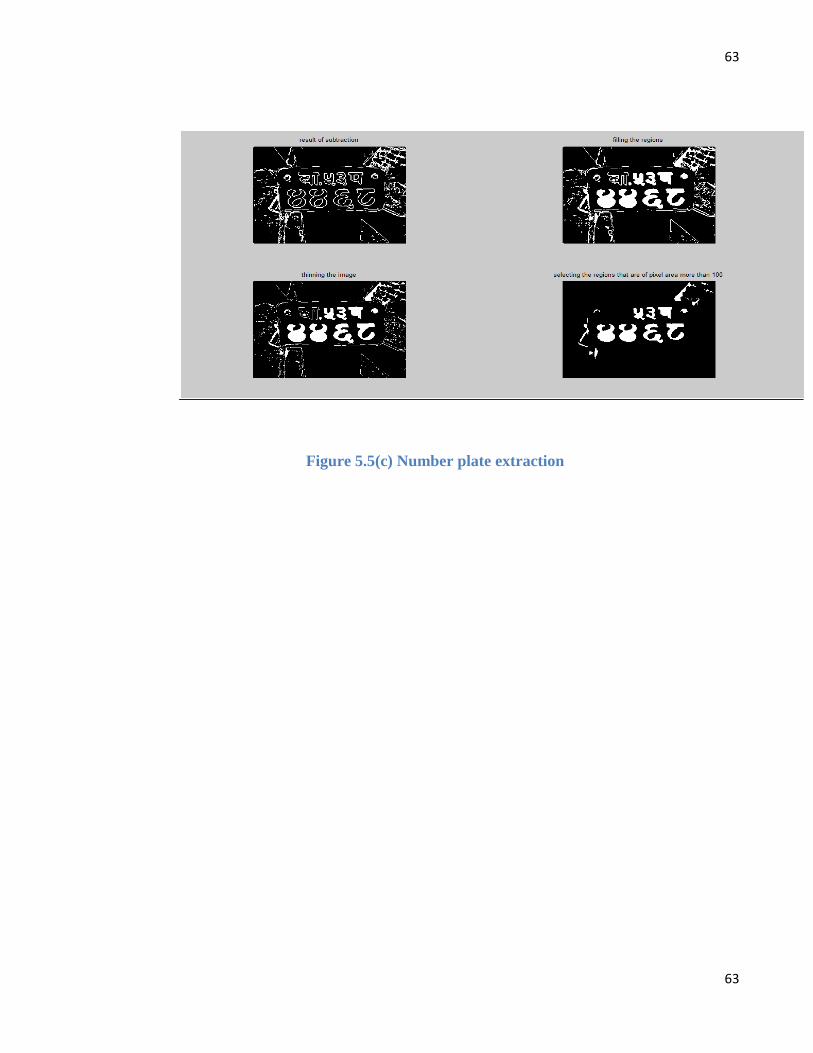
63
63
Figure 5.5(c) Number plate extraction

64
64
6.EXPERIMENTAL RESULTS
6.1Accuracy in frequency measurement
The accuracy of the system in frequency measurement was tested using a function generator
and an oscilloscope. The input to the amplifier was connected to the output of the function
generator and an oscilloscope was connected for reference. Small sinusoidal signal was
applied to the circuit and the frequency varied. The table below summarizes the result obtained
from the test.
Applied frequency Measured Frequency
50.12 Hz 50.05 Hz
101.31 Hz 101.25 hz
200.88 Hz 200.65 Hz
300.08Hz 299.90 Hz
400.60 hz 399.85 Hz
600.32 Hz 600.45Hz
800.62 Hz 798.48 hz
1000.98 Hz 999.15 hz
Table 6.1 Applied frequency vs measured frequency
The test showed very high degree of accuracy in measurement of frequency of input signal.
However, in actual system with sensor as source of frequency noises in various forms are
present. So a slightly higher degree of inaccuracy than the data shown in above table can be
expected.

65
65
6.2Calculation of speed
If ‘f’ be the value of frequency measured by the microcontroller, then the corresponding speed
in Km/hr is obtained by dividing it with a factor 19.49. Some of the values of frequency and
their corresponding speed are presented in the table below.
Frequency Speed
0 Hz 0 .00 Km/hr
100 Hz 5.13 Km/hr
400 Hz 20.52 Km/hr
800 Hz 41.04 Km/hr
1200 Hz 61.57 Km/hr
Table 6.2 Calculation of speed
6.3Accuracy in speed measurement
Testing accuracy of the sensor and the overall system in speed measurement required a
standard calibrated device such as a speed gun for determining speed of moving vehicles. But
due to lack of such resources available for testing, the accuracy of system could not be exactly
determined. Attempts were made to test the system output against the speedometer of vehicle
and despite the complexity in observation some data were produced to check the accuracy of
system.
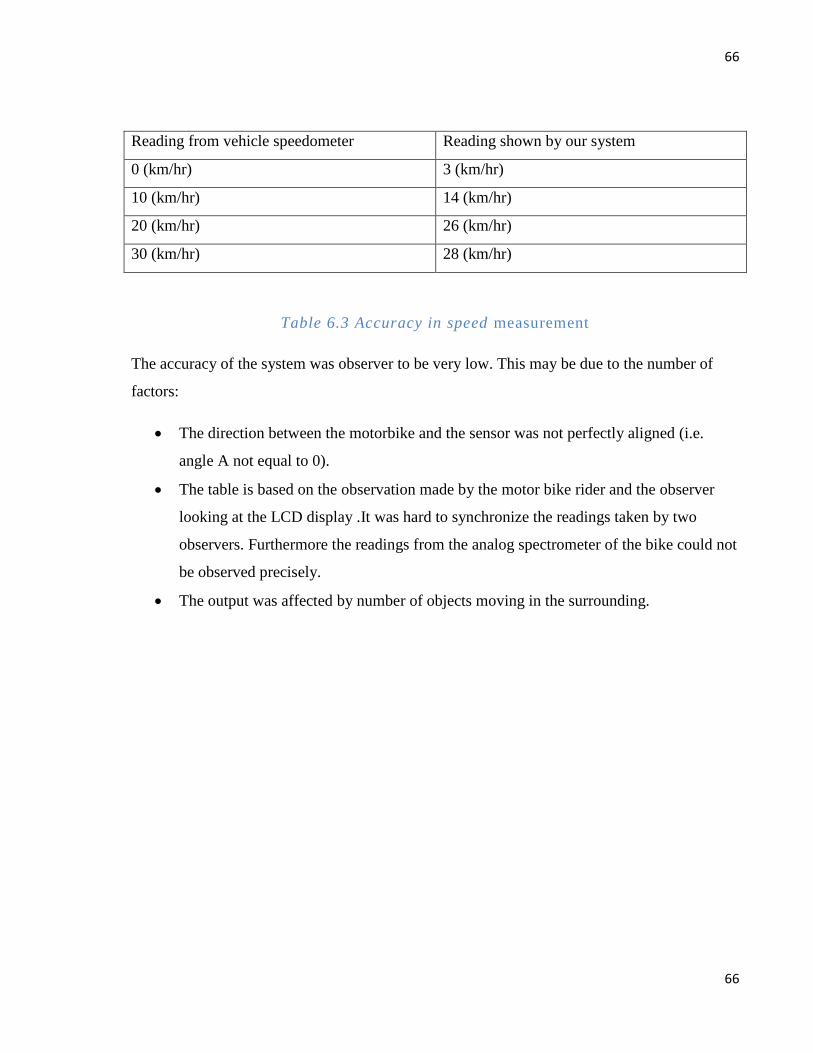
66
66
Reading from vehicle speedometer Reading shown by our system
0 (km/hr) 3 (km/hr)
10 (km/hr) 14 (km/hr)
20 (km/hr) 26 (km/hr)
30 (km/hr) 28 (km/hr)
Table 6.3 Accuracy in speed measurement
The accuracy of the system was observer to be very low. This may be due to the number of
factors:
The direction between the motorbike and the sensor was not perfectly aligned (i.e.
angle A not equal to 0).
The table is based on the observation made by the motor bike rider and the observer
looking at the LCD display .It was hard to synchronize the readings taken by two
observers. Furthermore the readings from the analog spectrometer of the bike could not
be observed precisely.
The output was affected by number of objects moving in the surrounding.
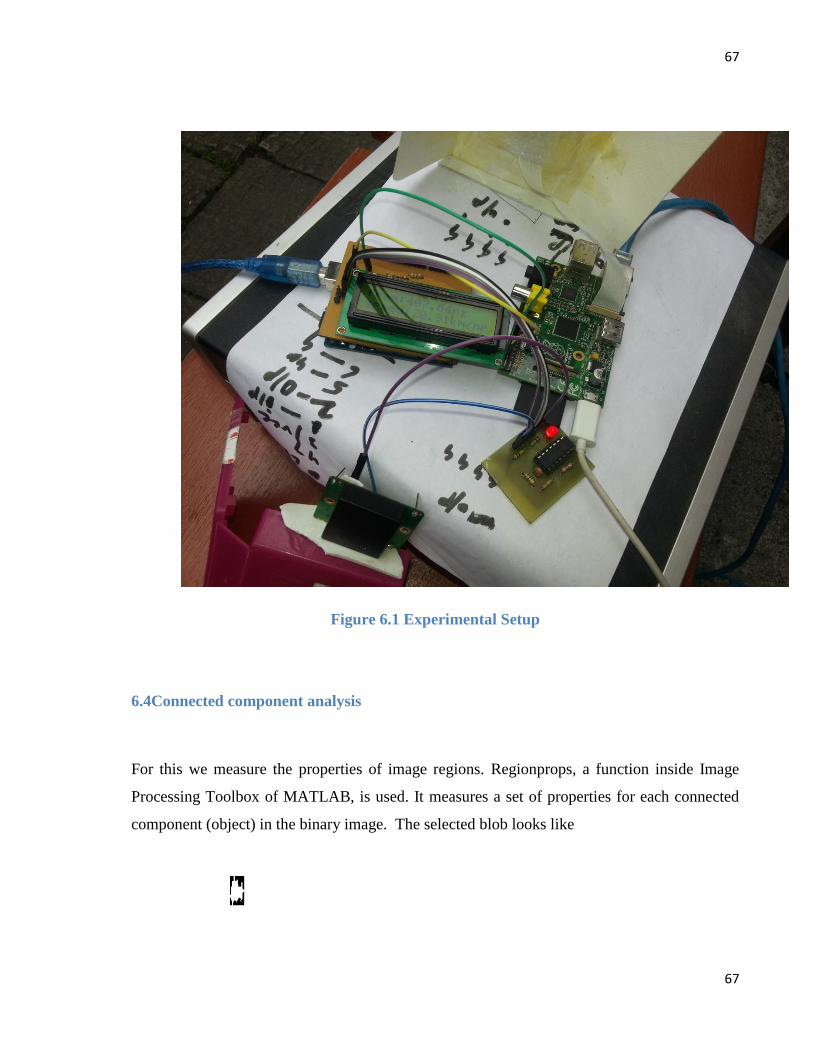
67
67
Figure 6.1 Experimental Setup
6.4Connected component analysis
For this we measure the properties of image regions. Regionprops, a function inside Image
Processing Toolbox of MATLAB, is used. It measures a set of properties for each connected
component (object) in the binary image. The selected blob looks like

68
68
This is the region extracted from the processed image:
Figure 6.2 Region Extraction
At this, to extract the component of our interest we analyze through the histogram
method:
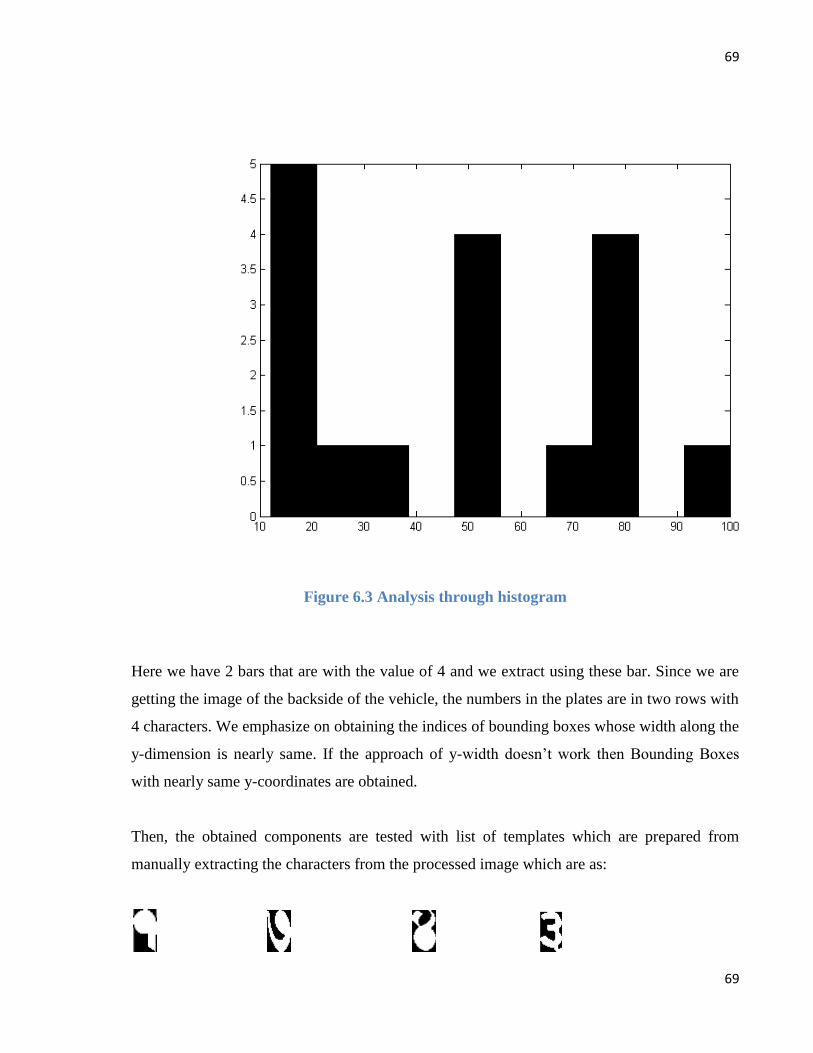
69
69
Figure 6.3 Analysis through histogram
Here we have 2 bars that are with the value of 4 and we extract using these bar. Since we are
getting the image of the backside of the vehicle, the numbers in the plates are in two rows with
4 characters. We emphasize on obtaining the indices of bounding boxes whose width along the
y-dimension is nearly same. If the approach of y-width doesn’t work then Bounding Boxes
with nearly same y-coordinates are obtained.
Then, the obtained components are tested with list of templates which are prepared from
manually extracting the characters from the processed image which are as:

70
70
6.COST ESTIMATION
S.NO Item Specification Rate
(Rs.)
Quantity Total
(Rs.)
1 Raspberry pi model B 6500 1 6500
2 camera rev1.3 3000 1 3000
3 Arduino UNO 3500 1 3500
4 Sensor HB100 3000 2 6000
5 Microcontroller atmega328 450 2 900
6 Resistors pack 80 2 160
7 Capacitors pack 10 15 150
8 Crystal 16MHZ 30 2 60
9 PCB board 12*12 800 2 1600
10 memory card micro SD 500 1 500
11 Bread Board 150 2 300
12 Matrix board 100 2 200
13 Male female header 1 100 100
14 Connectors Female-Female 12 50 600
15 IC base 14 pin 30 2 60
16 IC base Lm324 50 2 100
17 drill bit 1mm 80 4 320
18 soldering Rod 40 watt 1 550 550
19 soldering materials Wire,paste&stand 500 500
20 LCD 16*2 400 1 400
21 power supply 7805 IC 20 1 20
22 Battery 9V 60 2 120
23 Miscellaneous 5000 1 5000
TOTAL 24,140
Table 6.1 cost analysis of project

71
71
8.PROBLEM FACED
8.1Sensor
The microwave Doppler radar sensor is not available in the local market of Nepal and had to
be ordered from abroad. It took about three months for the vendor to ship the sensor to Nepal.
The sensor initially worked well but quickly broke down due to some unseen reasons. It took
another few months for the next sensor to be available. Designing and real time testing was not
possible without the sensor and a huge time was wasted waiting for the piece to arrive.
The Hb100 sensor has a range of 10 meters which is not sufficient for a good speed detection
system. However this problem can be solved by using other sensors like DF00 which work on
the same principle but have effective range of upto 100 meters.
Also the sensor used has a wide angle of coverage. The sensor is affected not only by the
objects moving directly ahead but by the objects in the surrounding as well. The directivity of
the radiator can be improved by using a directional antenna.
The sensor detects the speed of not only moving vehicles but any moving object in its field of
view. This could be prevented by using a sensor whose radiation wavelength is of the order of
the dimension of vehicles.
8.2Camera
The type of camera required for our system is a high resolution high speed camera. Few
vendors could supply such camera but with cost that was far beyond our budget. There is a
different category of cameras made for the specific purpose of License Plate Recognition.
Such cameras use their own light of specific wave length and so are least affected by the
external lighting condition and illuminance of surface. But such camera was not affordable for
a student project like us and we had no resource to access and test one.

72
72
The camera we used is a 5 Megapixel High definition camera that comes with the raspberry pi.
It is easy to interface with the Pi board but the image quality is very poor and unacceptable for
image processing operation such as License Plate Recognition. The camera takes nearly one
second to take a picture of good quality but this time is not acceptable when working on the
road with vehicles running over 60 km/hr.
8.3Number Plate recognition
Optical Character recognition of the characters of Devnagari has been least explored in the
past. Very few attempts have been made to digitize the number plate written in Devnagari
characters. And the success of those works is also very limited. The accuracy of the systems
developed so far is far below the acceptable limit for designing any real time working system.
As such we had very little help from any experienced person who had worked in this field.
This posed a great problem for us and a lot of time had to be spent in reviewing the research
papers written on this topic.
Another problem faced in the Nepali Number Plate is the dissimilarity in the font used by
different persons. There is a standard for the font, height and width of the characters in the
plate. But inspection of a number of plates showed that the standard set by the government has
not been implemented effectively. So the dimension of the character and the font varies among
different number plates. Our approach of Character recognition in the number plate is by
template matching. So the accuracy of the system depends on the prior knowledge of the
dimension and style of the characters.
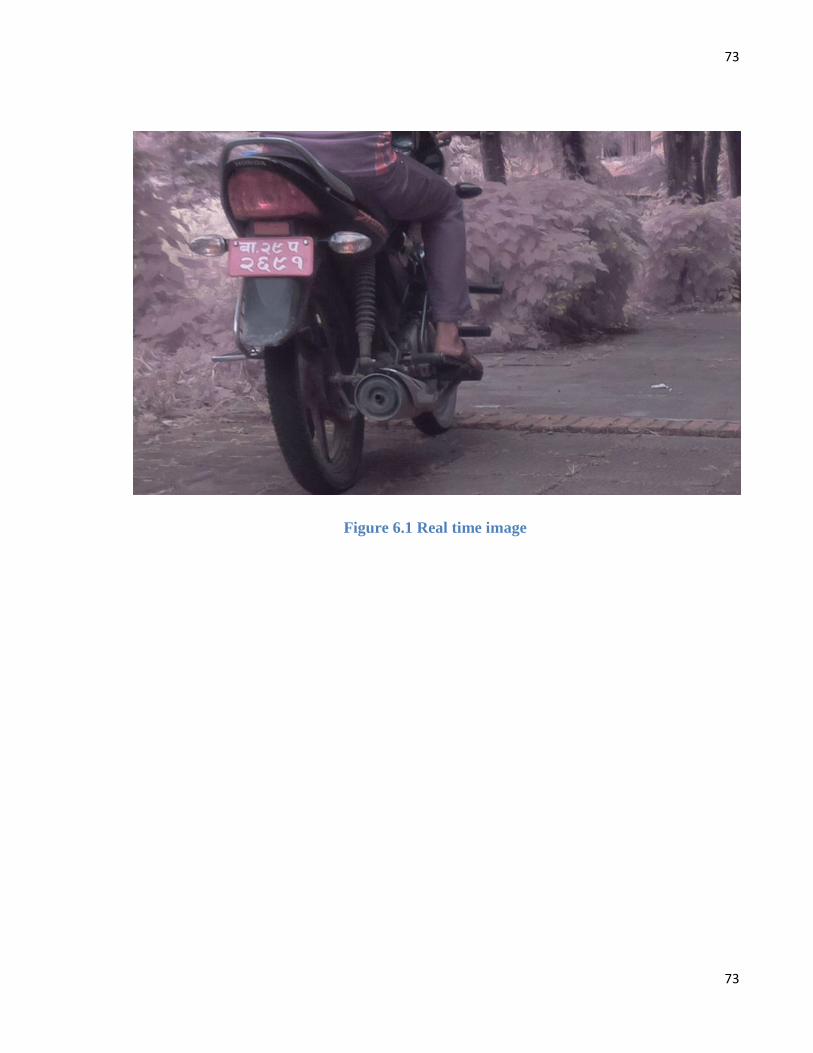
73
73
Figure 6.1 Real time image

74
74
8.LIMITATION AND FUTURE ENHANCEMENT
Although automatic systems are advantageous regarding the simplicity of the task, the
reliability won’t be like that from human work. At such, our system has different limitations
whose prime cause being the ones we discussed in problem Faced. Resolving these issues will
help to enhance our system to a level where following objectives could be met:
The stolen vehicle can be detected by comparing with the registered entry of stolen
vehicles.
Accuracy can be increased using Neural Networks. Advanced image processing
algorithms and libraries could be used so that the system can be used efficiently even
during unfavorable lighting conditions and during the night time as well.
Can be used as traffic counters to count the number of vehicles plying on a highway.
The Number plate of vehicle which has crossed over speed limit can be sent to mobile
of traffic police in the area using Android application.
Adding more vehicle detection wireless sensing networks and implementing a wireless
sensor network will be another interesting application which will open up much more
applications areas.
Security of data during communication can be another important work for the future
development of this project.
75
75
10.CONCLUSION
The designed speed detection system was capable of continuously monitoring the speed of the
approaching vehicle. The sensor worked well for the vehicle at a close range of about 7 meters.
The output was more accurate with no other moving objects in the surrounding. The value of
speed of each passing vehicle was displayed in the LCD display. With each over speeding
vehicle passing by the sensor, the camera was triggered and the image was saved in the SD
card. The image was also transferred to the server via internet where the image was processed
for the extraction of the characters from the number plate. The Number Plate Recognition
system was not perfect and requires modification. It accurately identified few of the characters
but not all. The character extraction also depended on the font and dimension of the character
as well. The system was more accurate in identifying the characters that was written in the
style similar to the one used in our template.

76
76
11.REFERENCES
1. Status Paper on Road Safety in Nepal 2013
2. "HB100 Motion Sensor Module" AgilSense. Web. 28 Apr. 2010.
3. Doppler effect
http://en.wikipedia.org/wiki/Doppler_effect
4. "LM324N Low Power Quad Operational Amplifiers" National Semi. Web. 28 Apr.
2010
5. Handy-arduino-r3-pinout-diagram
http://www.adafruit.com/blog/2012/05/25/handy-arduino-r3-pinout-diagram/
6. “Raspberry pi”
http://en.wikipedia.org/wiki/Raspberry_Pi
7. “JHD162A SERIES”
http://www.itron.com.cn/PDF_file/JHD162A SERIES.pdf
8. Vehicle and Transport Management Act of Nepal 2003
9. Vehicle License Plate Recognition (Shrestha L., Mishra P.,Bhagat R. and Pun T.)
10. Automatic License Plate Recognition using Python and OpenCV, K.M. Sajjad
11. “Segmentation”
http//vison.cse.psu.edu
77
77
12. “Image correlation”
http://en.wikipedia.org/wiki/Digital_image_correlation
13. ECE480: Design Team 6." ECE Design Team 6. Web. 07 Feb. 2010.
14. E. de la Rocha and R. Palacios, Image Processing Algorithms for Detecting and
Counting Vehicles Waiting at a Traffic Light, Journal of Electronic Imaging, October-
December 2010
15. E. de la Rocha and R. Palacios, Image Processing Algorithms for Detecting and
Counting Vehicles Waiting at a Traffic Light, Journal of Electronic Imaging, October-
December 2010
16. M. Fathy and M. Y. Siyal, A Window-Based Edge Detection Technique for Measuring
Road Traffic Parameters in Real-Time, Real-Time Imaging 1, pp. 297-305, Academic
Press, 1995.
17. “A License Plate Recognition and Speed Detection System” (C. Leo, D. David, 2008)
18. Nurhadiyatna A., Hardjono B. ” Vehicle speed measurement using camera as sensor”,
IEEE, Dec. 2012
19. Ji Ho Song, Dongkyun Kim “An FPGA-based vehicle speed measurement system
using an uncalibrated camera”, IEEE, Oct. 2010.
20. Misans P. ,Terauds, M.,“CW doppler radar based land vehicle speed measurement
algorithm using zero crossing and least squares method”, IEEE,Oct. 2012
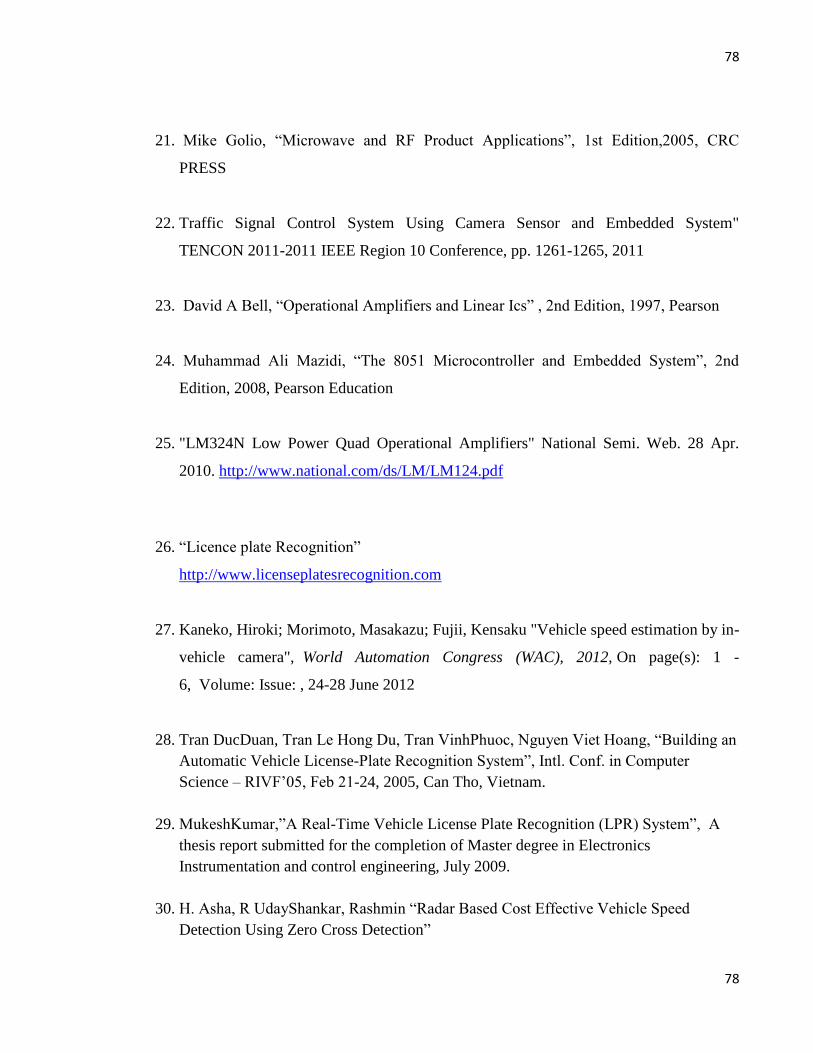
78
78
21. Mike Golio, “Microwave and RF Product Applications”, 1st Edition,2005, CRC
PRESS
22. Traffic Signal Control System Using Camera Sensor and Embedded System"
TENCON 2011-2011 IEEE Region 10 Conference, pp. 1261-1265, 2011
23. David A Bell, “Operational Amplifiers and Linear Ics” , 2nd Edition, 1997, Pearson
24. Muhammad Ali Mazidi, “The 8051 Microcontroller and Embedded System”, 2nd
Edition, 2008, Pearson Education
25. "LM324N Low Power Quad Operational Amplifiers" National Semi. Web. 28 Apr.
2010. http://www.national.com/ds/LM/LM124.pdf
26. “Licence plate Recognition”
http://www.licenseplatesrecognition.com
27. Kaneko, Hiroki; Morimoto, Masakazu; Fujii, Kensaku "Vehicle speed estimation by in-
vehicle camera", World Automation Congress (WAC), 2012, On page(s): 1 -
6, Volume: Issue: , 24-28 June 2012
28. Tran DucDuan, Tran Le Hong Du, Tran VinhPhuoc, Nguyen Viet Hoang, “Building an
Automatic Vehicle License-Plate Recognition System”, Intl. Conf. in Computer
Science – RIVF’05, Feb 21-24, 2005, Can Tho, Vietnam.
29. MukeshKumar,”A Real-Time Vehicle License Plate Recognition (LPR) System”, A
thesis report submitted for the completion of Master degree in Electronics
Instrumentation and control engineering, July 2009.
30. H. Asha, R UdayShankar, Rashmin “Radar Based Cost Effective Vehicle Speed
Detection Using Zero Cross Detection”

79
79
12.APPENDIX
Appendix A
Figure 12.1 Amplifier Schematic
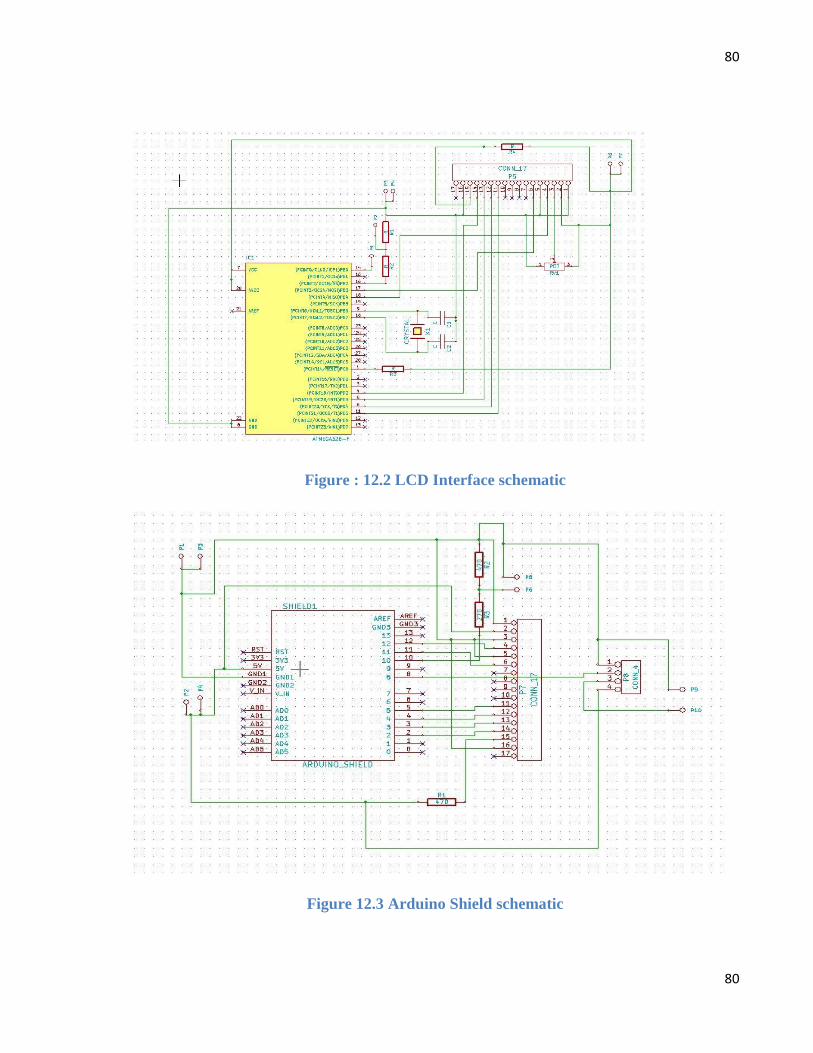
80
80
Figure : 12.2 LCD Interface schematic
Figure 12.3 Arduino Shield schematic

81
81
Appendix B
Figure 12.4 LCD Interface circuit PCB design
Figure 12.5 Amplifier PCB design

82
82
Appendix C
Figure 12.6 Amplifier
Figure 12.7 LCD Interface