a feature selection method using fixed-point algorithm...
TRANSCRIPT

A Feature Selection Method using Fixed-Point Algorithm for DNA microarray gene
expression data
Alok Sharma1,2,3, Kuldip K. Paliwal2, Seiya Imoto1, Satoru Miyano1, Vandana Sharma4,
Rajeshkannan Ananthanarayanan3
1Laboratory of DNA Information Analysis, Human Genome Center, Institute of Medical Science, University of Tokyo
4-6-1 Shirokanedai, Minato-ku, Tokyo, 108-8639, Japan; Tel. +81-3-5449-5615; Fax +81-3-5449-5442
Email: [email protected] 2School of Engineering, Griffith University
3School of Engineering and Physics, University of the South Pacific 4Fiji School of Medicine, University of the South Pacific
Abstract
As the performance of hardware is limited, the focus has been to develop objective,
optimized and computationally efficient algorithms for a given task. To this extent,
fixed-point and approximate algorithms have been developed and successfully applied
in many areas of research. In this paper we propose a feature selection method based on
fixed-point algorithm and show its application in the field of human cancer
classification using DNA microarray gene expression data. In the fixed-point algorithm,
we utilize between-class scatter matrix to compute the leading eigenvector. This
eigenvector has been used to select genes. In the computation of the eigenvector, the
eigenvalue decomposition of the scatter matrix is not required which significantly
reduces its computational complexity and memory requirement.
Introduction
Fixed-point algorithms have been recently applied to do many important applications
such as independent component analysis (ICA) (Hyvärinen and Oja, 1997) and principal
component analysis (PCA) (Sharma and Paliwal, 2007). Their popularity (Sajid et al.,
2008; Hazem, 2009; Ramesha and Raja, 2011; Qiu et al., 2010; Zhang et al., 2011; Chen
et al., 2008; 2009; 2010; Yang et al., 2009; Shi and Guo, 2009; Lai and Huang, 2010;
Wang et al., 2011; Albanese et al., 2012) is due to many reasons like low cost hardware
implementation, low memory requirement, less processing time and less computational
complexity.
In this paper, we propose a feature selection method using fixed-point algorithm of PCA
(Sharma and Paliwal, 2007). The fixed-point algorithm of PCA is also known as fast
PCA (FPCA) algorithm. The FPCA algorithm has been recently extended and applied in
face recognition (Sajid et al., 2008; Hazem, 2009; Ramesha and Raja, 2011),
communication (Qiu et al., 2010; Zhang et al., 2011), VLSI architecture design (Chen et
al., 2008; 2009; 2010) and in other areas or applications like in Yang et al., 2009; Shi and
Guo, 2009; Lai and Huang, 2010; Wang et al., 2011; Albanese et al., 2012. The feature
selection method plays a significant role in identifying crucial genes related to human
cancers. It helps in understanding the gene regulation mechanism of cancer
heterogeneity. We have carried out gene selection on DNA microarray gene expression
datasets. These datasets, consisting of several thousands of gene expression profiles,
have been widely used in the past for cancer classification problem. The fixed-point
algorithm for feature selection has been proposed for lower computational time and
memory requirement.
FPCA algorithm works on training data ndn
]x,,x,[xX 21 in a non-supervised
manner. It does not require class labels for individual feature vectors jx . In FPCA
algorithm, an eigenvector is computed by iteratively multiplying a covariance matrix
THHx (where μ)(x,μ),(xμ),(xH nn
211 and
n
j
jn
1
1 xμ is the centroid of
training data) with a random vector 1 dΦ and updating Φ as ΦΦ x . The
iteration process is terminated if some error criterion is below the threshold value.
The computational complexity of computing covariance matrix x is )( ndO 2 . If the
size of data dimensionality is very large then explicitly computing the covariance matrix
x would be expensive. In that case, the updating can be done in the following manner:
instead of computing x explicitly, a vector ΦHgT can be computed first, and then
Φ can be updated as HgΦ . The computation of vector g would require dn2 flops
and the computation of Φ using the product Hg would require dn2 flops. Therefore,
the total flops to compute Φ is dn4 per iteration.
It is known that both the range space and null space of between-class scatter matrix,
BS , contain significant discriminant information (Paliwal and Sharma, 2010).
Therefore, we use BS matrix by replacing x in the FPCA algorithm. We compute the
leading eigenvector recursively until the desired number of genes is selected. We have
compared the proposed method with other feature selection methods and promising
results have been obtained. Since FPCA algorithm has been used in our strategy, we do
not require to perform EVD of a matrix. This reduces the computational complexity and
memory requirement significantly. Our method is, therefore, suited for a low cost
hardware system.

Basic descriptions
In this section we describe the basic notations used in the paper. Let ]x,,x,[xX n21
denote n training samples (or feature vectors) in a d -dimensional space having class
labels },,,{ n 21 , where },,,{ c21 and c are the number of classes. The
dataset X can be subdivided into c subsets X1, X2,…, Xc, where Xj belongs to class j
and consists of jn number of samples such that
c
j
jnn1
. The data subset Xj X
and X1 X2 … Xc X. If jμ is the centroid of Xj and μ is the centroid of X,
then the between-class scatter matrix BS is defined as (Duda and Hart, 1973; Sharma
and Paliwal, 2008)
c
j
jjjB n1
Tμ)μ)(μ(μS ,
where
j
jnj
Xx
xμ 1
and
Xx
xμn1
The between-class scatter matrix is a positive-semidefinite symmetric matrix which can
be formed by using rectangular matrix; i.e., TBBS B , where rectangular matrix
cdB can be defined as (Sharma and Paliwal, 2012)
μ)(μ,μ),(μμ),(μB ccnnn 2211 . (1)
The fixed-point algorithm for gene selection
The between-class scatter matrix BS contains significant discriminant information for
classification (Paliwal and Sharma, 2010). We utilize BS and apply it in the framework
of FPCA. The obtained orientation matrix W from this procedure will be orthogonal.
However, we are interested only in the leading eigenvector for gene selection. We modify
the step of ΦΦ x of FPCA procedure as follows:
wSw B , (2)
w orthonormalize (w) . (3)
Since for DNA microarray gene expression data, the size of BS matrix will be too large
(as nd ), we can update equation 2 into two steps as:
wBwT , (4)
Bww . (5)
If we define the fixed-point algorithm of Sharma and Paliwal (2007) as )(H,Φ hFPAj
(where THHx and h is the number of eigenvectors required) then the above

procedure can be given as )(B,w 1 FPA . The computational complexity for obtaining
in equation 4 is dc2 and in equation 5 is dc2 . Therefore, the total computational
complexity is dc4 (in equations 4 and 5).
The vector dw is, therefore, used to transform -dimensional space to
1-dimensional space. Let Xx be any feature vector, we have
xwTy ,
or
d
i
ii xwy1
, (6)
where iw and ix are the elements of w and x , respectively. It can be envisaged that
if 0|| ii xw (where |.| is the absolute value), then i th element is not contributing for
the value of y in equation 6; i.e., it can be discarded without sacrificing much
information. Therefore, we have
n
j
ijii xwz1
|| (7)
where di ,,, 21 . If 0iz , then i th feature can be discarded. Equation 7 can be
applied recursively to discard unimportant features. The procedure is depicted in Table
1.
Table 1: Gene selection procedure using fixed-point algorithm
Step 0. Define q the number of genes required and set dl .
Step 1. Compute lw using fixed-point algorithm )(B,w 1 FPA .
Step 2. Compute iz using equation 7 for li ,,, 21 .
Step 3. Sort iz in descending order; i.e., if )( izsorts then lsss 21 .
Step 4. Discard least important feature corresponding to ls . Let the cardinality of the
remaining feature set be 1l and data subset be nll
1X .
Step 5. Conduct 1 lXX and 1 ll .
Step 6. Continue Steps 1-5 until ql .
The above process will give q genes with the data subset nqq
X , which can be used
by a classifier to obtain classification performance.

Experimentation
In this experiment we have utilized three DNA microarray gene expression datasets1.
The description of these datasets is given as follows:
ALL dataset (Golub et al., 1999): this dataset consists of DNA microarray gene
expression data of human acute leukemia for cancer classification. Two types of acute
leukemia data are provided for classification namely acute lymphoblastic leukemia
(ALL) and acute myeloid leukemia (AML). The dataset is subdivided into 38 training
samples and 34 test samples. The training set consists of 38 bone marrow samples (27
ALL and 11 AML) over 7129 probes. The test set consists of 34 samples with 20 ALL and
14 AML, prepared under different experimental conditions. All the samples have 7129
dimensions and all are numeric.
SRBCT dataset (Khan et al., 2001): the small round blue-cell tumor dataset consists of
83 samples, each having 2308 genes. This is a four class classification problem. The
tumors are Burkitt lymphoma (BL), the Ewing family of tumors (EWS), Neuroblastoma
(NB) and Rhabdomyosarcoma (RMS). There are 63 samples for training and 20 samples
for testing. The training set consists of 8, 23, 12 and 20 samples of BL, EWS, NB and
RMS respectively. The test set consists of 3, 6, 6 and 5 samples of BL, EWS, NB and
RMS respectively.
MLL Leukemia dataset (Armstrong et al., 2002): this dataset has 3 classes namely ALL,
MLL and AML. The training set contains 57 leukemia samples (20 ALL, 17 MLL and 20
AML) whereas the test set contains 15 samples (4 ALL, 3 MLL and 8 AML). The
dimension of MLL dataset is 12582.
The classification performance of the proposed feature selection method has been
measured on these three DNA microarray gene expression datasets. Table 2 and Table 3
show classification accuracy of the proposed method compared with several other
existing feature selection methods. We use J4.8 and Naïve Bayes classifiers from
WEKA2. The classification accuracy for SRBCT and MLL datasets is obtained from Tao
1 Most of the datasets are downloaded from the Kent Ridge Bio-medical Dataset (KRBD)
(http://datam.i2r.a-star.edu.sg/datasets/krbd/). The datasets are transformed or reformatted and made available by
KRBD repository and we have used them without any further preprocessing. Some datasets which are not available
on KRBD repository are downloaded and directly used from respective authors’ supplement link. The URL addresses
for all the datasets are given in the Reference Section.
2 http://www.cs.waikato.ac.nz/ml/weka/
et al. 2004. For Acute Leukemia dataset, the features are ranked by Rankgene program
(Su et al., 2003). For all the datasets, we select 150 genes as done by Tao et al., 2004.
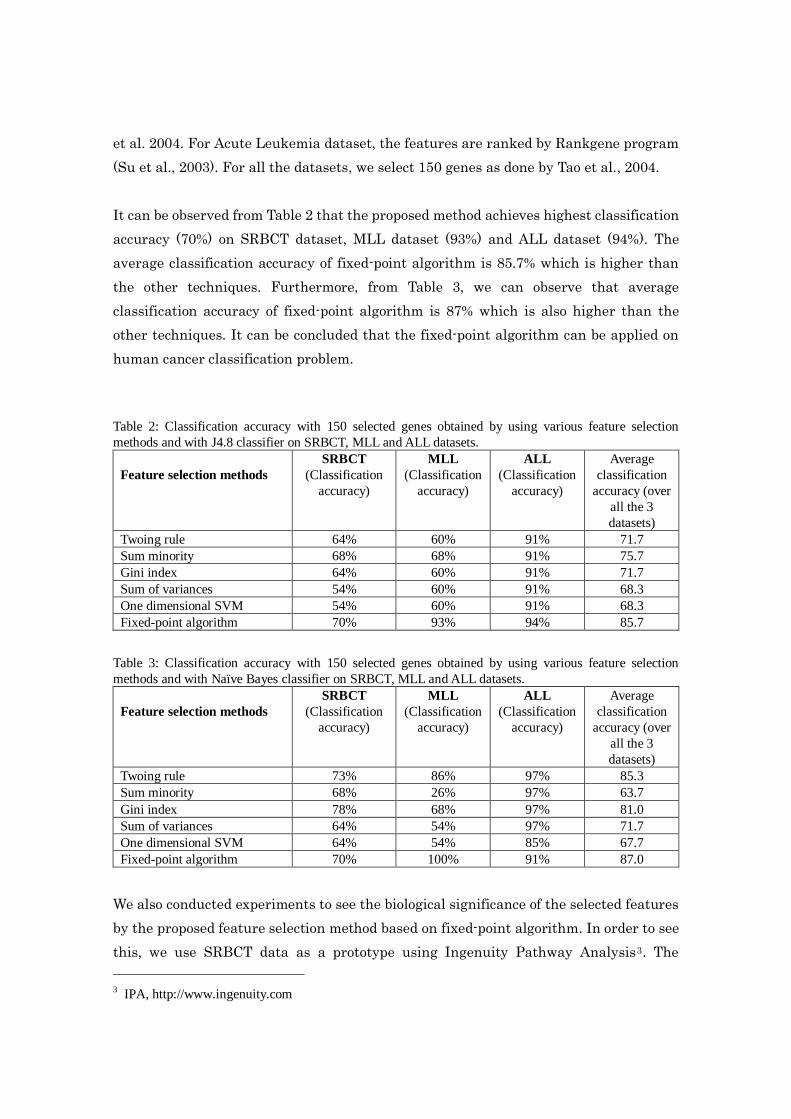
It can be observed from Table 2 that the proposed method achieves highest classification
accuracy (70%) on SRBCT dataset, MLL dataset (93%) and ALL dataset (94%). The
average classification accuracy of fixed-point algorithm is 85.7% which is higher than
the other techniques. Furthermore, from Table 3, we can observe that average
classification accuracy of fixed-point algorithm is 87% which is also higher than the
other techniques. It can be concluded that the fixed-point algorithm can be applied on
human cancer classification problem.
Table 2: Classification accuracy with 150 selected genes obtained by using various feature selection
methods and with J4.8 classifier on SRBCT, MLL and ALL datasets.
Feature selection methods
SRBCT
(Classification
accuracy)
MLL
(Classification
accuracy)
ALL
(Classification
accuracy)
Average
classification
accuracy (over
all the 3
datasets)
Twoing rule 64% 60% 91% 71.7
Sum minority 68% 68% 91% 75.7
Gini index 64% 60% 91% 71.7
Sum of variances 54% 60% 91% 68.3
One dimensional SVM 54% 60% 91% 68.3
Fixed-point algorithm 70% 93% 94% 85.7
Table 3: Classification accuracy with 150 selected genes obtained by using various feature selection
methods and with Naïve Bayes classifier on SRBCT, MLL and ALL datasets.
Feature selection methods
SRBCT
(Classification
accuracy)
MLL
(Classification
accuracy)
ALL
(Classification
accuracy)
Average
classification
accuracy (over
all the 3
datasets)
Twoing rule 73% 86% 97% 85.3
Sum minority 68% 26% 97% 63.7
Gini index 78% 68% 97% 81.0
Sum of variances 64% 54% 97% 71.7
One dimensional SVM 64% 54% 85% 67.7
Fixed-point algorithm 70% 100% 91% 87.0
We also conducted experiments to see the biological significance of the selected features
by the proposed feature selection method based on fixed-point algorithm. In order to see
this, we use SRBCT data as a prototype using Ingenuity Pathway Analysis3. The
3 IPA, http://www.ingenuity.com
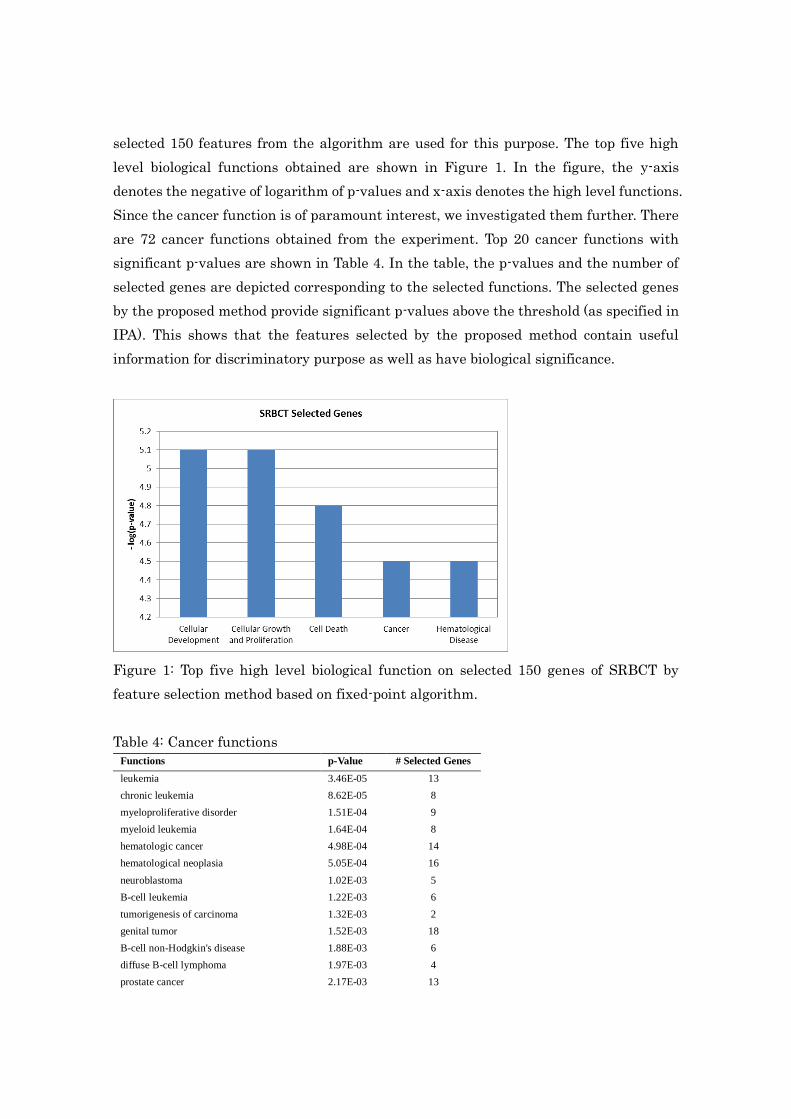
selected 150 features from the algorithm are used for this purpose. The top five high
level biological functions obtained are shown in Figure 1. In the figure, the y-axis
denotes the negative of logarithm of p-values and x-axis denotes the high level functions.
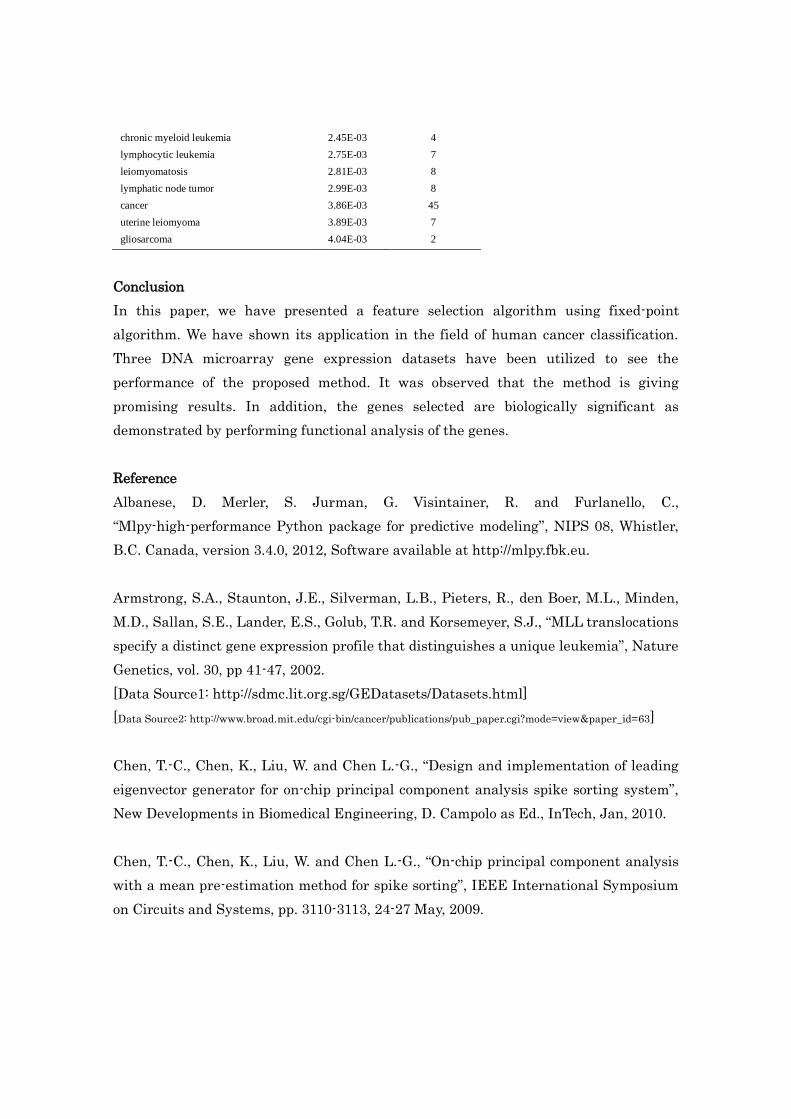
Since the cancer function is of paramount interest, we investigated them further. There
are 72 cancer functions obtained from the experiment. Top 20 cancer functions with
significant p-values are shown in Table 4. In the table, the p-values and the number of
selected genes are depicted corresponding to the selected functions. The selected genes
by the proposed method provide significant p-values above the threshold (as specified in
IPA). This shows that the features selected by the proposed method contain useful
information for discriminatory purpose as well as have biological significance.
Figure 1: Top five high level biological function on selected 150 genes of SRBCT by
feature selection method based on fixed-point algorithm.
Table 4: Cancer functions
Functions p-Value # Selected Genes
leukemia 3.46E-05 13
chronic leukemia 8.62E-05 8
myeloproliferative disorder 1.51E-04 9
myeloid leukemia 1.64E-04 8
hematologic cancer 4.98E-04 14
hematological neoplasia 5.05E-04 16
neuroblastoma 1.02E-03 5
B-cell leukemia 1.22E-03 6
tumorigenesis of carcinoma 1.32E-03 2
genital tumor 1.52E-03 18
B-cell non-Hodgkin's disease 1.88E-03 6
diffuse B-cell lymphoma 1.97E-03 4
prostate cancer 2.17E-03 13
chronic myeloid leukemia 2.45E-03 4
lymphocytic leukemia 2.75E-03 7
leiomyomatosis 2.81E-03 8
lymphatic node tumor 2.99E-03 8
cancer 3.86E-03 45
uterine leiomyoma 3.89E-03 7
gliosarcoma 4.04E-03 2
Conclusion
In this paper, we have presented a feature selection algorithm using fixed-point
algorithm. We have shown its application in the field of human cancer classification.
Three DNA microarray gene expression datasets have been utilized to see the
performance of the proposed method. It was observed that the method is giving
promising results. In addition, the genes selected are biologically significant as
demonstrated by performing functional analysis of the genes.
Reference
Albanese, D. Merler, S. Jurman, G. Visintainer, R. and Furlanello, C.,
“Mlpy-high-performance Python package for predictive modeling”, NIPS 08, Whistler,
B.C. Canada, version 3.4.0, 2012, Software available at http://mlpy.fbk.eu.
Armstrong, S.A., Staunton, J.E., Silverman, L.B., Pieters, R., den Boer, M.L., Minden,
M.D., Sallan, S.E., Lander, E.S., Golub, T.R. and Korsemeyer, S.J., “MLL translocations
specify a distinct gene expression profile that distinguishes a unique leukemia”, Nature
Genetics, vol. 30, pp 41-47, 2002.
[Data Source1: http://sdmc.lit.org.sg/GEDatasets/Datasets.html]
[Data Source2: http://www.broad.mit.edu/cgi-bin/cancer/publications/pub_paper.cgi?mode=view&paper_id=63]
Chen, T.-C., Chen, K., Liu, W. and Chen L.-G., “Design and implementation of leading
eigenvector generator for on-chip principal component analysis spike sorting system”,
New Developments in Biomedical Engineering, D. Campolo as Ed., InTech, Jan, 2010.
Chen, T.-C., Chen, K., Liu, W. and Chen L.-G., “On-chip principal component analysis
with a mean pre-estimation method for spike sorting”, IEEE International Symposium
on Circuits and Systems, pp. 3110-3113, 24-27 May, 2009.

Chen, T.-C., Liu, W. and Chen L.-G., “VLSI architecture of leading eigenvector
generation for on-chip principal component analysis spike sorting system”, IEEE EMBS
30th Annual International Conference, Canada, pp. 20-24, 2008.
Duda, R.O. and Hart, P.E., Pattern classification and scene analysis, Wiley, New York,
1973.
Golub, T.R., Slonim, D.K., Tamayo, P., Huard, C., Gaasenbeek, M., Mesirov, J.P., Coller,
H., Loh, M.L., Downing, J.R., Caligiuri, M.A., Bloomfield, C.D. and Lander E.S.,
Molecular classification of cancer: class discovery and class prediction by gene
expression monitoring. Science, vol. 286, 531-537, 1999.
Hazem, M.El-B., “New fast principal component analysis for real-time face detection”,
Machine Graphics & Vision International Journal, vol. 18, issue 4, pp. 405-426, 2009.
Hyvärinen, A. and Oja, E., “A fast fixed-point algorithm for independent component
analysis”, Neural Computation, vol. 9, no. 7, 1483-1492, 1997.
Khan, J., Wei, J.S., Ringner, M., Saal, L.H., Ladanyi, M., Westermann, F., Berthold, F.,
Schwab, M., Antonescu, C.R., Peterson C. and Meltzer, P.S., “Classification and
diagnostic prediction of cancers using gene expression profiling and artificial neural
network”, Nature Medicine, vol. 7, pp. 673-679, 2001.
[Data Source: http://research.nhgri.nih.gov/microarray/Supplement/]
Lai, J.Z.C. and Huang, T.-J., “Fast global k-means clustering using cluster member and
inequality”, Pattern Recognition, vol. 43, pp. 1954-1963, 2010.
Paliwal, K.K. and Sharma, A., “Improved direct LDA and its application to DNA
microarray gene expression data”, Pattern Recognition Letters, vol. 31, issue 16, pp.
2489-2492, 2010.
Qiu, R.C., Chen, Z., Guo, N., Song, Y., Zhang, P., Li, H. and Lai, L., “Towards a
Real-Time Cognitive Radio Network Testbed: Architecture, Hardware Platform, and
Application to Smart Grid”, Fifth IEEE Workshop on Networking Technologies for
Software Defined Radio (SDR) Networks, 21-21 June, Boston, MA, USA, 2010.

Ramesha, K. and Raja, K.B., “Face recognition system using discrete wavelet transform
and fast PCA”, Information Technology and Mobile Communication, Communications in
Computer and Information Science, vol. 147, part 1, pp. 13-18, 2011.
Sajid, I., Ahmed, M.M. and Taj, I., “Design and Implementation of a Face Recognition
System Using Fast PCA”, International Symposium on Computer Science and its
Applications, CSA’08, pp. 126-130, 2008.
Sharma, A. and Paliwal, K.K., “Fast Principal Component Analysis using Fixed-Point
Algorithm”, Pattern Recognition Letters, vol. 28, issue 10, pp. 1151-1155, 2007.
Sharma, A. and Paliwal, K.K., “A gradient linear discriminant analysis for small sample
sized problem”, Neural Processing Letters, vol. 27, no. 1, pp 17-24, 2008.
Sharma, A. and Paliwal, K.K., “A new perspective to null linear discriminant analysis
method and its fast implementation using random matrix multiplication with scatter
matrices”, Pattern Recognition, vol. 45, pp. 2205-2213, 2012.
Shi, W. and Guo, Y.-F., “Nonlinear component analysis for large-scale data set using
fixed-point algorithm”, Advances in Neural Networks, Lecture Notes in Computer
Science, vol. 5553, pp. 144-151, 2009.
Su, Y., Murali, T.M., Pavlovic, V. and Kasif, S., RankGene: identification of diagnostic
genes based on expression data, Bioinformatics, pp. 1578–1579, 2003.
Tao L., Zhang, C. and Ogihara, M., “A comparative study of feature selection and
multiclass classification methods for tissue classification based on gene expression”,
Bioinformatics, vol, 20, no. 14, pp. 2429-2437, 2004.
Wang, J., Barreto, A., Rishe, N. and Andrian, J., “A fast incremental multilinear
principal component analysis algorithm”, International Journal of Innovative
Computing, Information and Control, vol. 7, no. 10, pp. 6019-6040, 2011.
Yang, C., Wang, L. and Feng, J., “A novel margin based algorithm for feature extraction”,
New Generation Computing, vol. 27, pp. 285-305, 2009.

Zhang, P., Qiu, R. and Guo, N., “Demonstration of spectrum sensing with blindly
learned features”, IEEE Communication Letters, vol. 15, no. 5, pp. 548-550, 2011.