a feasibility study on whether we can get more than … · a feasibility study on whether we can...
TRANSCRIPT

BUEC 560 – Energy Technologies and Institutions
A feasibility study on whether we can get more than just
Oil from the Oilsands.
Prof: Joseph Doucet
By: Sukhraj Batoo
I.D: 281764
Submitted: June 12th 2005

1
Table of Contents Introduction.........................................................................................................2 What are NGLs?..................................................................................................3 Product Price Evaluation and Potential Markets..............................................3
Product price Evaluation ...................................................................................3 Potential Markets...............................................................................................7
Production Inputs Availability (Fuel Gas Supply) ............................................9 Syncrude ...........................................................................................................9 Suncor (Excerpt from Williams Energy Annual Report).....................................9
Process Description (Removal of NGLs from fuel gas).................................10 Cost Benefit Analysis .......................................................................................11
Fixed Capital and Operating Costs..................................................................11 Pricing of products...........................................................................................11 Costs and Revenue.........................................................................................13
Costs ...........................................................................................................13 Cash generated from Operation (assuming 100% plant efficiency): ............14
Cash Flow Analysis ..........................................................................................14 Sensitivity Analysis ..........................................................................................17 Environmental Impact ......................................................................................18 Conclusion ........................................................................................................19 References ........................................................................................................20
WebPages.......................................................................................................20 Appendix A........................................................................................................22
List of Figures Figure 1. Price trends of natural gas over the past year .................................4 Figure 2. Historical trend of NGL prices over a period of a decade ...............5 Figure 3. Historical trend of Ethane prices over a period of a decade...........6 Figure 4. NGL Pipeline Network…………………………………………………….7 Figure 5. Sensitivity Analysis ..........................................................................17

2
Introduction
Alberta has massive deposits of oil sands, which are located primarily in the
Athabasca, Peace River and Cold Lake regions. Estimates place the number of
barrels of bitumen, locked in the oilsands, to be anywhere from 1.6 to 2.5 trillion
barrels (http://www.oilsandsdiscovery.com/oil_sands_story/resource.html). The
oil sands industry is extremely capital intensive; nevertheless, with crude oil
prices at their current levels, companies continue to invest heavily in the oil
sands. Current forecasts project that the oil sands industry will spend about $61
billion on new projects over the next ten years (Alberta Economic Development).
Ongoing expansion projects, and the construction of new plants, suggest that
there will be a rise in the number of upgraders in the Athabasca region.
Upgrading facilities, primarily amine units, are major producers of fuel gas.
Therefore, all this activity in the oil sands will result in an overall increase in the
amount of fuel gas being produced in the region.
Fuel gas is a mixture, which is made up of: methane, ethane, propylene,
propane, butane, butylenes, hydrogen, n-pentane, carbon monoxide, nitrogen,
water and some impurities. It is normally used to run furnaces, preheaters, sulfur
plants and can also be used to generate electricity and steam.
Ongoing cost reduction and energy saving initiatives in the energy sector are
forcing companies to explore and implement new technologies. One such
example is the use of trucks and shovels, as opposed to draglines and bucket-
wheels, to help reduce electricity consumption. Another is the lowering of
process operating temperatures in extraction processes to help reduce steam
3
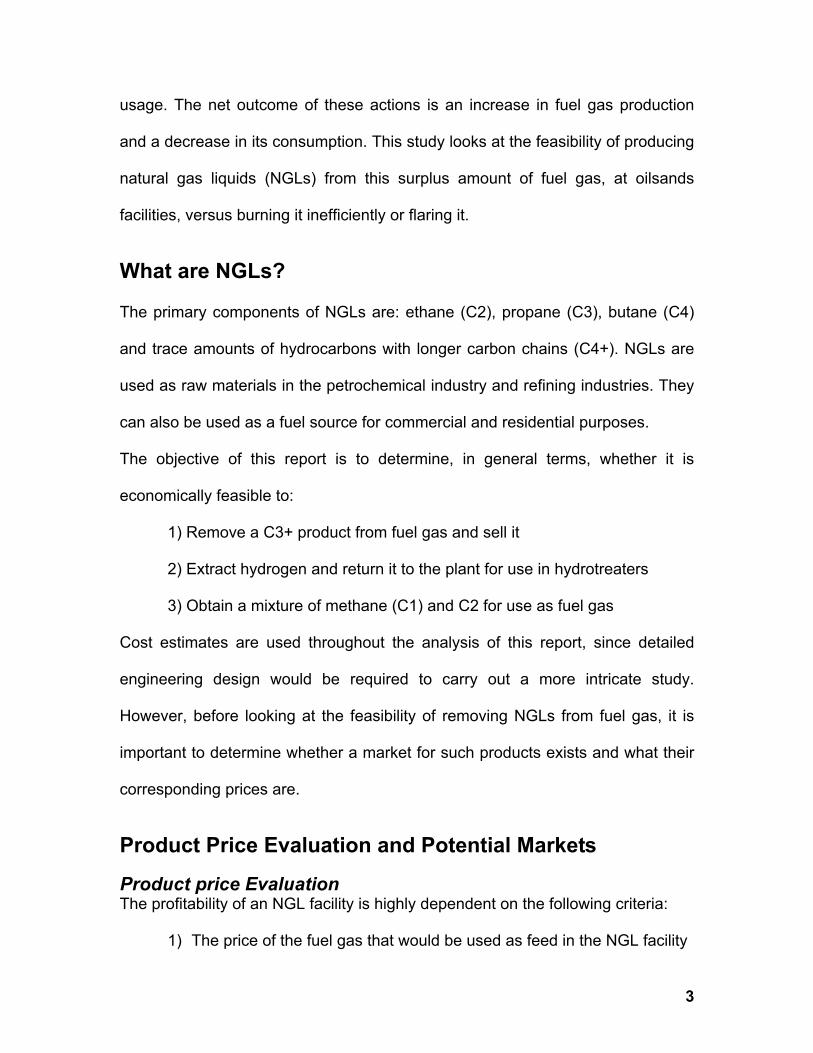
usage. The net outcome of these actions is an increase in fuel gas production
and a decrease in its consumption. This study looks at the feasibility of producing
natural gas liquids (NGLs) from this surplus amount of fuel gas, at oilsands
facilities, versus burning it inefficiently or flaring it.
What are NGLs?
The primary components of NGLs are: ethane (C2), propane (C3), butane (C4)
and trace amounts of hydrocarbons with longer carbon chains (C4+). NGLs are
used as raw materials in the petrochemical industry and refining industries. They
can also be used as a fuel source for commercial and residential purposes.
The objective of this report is to determine, in general terms, whether it is
economically feasible to:
1) Remove a C3+ product from fuel gas and sell it
2) Extract hydrogen and return it to the plant for use in hydrotreaters
3) Obtain a mixture of methane (C1) and C2 for use as fuel gas
Cost estimates are used throughout the analysis of this report, since detailed
engineering design would be required to carry out a more intricate study.
However, before looking at the feasibility of removing NGLs from fuel gas, it is
important to determine whether a market for such products exists and what their
corresponding prices are.
Product Price Evaluation and Potential Markets
Product price Evaluation The profitability of an NGL facility is highly dependent on the following criteria:
1) The price of the fuel gas that would be used as feed in the NGL facility

4
2) The price of the fuel gas that would be sent back to the oil sands
operation (C1 and C2 mixture)
3) The price at which the NGLs can be sold
4) The cost of hydrogen to one of these facilities.
These prices would all depend upon the BTU (burning) value of these products,
which is highly influenced by natural gas prices. This would suggest that the
feasibility of starting an NGL production plant would therefore be determined by
the market price of natural gas. Figure 1 shows the fluctuation of natural gas
prices over the past year.
Figure 1. Price trends of natural gas over the past year

5
Figure 1 shows that the price of natural gas is quite stable on average, though
some sudden price hikes do happen over the course of a year. During price
spikes it makes more sense to burn heavier hydrocarbons, rather than sell them,
because of the lower shrinkage value.
As a result, NGL market prices vary with time. Over the past 10 years, average
NGL and ethane prices have been on the rise. This general trend is shown in
Figures 2 and 3.
Figure 2. Historical trend of NGL prices over a period of a decade It is important to note that both figures only show a historical trend over the past
decade, and do not forecast the NGL or ethane market prices.
6
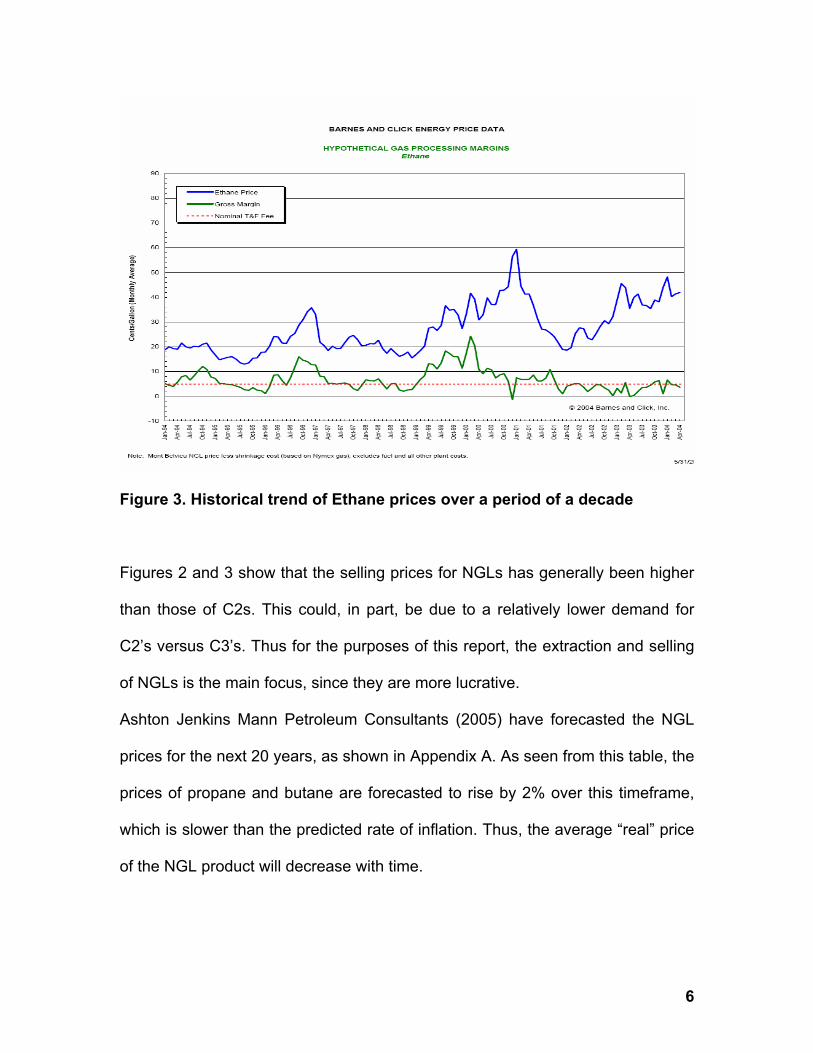
Figure 3. Historical trend of Ethane prices over a period of a decade
Figures 2 and 3 show that the selling prices for NGLs has generally been higher
than those of C2s. This could, in part, be due to a relatively lower demand for
C2’s versus C3’s. Thus for the purposes of this report, the extraction and selling
of NGLs is the main focus, since they are more lucrative.
Ashton Jenkins Mann Petroleum Consultants (2005) have forecasted the NGL
prices for the next 20 years, as shown in Appendix A. As seen from this table, the
prices of propane and butane are forecasted to rise by 2% over this timeframe,
which is slower than the predicted rate of inflation. Thus, the average “real” price
of the NGL product will decrease with time.

7
Potential Markets
NGL products can be sold to various customers across Canada and the United
States. One option would be to sell the NGL product to a NGL pipeline network
through either the Transcanada or Alliance pipeline, as shown below. Figure 4
shows the elaborate NGL pipeline network that exists in North America.
Figure 4: NGL Pipeline Network
(Source:http://www.neb.gc.ca/energy/emangl_e.pdf)
As seen in this figure the NGL product could be sold to a vast number of
customers in North America. Another option would be to sell the C3 product to
Williams Energy, which is an olefins cryogenic liquids extraction facility near
Suncor in Fort McMurray, Alberta. Williams currently has a process in place to
remove NGLs from Suncor’s fuel gas. After the NGLs are produced they are sent
in batches down the Suncor pipeline to another William’s plant near Edmonton

8
for further processing. Williams Energy would be an ideal company to sell NGLs
to, since this would avoid having to incur high transportation costs associated
with sending the product to customers in Edmonton or south of the border. The
Syncrude pipeline could also be considered as a means of transporting the NGL
product, if the Suncor pipeline is already operating at maximum capacity. Using
current pipeline infrastructure, to deliver the NGL product south of Fort
McMurray, would help reduce the need for a new pipeline (and would thus
reduce initial capital costs for such a project).
Although NGLs are important commodities in Alberta (and Canada), the most
important components within the fuel gas are unsaturated hydrocarbons such as
propylene and butylenes. Propylene, especially, is an important commodity in
Alberta. It can be used in the petrochemical industry to make all sorts of different
products, namely: polypropylene, acrylonitrile, phenol, acrylic acid and propylene
oxide. Propylene can also be used at refineries in alkylate production. Alberta
Department of Economic Development recently submitted a report detailing the
possibility of building a full-scale polypropylene plant using the off gas from a
number of sources such as Suncor and Syncrude Canada Limited. The report
states that a prudent chemical company would require a steady flow of 200,000
kilotons/year (kty) of propylene for a world scale facility in Alberta to be viable.
Syncrude and Suncor, according to this document, were projected as being able
to supply 195 kty of propylene mixture in 2005. With two new upgraders currently
being built at both of these sites, and the start up of Canadian Natural Resources

9
Ltd’s “Horizon” project, the supply of propylene mixture would far exceed the
195-kty requirement in the near future.
Production Inputs Availability (Fuel Gas Supply)
Syncrude
Syncrude is stated as being a source of propylene, which could have around
135kty of a C3+ mix. This mix could have about 40% of propylene (Alberta
Development and Economic Development, AD&ED).
Rough estimates at this oil sands company indicates that there is about 117
millions of standard cubic feet per day (MMscfd) of fuel gas produced, which has
the following composition (rough breakdown): Methane = 37%; C2 = 14%;
propane = 9%; propylene = 6%; Hydrogen = 20%; C4+ ~ 3%
Suncor (Excerpt from Williams Energy Annual Report)
“Our Canadian operations include an olefins liquids extraction plant located near
Ft. McMurray, Alberta and an olefin fractionation facility near Edmonton, Alberta.
These facilities extract olefin liquids from the off-gas produced from oil sands
bitumen upgrading and then fractionate, treat, store and terminal the propane
and propylene recovered from this process. During 2004, approximately 1.9
million barrels of propane and 129 million pounds of polymer grade propylene
were produced. We continue to be the only olefin fractionators in Western
Canada and the only treater/processor of oil sands off-gas. These operations
extract valuable petrochemical feed stocks from tar sands refinery off-gas
10
streams allowing our customers to burn cleaner natural gas streams and reduce
overall air emissions.” [http://www.williams.com/investors/docs/04annual.pdf]
Thus as this excerpt indicates, there are adequate supplies of NGLs at oil sands
facilities.
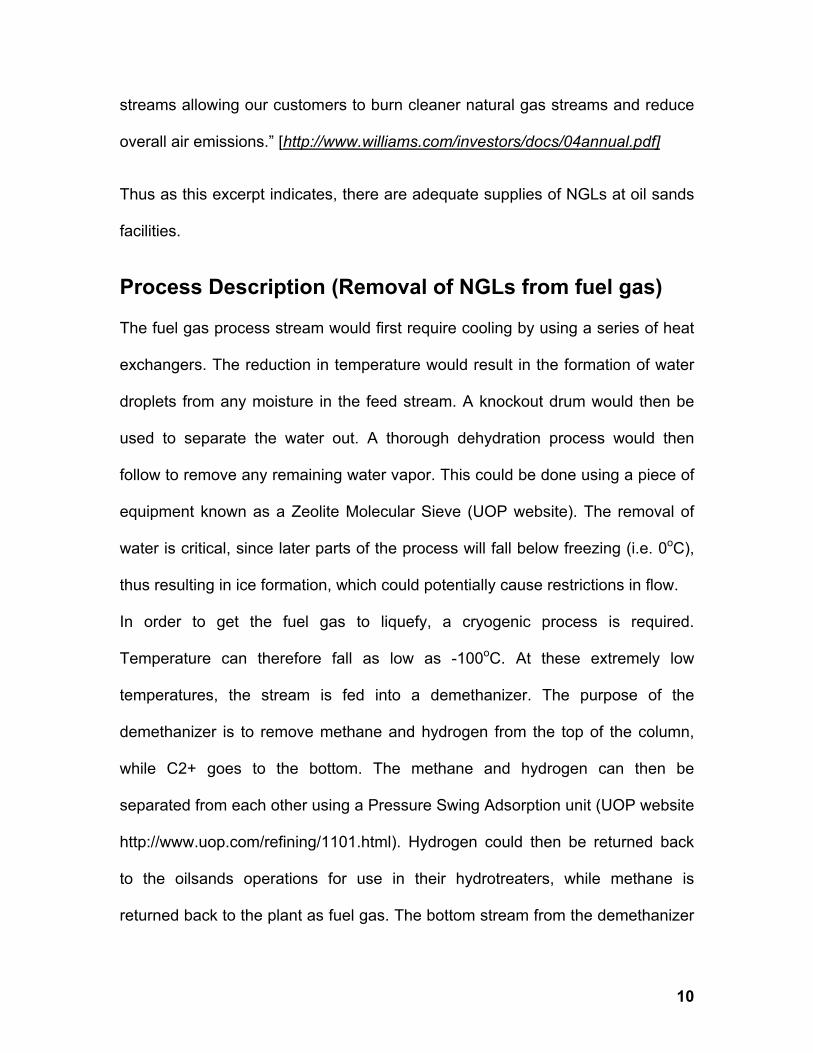
Process Description (Removal of NGLs from fuel gas)
The fuel gas process stream would first require cooling by using a series of heat
exchangers. The reduction in temperature would result in the formation of water
droplets from any moisture in the feed stream. A knockout drum would then be
used to separate the water out. A thorough dehydration process would then
follow to remove any remaining water vapor. This could be done using a piece of
equipment known as a Zeolite Molecular Sieve (UOP website). The removal of
water is critical, since later parts of the process will fall below freezing (i.e. 0oC),
thus resulting in ice formation, which could potentially cause restrictions in flow.
In order to get the fuel gas to liquefy, a cryogenic process is required.
Temperature can therefore fall as low as -100oC. At these extremely low
temperatures, the stream is fed into a demethanizer. The purpose of the
demethanizer is to remove methane and hydrogen from the top of the column,
while C2+ goes to the bottom. The methane and hydrogen can then be
separated from each other using a Pressure Swing Adsorption unit (UOP website
http://www.uop.com/refining/1101.html). Hydrogen could then be returned back
to the oilsands operations for use in their hydrotreaters, while methane is
returned back to the plant as fuel gas. The bottom stream from the demethanizer
11
goes on to a deethanizer. The deethanizer then removes C2’s from the feed
stream. The C2’s are collected at the top of the tower while the C3+ mix is
collected at the bottom and sold as the NGL product. The C2’s can be returned
to the plant as fuel gas. (AD&ED)
Cost Benefit Analysis
Fixed Capital and Operating Costs
Total fixed capital costs are estimated at being anywhere from 60 to 100 million
(AD&ED). For the purpose of this paper an average fixed cost of $100 million is
used. The AD&ED report also states that the operating costs (likely Utility and
Labor) for such a facility are estimated at ranging from $7 to $12 million per
annum. The feed price, based on its heating value, would be around $326 million
per year, based on a natural gas price of $7.00GJ. Therefore total operating
costs would be somewhere in the order of $338 million (326+12 million).
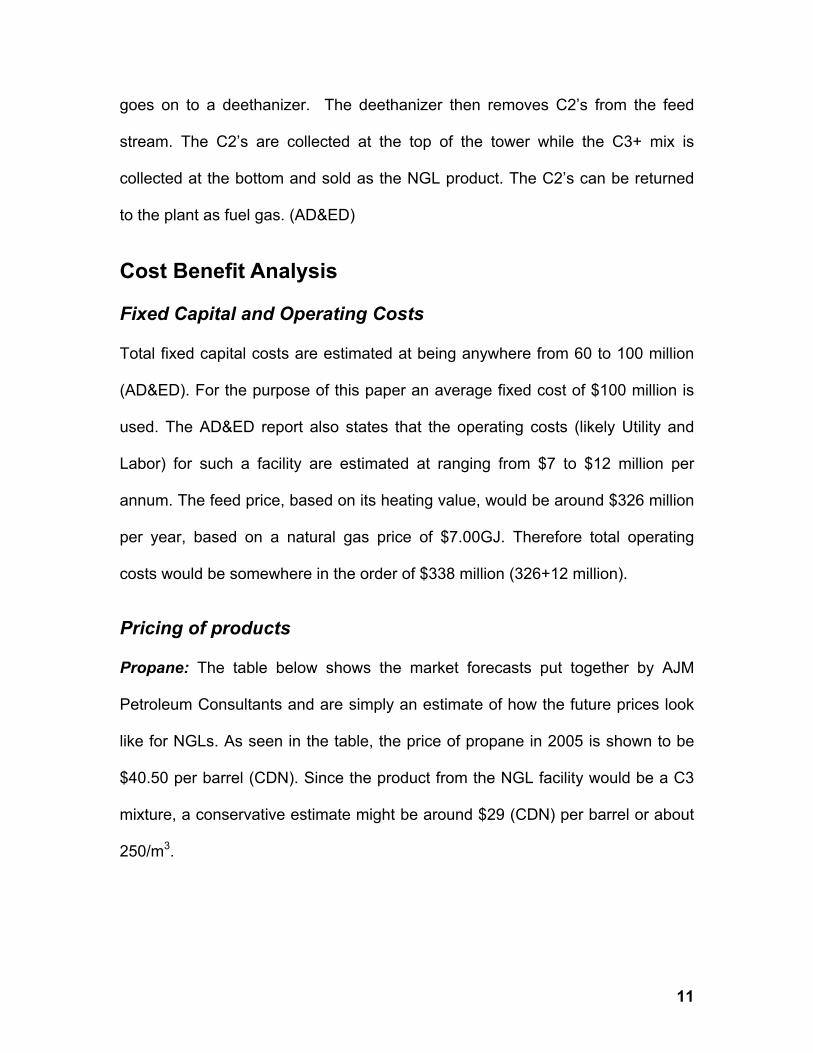
Pricing of products
Propane: The table below shows the market forecasts put together by AJM
Petroleum Consultants and are simply an estimate of how the future prices look
like for NGLs. As seen in the table, the price of propane in 2005 is shown to be
$40.50 per barrel (CDN). Since the product from the NGL facility would be a C3
mixture, a conservative estimate might be around $29 (CDN) per barrel or about
250/m3.

12
Hydrogen: “At large oil refineries, hydrogen can be produced from natural gas at
a cost of $0.71/kg or $0.18/100cf. This low cost is based on a $3/MMBTU price
for natural gas.” (http://www.islandnet.com/%7Ehburke/hydrogen.htm)
This information was used to calculate a hydrogen price of $1.70/kg for a natural
gas price of $7.20/MMBTU (CAD$). For this report, $1.70/kg is used as a
conservative selling price for hydrogen, even though this would be the cost to
produce it. This helps compensate for inefficiencies and other operating costs
that might have been overlooked in this analysis.
PRICE AND MARKET DEMAND FORECASTS Base Case Forecast Effective March 31, 2005 Pricing Overview
Crude Oil Natural Gas Natural Gas Liquids
WTI at Cushing, Oklahoma Edmonton System Direct Spot AECO Ethane Propane Butane Condensate
($US/bbl) City Gate Plant Gate Plant Gate Hub Edm Par Edm Par Edm Par Edm Par Year
($CDN/bbl) ($CDN/Mcf) ($CDN/Mcf) ($CDN/Mcf) ($CDN/bbl) ($CDN/bbl) ($CDN/bbl) ($CDN/bbl)
Historical
2000 $30.22 $44.03 $4.84 $4.93 $5.01 $14.10 $32.59 $36.51 $46.30
2001 $25.87 $39.03 $5.42 $6.05 $6.27 $17.20 $30.62 $30.49 $43.03
2002 $26.11 $40.16 $3.85 $3.89 $4.07 $11.29 $20.92 $27.78 $41.22
2003 $31.01 $43.17 $6.11 $6.53 $6.70 $18.43 $32.31 $36.03 $45.18
2004 $41.45 $52.75 $6.32 $6.40 $6.57 $19.04 $35.20 $44.07 $55.49
2005 Q1 $49.67 $61.93 $7.20 $6.69 $6.88 $19.79 $52.72 $49.37 $67.40
2005 Q2 to Q3 $52.00 $62.30 $7.20 $7.30 $7.50 $21.60 $40.50 $49.85 $65.40
2005 Yearly Avg.
$51.42 $62.21 $7.20 $7.15 $7.34 $21.15 $43.55 $49.73 $65.90
Forecast
2005 $52.00 $62.30 $7.20 $7.30 $7.50 $21.60 $40.50 $49.85 $65.40
2006 $50.95 $61.00 $7.20 $7.30 $7.50 $21.60 $39.65 $48.80 $64.05
2007 $49.95 $59.80 $7.10 $7.20 $7.40 $21.30 $38.85 $47.85 $62.80
2008 $47.75 $57.10 $6.80 $6.90 $7.10 $20.40 $37.10 $45.70 $59.95
Table 1. Hydrocarbon pricing and forecasts (http://www.ajma.net/pricefore.htm)

13
Fuel gas Returned to Oil Sands Plant after NGL extraction:
Methane and ethane are the major components of the fuel gas that would be
returned to the plant after NGL extraction. Ethane prices can be seen in Table 1
to be about $21.60 for 2005. Natural gas is made up mainly of methane and
therefore, the price of methane was taken to be equal to that of natural gas as an
estimate at $7.20 for 2005. For the purposes of this report, the price of natural
gas is used for the mixture (to keep estimates conservative).
Costs and Revenue
Costs Average Fixed Capital costs = $ 100,000,000
Estimated Operating expenses (Utilities, wages etc) = $ 12,000,000
Fuel gas supply =117MMscf/d = 4,875,000scf/hr
= 5,181,306,014 Btu/hr
Thus, fuel gas feed cost = 5,181MMBtu/hr * $7.20 Cdn/MMBtu
= $37,305/hr
Therefore, yearly cost = $37,305/hr *(24*365) hrs
= $326 million
Total yearly operating cost = 12 + 326 = $338 million
Thus, from the above calculations, it can be seen that the yearly operating costs
associated with the NGL facility are in the order of $338 million.
14
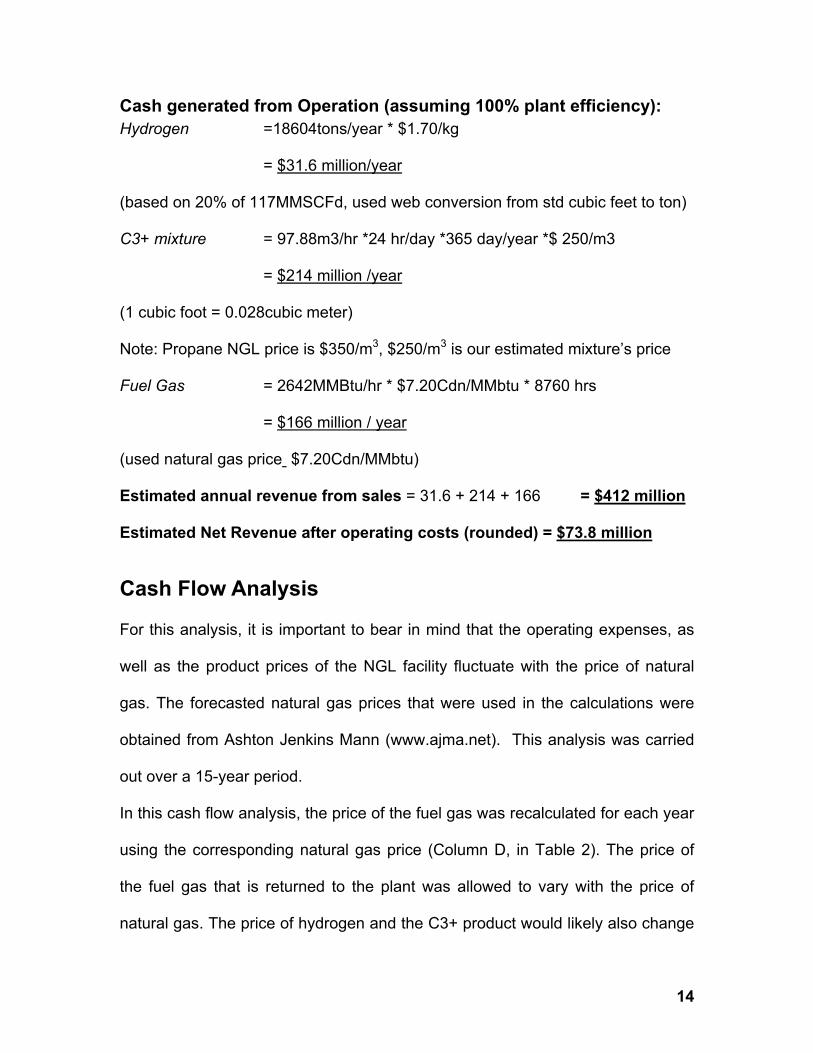
Cash generated from Operation (assuming 100% plant efficiency): Hydrogen =18604tons/year * $1.70/kg
= $31.6 million/year
(based on 20% of 117MMSCFd, used web conversion from std cubic feet to ton)
C3+ mixture = 97.88m3/hr *24 hr/day *365 day/year *$ 250/m3
= $214 million /year
(1 cubic foot = 0.028cubic meter)
Note: Propane NGL price is $350/m3, $250/m3 is our estimated mixture’s price
Fuel Gas = 2642MMBtu/hr * $7.20Cdn/MMbtu * 8760 hrs
= $166 million / year
(used natural gas price $7.20Cdn/MMbtu)
Estimated annual revenue from sales = 31.6 + 214 + 166 = $412 million
Estimated Net Revenue after operating costs (rounded) = $73.8 million
Cash Flow Analysis
For this analysis, it is important to bear in mind that the operating expenses, as
well as the product prices of the NGL facility fluctuate with the price of natural
gas. The forecasted natural gas prices that were used in the calculations were
obtained from Ashton Jenkins Mann (www.ajma.net). This analysis was carried
out over a 15-year period.
In this cash flow analysis, the price of the fuel gas was recalculated for each year
using the corresponding natural gas price (Column D, in Table 2). The price of
the fuel gas that is returned to the plant was allowed to vary with the price of
natural gas. The price of hydrogen and the C3+ product would likely also change

15
over the course of a 15-year period, however both were assumed to be constant
in the analysis. A discount rate of 10%, which is normally used at oil sand
companies, was used for the present value computations. The results of the cash
flow analysis are shown in Table 2.
By looking at the present value column in this table, it can be seen that the NGL
facility has a payback period of about 1 to 2 years. Even after the payback
period, the NGL facility can be seen to remain profitable for the next 14 years,
provided natural gas prices follow the forecasted trend. In addition, the net
present value of this project is $485 million, which indicates that this project is
profitable.
When looking at the 15 year forecasted profitability of this facility, it can be seen
that when the price of natural gas goes up, the net revenue goes down. This
result is expected, since an increase in natural gas prices will cause the price of
the fuel gas feed to increase substantially. Revenue generated from sales would
not increase in par and thus, this would result in an overall decrease in cash
generated from operation. Thus there is likely a certain price of natural gas that
renders the plant non profitable.

16
Year Fixed Capital Gross revenue Calculations Operating Costs Calculations
Net Revenue (I=E-H)
Net Cash flow
PV cumulative
Net cash flow
0 -$100,000,000
H2
(A)
C3+
(B)
C1/C2 (varies with Natural gas
Price) (C)
Natural Gas
Prices (D)
Gross Revenue
(E=A+B+C)
Fuel gas Feed
(varies with Natural Gas
Prices) (F)
Other OP exp
(wages/ Utilities)
(G)
Operating Costs
(H=F+G) -$100,000,000
PV net Cash flow
(Discount
10%) -$100,000,000
1 $31,626,800 $214,357,200 $166,636,224 $7.20 $412,620,224 $326,776,032 $12,000,000 $338,776,032 $73,844,192 $73,844,192 $67,131,084 -$32,868,916
2 $31,626,800 $214,357,200 $166,636,224 $7.20 $412,620,224 $326,776,032 $12,000,000 $338,776,032 $73,844,192 $73,844,192 $61,028,258 $28,159,341
3 $31,626,800 $214,357,200 $164,321,832 $7.10 $410,305,832 $322,237,476 $12,000,000 $334,237,476 $76,068,356 $76,068,356 $57,151,282 $85,310,623
4 $31,626,800 $214,357,200 $157,378,656 $6.80 $403,362,656 $308,621,808 $12,000,000 $320,621,808 $82,740,848 $82,740,848 $56,513,112 $141,823,736
5 $31,626,800 $214,357,200 $148,121,088 $6.40 $394,105,088 $290,467,584 $12,000,000 $302,467,584 $91,637,504 $91,637,504 $56,899,680 $198,723,416
6 $31,626,800 $214,357,200 $143,492,304 $6.20 $389,476,304 $281,390,472 $12,000,000 $293,390,472 $96,085,832 $96,085,832 $54,237,947 $252,961,363
7 $31,626,800 $214,357,200 $155,064,264 $6.70 $401,048,264 $304,083,252 $12,000,000 $316,083,252 $84,965,012 $84,965,012 $43,600,486 $296,561,849
8 $31,626,800 $214,357,200 $159,693,048 $6.90 $405,677,048 $313,160,364 $12,000,000 $325,160,364 $80,516,684 $80,516,684 $37,561,627 $334,123,476
9 $31,626,800 $214,357,200 $164,321,832 $7.10 $410,305,832 $322,237,476 $12,000,000 $334,237,476 $76,068,356 $76,068,356 $32,260,409 $366,383,885
10 $31,626,800 $214,357,200 $166,636,224 $7.20 $412,620,224 $326,776,032 $12,000,000 $338,776,032 $73,844,192 $73,844,192 $28,470,133 $394,854,017
11 $31,626,800 $214,357,200 $171,265,008 $7.40 $417,249,008 $335,853,144 $12,000,000 $347,853,144 $69,395,864 $69,395,864 $24,322,827 $419,176,844
12 $31,626,800 $214,357,200 $175,893,792 $7.60 $421,877,792 $344,930,256 $12,000,000 $356,930,256 $64,947,536 $64,947,536 $20,694,287 $439,871,131
13 $31,626,800 $214,357,200 $180,522,576 $7.80 $426,506,576 $354,007,368 $12,000,000 $366,007,368 $60,499,208 $60,499,208 $17,524,466 $457,395,596
14 $31,626,800 $214,357,200 $183,994,164 $7.95 $429,978,164 $360,815,202 $12,000,000 $372,815,202 $57,162,962 $57,162,962 $15,052,794 $472,448,391
15 $31,626,800 $214,357,200 $187,465,752 $8.10 $433,449,752 $367,623,036 $12,000,000 $379,623,036 $53,826,716 $53,826,716 $12,885,688 $485,334,079 Table 2. Cash Flow Analysis for 15 years

17
Sensitivity Analysis
Though it has already been noted that the profitability of an NGL facility is highly
dependent on the price of natural gas, this sensitivity analysis tries to determine
a break even price. Figure 5 shows a plot, which summarizes the findings.
-1.00E+08
0.00E+00
1.00E+08
2.00E+08
3.00E+08
4.00E+08
5.00E+08
6.00E+08
7.00E+08
$0 $5 $10 $15
Natural Gas Price, $/GJ
Dol
lars
,
HydrogenC3+C1/C2Operating CostsNet Revenue
Figure 5. Sensitivity Analysis
The above plot shows the variation in operating costs and fuel gas product, with
natural gas price. Both can be seen to have increasing trends. Since the price of
the C3+ mixture and hydrogen were assumed to be constant, they are shown by
horizontal lines, which have no slopes. In reality however, these prices would be
impacted by variations in natural gas price as well. For instance, the C3+ mixture
would likely show a decrease in margins (Table 1, forecasted propane prices
seen to decrease). Figure 5 also shows that the NGL facility would barely be able
to cover variable operating costs, if the price of natural gas were to go to slightly
above 10/GJ. Under such circumstances, an oil sands company could potentially
decide to burn the heavier hydrocarbons as fuel gas in order to cut losses.

18
Environmental Impact
When fossil fuels are burned, green house gases such as carbon dioxide are
emitted. These green house gases cause global warming, which have dire
consequences on the environment worldwide. Carbon dioxide (CO2) emission
factors, however, vary depending on the properties of the fuel. Table 3 shows
how the amount of CO2 varies with the type of hydrocarbon combusted.
Emission Factors
CO2 CH4 N2O Natural
Gas g/m3 g/m3 g/m3
Natural Gas
Liquids g/L g/L g/L
Ethane 9761 n/a n/a Propane 1,5001 0.0242 0.1082 Butane 1,7301 0.0242 0.1082
1Adapted from McCann, T.J. (2000), 1998 Fossil Fuel and Derivative Factors, prepared for Environment Canada by T.J. McCann and Associates, March. 2 SGA (2000), Emission Factors and Uncertainties for CH4 & N2O from Fuel Combustion, SGA Energy Limited, August. Table 3. Emission Factors for Natural Gas and NGLs (http://www.ec.gc.ca/pdb/ghg/1990_02_report/ann7_e.cfm#tablea71)
As seen in the table above, more CO2 is emitted when heavier hydrocarbons are
combusted. Therefore if the C3+ fuels are removed from the fuel gas, prior to it
being burnt in furnaces, less CO2 would be emitted. Thus an NGL extraction
facility would have a positive impact on global climate conditions, since it would
help reduce greenhouse gas emissions at oil sands plants considerably.
19
Conclusion
Currently, enough fuel gas is being produced at oil sands companies to satisfy
the feed requirements needed for an NGL extraction plant to be viable. In
addition to this, there is a market for this product and one oil sands company has
already started a similar kind of operation. Williams Energy currently operates a
NGL extraction plant, in the Fort McMurray area, and would be a potential
customer for any NGLs produced at another oil sands operation. Dealing with a
local company would help reduce transportation costs significantly.
The cash flow analysis carried out in this report, indicates that an NGL facility
would be highly profitable. The payback period of such a plant was determined
as being somewhere between 1 to 2 years at current natural gas prices. The
profitability of this plant, however, is highly dependent the natural gas market. At
gas costs of around $10/GJ, the facility breaks even and is able to cover only its
operating costs. Even though the natural gas market is known to have price
spikes from time to time, the NGL extraction plant was found to be profitable at
current forecasted natural gas prices for the next 15 years.
Thus, from this economic feasibility study, it can be seen that extracting NGLs
from fuel gas is an economically viable endeavor, which oil sands firms could
consider embarking upon. Doing so would also have a positive environmental
impact, since emissions of pollutants into the atmosphere would be reduced.
Therefore, an NGL facility would not only allow oil sands firms to show that they
are good corporate citizens, with respect to the environment, but it would also
allow them to generate a profit for their shareholders.
20
References Alberta Department of Economic Development (2000) - “Alberta Propylene
Upgrading Prospects”, – McCann, T.J. and Associates,
Alberta Department of Economic Development (2004) - “Oil Sands Industry
Update”, – Nichols Applied Management
WebPages Ashton Jenkins Mann – Price Projections
http://www.ajma.net
Barnes and Click Inc. – Product Price Evaluation (Figures 2 and 3)
http://www.engineers1.com/
Environment Canada
http://www.ec.gc.ca/pdb/ghg/1990_02_report/ann7_e.cfm#tablea71
National Energy Board – NGL Pipeline Network (Figure 4)
http://www.neb.gc.ca/energy/EnergyReports/index_e.htm#NaturalGasLiquids
Oil Sands Discovery – Oil Sands Background Information
http://www.oilsandsdiscovery.com/oil_sands_story/resource.html
SHEC Labs – Fuel Energy Equivalence Calculator
http://www.shec-labs.com/calc/fuel_energy_equivalence.php
University of Alberta – Tutorial on Upgrading of Oilsands
http://www.ualberta.ca/~gray/Library/Tutorials/Upgrading/Index.htm
UOP website - Process Equipment information (Mole Sieve, PSA etc)
http://www.uop.com/gasprocessing/6030.html

21
Williams Energy – Information on Operations in Fort McMurray
http://www.williams.com/index.jsp
WTRG Economics
http://www.wtrg.com

22
Appendix A

23

24