a fault diagnostic system for an unmanned autonomous ... center for rob… · a fault diagnostic...
TRANSCRIPT
1
A Fault Diagnostic System for an
Unmanned Autonomous Mobile Robot
A thesis submitted to the
Division of Research and Advanced Studiesof the University of Cincinnati
in partial fulfillment of therequirements for the degree of
MASTER OF SCIENCE
in the Department of Mechanical, Industrial, and Nuclear Engineeringof the College of Engineering
1997
by
Umesh B. Nikam
B.S., University of Poona, India 1994
Committee Chair : Dr. Ernest Hall
2
Index
1. Introduction 1
2. Problem Statement 8
3. Literature Survey 11
4. System Description 23
5. PFMEA 50
6. FTA
7. Master Program
8. Conclusions and scope for further work
9. References
10. Appendix I (FTA)
11. Appendix II (VB code)
3
ABSTRACT
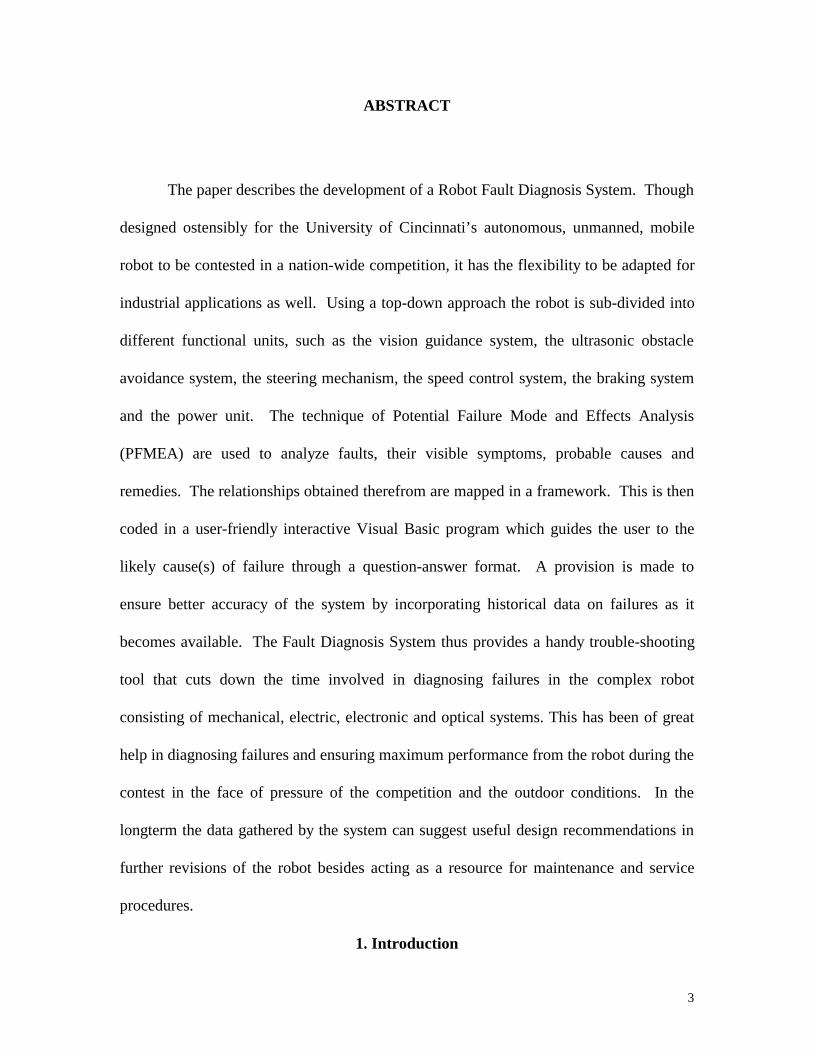
The paper describes the development of a Robot Fault Diagnosis System. Though
designed ostensibly for the University of Cincinnati’s autonomous, unmanned, mobile
robot to be contested in a nation-wide competition, it has the flexibility to be adapted for
industrial applications as well. Using a top-down approach the robot is sub-divided into
different functional units, such as the vision guidance system, the ultrasonic obstacle
avoidance system, the steering mechanism, the speed control system, the braking system
and the power unit. The technique of Potential Failure Mode and Effects Analysis
(PFMEA) are used to analyze faults, their visible symptoms, probable causes and
remedies. The relationships obtained therefrom are mapped in a framework. This is then
coded in a user-friendly interactive Visual Basic program which guides the user to the
likely cause(s) of failure through a question-answer format. A provision is made to
ensure better accuracy of the system by incorporating historical data on failures as it
becomes available. The Fault Diagnosis System thus provides a handy trouble-shooting
tool that cuts down the time involved in diagnosing failures in the complex robot
consisting of mechanical, electric, electronic and optical systems. This has been of great
help in diagnosing failures and ensuring maximum performance from the robot during the
contest in the face of pressure of the competition and the outdoor conditions. In the
longterm the data gathered by the system can suggest useful design recommendations in
further revisions of the robot besides acting as a resource for maintenance and service
procedures.
1. Introduction

4
For most practicing engineers, Murphy’s law ( If anything can go wrong, it will) is
probably a platitude. Regardless of how well a system, a mechanism or a machine is
designed and tested, breakdowns and snags often develop in the day to day operations.
This is observed to be true of highly sophisticated equipment such as robots as well.
Stuck actuators, failures in feedback servo mechanisms etc. are some of the myriad
problems observed in industrial robots.
A fault is the physical or algorithmic cause of a failure. A failure is a deviation in
the performance of a system from the pre-specified one. A failure is an event. Whenever
a failure occurs, the robot loses its functionality. Depending on the fault tolerance and the
redundancy in the system, the robot may be partially or totally impaired. The partial loss
in functionality may lead to reducing the utility of the robot in terms of some auxiliary
tasks. However, if a major fault occurs the robot may be rendered totally useless and may
be required to be shut down disrupting production schedules.
In such a event, often a maintenance engineer is summoned. However, he may
not be immediately available. Also, many companies do not have a devoted specialist for
robot maintenance and rely solely on the technical support personnel of the robot
manufacturer. Obviously, this is a time-consuming procedure. As the capital investment
in robots and associated equipment is large and the need to honor delivery commitments
in today’s competitive market are tremendous, such time delays are hardly desirable.

5
The immediate unavailability of an expert no doubt contributes to the downtime
of the robot. Another contributing factor to the downtime is the time lost in the process
of fault fixing itself. The process of fixing faults consists of two discrete steps : Diagnosis
and Repair. In most cases, Repair time associated with a failure is constant and
independent of time. However, the diagnosis phase can be optimized.
The industry commonly relies on the personal skill expertise of a Maintenance
engineer for fault diagnosis. But these tasks demand interdisciplinary skills. Zvi S. Roth
[1] note that qualified personnel with the right background and experience are difficult to
find.
To aid the non-specialist as well as the more qualified personnel, commercially
available robots come with Maintenance and Trouble-shooting manuals. These provide
instructions on safe operation and maintenance procedures as well as trouble-shooting
hints for most commonly observed problems. However manuals tend to be verbose and
most technicians are reluctant to use them under the pressure of loss of productivity.
Clearly, there exists a tremendous potential for utilizing a non-human expert that
would be readily available and accurately diagnose the problem with the least loss of
time. Moreover, the process of diagnosing causes based on circumstantial information
and deductive knowledge gained through past experience with the system lends itself to
the application of a computational tool.
6
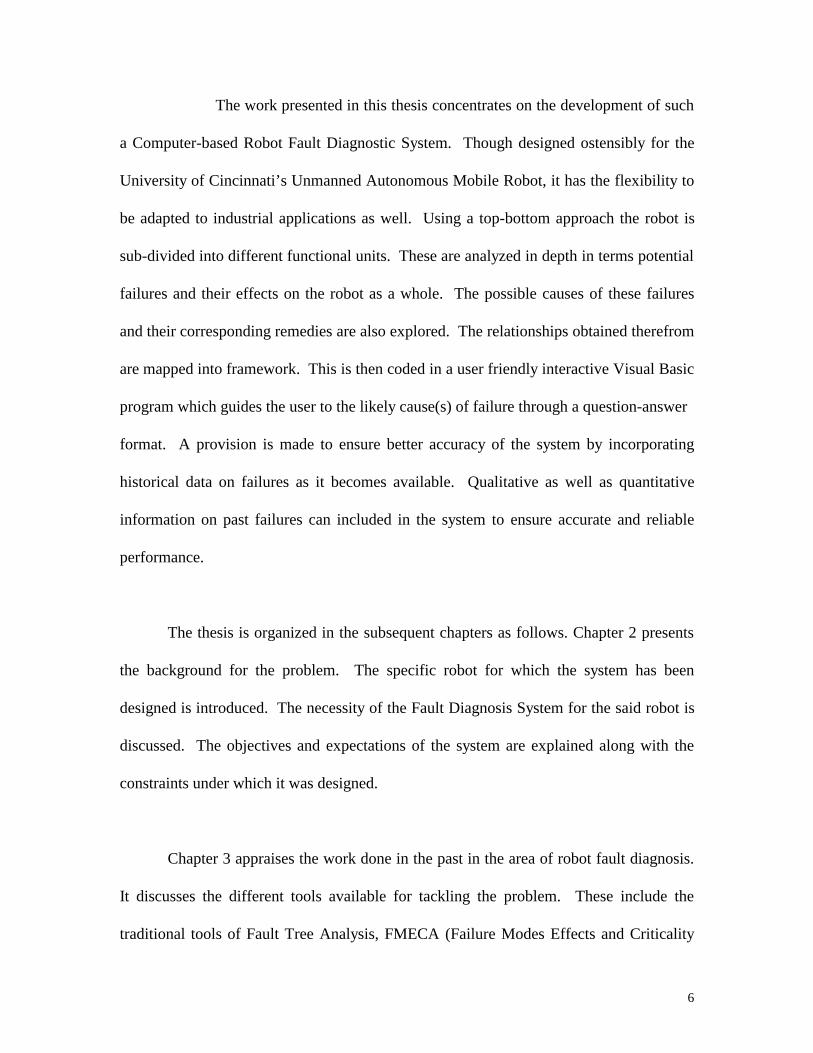
The work presented in this thesis concentrates on the development of such
a Computer-based Robot Fault Diagnostic System. Though designed ostensibly for the
University of Cincinnati’s Unmanned Autonomous Mobile Robot, it has the flexibility to
be adapted to industrial applications as well. Using a top-bottom approach the robot is
sub-divided into different functional units. These are analyzed in depth in terms potential
failures and their effects on the robot as a whole. The possible causes of these failures
and their corresponding remedies are also explored. The relationships obtained therefrom
are mapped into framework. This is then coded in a user friendly interactive Visual Basic
program which guides the user to the likely cause(s) of failure through a question-answer
format. A provision is made to ensure better accuracy of the system by incorporating
historical data on failures as it becomes available. Qualitative as well as quantitative
information on past failures can included in the system to ensure accurate and reliable
performance.
The thesis is organized in the subsequent chapters as follows. Chapter 2 presents
the background for the problem. The specific robot for which the system has been
designed is introduced. The necessity of the Fault Diagnosis System for the said robot is
discussed. The objectives and expectations of the system are explained along with the
constraints under which it was designed.
Chapter 3 appraises the work done in the past in the area of robot fault diagnosis.
It discusses the different tools available for tackling the problem. These include the
traditional tools of Fault Tree Analysis, FMECA (Failure Modes Effects and Criticality
7
Analysis) and Reliability Block Diagrams as well as the more recently developed tools
like Expert systems and Robotic Self Diagnosis and Repair. Another technique, the
PFMEA (Potential Failure Mode and Effects Analysis), that is widely used for purposes
of Quality Assurance in the automotive industry is discussed. The advantages and
disadvantages of each of these techniques is mentioned. Further the chapter critiques
specific published research papers on the topic and comments on the strengths and
weaknesses of each. The suitability of each of these approaches for solving the problem
at hand is assessed.
Chapter four presents detailed description of the functional aspect of the system
components. The entire robot is divided into seven main units: Vision system, Obstacle
avoidance system, Steering system, Speed regulator, Traction unit, Power Unit and the
Brake system. Block diagrams are presented for each of these units explaining the
detailed functioning and the interplay among the different units in the operation of the
robot. These are supported by photographs and wiring diagrams. Since the robot has
been designed at the laboratory from the scratch, it does not have any system
documentation or maintenance and service guide. This chapter is therefore, intended to
provide precisely this kind of information that would help a novice better understand the
robot consisting of complex electrical, electronic, mechanical, optical systems.
Chapter five discusses the technique of Potential Failure Modes and Effects
Analysis as it is used in the Automotive industry. The suitability of this method as an

8
exploratory technique for the problem at hand is explained. Data on failures is gathered
in the terms of four sets / heads of information :
Potential Failure modes.
Potential Failure Effects.
Potential Causes of Failure.
Probable Remedies.
Potential Failure Modes are the different ways in which the system can possibly
go wrong. Potential Effects lists the different symptoms / consequences of a given failure
mode. Potential Causes give the likely causes of the given failure mode with the
corresponding effects and Remedies give instructions to rectify the fault.
These together contain comprehensive information on the entire gamut of likely
failure scenarios. Exhaustive lists relationships are then formed between the different
elements of each set. These map a given failure mode with its visible effect and the likely
causes as well as corresponding remedies. These mappings could be singular ( one on
one) or one to many or many to one. These are off-course based on technical
considerations derived from experience from working with the system. The mappings in
reality embody the known information on the behavior of the system. This has been based
on actual experiences while testing the robot, the technical manuals available for some of
the system components as well as the logical assembly they have connected through as a
9
part of the total system. Together they give a comprehensive framework of failure
scenarios.
Chapter 6 presents the Visual Basic code for the Fault Diagnosis System.
Basically, the relationships obtained from the PFMEA mappings are coded in a frame-
work presented through various screens. The program is extremely interactive and user-
friendly. Starting with obvious visible symptoms of failure the user is guided to the
potential causes of the problem through a series of question-answer screens. The system
does not expect any specialized skill of the user and only requests additional information
on the scenario of the failure and some simple electrical measurements.
A provision is made to ensure better accuracy of the system through the use of
historical data on failures as it becomes available. For e.g. if there are Cn likely causes (
C1, C2 ... Cn ) of which say C1 is confirmed to be the actual cause in m of the last n
occurrences of that failure mode and that visual effect then the probability of C1 being
the true cause in the n+1 occurrence is given by m/n. With every occurrence and
confirmation the probability is recalculated and therefore the system improves its
accuracy and at the same time displays a learning behavior. Also a failure log is
implemented so that a past history of failures is obtained. As discussed in detail in the
chapter to follow this type of system is ideal for the given robot that is in the prototype
stage. Also as additional information on the system itself becomes available it can be
incorporated in the PFMEA stage itself as this technique is extremely open to alterations
and additions. Also the data collected should also serve useful in giving design

10
recommendations in future revisions of the robot aimed at a more durable and reliable
system. Thus besides acting as a handy trouble shooting aid the Fault Diagnosis System
shall serve as a Maintenance and Service Expert System , a teaching tool for new users of
the robot as well as provide information on improving the design in the later versions of
the system.
11
2. Problem Statement
The Center for Robotics Research at the University of Cincinnati has been
involved in a nation-wide competition to build a mobile robot that would autonomously
travel along an outdoor obstacle course. The robot has been built on the platform of a
golfcart and employs a vision guidance system for following the course, an ultrasonic
system for avoiding obstacles, a steering mechanism to maneuver the robot, a speed
controller that provides traction and regulates speed and a braking system that acts as a
stopping and safety device.
The design of the robot has been a team effort. Working on the principle of
division of labor, each team member took the responsibility for the individual modules of
the system. The robot is extremely complex consisting of mechanical, electrical,
electronic and optical circuits. Ensuring reliability of such a machine which is still in the
prototype stage is an enormous task. In spite of the best efforts by the team members,
failures are often observed in the actual operation of the robot. At such times, diagnosing
the faults becomes a daunting task. This problem is even more acute at the actual contest
under the pressure of the competition and the prevailing outdoor conditions. Since, this
robot has been built from scratch at the University, it does not have any trouble shooting
manuals. Nor does the robot perform any self diagnostic procedures (as in the case of
commercial industrial robots). Presently, fault diagnosis and repair is done manually
relying solely on the expertise of the team members. This however is found to be
cumbersome and time-consuming. The team has been participating in the contest for the
12
last four years. All along it has been a common experience that rapid fault fixing is
perhaps the key to ensuring the required performance of the robot at the contest.
Under these circumstances it was thought to be entirely appropriate to design a
diagnostic tool that would minimize reliance on the expertise of the individual team
members. Such a tool would possess the knowledge of the functional working of the
robot and its every subsystem. It shall be easy to understand and operate. It shall not
expect specialized skills of the user. It shall have a high speed of operation. It shall have
the capability of being modified to suit individual requirements ( like for some specific
industrial robot) It should have the capability of being modified as more knowledge
becomes available about the system over a period of time or certain subsystems are
replaced by more sophisticated ones. Further more as a long term goal of extending this
concept for industrial robots, it shall be amenable to easy changes in the failure data that
would enable its application any specific robot as well.
Another important expectation of the system is its capability to mimic learning
behavior and gain intelligence based on historical data. More specifically the system
should display a learning behavior as more is uncovered about the robot with each new
occurrence of a failure. In the long term such a system shall be able to serve as a
maintenance and service expert system. Also the data gathered on failures should be
made available through the system in such a way that further improvements in component
design and selection can be made.

13
Another expectation of the system is its ability to act as a storage device for
information on the system itself. This would enable every team member to understand
the system better as well as help subsequent teams in their quest to improve and
outperform the robot of its expectations. Besides the information on the system acquired
using this tool should serve as a source for improving the design and equipment selection
in later revisions of the system.
14
3. Literature Survey
Past work on failure diagnosis in robots has involved the implementation of
traditional techniques as well as some advanced tools. Of the former, the most commonly
used are :
1. Fault Tree Analysis
2. Reliability block diagrams.
3. Cause Consequence Analysis
More recently advanced approaches tried in this field have included:
1. Expert Systems
2. Robotic Self-Diagnosis and Self-Repair.
Fault Tree Analysis:
The Fault Tree Analysis, also known as the Fault Propagation Tree, is a top-down
technique that graphically represents the equipment state as a function of the component
states. It uses deductive reasoning to logically describe the occurrence of a top event.
FTA can be a valuable design tool. It can identify potential accidents or failures in a
system and can help eliminate costly design changes and retrofits. It can also be a
diagnostic tool. It can predict the most likely causes of system failure in the event of a
15
system breakdown. Beginning with a particular equipment failure mode, all combinations
of the component failures that lead to that failure mode are determined. The Fault Tree
Analysis approach analyzes the effects of what are perceived to be normal design and
operating conditions in addition to failures and combination of failures. Before the
construction of the fault tree can proceed, the analyst must acquire a thorough
understanding of the system. In fact, Barlow and Lambert [3] note that a system
description should be part of the analysis documentation.
A fault tree is a model that graphically and logically represents the various
combinations of possible events occurring in the system that lead to the top event. The
fault tree is so structured that the sequences of events that lead to the undesired event are
shown below the top event and are logically related to the undesired event by logical
gates. The input events to each logic gate that are also outputs of other logic gates at a
lower level are shown as rectangles. These events are developed further until the
sequences of events lead to basic causes of interest, called basic events. The basic events
represent the limit of resolution of the fault tree.
A Fault Tree Analysis can be performed quantitatively as well as qualitatively.
Under quantitative Fault Tree Analysis frequency rates are assigned to events. Qualitative
Fault Tree Analysis does not consider frequency rates. Frequency rates are assigned to
each failure and circumstance in the Fault Tree Analysis. The rate of Top is calculated by
summing the rates of all the Cut Sets.
16
Recently, efforts have been made toward automating fault tree construction for
computer implementation. Fussel [4] automated fault tree construction for electrical
systems. Powers et all [5] automated fault tree construction for chemical systems. The
automated approach can be used to construct fault tree at the subsystem-component level
of the system. The automated approach can free the analyst from routine fault tree
construction and allow him to examine the more subtle aspects of system behavior at the
secondary failure level. In cases where the potential for loss of human life exists, Barlow
and Lambert [3] advise against replacing the human analyst by the computer due to the
numerous subtleties associated with real systems. In this case, however, the automated
approach can check the analyst’s work to determine if nay of the routine modes have
been overlooked.
Though the fault tree analysis technique has been widely used since 1960, it does
have some disadvantages. A major drawback is oversight and omission. Even with skilled
and experienced analysts, there is always the possibility that significant failure modes
have been overlooked in the analysis. Also, Boolean logic cannot be applied in case of
components that have partially successful operation, for e.g. leakage through valve.
Also, FTA is time consuming, costly and in many cases difficult to apply[3]. Its results
are difficult to check. However, as systems become more and more complex and the
consequences of failures become catastrophic, a technique such as the FTA should be
applied.
17
Reliability Analysis:
The majority of publications on reliability analysis are based on the assumption
that the equipment is made up of components with independent failure behavior. This
does not mean that the components are independent, because in many systems there is a
supervisory control , which monitors the states of the individual components, and on
failure the failed component will be replaced by a good one.
Assuming that component failure behavior can be considered independent, reliability
prediction for equipment consists of four steps [2] :
1. Determine the reliability of each component.
2. Identify the supervisory control rules (repair and maintenance procedures).
3. Find the relationship between the equipment failures and the component failures,
that is,
Equipment state = Function ( Component states)
4. Compute the probability model to determine the equipment reliability using the
previous information.
The technique of Reliability Block Diagrams is commonly used for analyzing the
effect of component failures on equipment failure. The different components are
connected either in series, parallel or a mesh or a combination of these to represent the
entire equipment in terms of a functional skeleton. All those set of components necessary

18
for the operation of the equipment and those that need only one to fail for the equipment
to fail are connected in series. From the reliability point of view those components are
considered in parallel for which only one needs to be working for the equipment to be
functioning and the equipment fails only when all the components fail.
Robotic Self-Diagnostics and Self- Repair :
The technique of robotic self-diagnosis and repair lend itself to taking care of the
most commonly observed faults that have fully automated measurement and repair tools.
For e.g. Pattern recognition - based diagnostics can be used to locate the source of
vibration on a robot arm by moving the arm along different axes one at a time to better
distinguish between inherent and induced vibrations. In addition, different loading and
robot configurations may be tried to improve the diagnostic resolution.
Mapping from the world co-ordinates to joint coordinates is a common operation
for mechanical fault debugging. A detected repeatability degradation at given task points
is translated by the robot inverse Jacobian matrix to the repeatability measures at each
robot axis. These figures are useful in locating a faulty axis.
Software errors can be detected through inconsistencies in either the data structure
or the values of variables. Error recovery techniques for database system failures can be
directly extended to robotic software systems. The most commonly observed robotic
software failures are :

19
1. Failure of program or transaction.
2. Failure of the total operating system.
3. Hardware failures such as fluctuation in power supplies or disk failures.
These errors could be taken care of by building in redundancy in the system in the
form of back up copies as well as the data structure itself. Errors due to potentially
incorrect completed operations need to be removed by undoing such operations. While
this may be possible in removing erroneous data from the robotic database, it may be
impossible in certain incomplete applications.
Software recovery significantly add to the complexity of the robotic software
system. The error recovery system is also subject to errors. Failures may occur , for
instance, in the machinery that writes the recovery data to the separate storage device.
The overall system reliability can be increased by introducing multiple levels of recovery
systems.
Robotic self-repair capability for hardware failures is directly linked to the
hardware redundancy in the system. The commonly used techniques are :
1.Replacement
2.Reconfiguration.
20
Both these techniques employ proper logic circuits to switch components in or
out. Under the replacement technique, a spare or stand by component is switched on to
substitute for the component that goes faulty. Under reconfiguration, responsibilities are
redistributed among components available for use.
These techniques are widely used for electronic components. For e.g. the usage of
active and idle microprocessor chips, servo amplifiers, and so on the same card or the on
a larger scale redundant cards on the same rack. For improved reliability , a geographical
distribution may be recommended, depending on the expected adverse environmental
effects. In cases where physical redundancy is hard due to space constraints , functional
redundancy may be employed. For instance, backup for feedback control sensors may be
provided through a bank of observer’s each designed to cover for different sensory failure
modes.
Robotic mechanical redundancy may take the form of multiple arm or redundant
links. The redundant links must be securely clamped. Component replacements require
subsequent robot self-calibration. Self-calibration requires a sufficient hardware
redundancy or alternatively a fully automated end-point sensing. Self-calibration requires
the same type of measurement techniques that are suitable for self-testing, that is, fully
automated end-point sensing.
There are numerous disadvantages to this approach of tackling the issues of robot
reliability and repair. Basically the method involves installing large amounts of

21
redundancy in the system. This significantly adds to the cost and complexity of the
system. Zvi S. Roth [1] notes that self-repairing robots Will be limited to highly critical
systems such as certain space and underwater applications in which teleoperation may be
impossible or severely limited, thus justifying the expense of designing the robot with
self-repair capability. Research in this area is in its infancy. There are no established
standards for robot maintenance and testing and there are not enough collected field data
to assess the reliability of robots on a valid statistical basis. many properties of self-
repairing robots will necessarily be based more on hypothesis than substantial fact.
Clearly, this approach was not suitable for ensuring the reliability and
maintenance problem for the University of Cincinnati robot.
Expert Systems:
Expert systems is a software system which displays expert behavior in a particular
domain of application. A human expert is a rare commodity. the use of expert systems
enables this rare commodity to be shared by many centers of demand.
An expert system consists of principally two parts - an inference engine and a
knowledge base. Commercially, available software tools, known generically as expert
system shells, facilitate the development of expert systems. An expert system shell
contains an inference engine and software to build and incorporate knowledge base.
22
Expert systems have been developed for various areas of applications including
fault diagnosis and recovery for mechanical, electrical and electronic equipment as well
commercial robots.
Sarma R. Vishnubhotla , 1988 proposed an expert system to diagnose failures in
industrial robots. The main functions of the expert system were :
1. To monitor robot performance.
2. Identify abnormal behaviors beyond tolerance limits.
3. Identify the type of failures, i.e., operational or hardware fault.
4. Activate the recovery software routines, if the abnormality is due to operational errors.
5. Stop normal robot operation and activate fault diagnosis phase , if the abnormality is
due to hardware failures.
Under normal operating conditions the expert system works in conjunction with
the robot controller unit. Abnormalities in end-effector movements are first detected by
the controller when the event trace observed does not confirm with the expected trace
values. When the differences between these two sets of values are beyond the tolerance
limits, then the controller aborts the present move and gives the control to the expert
system. The abnormal situations are classified as either operational errors or fatal
hardware failures. The expert system then either activates the built-in error recovery
routines or goes through a hardware diagnostic phase respectively. Diagnosis is based on
23
the information provided by the event trace at the time of abnormal behavior and some
dummy move the arm is forced to make for more diagnostic information. Human
interference is minimized and is required only when the identified faulty unit is to be
replaced.
The diagnosis experiments consists of the following steps:
1. When the hardware failure is detected , it first checks whether motors are operating
correctly. If there is an erroneous motor, it is replaced. If this is the only error, then exit.
2. The event trace before the detection of the abnormality is inspected b the expert
system. All sections of hardware (including sensory units, digital and analog circuitry,
etc.), that could possibly cause the erroneous event trace, are identified.
3. The expert system takes the robot arm through the predesigned sets of movements to
further refine the diagnostic information obtained in step 2. All arm movements that show
no error in their track data will identify fault-free sections of hardware. This will
drastically narrow down the area of search for the hardware fault.
4. At the end of step 3 , fault location can be determined to within a few paths of signal
flow. To further localize the faulty unit, the system will use test sequences and will
identify the fault to a unit/package level.
24
This system relies extensively on the dummy moves for extracting diagnostic
information. This is an advanced feature available in most industrial robots. However, the
mobile robot has been built from scratch at the laboratory and does not have such
capabilities. Hence, the approach discussed in this paper is not suitable for use in the said
application. Implementing that approach would necessitate including some pre-
programmed moves in the mobile robot. However, we are still faced with the
disadvantage that in case of power and motor failures pre-programmed moves cannot be
performed. Hence, the approach discussed in this paper is not suitable for use in the said
application. In case of motor failures the system is not able to provide any information
since the pre-programmed arm movements cannot be made. Also the paper fails to
mention the implementation details and the results obtained from the expert system.
Patel Sanjiv and Kamrani Ali, 1996 proposed an off-line Intelligent decision
support system for diagnosis and maintenance of automated systems called ROBODOC.
It uses a group technology approach to classify symptoms and a decision tree approach in
developing the system. It has the capability to produce both detailed and shallow reports
of problem and their fixes. Its modularity makes it easier to add or revise the knowledge
base or to transfer the diagnostic knowledge from one automated system to another,
without necessitating complete development from scratch. The results of this work can
contribute to the development of a design for a service expert system, which will be able
to give design recommendations based on past experiences, which will produce more
durable and easier to maintain equipment designs.
25
The approach employed in the design and development of this expert system
takes care of most of the drawbacks of the system proposed by Sarma R. Vishnubhotala.
However, both the systems suffer a common handicap as regards to their application to
the University of Cincinnati robot. This system is still under proto type stage.
Expert systems have traditionally been developed for commercially available robots on
which extensive failure related information is already available. Being a prototype under
development , the fault diagnostic system for the given robot has to be able to draw
inferences from the minimal information available. Equally important is the fact that
since the robot is still under development and shall have annual revisions, the system
shall have the flexibility to adjust to the modifications being made in its algorithms as
well as hardware units. As more is uncovered about the performance and capabilities of
the robot during in-house and field testing it should be readily assimilated in the system.
Considering these factors the expert system approach was not suitable for the stated task.
26
4. System Description
Introduction
As a prerequisite to the creation of the FMEAS for individual subsystems as well as the
entire a robot, a thorough study of the system was necessary. This chapter basically gives
this precise and detailed system description. The information is drawn regarding the
hardware, software and equipment design and selection down to the actual performance
and testing. For the robot to operate at expected perform level at the contest not only
should the individual subsystems work satisfactorily but they also should work in tandem.
This thorough analysis has been tremendously useful in understanding the architectural,
functional and behavioral details of the system.
Basically, the mobile robot test-bed has been constructed using a golf cart base. This cart
has been modified to have full speed control with guidance provided by a vision system
and obstacle avoidance using ultrasonic sensors systems. The design has several key
features and advantages related to its modularity. First, the system implements a fuzzy
logic control for obstacle avoidance. Next, the system has an innovative three
dimensional vision guidance algorithm. Also, components are portable and could be used
on another vehicle. Finally, the system components are independently configured. The
speed and steering control are supervised by a personal computer through a multi-axis
motion controller. The obstacle avoidance system is based on a micro-controller
interfaced with several ultrasonic transducers. This micro-controller independently
handles all timing and distance calculations and sends a distance which can be used to
27
modify the steering angle correction based on a fuzzy logic controller. Vision guidance
is accomplished using two CCD cameras with zoom lenses. The vision data is processed
by a high speed tracking device, communicating with the computer the X, Y coordinates
of blobs along the lane markers. The system also has three emergency stop switches and
a remote controlled emergency stop switch which can disable the traction motor and set
the brake. Testing of these systems has yielded positive results by showing that at five
mph the vehicle can follow a line and at the same time avoid obstacles. This design, in
its modularity, creates a portable autonomous controller applicable for any mobile vehicle
with only minor adaptations.
Following is a detailed description of the Individual sub systems in terms of their design
considerations,
testing, performance and the interplay of these subsystems in the working of the robot as
a homogenous system.
Autonomous Vehicle Modifications
An autonomous mobile robot is a sophisticated, computer controlled, intelligent system.
The adaptive capabilities of a mobile robot depend on the fundamental analytical and
architectural designs of the sensor systems used. The mobile robot provides an excellent
test bed for investigations into generic vision guided robot control since it is similar to an
automobile and is a multi-input, multi-output system. An algorithm was developed to
28
establish a mathematical and geometrical relationship between the physical 3-D ground
coordinates of the line to follow and its corresponding 2-D digitized image coordinates.
This relationship is incorporated into the vision tracking system to determine the
perpendicular distance and angle of the line with respect to the centroid of the robot. The
information from the vision tracking system was used as input to a closed loop fuzzy logic
controller to control the steering and the speed of the robot.
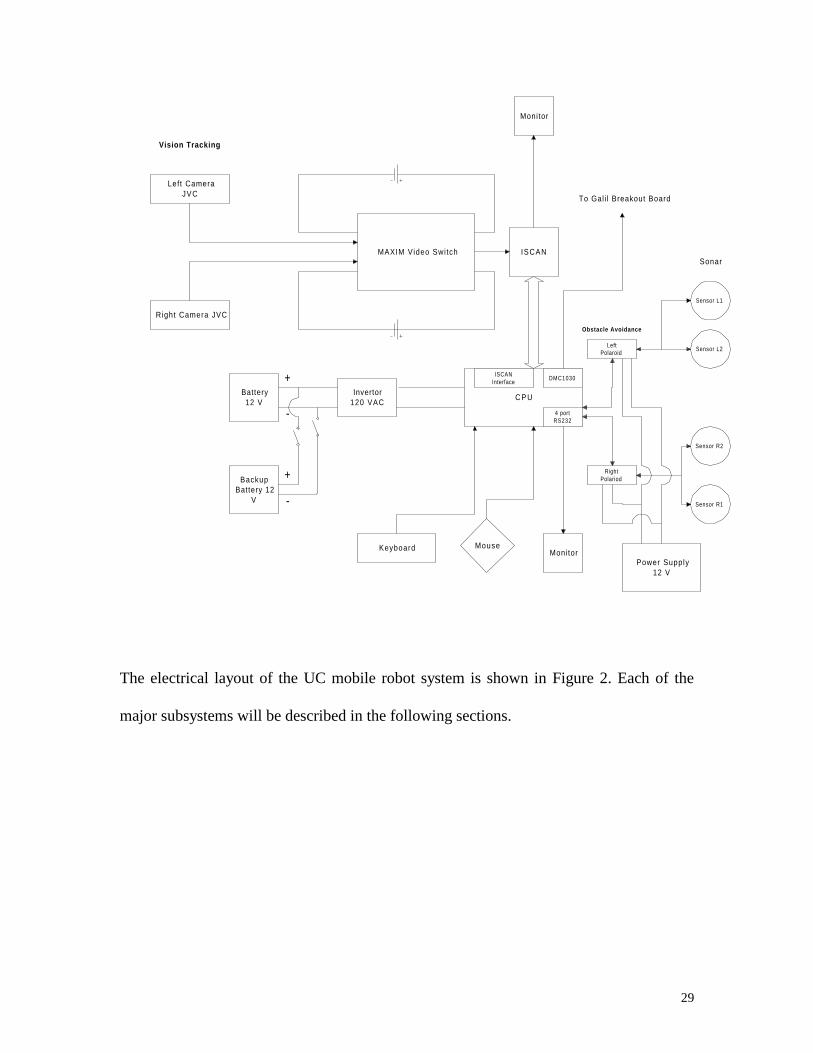
Basically the robot consists of a supervisory control computer which implements a fuzzy
logic control based upon inputs from the vision system, sonar range finder, speed encoder
for steering, and emergency stop subsystems. A block diagram of the system is shown in
Figure 1.
29
Left CameraJVC
Right Camera JVC
MAXIM Video Switch
Monitor
ISCAN
C P U
DMC1030
4 portRS232
ISCANInterface
LeftPolaroid
RightPolariod
Sensor L1
Sensor R1
Sensor R2
Sensor L2
Invertor120 VAC
Keyboard MouseMonitor
Battery12 V
BackupBattery 12
V
Power Supply12 V
-
+
+
-
To Gal i l Breakout Board
Sonar
Vision Tracking
Obstacle Avoidance
The electrical layout of the UC mobile robot system is shown in Figure 2. Each of the
major subsystems will be described in the following sections.
30
GE EV-1
E-StopSolenoid
MainPower
Left E-Stop
Righ tE-
Stop
RearE-
Stop
Right Fan
Left Fan
N O
N C
N C
N O
Tract ion Motor Stator
Tract ion Motor Rotor
T2
A2 N R 9
L3P L4 L5 L7 L9
R 4 R 5
A C M D X
SW 0 SW 1 SW 2 SW 3 SW 4
FET
50 A
6 V
6 V
6 V
6 V
6 V
6 V
N C
N C
N C
N C
Forward/Reverse Contactor
power .vsd
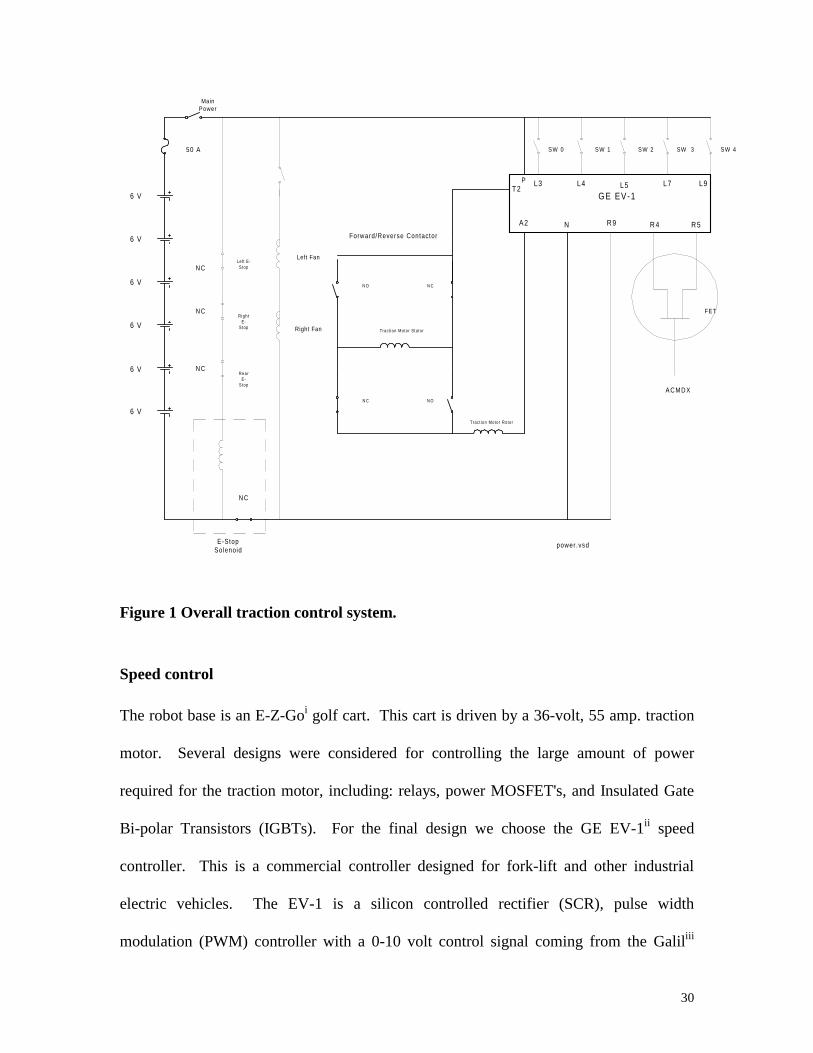
Figure 1 Overall traction control system.
Speed control
The robot base is an E-Z-Goi golf cart. This cart is driven by a 36-volt, 55 amp. traction
motor. Several designs were considered for controlling the large amount of power
required for the traction motor, including: relays, power MOSFET's, and Insulated Gate
Bi-polar Transistors (IGBTs). For the final design we choose the GE EV-1ii speed
controller. This is a commercial controller designed for fork-lift and other industrial
electric vehicles. The EV-1 is a silicon controlled rectifier (SCR), pulse width
modulation (PWM) controller with a 0-10 volt control signal coming from the Galiliii
31
DMC-1030 motor controller and sufficient output to drive the traction motor at full
power. To complete the control loop, we have a BEIiv encoder mounted inside the front
wheel. The encoder position signal is numerically differentiated to provide a velocity
feedback signal.
Safety is of primary concern in the system design. For safety reasons, the EV-1 has a set
of three sequential switches which must be activated in order for it to run. That is, the
machine cannot be turned on by a single switch, a sequence of three switches must be
activated in a prescribed order. Also in the main power loop is a solenoid connected
through three E-stops, the remote stop, as well as through the computer. This design
should prevent any possible runaway of the vehicle since it provides a disconnect of
power to all systems and application of the brake, not just breaking the control circuits.
3.2 Steering Control
The speed is controlled by the computer through the Galil motion control by varying the
voltage across the R5 to R4 connections on the EV-1. A 0 voltage across these terminals
will cause the motor to go at full speed. A maximum voltage of -4.5 volts will cause the
motor to go at creep speed. The emergency stop circuit includes a normally closed
solenoid switch in series with this power circuit. If the e-stop switch is activated, the
solenoid circuit opens and cuts power to the traction motor.
32
3.2 Steering Control
The steering system of the AGV helps maneuver it to negotiate curves and avoid
obstacles on the course. The system uses a crank and connecting link mechanism which is
actuated by the lead screw of a Parker linear actuator. The lead screw is driven by an
Electrocraft brushless DC motor, which in turn is controlled by an Electrocraft BDC - 12
brushless motor amplifier powered by a Galil power supply.
The design objective was to obtain an absolute control over the steering system with a
good phase and gain margin and a good unit step response. For this purpose a Galil
motion control board was used which has the proportional integral derivative controller
(PID) digital control to provide the necessary compensation required in the control of the
motor. The system was modeled in MATLAB using SIMULINK and an actual
simulation was done with various values for the three parameters of the PID controller.
33
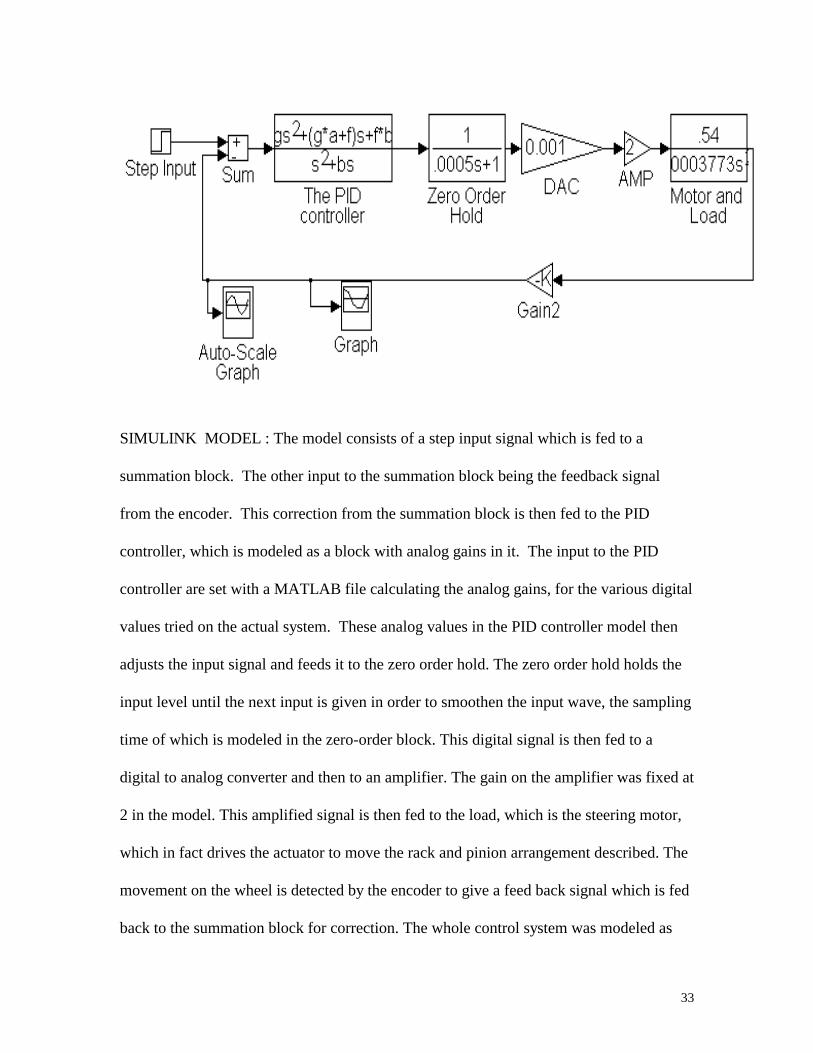
SIMULINK MODEL : The model consists of a step input signal which is fed to a
summation block. The other input to the summation block being the feedback signal
from the encoder. This correction from the summation block is then fed to the PID
controller, which is modeled as a block with analog gains in it. The input to the PID
controller are set with a MATLAB file calculating the analog gains, for the various digital
values tried on the actual system. These analog values in the PID controller model then
adjusts the input signal and feeds it to the zero order hold. The zero order hold holds the
input level until the next input is given in order to smoothen the input wave, the sampling
time of which is modeled in the zero-order block. This digital signal is then fed to a
digital to analog converter and then to an amplifier. The gain on the amplifier was fixed at
2 in the model. This amplified signal is then fed to the load, which is the steering motor,
which in fact drives the actuator to move the rack and pinion arrangement described. The
movement on the wheel is detected by the encoder to give a feed back signal which is fed
back to the summation block for correction. The whole control system was modeled as
34
shown in the diagram. The unit step response was also simulated in MATLAB and it was
found that the phase margin was around 40 dB and percentage overshoot was less than
15%. This values for the PID controller were tested on the actual vehicle and were fine
tuned using the software kit supplied by Galil Motion Inc. called the wsdk-1000 for
windows. This software also allowed us to estimate the frictional losses in the gear mesh,
the linear actuator and the rack and pinion mechanisms. a conservative tuning was
performed and valued for the PID controller were identified suitable for the system.
Various tests like the frequency response and the unit step response were calculated and
the position, velocity and toque plots were studied.
Some of the problems faced in the design process were in the estimation of the inertial
load. An error in the calculation led to overloading the amplifier and burnt it out. The
remedy was to specify a torque limit in the Galil motion program which would limit the
drive torque, current and voltage supplied by the amplifier. Other problems like setting
the hardware control bias voltages on the amplifier were solved. Estimation of the torque
was done analytically and then actually measured using a torque wrench.
The objective of the design was to generate enough torque to move the front wheel even
when the robot was stationary, to take input from the main control program to adjust to
follow the line and avoid the obstacles, to steer in order to keep the robot on the track
while trying to stay in the track.
The interface for the system was implemented using a Galil 1030 motion control
computer interface board. A Galil breakout board permits the amplifier and encoded to
be easily connected. The steering mechanism gets its input from the angle to be moved
35
by two inputs : the angle from the obstacle avoidance and the angle from the vision
algorithm. Feedback is provided at a low level by a position encoder and at a high level
by the vision and sonar systems.
The original steering system of the 3 wheeled cart used a rack and pinion design. This
was replaced by a computer controlled steering which is a lead screw design activated by
a Parker linear actuator. This linear actuator produces 110 ft-lb. of torque creating a
maximum turning speed of 20 degrees a second. This motor is controlled from the
computer through the Galil DMC-1030. The DMC 1030 signal is amplified by an
Electro-Craft amplifier which provides three phase voltages to the brushless DC motor
amplifier. For position feedback, a BEI encoder is directly mounted on the steering wheel
giving us a positive position feedback with 0.20 degree resolution.
Various tests were performed on the steering system. The frequency response was
measured by supplying a sinusoidal input signal to the open loop system and recording
the response through the encoder. A phase margin of 40 degrees and a gain margin of 10
decibels was achieved. Then the step response was checked to minimize the overshoot
and select a critically damped response. The actual tests were made in three conditions:
steering wheel off the ground, steering wheel on the ground with robot moving and
steering wheel on the ground with robot stationary. The torques for these conditions were
measured at: 15 foot pounds, 20 foot pounds and 30 foot pounds, respectively. Tuning of
the amplifier parameters especially loop gain and selection of the PID parameters were
very important and required iterative adjustments.
36
3.3 Safety And Emergency Stop System
The Safety system serves primarily to prevent accidents which may occur during
the operation of the vehicle. It contains three distinct sub units. These are the remote
controlled emergency stops, manually operated emergency stops, and the braking system.
The safety and Emergency system is accomplished by a remote controlled circuit
that activate the brake and cuts power to the traction motor. The brake motor is
comprised of a Delco power window motor, attached through a cable, which pulls the
existing brake pedal down. When the pedal is fully depressed a circuit holds the brake
and upon release, reverses the direction to release the brake. The use of the existing
brake mechanism has the advantage of being sized properly for the traction motor as well
as keeping costs to a minimum. The brake is controlled through a separate power and
control system, and is activate by remote control to accomplish the emergency stop
requirement. When the emergency stops is activated, it cuts the power to the traction
motor. A Block diagram of the system is shown in Figure 3.
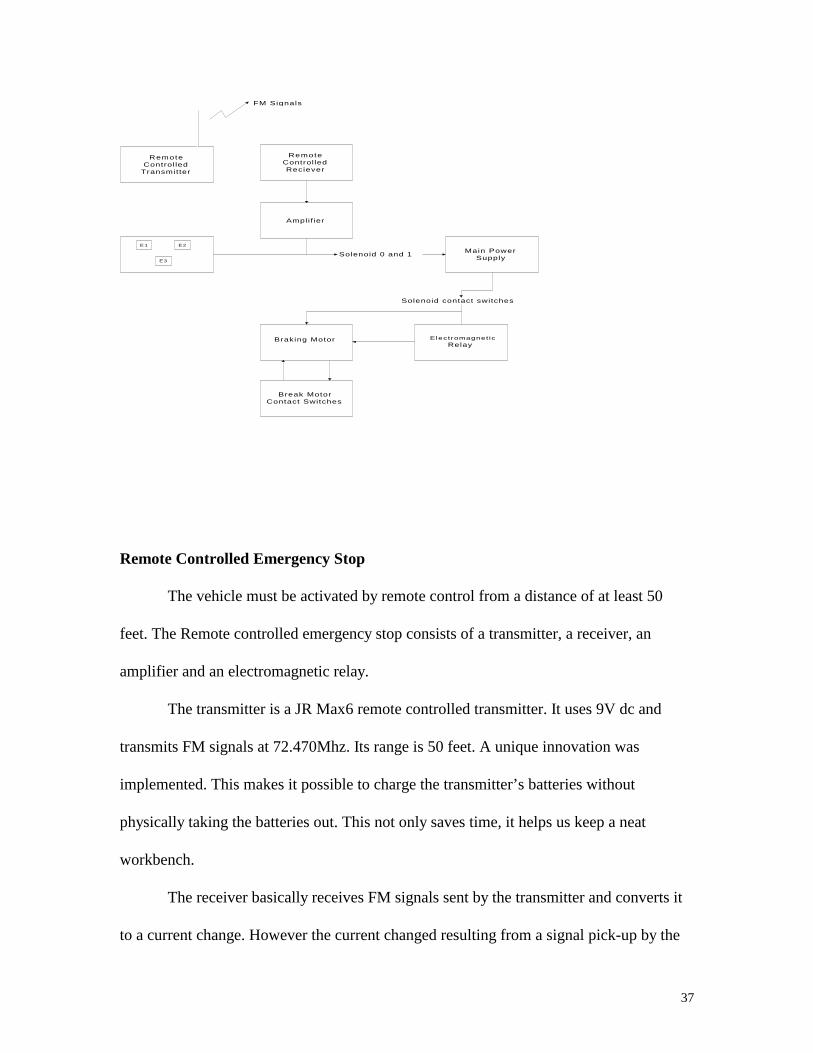
37
RemoteControlled
Transmitter
RemoteControlledReciever
Elect romagnet icRelay
Braking Motor
Amplif ier
Break MotorContact Switches
Main PowerSupply
FM Signals
E 1 E 2
E 3
Solenoid 0 and 1
Solenoid contact switches
Remote Controlled Emergency Stop
The vehicle must be activated by remote control from a distance of at least 50
feet. The Remote controlled emergency stop consists of a transmitter, a receiver, an
amplifier and an electromagnetic relay.
The transmitter is a JR Max6 remote controlled transmitter. It uses 9V dc and
transmits FM signals at 72.470Mhz. Its range is 50 feet. A unique innovation was
implemented. This makes it possible to charge the transmitter’s batteries without
physically taking the batteries out. This not only saves time, it helps us keep a neat
workbench.
The receiver basically receives FM signals sent by the transmitter and converts it
to a current change. However the current changed resulting from a signal pick-up by the
38
receiver was too small to be used by the circuit, hence an amplifier was designed and
built.
The amplifier designed was of a common emitter configuration. The gain was
120. This gain is sufficient to make the current changes produced by the receiver large
enough to be used in the circuit.
The relay board is designed such that when the receiver receives FM signals from
the transmitter, the current input pins receives current which activates the contacts of the
relay. The relay is equipped with a 3 Amp fuse to protect it from power spikes that may
occur with the system.
Manual Emergency Stop Unit
The Manual Emergency stop unit consists of three manual pull button switches
strategically located around the vehicle. One is located at the rear, another at the left hand
side and the other at the right side of the vehicle. When pushed, the brakes are activated
and the main power is shut down. This serves as a safety measure if for some reason, the
vehicle malfunctions and goes haywire. These switches are able to shut the main power
through two solenoids. A solenoid acts like a relay but it is capable of handling more
current. Basically when current flows through its gates, it closes an internal switch. So
when the manual switches are pushed, a disconnection is made which prevents current
39
from flowing through the gates of the solenoid. Hence the internal switch is open and the
main power is shut down
Braking System
The braking system is accomplished by a high torque electric motor. It is capable
of both clockwise and anti-clockwise directional motion. Upon activation, the motor turns
in the anti-clockwise direction pulling the cable attached to the existing brake pedal of the
EZ-Go Cart. This brings the vehicle to a halt. To turn the brakes in both direction, four
In the design of the braking system, two problems were encountered and
eventually solved.
The first problem was the continuos rotation of the brakes motor as soon as it is
activated. To solved this problem, an innovative idea was conceived. A double pole
contact switch was placed at the bottom of the motor. When motor starts turning, and has
pulled the cable attached to the existing brake pedal with sufficient tension, it hits one of
the contact switches. This stops the motor from rotating further.
Secondly, upon activation the brakes moved in an anti-clockwise direction pulling
the chord. However, we had to release the tension in the cable. This meant that the motor
had to turn in the opposite direction. To achieved this, the relay contacts were used. We
observed that when the polarity of the motor were reversed, its direction of rotation
changes. So the relay board was designed such when it is activated, it flips the motor in
the anti-clockwise direction. Upon deactivation, it turns the motor in the clockwise
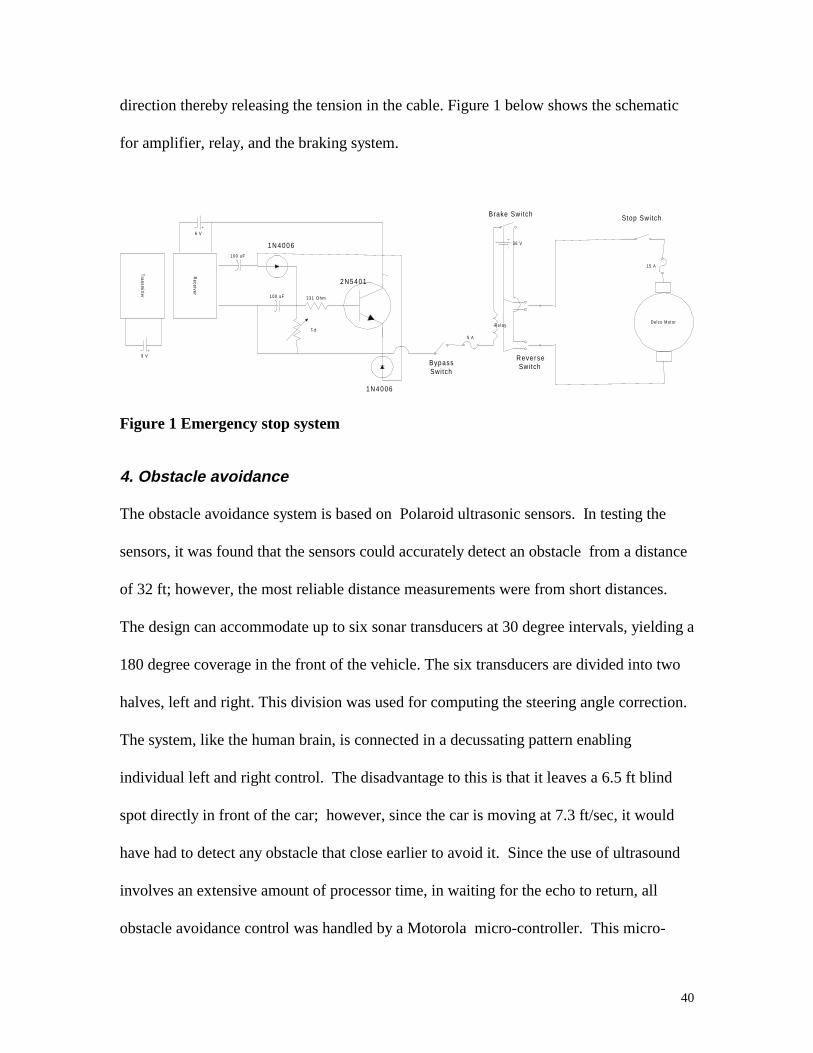
40
direction thereby releasing the tension in the cable. Figure 1 below shows the schematic
for amplifier, relay, and the braking system.
3 3 1 O h m100 uF
P1
100 uF
5 A
RelayDelco Motor
15 A
36 V
Transm
itter
9 V
Receiver
6 V
2 N 5 4 0 1
1 N 4 0 0 6
1 N 4 0 0 6
Brake Swi tch Stop Switch
ReverseSwitchBypass
Switch
Figure 1 Emergency stop system
4. Obstacle avoidance
The obstacle avoidance system is based on Polaroid ultrasonic sensors. In testing the
sensors, it was found that the sensors could accurately detect an obstacle from a distance
of 32 ft; however, the most reliable distance measurements were from short distances.
The design can accommodate up to six sonar transducers at 30 degree intervals, yielding a
180 degree coverage in the front of the vehicle. The six transducers are divided into two
halves, left and right. This division was used for computing the steering angle correction.
The system, like the human brain, is connected in a decussating pattern enabling
individual left and right control. The disadvantage to this is that it leaves a 6.5 ft blind
spot directly in front of the car; however, since the car is moving at 7.3 ft/sec, it would
have had to detect any obstacle that close earlier to avoid it. Since the use of ultrasound
involves an extensive amount of processor time, in waiting for the echo to return, all
obstacle avoidance control was handled by a Motorola micro-controller. This micro-
41
controller does all timing and distance calculations. In using the sensors at different
angles, we have associated with each one a maximum range and a maximum steering
angle.
Communications is achieved using a four port RS-232 protocol over the control
computer's serial port. The computer is continually scanning for steering corrections due
to obstacles. Once an obstacle is detected at a minimum distance, the control program
corrects the steering angle. While the vehicle is in obstacle avoidance mode it,
completely ignores the lane markers; however, when the obstacle signal is gone the vision
signal again takes over the control.
In our obstacle avoidance testing, we first discovered that the sensors were too
low, picking up the grass and forcing a constant side-to-side motion. This was corrected
using blinders that direct the sonar signals away from the grass. While it worked, we
found more blind spots in its forward looking view. Each sonar can see 30 degrees;
however, the effective range at the outer limits decreases significantly. We will have to
add more sensors at smaller angles. Also when the cart steers around obstacles, it has a
tendency to resume line following too early and have the middle or rear collide with the
obstacle. This can be corrected by again adding sensors, one in the middle of the length
so that the car will only correct when it has passed the obstacle.
5. Line Tracking
42
5.1 Vision processing Equipment
For line tracking, two JVC CCD cameras are used for following the left and right lines.
Only one line is followed at a time; however, when one camera loses the line, a video
switch changes to the other camera. Image processing is accomplished by the Iscan
image tracking device. This device finds the centroid of the brightest or darkest region in
a computer controlled window, and returns the X, Y coordinates of its centroid as well as
size information of the blob. If no object is found, a loss of track signal is generated.
This information is updated every 16 ms, however the program must wait 10 ms after
moving the window to get new data. This results in a 52 ms update time for the vision
system.
5.2 Angle and minimum distance algorithms
To determine the angle and minimum distance to the lane markers, the following general
algorithm is used:
1. Move window to first position
2. Capture first point
3. Move window to second position
4. Capture second point
5. Calculate angle and distance of the line, through the following method
5.3 Calibration algorithm

43
A calibration device was constructed to permit measurement of corresponding three
dimensional object points and image points. The determination of the camera focal
lengths and the orientation of the projection system (system identification) with respect to
the global coordinates system can be obtained by several methods as described in the
introduction. In this study, a calibration device was constructed to accomplish system
identification.
5.4 Calibration Device
Figure 5 shows the calibration device lying on a scaled graph sheet. The device
comprises a wooden base, painted black for contrast, six white Ping-Pong balls shaped
knobs, and two five inch long poles. The wooden base is 14.5" x 11.5" x 0.75". Four of
the balls are placed on the same plane (the surface) of the wooden base while the other
two balls are supported by the poles which are pinned to the wooden base. Six other
darkened points are spotted on the graph sheet, bringing the total points considered for the
calibration to twelve. The points on the graph sheet are considered to be on the ground
level. Starting from the surface of the wooden base, the balls are given alphabetic labels
in a counter clockwise direction. Each of the corners of the wooden base is numerically
labeled, also in a counter clockwise direction, with the corner #1 coinciding with ball A.
Accurate measurements of the exact coordinates of all the twelve points with
respect to the reference point is an essential factor in the calibration process. To attain the
needed high accuracy, a coordinate measuring machine, whose accuracy is about
44
±0.0001", was utilized to measure the centroid of the six balls with respect to the tip of
corner #1 of the wooden base. The darkened points on the graph sheet are also precisely
located with respect to the tip of corner #1. To obtain the actual physical measurements
of each of the twelve calibration points with respect to a reference point, in this case the
centroid of the robot, the X and Y distances between the tip of corner #1 of the wooden
base and the centroid of the robot is carefully and painstakingly measured.
Each point of the calibration system now has an accurate physical coordinate with
reference to the centroid of the robot and their corresponding image coordinates are
obtained via Iscan, the image processing tool. From the physical and image coordinates,
the camera parameters (coefficients) are computed.
5.7 Vision System
The camera is angled down at 32 degrees and panned to the right at 30 degrees.
This setup gives a 4 ft wide view of the ground. Once the data points are collected they
are entered into the algorithms. From these calculations the angle and distance are then
sent to the motion control sub-system.
In the ongoing vision guidance testing, we have made several changes. The most
notable was a test with the regular JVC camera. The system was capable of following
shallow turns in either direction; however, as it approached a hard left turn, it crossed
over. This was due to two major causes; first the speed of the cart was not proportional to
45
the steering, leading to an insufficient amount of time to correct for the new angle. Even
with this factor added in as it is now, it still crossed the line. This second failure was due
to the fact that even while slowing down, the small viewing area of the camera lost sight
of the line, and therefore still crossed over. This emphasizes the need for a non-lurching
type mobile robot traveling at high speeds with sharp turns, to use the omni-directional
system.
Following is a description of each of the six functional units of the robot:
(SOMETHING MORE)
( Include information the contest and its rules too - that would define expected
performance of the system and a deviation from these would be a ‘Fault’ for the
purposes of our Fault Diagnosis System )
(Include picture of the robot placed on the track )

46
1. The Golf-cart frame:
The robot has been built on the body-frame of a golfcart cart. It has a 3-wheel
body with a primarily flat frame. This frame acts as a platform board for the mobile robot.
It supports the weight of the heavy equipment such as the batteries, computers, Iscan
tracker etc. The physical shape of the frame provides convenient locations to mount the
CCD cameras and the Ultrasonic units. The rear wheel drive transmission system on the
cart provides the means for locomotion for the robot.
(Is the same original motor used ?)
The modified mechanical steering mechanism of the cart provides
maneuverability to the robot. Of the three wheels steering drive is provided to the front

47
wheel and the two rear wheels act as followers. This is ideal since the major weight of the
robot is distributed in the rear area where the batteries are placed.
(Is the frame used as a ground for any of the electrical ccts.)
(Anything else)
(Scan photograph of the body (stripped robot) if possible. If not include a photo
revealing the flat frame, camera and battery mounting locations and the steering as well as
the wheels )

48
2. Vision system :
The purpose of the vision system is to obtain information from the changing
environment - the obstacle course. The robot then adapts to this information through its
controller, which guides the robot along the obstacle course.
The Vision system consists of 2 CCD cameras, Iscan Tracker unit, Video monitor.
The cameras are of the of the Charged Couple Device type. They act as the eyes of the
robot. They are mounted on the robot on either side of the golf cart such that each can
track the line only on their side. They are in continuous operation and successively pick
up points on the line. The points picked by the camera are visible on the video monitor.
(Something @ the video monitor )
49
Thus one can ensure whether the points picked indeed lie on the line and are of
the required pixel size (5*15). The points visible in the video monitor are grabbed by the
Iscan Tracker unit which is the Image Processing tool for the system. This device finds
the centroid of the brightest or darkest region in a computer controlled window and
returns its X and Y co-ordinates as well as size information. This information is updated
every 16 ms, however the program must wait 10 ms after moving the window to get new
data. To establish a line two points are required. This results in a 52 ms update time for
tracking two points in sequence. The frequency of updates is approximately 19 Hz.
At any given time only one camera is active. If the point picked by the camera is
not ‘good’ the Iscan Tracker unit gives a Loss of Track signal. If five consecutive points
picked are not ‘good’ then the control is switched over to the other camera through a
video switch.
The ISCAN tracker unit computes the centroid of the points scanned by the
camera. These are then accessed by the Central computer through a software routine. The
vision algorithm then translates these image co-ordinates into physical 3D co-ordinates on
the ground. The entire procedure is repeated to calculate the 3D co-ordinates for another
point. These two points define the line. From this information the distance between the
line and the centroid of the robot and the angle of the line with respect to the robot is
computed. If it is found necessary to change the steering angle a function in the main
program conveys the appropriate signal to the Gallil board which controls the steering
motor.
50
(sOMETHING more @ software : C++ programs , system requirements, info on how to
debug , test these programs)
(what @ calibration device)
(picture of calibration device )
(Pictures of the camera as mounted on the vehicle)
(Exploded view of the internal construction of the camera)
(Pictures of the ISCAN Tracker along with its control panel and the function
of each switch on the panel )
(Pictures of the Video monitor and other paraphernalia )
(Circuit diagram of the entire circuit including power connections as well as the video
switch etc.)
51
3. Obstacle Avoidance System :
The robot uses an ultrasonic obstacle avoidance system. Three sonars each are
mounted on the lower front corners of the vehicle. They transmit ultrasonic waves which
reflect from obstacles on the track. Depending on the time of travel for the waves, the
distance of the obstacle with respect to the vehicle is calculated by the Minicomputer
Mc68HC11. Depending on this relative distance the software computes the angle to
which the robot should be steered in order to clear the obstacle. The steering motor is
then actuated to turn to the required angle.
(Mention role of Galil Board)
(role of software : similar info on C++ programs and Hardware requirements as in the
vision system)
(Picture of the sonars mounted on the robot.)
(Picture of the Mc showing all its wires and its physical location on the robot )
(Circuit diagram of the sonar system including power connections )
52
4. Speed Control :
The robot uses a EV-1 Speed Controller. This is a commonly used speed regulator
in industrial Fork Lifts. It has certain useful safety features.
(Descripton from the EV-1 trouble shooting manual )
(Pictures from the manual )
(Pictures showing physical location of the unit on the robot and associated equipment)
(Cct diagram or the entire unit )

53
5. Steering System:
6. Power Sytem:

54
7. Braking System:
55
5. Potential Failure Modes and Effects Analysis
Potential Failure Modes and Effects Analysis as defined by the Automotive
Industry Action Group (AIAG) is a systematized set of activities intended to :
1. Recognize and evaluate the potential failure mode of a product/process and its effect .
2. Identify actions which could eliminate or reduce the chance of potential failure
56
occurring .
3. Document the analysis procedure.
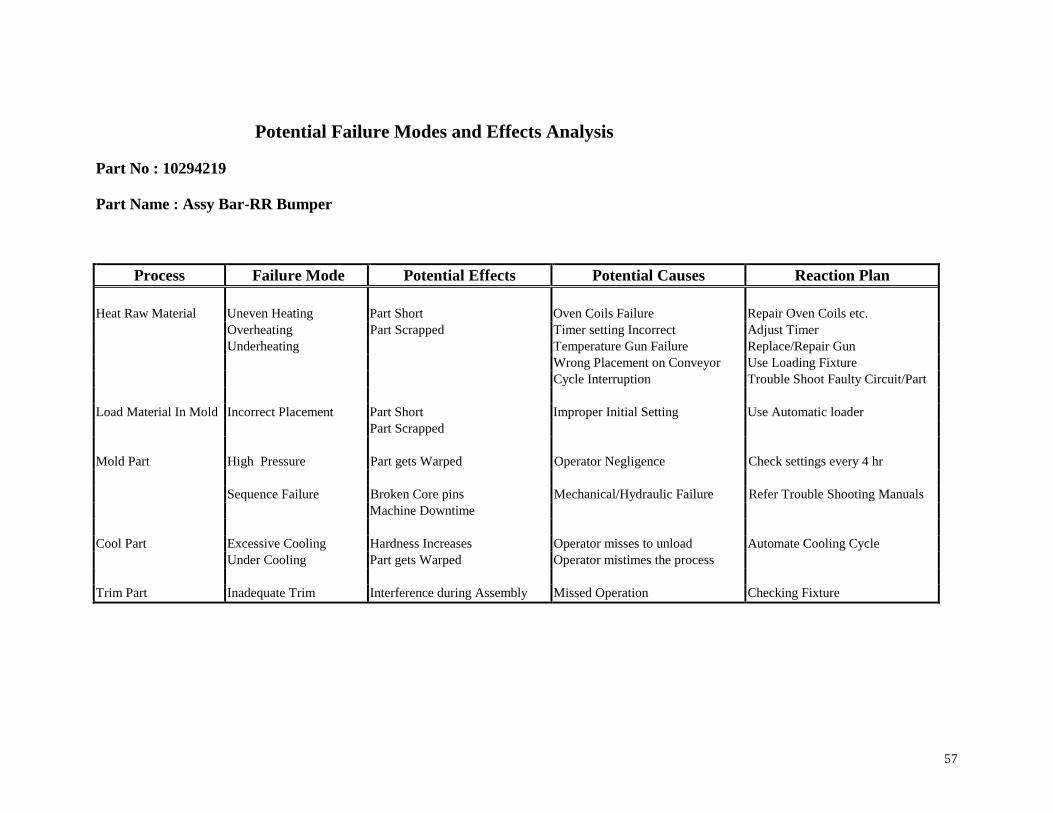
This tool has been widely used in assuring quality of products by the automobile
industry. For a rubber molded supplied for e.g. the PFMEA would contain detailed
information on the different processes the molding goes through. This would start with
the heating the raw material to the final finishing and trimming operation. All the process
parameters along with their target values are mentioned in the PFMEA. The potential
failure modes , the corresponding effects , their potential causes and corresponding
correcting actions are documented.
57
Potential Failure Modes and Effects Analysis
Part No : 10294219
Part Name : Assy Bar-RR Bumper
Process Failure Mode Potential Effects Potential Causes Reaction Plan
Heat Raw Material Uneven Heating Part Short Oven Coils Failure Repair Oven Coils etc.Overheating Part Scrapped Timer setting Incorrect Adjust TimerUnderheating Temperature Gun Failure Replace/Repair Gun
Wrong Placement on Conveyor Use Loading FixtureCycle Interruption Trouble Shoot Faulty Circuit/Part
Load Material In Mold Incorrect Placement Part Short Improper Initial Setting Use Automatic loaderPart Scrapped
Mold Part High Pressure Part gets Warped Operator Negligence Check settings every 4 hr
Sequence Failure Broken Core pins Mechanical/Hydraulic Failure Refer Trouble Shooting ManualsMachine Downtime
Cool Part Excessive Cooling Hardness Increases Operator misses to unload Automate Cooling CycleUnder Cooling Part gets Warped Operator mistimes the process
Trim Part Inadequate Trim Interference during Assembly Missed Operation Checking Fixture
58
For the robot under consideration the PFMEA was considered to be an excellent
tool for the exploratory phase of uncovering relationships between failures, causes and
remedies and also the interplay between different functional units of the robot.
Such an approach has not been tried before and there it was an innovative idea.
For analyzing the robot with a a PFMEA the following strategy was used.
Potential Failure Modes are the different ways in which the system can possibly go
wrong. For e.g. :
Steering related failure modes such as Inability to turn the correct angle.
Vision system related failures such as robot cannot pick points etc.
Potential Effects lists the different symptoms/ consequences of a given failure mode.
For e.g. Robot does not start / Move
Robot goes off-track
Robot hits obstacle
Potential causes list the probable reasons leading upto the failure mode. These could be
failures in the hardware units, the software routines or the presence of certain external
factors. For e.g.:
Sonars not working.
Software routine calculating distance from obstacle not working.
Threshold limit for vision system cameras not reached
59
Action Plan is the suggested measure or series or measures the counteract the
given failure mode. This is to be undertaken after the deductive phase of fault diagnosis
has been completed. For e.g.:
Recharge Batteries
Adjust Steering Amplifier settings.
Check Continuity in circuits.
Thus the entire gamut of potential Failure scenarios was explored. Individual
elements of each of these exhaustive sets were then mapped to obtain a correspondence
and thus defining the relationships between them.

60
Power Unit Related PFMEA
Failure Modes Potential Effects Potential Causes Action Plan
1. No power 1. Robot does not start. 1. Battery down 1. Check Voltage recharge if <36 V
2. Camera & ISCAN tracker donot work
2. Fuse blown 2. Replace fuse
3. Computer does not work 3. Loose wires 3. Secure wiring connections4. Traction Motor doesn't start 4. Power cct open 4. Check continuity in circuits to
find5. EV-1 doesn't hum defective component
2. Power low 1. Moving robot stops 1. Remote E-Stop out ofrange
1. Get the unit within range.
2. Computer reboots voluntarily 2. Battery down 2. Recharge Batteries3. Robot does not start.4. Camera & ISCAN tracker donot work5. Computer does not work6. Traction Motor doesn't start
61
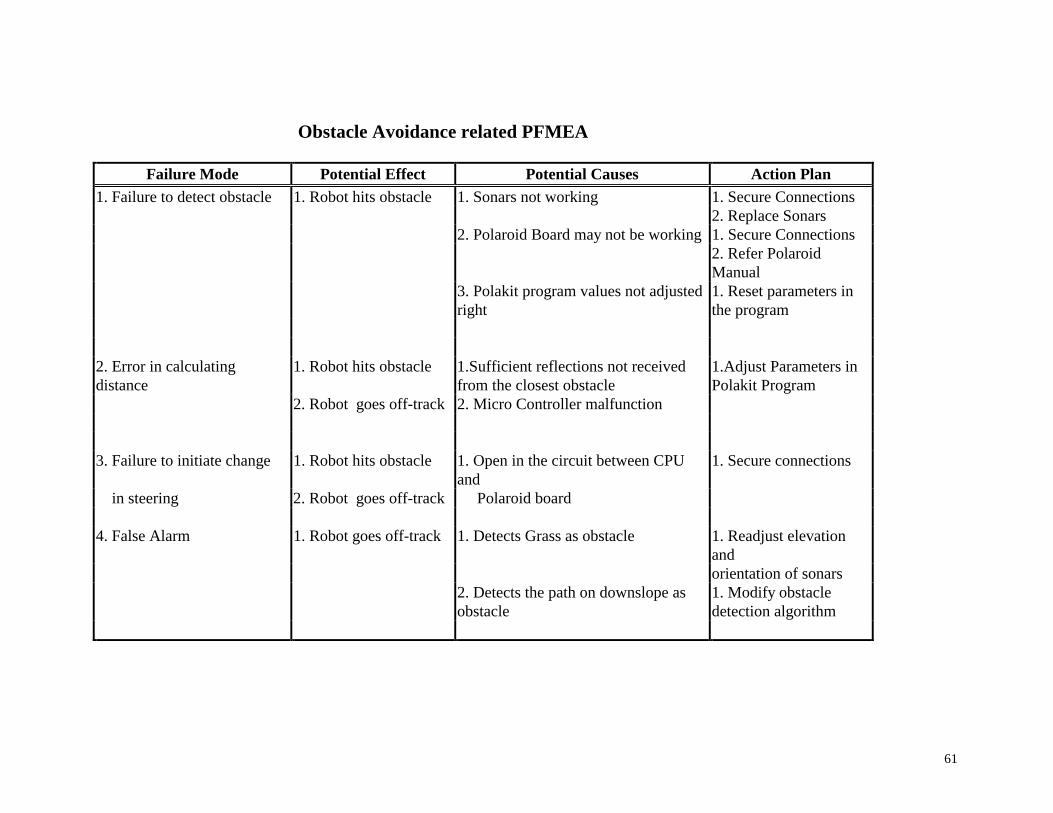
Obstacle Avoidance related PFMEA
Failure Mode Potential Effect Potential Causes Action Plan1. Failure to detect obstacle 1. Robot hits obstacle 1. Sonars not working 1. Secure Connections
2. Replace Sonars2. Polaroid Board may not be working 1. Secure Connections
2. Refer PolaroidManual
3. Polakit program values not adjustedright
1. Reset parameters inthe program
2. Error in calculatingdistance
1. Robot hits obstacle 1.Sufficient reflections not receivedfrom the closest obstacle
1.Adjust Parameters inPolakit Program
2. Robot goes off-track 2. Micro Controller malfunction
3. Failure to initiate change 1. Robot hits obstacle 1. Open in the circuit between CPUand
1. Secure connections
in steering 2. Robot goes off-track Polaroid board
4. False Alarm 1. Robot goes off-track 1. Detects Grass as obstacle 1. Readjust elevationandorientation of sonars
2. Detects the path on downslope asobstacle
1. Modify obstacledetection algorithm
62
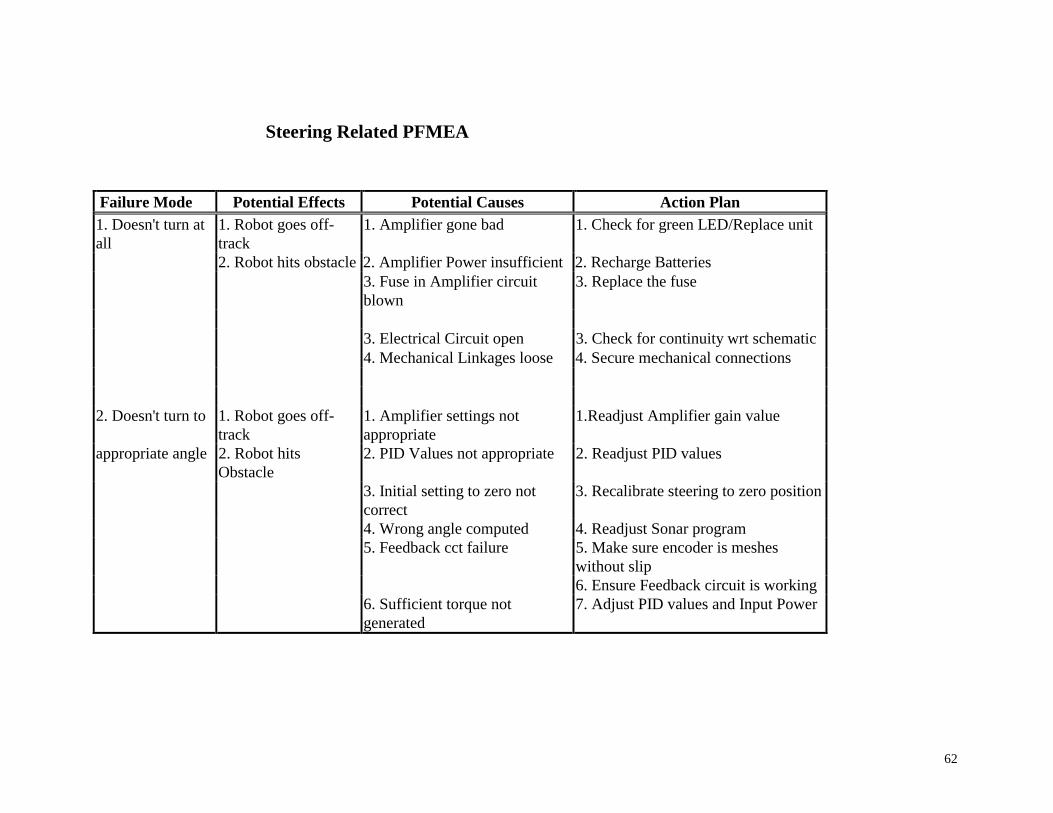
Steering Related PFMEA
Failure Mode Potential Effects Potential Causes Action Plan1. Doesn't turn atall
1. Robot goes off-track
1. Amplifier gone bad 1. Check for green LED/Replace unit
2. Robot hits obstacle 2. Amplifier Power insufficient 2. Recharge Batteries3. Fuse in Amplifier circuitblown
3. Replace the fuse
3. Electrical Circuit open 3. Check for continuity wrt schematic4. Mechanical Linkages loose 4. Secure mechanical connections
2. Doesn't turn to 1. Robot goes off-track
1. Amplifier settings notappropriate
1.Readjust Amplifier gain value
appropriate angle 2. Robot hitsObstacle
2. PID Values not appropriate 2. Readjust PID values
3. Initial setting to zero notcorrect
3. Recalibrate steering to zero position
4. Wrong angle computed 4. Readjust Sonar program5. Feedback cct failure 5. Make sure encoder is meshes
without slip6. Ensure Feedback circuit is working
6. Sufficient torque notgenerated
7. Adjust PID values and Input Power
63
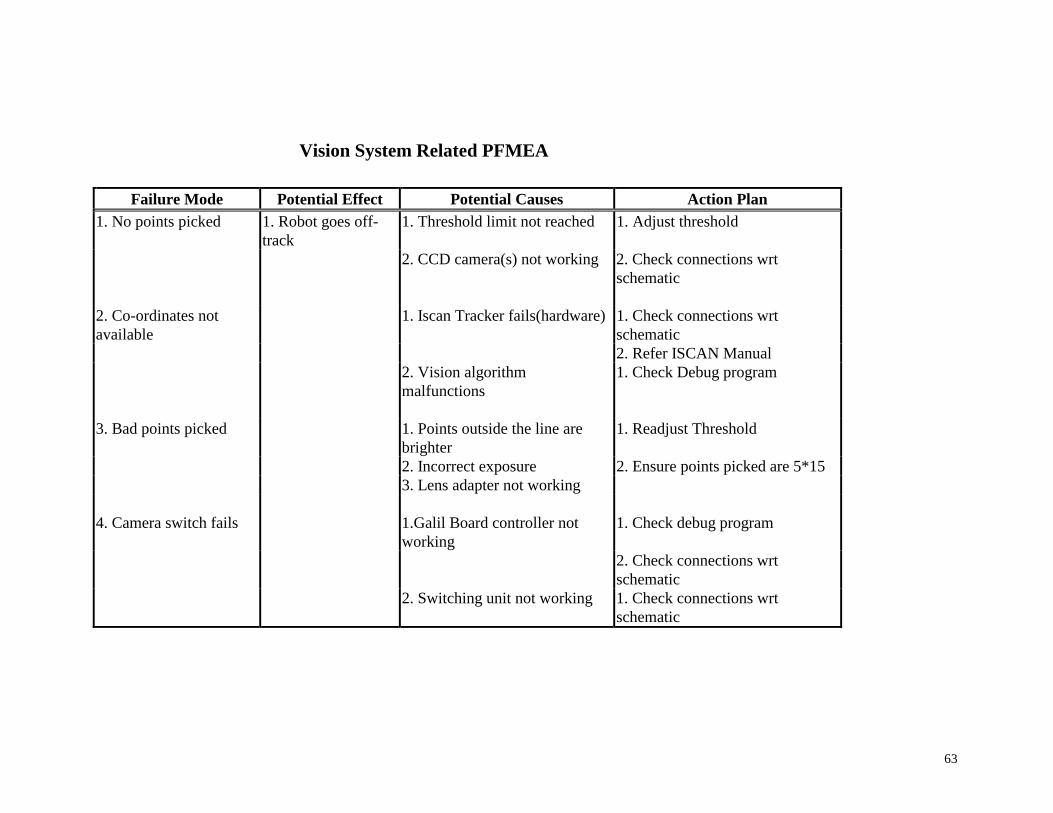
Vision System Related PFMEA
Failure Mode Potential Effect Potential Causes Action Plan1. No points picked 1. Robot goes off-
track1. Threshold limit not reached 1. Adjust threshold
2. CCD camera(s) not working 2. Check connections wrtschematic
2. Co-ordinates notavailable
1. Iscan Tracker fails(hardware) 1. Check connections wrtschematic2. Refer ISCAN Manual
2. Vision algorithmmalfunctions
1. Check Debug program
3. Bad points picked 1. Points outside the line arebrighter
1. Readjust Threshold
2. Incorrect exposure 2. Ensure points picked are 5*153. Lens adapter not working
4. Camera switch fails 1.Galil Board controller notworking
1. Check debug program
2. Check connections wrtschematic
2. Switching unit not working 1. Check connections wrtschematic

64
7. The Master Program
The Fault Diagnostic System is basically a Visual Basic program. The mainfeature
of this system are summarized below:
1. The system possess detailed functional, structural and architectural knowledge of the
entire system along with the interplay between different subsystems.
2. The system has been developed in Visual Basic which is extremely user-friendly and
interactive.
3. The system is easy to understand, operate and has a high speed of operation.
5. The system supports graphics. Hence, visual information such as schematics,
photographs etc. can be stored for ready reference.
6. The system stores information on equipment performance and failures. This can
suggest valuable recommendations for future design revisions besides acting as a resource
for a maintenance and service system in the long term.
7. The problem of inapplicability of the Boolean logic in situations where the system has
partial success is taken care of by installing a failure log that documents such special
conditions and keeps the user aware of the measures to rectify the partial fault.
The basic steps followed in the diagnostic phase are as follows:
1. Choose the failure mode.
2. Identify the likely faulty system.
65
3. Confirm faulty system identified in step 2.
4. Find faulty component in system verified in step 3.
5. Rectify the fault.
6. Test the faulty system.
Step 1
The Main Screen or the Starting Screen is titled ‘Nature of Fault’. This kick-off
screen contains all possible failure modes for the robot as a system in terms of their most
obvious visible symptom. Here the normal mode of operation for the robot is considered
the satisfactory navigation of the robot along the obstacle course. Hence, the robot as a
system the possible failure modes are :
Robot fails to Start
Robot goes Off-Track
Robot hits Obstacle
These statements appear as buttons on the user friendly screen. Illustration 1
shows the typical Start screen. Note, that in addition to the three failure modes another
button ‘Miscellaneous ‘ is available on the screen. It was observed during the extensive
laboratory and outdoor testing that some partial failures occur in the system though the
robot as such performs satisfactorily. For e.g. downloading of the incorrect speed program
in the operation of the robot might cause jerky motion. This cannot be considered a
failure since the robot will still follow the curve and negotiate obstacles. However, the
66
jerky motion is undesirable. Hence, failures of this type have been included under the
heading ‘Miscellaneous’. The technique of PFMEA (as well as Fault Tree Analysis)
cannot be applied to such situations where the Boolean logic of true or false does not hold
good. Hence, a remedy is to incorporate a failure log that would store information on
these miscellaneous failures so that the user can avail information to quickly fix them.
Step 2
Clicking on the appropriate button on the Main Screen initiates the diagnostic
process. Clicking on either of these buttons throws up the one of the second level
screens titled ‘ Information on Failure Scenario’. The questions on this second level
screen explore all the possible scenarios of the occurrence of that failure mode.
For e.g. if on the main screen the button ‘ Robot Hits Obstacle’ is pushed, the
corresponding second level screen shall be as shown in Illustration 2.
The options presented on this screen point towards the likely culprit systems. For e.g.
on the given illustration if the user chooses Option 1 ‘Robot went Off-track while
following straight line in the absence of an obstacle’ . Clearly this points towards the fault
lying with the Vision System since the only operation being done was line following.
If the 2 option is chosen ‘ Robot went Off-Track while following a curve ‘ it is possible
that the fault lies either with the Vision System or the Steering System. The Obstacle
avoidance system was not in play and hence is ruled out for fault diagnostic phase.

67
Option 3 ‘Robot went Offtrack in the vicinity of an obstacle’ implies a failure either with
the Steering or the Obstacle Avoidance System.
Finally Option 4 ‘ Robot went Offtrack while following a curve in the vicinity of an
obstacle presents the most complicated case involving a likely failure in one or more of
all the three systems.
Thus screen 2 helps in the first level refining of identifying the faulty subsystem.
This is of course true regardless of the option chosen in the Main Screen.
As an example, if the failure mode happens to be ‘Robot hits Obstacle’
the corresponding second level screen is as shown in Illustration 3.
Here, the question on whether the robot attempted to turn clearly
narrows down the search for the faulty system. The fact that the robot did make an
attempt to turn verifies that an obstacle was detected, in other words the sonar system is
working fine. Also, the steering mechanism is operational (though the controller may still
need some fine tuning).Thirdly, it can be inferred that the power unit is working.
Alternatively ‘Robot made no attempt to turn’ implies either the power unit or the
steering mechanism or the sonar unit or any combination of these are faulty. Further
refining is necessary to pin point the exact faulty system.
68
Step 3
Confirming the faulty system(s) from the likely ones identified in Step 2 is the third level
of the diagnostic phase. For the case under consideration it is accomplished through a
sequence of screens as seen from Illustrations 4-.
The functioning of the steering system is checked by ensuring the amplifier is
operational and the mechanical connections are secured.
Checking battery voltages and checking for continuity in circuits would reveal any
failure in the power circuit.
A visible indication of whether the fuzzy logic control program for the sonar was
executed is the debug program. Depending on the above mentioned observations the
actual faulty system among the three can be confirmed.
Step 4
After the faulty system has been confirmed, the subsequent screens ask questions that
analyze and pin point the likely faulty components. For e.g. if the Sonar system is
confirmed to be faulty, the likely faulty components are the Transducers, Polaroid board,
Power unit for the Polaroid and data cables.
Differentiation between these is possible by checking for visible symptoms such as
checking LCD display reading on sonar and drawing corresponding inferences, checking
for power
LED’s on the Polaroid board etc.
69
Step 6
The remedy for the fault would of course depend on the nature of the fault. This may
involve securing connections, repairing or replacing faulty units or making software
modifications. The Fault Diagnostic System suggests remedies to most of the commonly
observed faults. In few cases it may refer the user to the Maintenance manual for the
bought component confirmed to be faulty.
Step 7
The System suggests a method for checking whether the repair process concluded has
achieved the desired effect. This could be done , in case of the steering mechanism, by
running the system in the manual mode. In other cases, appropriate and feasible testing
are suggested.
9. References
1. Zvi S. Roth, Self Repair and Self Organizing Robots, International Encyclopedia of Robotics, pg. 862-867.
2. Ludo F. Gelders, Liliane M. Pintelon, Reliability and Maintenance of Robots,International Encyclopedia of Robotics, 1990, pg. 769-775.
3. R.E. Barlow and H.E. Lambert , Introduction to Fault Tree Analysis, Reliability andFault Tree Analysis - Theoretical and Applied Aspects of System Reliability an SafetyAssessment , SIAM, Philadelphia., 1975, pg. 7-35.
70
4. J. B. Fussel, Computer Aided Fault Tree Construction for Electrical Systems ,Reliability and Fault Tree Analysis - Theoretical and Applied Aspects of SystemReliability an safety Assessment , SIAM, Philadelphia., 1975, pg. 37-56.
5. G.J. Powers, F.C. Tompkins and S.A.Lapp, A Safety Simulation Language forChemical Processes: A Procedure for Fault Tree Synthesis - Theoretical and AppliedAspects of System Reliability an safety Assessment , SIAM, Philadelphia., 1975,pg. 57-76.
References
1. Textron Inc., Owner’s Operation and Service Manual, Augusta, Georgia(1987).2. General Electric, EV-1 SCR Control Manual, Charlottesville, Virginia(1986).3. Galil Inc., DMC-1000 Technical Reference Guide Ver 1.1, Sunnyvale, California(1993).BEI Motion Systems Company, Model H20 Technical Specifications, Goleta, California(1992).

71

72

73

74

75

76

77

78