a fast and accurate computational approach to protein ionization: combining the generalized born...
DESCRIPTION
We report a fast and accurate computational method to calculate the pH dependent electrostatic effects in protein molecules. The method combines the Generalized Born approximation with an iterative mobile clustering approach to predict the equilibria of proton binding to multiple titratable sites in a macromolecule. The computational protocol also includes a novel algorithm to construct and refine the coordinates of all hydrogen atoms at a given pH. The tests on a set of 24 proteins demonstrate a high accuracy of the predicted pKa values with an average r.m.s. error close to 0.5 pK units. The comparisons to the available neutron-diffraction data also show a high accuracy of the predicted hydrogen positions. The use of the GBIM (Generalized Born with Implicit Membrane) approach makes the method applicable not only to water soluble proteins but also to proteins embedded in membrane. The method is implemented as a computational protocol in the Accelrys Discovery Studio software. We will demonstrate the function of this protocol based on a study of the activation mechanism of Beta 2-adrenergic receptor. The protonation states of the receptor and ligands and the binding energy of agonists and inverse agonists are calculated as a function of pH and at different stages of molecular dynamics trajectories.TRANSCRIPT

A fast and accurate computational approach to protein ionization: combining the Generalized Born model with an iterative mobile cluster method
Velin Z Spassov, Accelrys

© 2008 Accelrys, Inc. 2
Outline
• Introduction
• Background/theory
• Results/validation
• Conclusions

© 2008 Accelrys, Inc. 3
INTRODUCTION
Protein Ionization and pKScientific Needs• To provide a fast and convenient way to study the effects
of the pH changes on a wide range of important mechanism such as enzyme catalysis, ligand binding and protein stability.
• In protein modeling, a correct assignment of protonation states and hydrogen atom positions are critical for:
» Accurate docking of small molecules to receptors» Accurate protein-protein docking» Stable, convergent molecular dynamics simulations

© 2008 Accelrys, Inc. 4
IntroductionCalculate Protein Ionization and Residue pKA new Discovery Studio computational protocol to calculate the pH dependent electrostatic effects in protein molecules*.
Calculates:– the titration curves and pK1/2 of the titratible residues.– the electrostatic contribution to the protein free energy as a function of pH.– the pH dependency of the folding energy of the protein and the pH optimum
of protein stability.– pI of the protein.
Optimizes the positions of all hydrogen atoms and – automatically sets the protonation state of each residue at a given pH, based
on the calculated pK1/2 .– finds the optimal proton binding sites for tautomeric ASP, GLU and HIS
residues.– flips the O and N atoms of ASN and GLN residue to find an optimal
conformation.
*Spassov, V.Z. and Yan, L. (2008) Protein Science,17,1955-1969.

© 2008 Accelrys, Inc. 5
Protein Ionization and pK: Background
• Titratable residues: exist in protonated and deprotonated forms
• A titration curve gives the fractional protonation of a titratable group as a function of pH
Titratable Groups in Proteins
B:ASP30
0
0.2
0.4
0.6
0.8
1
1.2
0 2 4 6 8 10 12 14 16
B:ASP30
pK1/2 = 3.9
Deprotonated Protonated Deprotonated Protonated
Arg Lys
Asp
N-terCys
Glu
Tyr His
C-terpH = pKa + log10{[A-]/[HA]}
HA + H2O H3O+ + A-
H+
H+

© 2008 Accelrys, Inc. 6
Extended GB/IM2,3,4,5 instead of grid based PB solvers
THEORYCalculate Protein Ionization and Residue pK
( ) ∑∑ +−=ji
jiij
N
iiintri xxWpKpHxRTpHG
,, ),(2/13.2),(X
]/),(exp[
]/),(exp[),(2
1RTpHG
RTpHGpHN
ll
ll
∑=
−
−=
X
XXρ
[ ]),(),()303.2( 1modint MMHGPPHGRTpKpK r ∆∆−∆∆+= −
IMC6 instead of Monte Carlo
CHARMM force-field
Library of pentapeptide model compounds and pKmod data7
instead of monopeptides
Ionization Model1
1Bashford D, Karplus M. (1990) Biochemistry, 29, 10219-10225.2Still, W.C. et al. (1990)J. Am. Chem. Soc. 1990, 112, 6127-61293Dominy, B.N.,Brooks III, C.L. (1999) J. Phys. Chem. B 103, 3765-3773.4 Onufriev A. et al. (2000) J. Phys. Chem. B 2000, 104, 3712-3720.
5Spassov VZ et al. (2002) J. Phys. Chem B106:8762-8738.6Spassov V.Z., Bashford, D. (1999) J..Comput. Chem.,20,1091-1111.7Thurlkill et al. 2006. Protein Science,15,1214-1218.
CHARMm-based Protocol for Preliminary Optimization

© 2008 Accelrys, Inc. 7
Protein Ionization and pK: Solution
1. Spassov, et al, Protein Sci. 2008, 17, 1955-1969)
• New method1 to ‘Calculate Protein Ionization and pK’– Predicts pK1/2 and titration curves for each titratable residue using 3D environment of protein– Automatically protonates the residues at a given pH according to predicted pK1/2.
• For HIS, ASP, and GLU residues the hydrogens are added to yield the lowest CHARMm energy• The N and O atoms on the side-chain of ASN and GLN residues are flipped if necessary to give the lower
energy conformation – Calculates the following as a function of pH
• Electrostatic contribution to the free energy• Estimate of relative folding energy (electrostatic contribution)• Total charge of system
– Based on CHARMm Generalized-Born methods
• Strength of Solution– More accurate and rigorous than rule-based methods– Faster and more accurate than existing Poison-Boltzmann/Monte Carlo methods– Consistent CHARMm force field used throughout
0
0.2
0.4
0.6
0.8
1
1.2
0 2 4 6 8 10 12 14
*:GLU23*:GLU38*:GLU77*:GLU97*:GLU104*:GLU107*:GLU119*:GLU129*:GLU133*:GLU135*:GLU140*:GLU145*:GLU165*:GLU183*:GLU186*:GLU219*:GLU239

© 2008 Accelrys, Inc. 8
Model Compounds
MEAD, UHBD and othersStructure: MonopeptidepK data: standard setNozaki Y, Tanford C. 1967. Examination of titration behavior. Methods Enzymol 11:715–734.
DS Protein IonizationStructure: Blocked PentapeptidesAla-Ala-X-Ala-AlapK data:Thurlkill et al. 2006. Protein Science,15,1214-1218.

© 2008 Accelrys, Inc. 9
IMC (Iterative Mobile Clustering) ApproachSpassov V.Z., Bashford, D. (1999) J..Comput. Chem.,20,1091-1111
)|','()|,()(),( kxcfkxcfkfXC outg Γ=ρ
Mean-field approach to protein ionization:One site/Single conformer Tanford C., Roxby R (1972),11,2192-2198.Clustering/distance criterion/single conformerYang A.S. et al. (1993) Proteins,15,252-265.Gilson M.K. (1993) Proteins,15,266-282.Clustering/energy criterion/single or multiple conformersSpassov & Bashford (1999)
IMC: Ntot(cluster) = Nglobal 3Nclstr2Nclstr

© 2008 Accelrys, Inc. 10
Protein Ionization and pK: Method
• Electrostatic interaction energies are calculated using an implementation of Generalized Born solvation model in CHARMm
– atomic parameters from either CHARMm or CHARMM polar hydrogen forcefields
• The energies of the protonated and deprotonated states are calculated and the percentage of protonation of each residue is predicted at given pH based on Boltzmann distribution
• Relative folding energy estimated based on energy of protonation of the protein and the protonation energy of the model compounds
• Current implementation treats protein as a single conformer embedded in a dielectric medium
– A dielectric constant of 10-11 for the protein interior gives the lowest RMSD compared to experimentally obtained pK data.
– This dielectric constant is the only parametrized variable in the method

© 2008 Accelrys, Inc. 11
Parameterization of the model
∑∑∑∑−+
−−=∆> i j jiijjiij
ji
slv
ji
mi ij jim
jielec
rr
qqIDrqq
G)4/exp(
)),,(1(166332
22, ααααε
ααεε
0
0.2
0.4
0.6
0.8
1
1.2
0 5 10 15 20 25
dielectric constant
RMSD
pK1/2 Residue Experimental* CHARMM
polar H CHARMM
LYS1_NTR 7.9 7.81 8.00 LYS1 10.6 10.01 10.01 GLU7 2.9 3.17 3.39 LYS13 10.3 10.49 10.56 HIS15 5.4 6.20 5.87 ASP18 2.7 2.87 3.11 TYR20 10.3 10.85 11.18 TYR23 9.8 10.16 10.87 LYS33 10.4 10.58 10.79 GLU35 6.2 5.05 5.90 ASP48 2.5 2.96 2.91 ASP52 3.7 4.32 4.67 TYR53 >12 11.71 >12 ASP66 <2.0 2.15 2.87 ASP87 2.1 2.43 2.97 LYS96 10.7 11.18 11.42 LYS97 10.1 10.79 10.85 ASP101 4.1 3.89 3.92 LYS116 10.2 10.12 10.09 ASP119 3.2 3.08 3.28
LEU129_CTR 2.8 2.73 2.83 rmsd 0.45 0.57
Hen-egg lyzozyme 2lzt.pdb
* Bartik et al., 1994, Kuramitsu and Hamaguchi 1980.
In contrast to some popular pK prediction programs based on multi-parameter empirical models, the only fitting parameter in our method is the value of intra-molecular dielectric constant, εm, while all other parameters are kept at their standard CHARMm force-field values.

© 2008 Accelrys, Inc. 12
Results: pK Prediction of Selected Proteins
• Comparison of experimental pK1/2 with calculated values for select PDB files
• All computations about 1 minute per system on a single CPU
PDB code
Sites with experimantal pK data
CHARMm
polar hydrogens
CHARMm
all hydrogens
PROPKA
MCCE ε = 8
1 4pti 14 0.36 0.36 0.6 0.47 2 2lzt 21 0.45 0.57 0.66 0.74 3 2rn2 25 0.59 0.68 0.72 0.87 4 3rn3 16 0.47 0.71 0.67 0.66 5 1pga 15 0.50 0.57 0.72 0.63 6 3icb 10 0.33 0.35 0.9 0.38 7 1hng 14 0.55 0.53 0.83 0.76 8 1a2p 12 0.60 0.49 0.68 0.89 9 1omu 15 0.64 0.70 0.44 1.10 10 9rnt 14 0.54 0.65 1.51 11 1bi6-heavy chain 18 0.54 0.53 0.56 12 1bi6-light chain 4 0.18 0.27 0.38 13 1rgg 24 0.84 0.89 0.97 14 1igd 16 0.35 0.36 0.62 15 135l 11 0.63 0.65 0.66 16 1div 6 0.26 0.32 0.74 17 1xnb* 13 0.70 1.09 0.62 18 1kxi 3 0.57 0.50 0.66 19 1beo 10 0.46 0.56 0.98 20 1trs 17 0.88 0.86 0.94 21 1qbs 16 0.34 0.34 0.78 22 1de3 25 0.66 0.70 1.33 23 2bus 4 0.46 0.49 0.23 24 1egf 9 0.49 0.53 0.49 Total sites 331 331 331 331 141
Average RMSD
0.508
0.548 0.742
0.720
PROPKA: Li et al. (2005) Proteins,61, 704-721.
MCCE: Georgescu et al. (2002) Biophysical Journal, 83, 1731-1748.

© 2008 Accelrys, Inc. 13
Results: pK Prediction of Selected Proteins
• Predicted results well correlate with the experimental measurements
• Computation time scales roughly linearly with residue number
• Most systems take about 1 to 2 minutes on a single CPU
0
1
2
3
4
5
6
0 100 200 300 400 500 600 700 800
residues
Tim
e [m
in]
Intel Pentium4 3.0 GHz machine
y = 0.9868x + 0.0282R2 = 0.9672
0
2
4
6
8
10
12
14
0 2 4 6 8 10 12 14pK exp
pK
calc

© 2008 Accelrys, Inc. 14
The Comparison of the accuracy of pK predictions with other methods
sites
GB/IMC
MCCE Const. pH FD/DH SCP
PROPKA
4pti 14 0.36 0.47 NA 0.35 0.33 0.6
2lzt 21 0.45 0.76 0.6 0.47 0.49 0.66
2rn2 25 0.59 0.87 0.9 1.17 0.57 0.72
3rn3 16 0.44 0.66 1.2 0.87 0.55 0.94
1pga 15 0.42 0.63 NA 0.80 0.59 0.72
3icb 10 0.33 0.38 NA 0.37 0.39 0.9
3rnt 4 0.28 0.54 NA NA 0.41 NA
Average 0.41 0.63 - 0.67 0.49 0.76

© 2008 Accelrys, Inc. 15
pK1/2 Prediction – Applications
• Application 1: Optimize the protonation state of proteins and hydrogen coordinates– Prepare the protein for other calculations, such as more stable Molecular Dynamics
simulations
• Application 2: Estimate maximum stability by studying the pH dependent folding energy of proteins
• Application 3: Calculate the electrostatic component of protein-ligand binding energies or protein-protein binding energy
• Application 4: Use unusual tritation curves to find relevant functional residues • Application 5: Estimate the effect of mutation
– pK and titration curve changes on other titratible sites when a residues is mutated– Shift of the stability of the protein to different pH when a residue is mutated
0
0.2
0.4
0.6
0.8
1
1.2
0 2 4 6 8 10 12 14
*:HIS26*:HIS95*:HIS100*:HIS115*:HIS185*:HIS195*:HIS224*:HIS248
His 95

© 2008 Accelrys, Inc. 16
Rubredoxin from Pyrococcus Furiosus at pH 8; 1vcx.pdbComparison of the predicted hydrogen positions with neutron diffraction structure
Application – Protonation and Hydrogen Coordinates

© 2008 Accelrys, Inc. 17
Application – Protonation and Hydrogen Coordinates
Comparison between the predicted protonation state of HEWL and neutron diffraction data at pH 4.7 File: 1lzn.pdb protonation pK1.2
Residue Neutron diffraction
Predicted
Experimental NMR*
Calculated
LYS1_NTR P P 7.9 8.172 LYS1 P P 10.6 10.840 GLU7 P D 2.9 3.701 LYS13 P P 10.3 11.120 HIS15 P P 5.4 7.380 ASP18 D D 2.7 3.674 TYR20 P P 10.3 11.271 TYR23 P P 9.8 10.886 LYS33 P P 10.4 11.669 GLU35 P P 6.2 5.691 ASP48 D D 2.5 2.818 ASP52 D D 3.7 4.604 TYR53 P P >12 12.000 ASP66 D D <2.0 3.526 ASP87 D D 2.1 3.389 LYS96 P P 10.7 11.456 LYS97 P P 10.1 10.933 ASP101 D D 4.1 3.916 LYS116 P P 10.2 10.220 ASP119 D D 3.2 3.456
LEU129_CTR D D 2.8 2.984
* Bartik et al., 1994, Kuramitsu and Hamaguchi 1980.
• Protonation state of HEWL: Comparison with neutron diffraction data at pH 4.7
• Asn and Gln flips:13 sucessfully predicted out 17 residues in the structure (77%)
© 2008 Accelrys, Inc. 18
A B
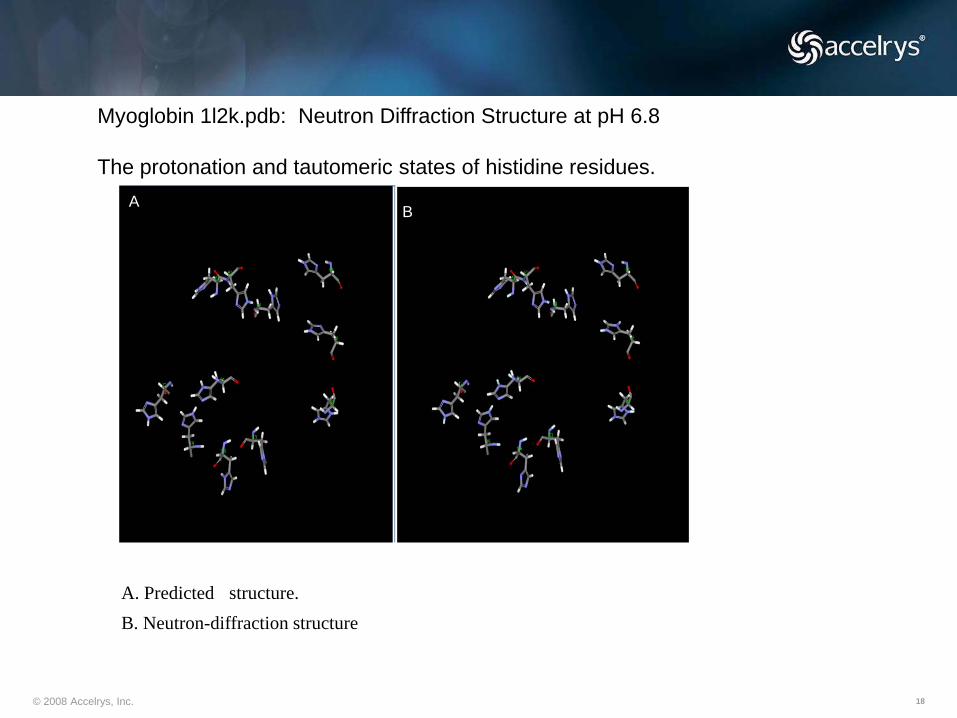
Myoglobin 1l2k.pdb: Neutron Diffraction Structure at pH 6.8
The protonation and tautomeric states of histidine residues.
A. Predicted structure. B. Neutron-diffraction structure

© 2008 Accelrys, Inc. 19
1lzn, pH 4.7
1l2k, pH 6.8
2gve, pH 8.0
6rsa, pH 6.6
ASP18
3.66 0.13 D
NTR1
7.30 0.75 NA
NTR1
7.6 0.30 P*
NTR1
7.40 0.86 P
ASP48
2.80 0.03 D
HIS12
6.76 0.48 D
HIS49
6.17 0.02 D
HIS12
6.86 0.62 P
ASP52
4.54 0.47 D
HIS24
6.69 0.47 D
HIS54
7.6 0.30 P*
HIS48
8.70 0.99 P
ASP66
3.67 0.13 D
HIS36
7.19 0.69 P
HIS71
7.03 0.11 D
HIS105
6.95 0.68 P
ASP87
3.33 0.07 D
HIS48
6.22 0.22 P**
HIS96
5.13 0.03 D
HIS119
6.50 0.43
P*
ASP101
3.90 0.18 D
HIS64
4.47 0.02 D
HIS198
6.64 0.06 P**
1vcx, pH 8
ASP119
3.45 0.08 D
HIS81
6.37 0.31 NA
HIS220
7.08 0.15 P**
NTR1
9.22 0.94 P
GLU7
3.70 0.13 P**
HIS82
6.41 0.33 D
HIS230
6.67 0.06 P**
GLU35
5.67 0.89 P
HIS97
6.28 0.26 D
HIS243
6.40 0.07 D
HIS15
7.50 0.99 P
HIS113
5.60 0.10 NA
HIS285
9.35 0.93 P
CTR129
2.90 0.03 D
HIS116
6.71 0.46 NA
HIS382
7.54 0.29 P*
HIS119
4.94 0.19 D
Comparison between calculated and experimental protonation states in neutron-diffraction structures. First row - computed pKhalf values; second row – the fractional protonations of residues. P – residue protonated in crystal structure; D – deprotonated; NA –more than one polar hydrogen is missing. In bold – accurately predicted structures; ** -completely incorrect prediction; * - underpredicted, but close.
Application – Protonation and Hydrogen Coordinates

© 2008 Accelrys, Inc. 20
Application - Optimized Protonation for Stable Molecular Dynamics • HIV Protease dimer has two Asp 25
residues in binding pocket
• Run CHARMm MD (100pS, GBSW solvent model) on two forms of the protein (PDB ID 1kzk)
– Protein with default protonation– Protein with pK-optimized protonation
(Asp 25 B protonated)Optimized-protonation of Asp 25’s in
HIV protease leads to more stable MD trajectories
RMSD of select residues to starting conformation, default protonation of Asp 25’s
RMSD of select residues to starting conformation, optimized protonation
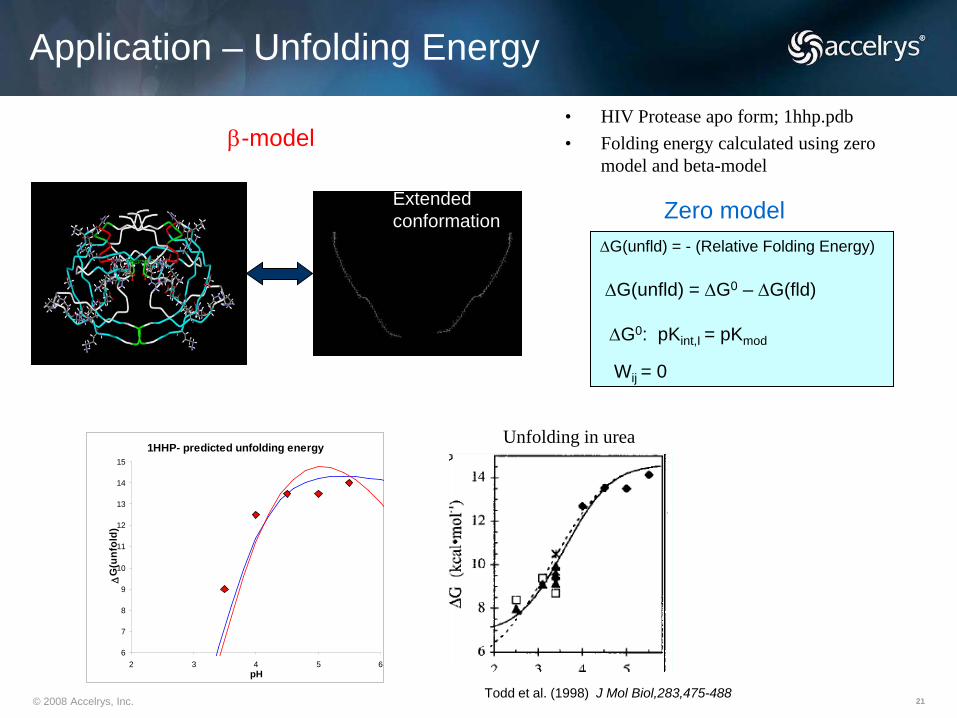
© 2008 Accelrys, Inc. 21Todd et al. (1998) J Mol Biol,283,475-488
Zero model∆G(unfld) = - (Relative Folding Energy)
∆G(unfld) = ∆G0 – ∆G(fld)
∆G0: pKint,I = pKmod
Wij = 0
Application – Unfolding Energy
1HHP- predicted unfolding energy
6
7
8
9
10
11
12
13
14
15
2 3 4 5 6pH
∆G
(unf
old)
• HIV Protease apo form; 1hhp.pdb• Folding energy calculated using zero
model and beta-modelβ-model
Extendedconformation
Unfolding in urea
© 2008 Accelrys, Inc. 22
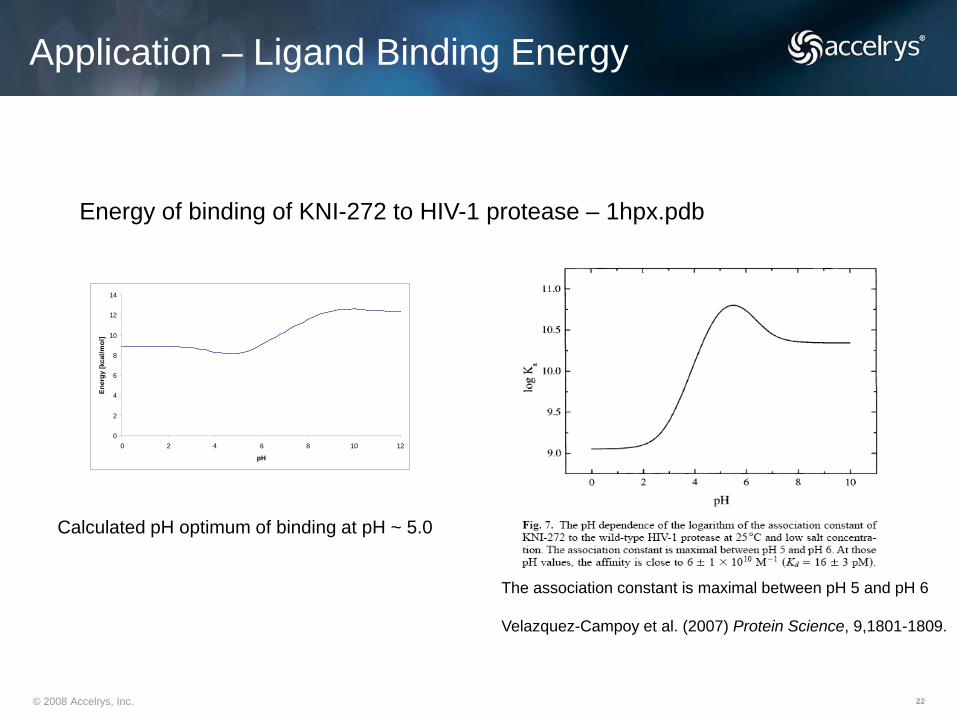
Application – Ligand Binding Energy
0
2
4
6
8
10
12
14
0 2 4 6 8 10 12
pH
Ener
gy [k
cal/m
ol]
Energy of binding of KNI-272 to HIV-1 protease – 1hpx.pdb
The association constant is maximal between pH 5 and pH 6
Velazquez-Campoy et al. (2007) Protein Science, 9,1801-1809.
Calculated pH optimum of binding at pH ~ 5.0

© 2008 Accelrys, Inc. 23
pK1/2
Calculated GBIM
Calculated without membrane
Calculated using MEAD with PB and membrane2
Experiment
ARG82 > 14 >14 >15 >13.8
ASP85 2.96 7.1 1.7 2.6
ASP96 8.80 8.7 >15 >12
ASP115 6.54 8.1 8.4 >9.5
GLU194 9.69 8.6 > 15 Proton releasegroup
keeps one proton
GLU204 3.35 8.7 < 0
ASP212 <0.00 7.1 <0 <2.5
Schiff base216
> 14 12.1 >15 >12
1Luecke et al. (1999) J. Mol.Biol.,291,899-911.2Spassov et al. (2001) J. Mol.Biol.,312,203-219
MEMBRANE PROTEINS
Bacteriorhodopsin: 1c3w.pdb1

© 2008 Accelrys, Inc. 24
β2-adrenergic G Protein-coupled Receptor: 2rh1.pdb1
antagonist: carazololagonist: epinephrine (adrenaline,a cateholeamine)
MEMBRANE PROTEINS
Calculated pK1/2
carazolol adrenaline
residue unbound bound unbound bound
Asp 113 9.4 2.6 9.4 2.4
Asp 79 8.2 8.4 8.2 8.2
Glu 122 11.0 10.5 11.0 10.8
ligand: -NH2- 9.0 12.7 8.9 13.
Ligand: catehol -OH 10.4 14.

© 2008 Accelrys, Inc. 25
β2-adrenergic G Protein-coupled Receptor: Electrostatic contribution to the free energy of ligand binding.
MEMBRANE PROTEINS
-4.00
-2.00
0.00
2.00
4.00
6.00
8.00
0 2 4 6 8 10 12 14 16
∆∆
G b
indi
ng
pH
carazolol
adrenaline
© 2008 Accelrys, Inc. 26
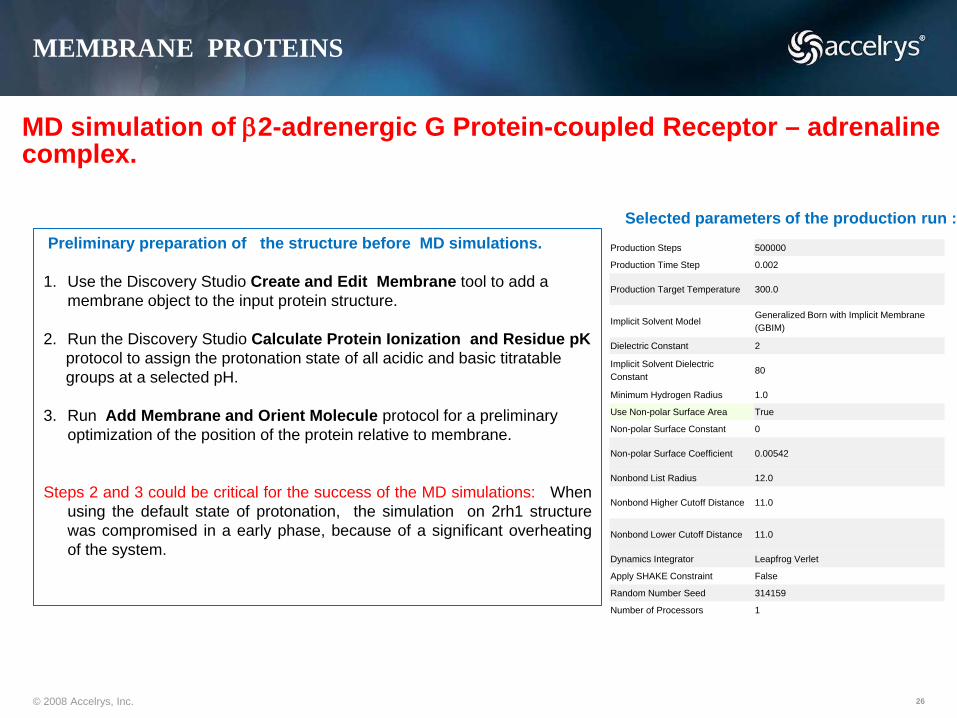
MD simulation of β2-adrenergic G Protein-coupled Receptor – adrenaline complex.
MEMBRANE PROTEINS
Selected parameters of the production run :Production Steps 500000
Production Time Step 0.002
Production Target Temperature 300.0
Implicit Solvent ModelGeneralized Born with Implicit Membrane (GBIM)
Dielectric Constant 2
Implicit Solvent Dielectric Constant
80
Minimum Hydrogen Radius 1.0
Use Non-polar Surface Area True
Non-polar Surface Constant 0
Non-polar Surface Coefficient 0.00542
Nonbond List Radius 12.0
Nonbond Higher Cutoff Distance 11.0
Nonbond Lower Cutoff Distance 11.0
Dynamics Integrator Leapfrog Verlet
Apply SHAKE Constraint False
Random Number Seed 314159
Number of Processors 1
Preliminary preparation of the structure before MD simulations.
1. Use the Discovery Studio Create and Edit Membrane tool to add a membrane object to the input protein structure.
2. Run the Discovery Studio Calculate Protein Ionization and Residue pK protocol to assign the protonation state of all acidic and basic titratable groups at a selected pH.
3. Run Add Membrane and Orient Molecule protocol for a preliminary optimization of the position of the protein relative to membrane.
Steps 2 and 3 could be critical for the success of the MD simulations: Whenusing the default state of protonation, the simulation on 2rh1 structurewas compromised in a early phase, because of a significant overheatingof the system.

© 2008 Accelrys, Inc. 27
A 1 ns MD simulation of β2-adrenergic G Protein-coupled Receptor complex with adrenaline.
RMSD values of CA atoms along the MD trajectory.
all CA atoms CA atoms inside membrane (helix 1 excluded)
MEMBRANE PROTEINS
The low dielectric environment of membrane stabilizes the structure of transmembrane helices.

© 2008 Accelrys, Inc. 28
• The combination of the GB calculations with IMC approach increases dramatically the speed of calculations and makes it possible to treat very large structures of arbitrary shape which are difficult to calculate using methods based on grid techniques to solve Poisson-Boltzmann equation and Monte-Carlo sampling schemes.
• The results of the tests indicate that the method returns very accurate pK values, comparable to the best results previously reported in the literature.
• Compared to crystallographic data at given pH, the tests show a high accuracy of the predicted protonation and hydrogen coordinates.
• The use of the GBIM CHARMm module makes it possible to study not only water soluble proteins but also protein-membrane complexes.
• The Discovery Studio implementation provides an easy way to integrate the protein ionization calculations with many other molecular modeling protocols, such as pH-dependent MD simulations, ligand docking, protein docking, ion binding. It also made it easy to study the pH dependent protein stability and the effect of mutation on protein stability.
Conclusions

© 2008 Accelrys, Inc. 29
Acknowledgments
Lisa YanPaul FlookDon Bashford