a family living wage for manitoba - canadian centre … family living wage for manitoba 2016–17...
TRANSCRIPT
A Family Living Wage for Manitoba
2016–17 Update
The 2016–17 Living Wage for Winnipeg is $14.54/ hour; for Brandon it is $14.55 and for Thompson it is $15.28. This is the amount needed for a family of four with two parents working full time to cover basic necessities, support healthy development of children, escape financial stress and participate in the community. This report is an update from the last calculation in 2013.
For more information on living wages and for resources on running living wage cam-paigns and becoming a living wage employer, visit http://www.livingwagecanada.ca
FAMILIES WHO WORK FOR LOW WAGES face impossible choices — buy food or heat the house, feed the children or pay the rent. The result can be spiralling debt, constant anxiety and long-term health problems. In many cases it means that adults in the family are working long hours, often at two or three jobs, just to pay for basic necessities. They have little time to spend with their family, much less to help their children with school work or participate in community activities.
The frustration of working harder only to fall further behind is one many Canadians can relate to. CCPA research shows that most families are taking home a smaller share of the economic pie despite working longer hours, getting more education and contributing to a growing economy.
Notwithstanding stable economic growth and consistently low unemployment, poverty remains a problem in Manitoba. In 2015, 12 per cent of Manitobans lived in low income.1 That’s up from 11.2 per cent in 2013,2 a discouraging development to be sure. Furthermore, child poverty continues to be stubbornly high, with the 2015 rate at 16.4 per cent. Child poverty has also gone up since 2013 when it was 14.5 per cent.3 We need to intensify efforts so we can consistently lower child poverty.
1 CANSIM Table 206-0041: Market Basket Measure, all persons, and persons under 18 years: 2011 base. Accessed May 31, 2017. Note: Income data from 2016 Census not available at time of writing.
2 Ibid.3 This, and past living wage report use the Market Basket Measure (MBM) as opposed to
LICO because the MBM considers the cost of living in its methodology, making it a more compatible measure for a living wage analysis.
By Lynne Fernandez
Calculations by Jesse Hajer
and James Langridge
JUNE, 2017
MANITOBA RESEARCH ALLIANCE
2 Canadian Centre for Policy Alternatives – Manitoba
The living wage is one of the most powerful tools available to address this troubling state of poverty amid plenty in Manitoba. It allows us to get serious about reducing child poverty and ensures that families who are working hard get what they deserve — a fair shake and a life that’s about more than a constant struggle to get by.
A living wage is not the same as the minimum wage, the latter being the legal minimum all employers must pay. The living wage sets a higher standard — it reflects what earners in a family need to bring home, based on the actual costs of living in a specific community. The living wage is a call to private and public sector employers to pay wages to both direct and contract employees sufficient to provide the basics to families with children.
WHAT’S IN A LIVING WAGE?
The living wage is calculated as the hourly rate at which a household can meet its basic needs, once government transfers have been added to the family’s income (such as the new Canada Child Benefit) and deductions have been subtracted (such as income taxes and Employment Insurance premiums).
The full details of the calculation methodology are spelled out in CCPA MB’s 2013 calcula-tion guide, available at https://www.policyalternatives.ca/sites/default/files/uploads/pub-lications/Manitoba%20Office/2013/11/CCPA_MB_Calculation_Guide_.pdf. The biggest difference between 2013 and 2016 is the change from the federals government’s Universal Child Care Benefit (UCCB) and Canada Child Tax Benefit (CCTB) to the new Canada Child Benefit (CCB). The switch occurred in July of 2016, the month each year when benefit rates are reset based on net family income reported in the previous tax year.
This update was completed in early 2017 and is based on the most recent data available at the time — most of which covers 2016. Accordingly, credits, costs and inflation are cal-culated to the end of 2016.
The living wage is based on:
• A family of two parents with two children aged four and seven. (According to the 2011 census,4 72 per cent of families with children in Manitoba are headed by couples and 63 per cent of them have two or more children. Twenty eight per cent of families with children are single-parent families. Finally, 11 per cent of persons in private households reported living alone5).
• Both parents working full-time, at 35 hours per week.
• Estimated family expenses in 10 categories (see the box on page 3).
• The cost of government deductions (provincial and federal taxes, Employment Insurance premiums and Canada Pension Plan contributions).
• The value of government transfers like the new Canada Child Benefit.
• Employers providing minimal paid vacation and sick time.
4 At time of writing, 2016 Census data on families were not available.5 Statistics Canada. 2012. Census Profile – Manitoba. Statistics Canada Catalogue no. 98-316XWE.
Accessed September 20, 2013.
A LIVING WAGE IS:
Based on the
principle that full-
time work should
provide families
with a basic level
of economic
security, not keep
them in poverty.
The amount needed
for a family of four
with two parents
working full-time to
pay for necessities,
support the healthy
development of their
children, escape
financial stress, and
participate in the
social, civic and
cultural lives of their
communities is:
$14.54/hour
in Winnipeg
$14.55/hour
in Brandon
$15.28/hour in
Thompson
A Family Living Wage for Manitoba. A 2016–17 Update 3
This methodology follows the model for living wage calculations used across the country, with 25 communities in Canada calculating their local living wage based on this approach.
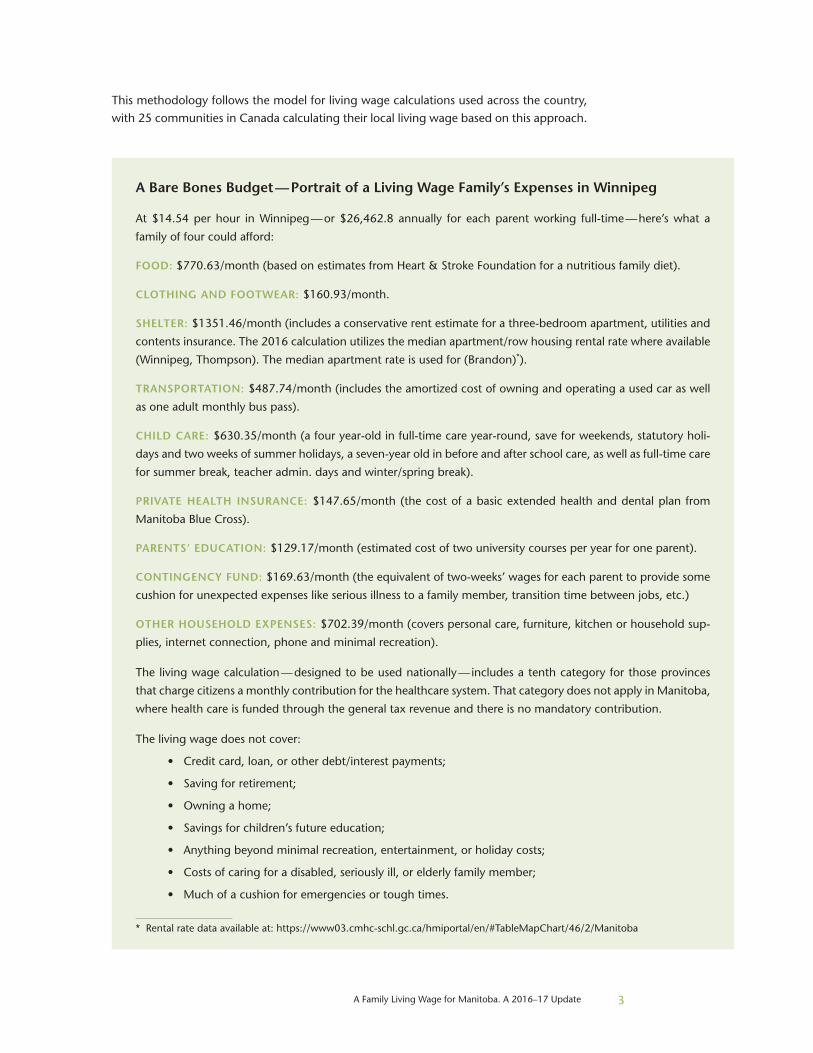
A Bare Bones Budget — Portrait of a Living Wage Family’s Expenses in Winnipeg
At $14.54 per hour in Winnipeg — or $26,462.8 annually for each parent working full-time — here’s what a
family of four could afford:
FOOD: $770.63/month (based on estimates from Heart & Stroke Foundation for a nutritious family diet).
CLOTHING AND FOOTWEAR: $160.93/month.
SHELTER: $1351.46/month (includes a conservative rent estimate for a three-bedroom apartment, utilities and
contents insurance. The 2016 calculation utilizes the median apartment/row housing rental rate where available
(Winnipeg, Thompson). The median apartment rate is used for (Brandon)*).
TRANSPORTATION: $487.74/month (includes the amortized cost of owning and operating a used car as well
as one adult monthly bus pass).
CHILD CARE: $630.35/month (a four year-old in full-time care year-round, save for weekends, statutory holi-
days and two weeks of summer holidays, a seven-year old in before and after school care, as well as full-time care
for summer break, teacher admin. days and winter/spring break).
PRIVATE HEALTH INSURANCE: $147.65/month (the cost of a basic extended health and dental plan from
Manitoba Blue Cross).
PARENTS’ EDUCATION: $129.17/month (estimated cost of two university courses per year for one parent).
CONTINGENCY FUND: $169.63/month (the equivalent of two-weeks’ wages for each parent to provide some
cushion for unexpected expenses like serious illness to a family member, transition time between jobs, etc.)
OTHER HOUSEHOLD EXPENSES: $702.39/month (covers personal care, furniture, kitchen or household sup-
plies, internet connection, phone and minimal recreation).
The living wage calculation — designed to be used nationally — includes a tenth category for those provinces
that charge citizens a monthly contribution for the healthcare system. That category does not apply in Manitoba,
where health care is funded through the general tax revenue and there is no mandatory contribution.
The living wage does not cover:
• Credit card, loan, or other debt/interest payments;
• Saving for retirement;
• Owning a home;
• Savings for children’s future education;
• Anything beyond minimal recreation, entertainment, or holiday costs;
• Costs of caring for a disabled, seriously ill, or elderly family member;
• Much of a cushion for emergencies or tough times.
* Rental rate data available at: https://www03.cmhc-schl.gc.ca/hmiportal/en/#TableMapChart/46/2/Manitoba
4 Canadian Centre for Policy Alternatives – Manitoba
The living wage gets families out of severe financial stress by lifting them out of poverty and providing a basic level of economic security. But it is also a conservative, bare bones budget without the extras many of us take for granted.
The living wage calculation is based on the needs of two-parent families with young children, but would also support a mix of family types throughout the life cycle so that young adults are not discouraged from having children and older workers have some extra income as they age.
In 2009, 2013 and now in 2016–17, the living wage for a single parent with one child is significantly higher. Single-income families face obvious challenges. Shelter, transporta-tion and child care expenses are rather inflexible and having two incomes to cover such expenses goes a long way. A discussion on single parent families is included for each of the cities in this report.
EXPLAINING THE 2017 LIVING WAGE UPDATE
Winnipeg
The current family living wage for Winnipeg is $14.54/hour — up 3.3 per cent from the $14.07/hour found in the 2013 estimation. From 2013 to 2016 Winnipeg’s inflation rate was 4.4 per cent.6 Why has the living wage not increased accordingly? In order to answer that question, we have to examine two broad categories: expenses and income.
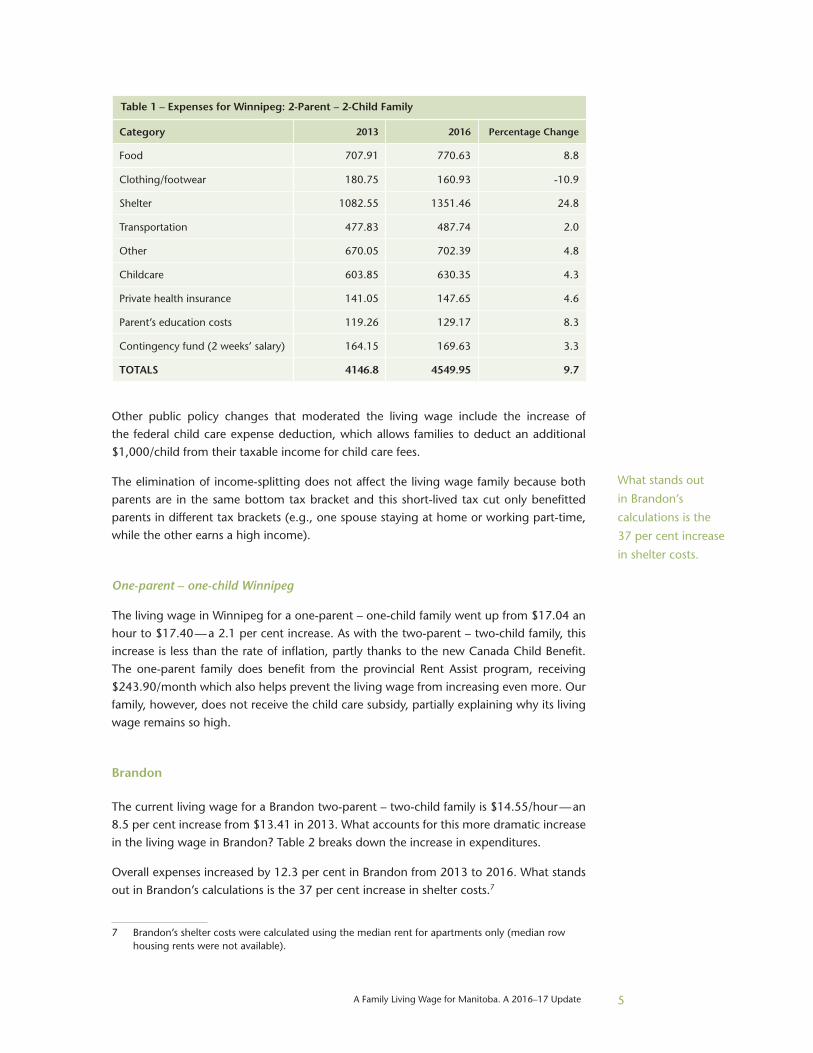
Overall expenses for the two-parent – two-child family increased 9.7 per cent between the 2013 and 2016 reports. Similar to previous reports, shelter and food expenses are the largest expense categories for the living wage family. Relative to the expenses in the 2013 report, the 2016 expenses for food, shelter, other, private health insurance and education increased more than the rate of inflation. Table 1 below shows the changes of all the categories.
Clothing and footwear is the only category that saw a decrease in cost. Food was up double the rate of inflation over the period and shelter saw a large increase of almost 25 per cent.
Given that costs are up 9.7 per cent, we have to turn to non-wage income (government transfers) to understand why the family living wage has only increased by 3.3 per cent since 2013.
The living wage takes into account federal and provincial taxes and transfers, and changes in government policies (notably at the federal level) explain why the Winnipeg’s 2016 living wage increased 1.1 per cent points less than the overall rate of inflation despite the increase in expenses.
The new, non-taxable Canada Child Benefit, which replaced the old system of federal child benefits as of July 1, 2016, is a lot more generous for families with income under $100,000. The difference is so significant that even though this benefit started in July and was avail-able for only six months of 2016, it boosts the family income enough to more than offset the increase in the cost of living in Winnipeg ($810.52/month).
6 http://www.statcan.gc.ca/tables-tableaux/sum-som/l01/cst01/econ09h-eng.htm
The new, non-taxable
Canada Child Benefit,
which replaced the
old system of federal
child benefits as of
July 1, 2016, is a lot
more generous for
families with income
under $100,000.
A Family Living Wage for Manitoba. A 2016–17 Update 5
Other public policy changes that moderated the living wage include the increase of the federal child care expense deduction, which allows families to deduct an additional $1,000/child from their taxable income for child care fees.
The elimination of income-splitting does not affect the living wage family because both parents are in the same bottom tax bracket and this short-lived tax cut only benefitted parents in different tax brackets (e.g., one spouse staying at home or working part-time, while the other earns a high income).
One-parent – one-child Winnipeg
The living wage in Winnipeg for a one-parent – one-child family went up from $17.04 an hour to $17.40 — a 2.1 per cent increase. As with the two-parent – two-child family, this increase is less than the rate of inflation, partly thanks to the new Canada Child Benefit. The one-parent family does benefit from the provincial Rent Assist program, receiving $243.90/month which also helps prevent the living wage from increasing even more. Our family, however, does not receive the child care subsidy, partially explaining why its living wage remains so high.
Brandon
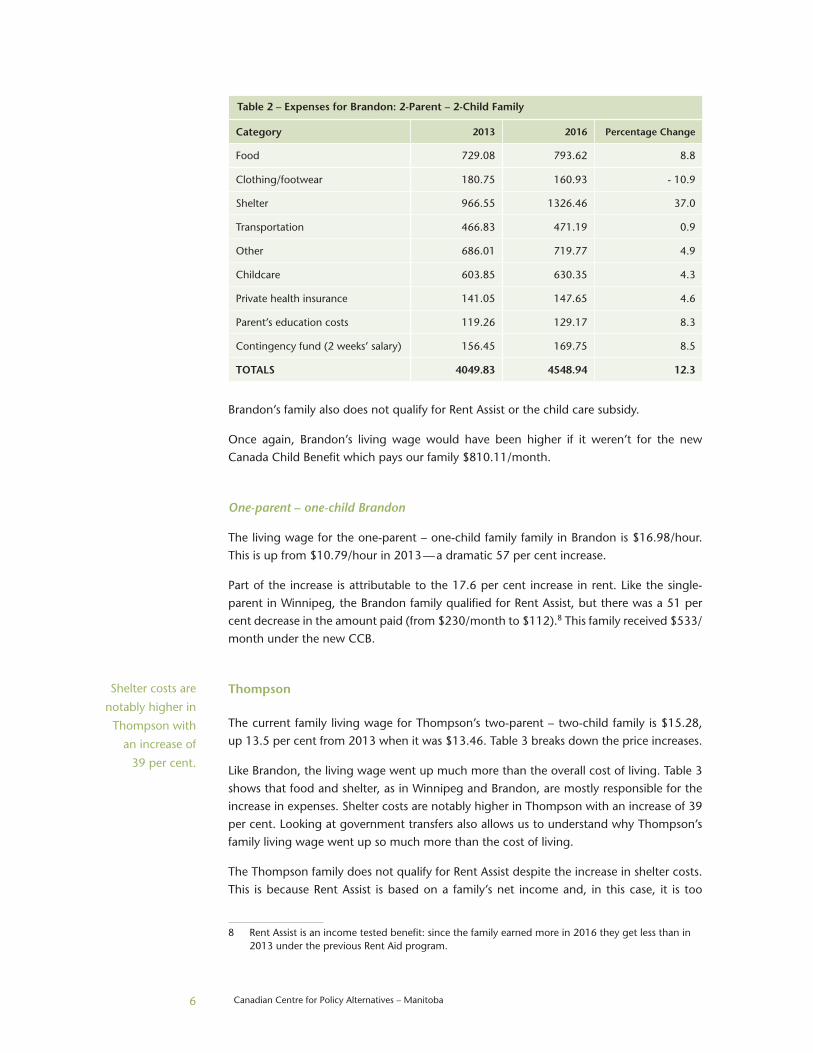
The current living wage for a Brandon two-parent – two-child family is $14.55/hour — an 8.5 per cent increase from $13.41 in 2013. What accounts for this more dramatic increase in the living wage in Brandon? Table 2 breaks down the increase in expenditures.
Overall expenses increased by 12.3 per cent in Brandon from 2013 to 2016. What stands out in Brandon’s calculations is the 37 per cent increase in shelter costs.7
7 Brandon’s shelter costs were calculated using the median rent for apartments only (median row housing rents were not available).
What stands out
in Brandon’s
calculations is the
37 per cent increase
in shelter costs.
Table 1 – Expenses for Winnipeg: 2-Parent – 2-Child Family
Category 2013 2016 Percentage Change
Food 707.91 770.63 8.8
Clothing/footwear 180.75 160.93 -10.9
Shelter 1082.55 1351.46 24.8
Transportation 477.83 487.74 2.0
Other 670.05 702.39 4.8
Childcare 603.85 630.35 4.3
Private health insurance 141.05 147.65 4.6
Parent’s education costs 119.26 129.17 8.3
Contingency fund (2 weeks’ salary) 164.15 169.63 3.3
TOTALS 4146.8 4549.95 9.7
6 Canadian Centre for Policy Alternatives – Manitoba
Brandon’s family also does not qualify for Rent Assist or the child care subsidy.
Once again, Brandon’s living wage would have been higher if it weren’t for the new Canada Child Benefit which pays our family $810.11/month.
One-parent – one-child Brandon
The living wage for the one-parent – one-child family family in Brandon is $16.98/hour. This is up from $10.79/hour in 2013 — a dramatic 57 per cent increase.
Part of the increase is attributable to the 17.6 per cent increase in rent. Like the single-parent in Winnipeg, the Brandon family qualified for Rent Assist, but there was a 51 per cent decrease in the amount paid (from $230/month to $112).8 This family received $533/month under the new CCB.
Thompson
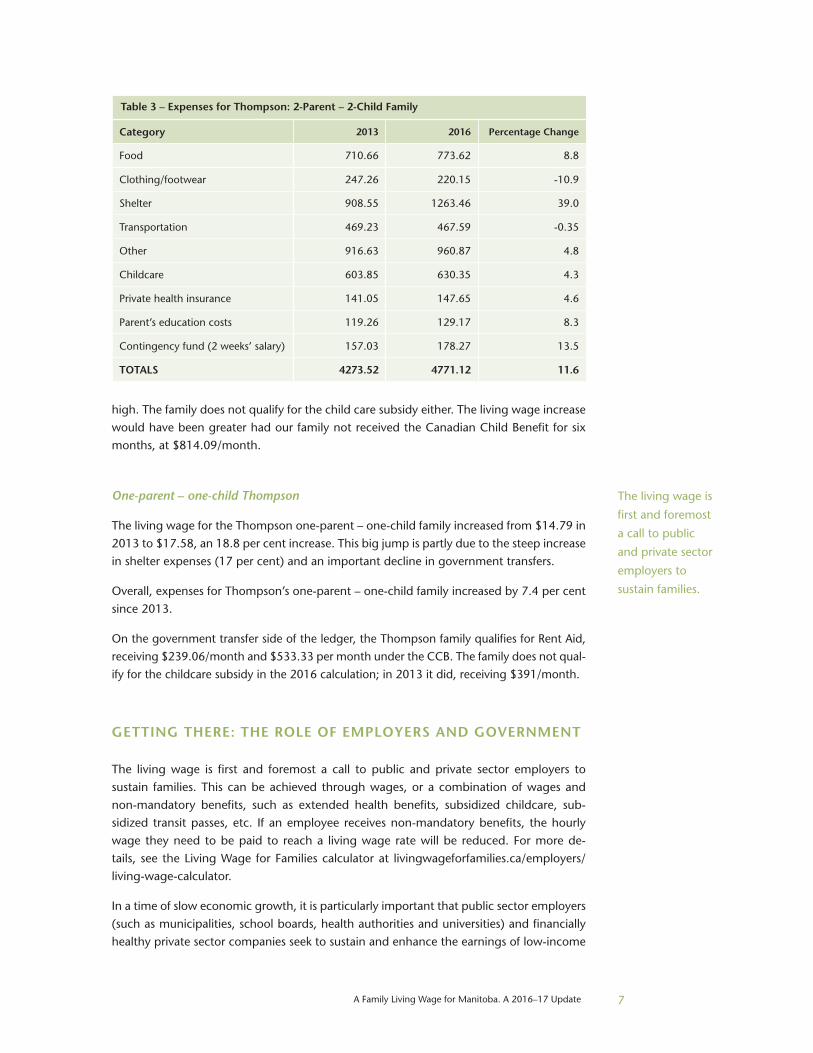
The current family living wage for Thompson’s two-parent – two-child family is $15.28, up 13.5 per cent from 2013 when it was $13.46. Table 3 breaks down the price increases.
Like Brandon, the living wage went up much more than the overall cost of living. Table 3 shows that food and shelter, as in Winnipeg and Brandon, are mostly responsible for the increase in expenses. Shelter costs are notably higher in Thompson with an increase of 39 per cent. Looking at government transfers also allows us to understand why Thompson’s family living wage went up so much more than the cost of living.
The Thompson family does not qualify for Rent Assist despite the increase in shelter costs. This is because Rent Assist is based on a family’s net income and, in this case, it is too
8 Rent Assist is an income tested benefit: since the family earned more in 2016 they get less than in 2013 under the previous Rent Aid program.
Table 2 – Expenses for Brandon: 2-Parent – 2-Child Family
Category 2013 2016 Percentage Change
Food 729.08 793.62 8.8
Clothing/footwear 180.75 160.93 - 10.9
Shelter 966.55 1326.46 37.0
Transportation 466.83 471.19 0.9
Other 686.01 719.77 4.9
Childcare 603.85 630.35 4.3
Private health insurance 141.05 147.65 4.6
Parent’s education costs 119.26 129.17 8.3
Contingency fund (2 weeks’ salary) 156.45 169.75 8.5
TOTALS 4049.83 4548.94 12.3
Shelter costs are
notably higher in
Thompson with
an increase of
39 per cent.
A Family Living Wage for Manitoba. A 2016–17 Update 7
high. The family does not qualify for the child care subsidy either. The living wage increase would have been greater had our family not received the Canadian Child Benefit for six months, at $814.09/month.
One-parent – one-child Thompson
The living wage for the Thompson one-parent – one-child family increased from $14.79 in 2013 to $17.58, an 18.8 per cent increase. This big jump is partly due to the steep increase in shelter expenses (17 per cent) and an important decline in government transfers.
Overall, expenses for Thompson’s one-parent – one-child family increased by 7.4 per cent since 2013.
On the government transfer side of the ledger, the Thompson family qualifies for Rent Aid, receiving $239.06/month and $533.33 per month under the CCB. The family does not qual-ify for the childcare subsidy in the 2016 calculation; in 2013 it did, receiving $391/month.
GETTING THERE: THE ROLE OF EMPLOYERS AND GOVERNMENT
The living wage is first and foremost a call to public and private sector employers to sustain families. This can be achieved through wages, or a combination of wages and non-mandatory benefits, such as extended health benefits, subsidized childcare, sub-sidized transit passes, etc. If an employee receives non-mandatory benefits, the hourly wage they need to be paid to reach a living wage rate will be reduced. For more de-tails, see the Living Wage for Families calculator at livingwageforfamilies.ca/employers/living-wage-calculator.
In a time of slow economic growth, it is particularly important that public sector employers (such as municipalities, school boards, health authorities and universities) and financially healthy private sector companies seek to sustain and enhance the earnings of low-income
Table 3 – Expenses for Thompson: 2-Parent – 2-Child Family
Category 2013 2016 Percentage Change
Food 710.66 773.62 8.8
Clothing/footwear 247.26 220.15 -10.9
Shelter 908.55 1263.46 39.0
Transportation 469.23 467.59 -0.35
Other 916.63 960.87 4.8
Childcare 603.85 630.35 4.3
Private health insurance 141.05 147.65 4.6
Parent’s education costs 119.26 129.17 8.3
Contingency fund (2 weeks’ salary) 157.03 178.27 13.5
TOTALS 4273.52 4771.12 11.6
The living wage is
first and foremost
a call to public
and private sector
employers to
sustain families.
8 Canadian Centre for Policy Alternatives – Manitoba
families. Boosting the earnings of these households is one of the most effective ways of stimulating the local economy because lower-income families tend to spend almost all their income in their communities.
In 2010, the City of New Westminster became the first municipality in Canada to officially pass a living wage policy. All direct and contracted staff providing services on city premises are now paid the Metro Vancouver living wage. Since then, three other BC local govern-ments have taken steps to become living wage employers — the Huu-ay-aht First Nation (already certified), and the City of Vancouver and the City of Port Coquitlam.
We’ve done the living wage calculations for Winnipeg, Brandon and Thompson. It is now time for these municipalities to step up to the plate and implement a living wage policy.
Not just about employers — government policy matters
The living wage is not just about employers — the labour market alone cannot solve all problems of poverty and social exclusion. Our standard of living is a combination of pay, income supports and accessible public services that reduce costs for families.
First, direct government transfers can put money into the pockets of low-income families. The more generous these transfers are, the less a family requires in wages to achieve a decent quality of life. The introduction of the new Canada Child Benefit shows just how big an impact government transfers can have. However, most other government transfers and subsidies are reduced or eliminated once a family reaches an income level below the living wage. For example:
• Federal GST credit (not available to families with a net income above $52,065);
• Manitoba Child Care subsidy; in order to qualify for the child care subsidy, a family’s income must be far below the poverty line.9 None of our families qualify.
• None of our two-parent – two-child families qualify for Manitoba’s Rent Assist program.
• Working Income Tax Benefit (not available to families with net income over $28,813).
Provincial and federal governments must review all low-income transfers and credits regu-larly to ensure that the amounts provided are keeping up with the actual expenses they are meant to defray (such as child care fees or rent) and that they are not clawed back at income levels that leave many families struggling with a bare-bones budget. When government transfers fail to keep up with the rising cost of living, the families who are the hardest hit are the ones headed by earners who are already marginalized and tend to do poorly in the labour market. Single-mother, Indigenous and recent immigrant families tend to have lower earnings and face higher unemployment rates, which puts them at a higher risk of poverty.
9 The View from Here: Manitobans call for a renewed poverty reduction plan; page 44. Available at: https://www.policyalternatives.ca/sites/default/files/uploads/publications/Manitoba%20Office/2015/01/View%20from%20here%20v8%20low-res.pdf
We’ve done the living
wage calculations for
Winnipeg, Brandon
and Thompson. It is
now time for these
municipalities to
step up to the plate
and implement a
living wage policy.
A Family Living Wage for Manitoba. A 2016–17 Update 9
The living wage is also affected by indirect government transfers, in the form of public services and infrastructure that shift certain costs off the shoulders of individual families. Affordable housing, universal affordable child care, national pharmacare or dental cover-age for children and modest income families, and policies ensuring paid sick leave are other examples of government actions that would significantly moderate the living wage, easing the role of employers in ensuring that families can meet their core budgetary needs. For example, if Manitoba implemented the widely-endorsed $10-a-day child care plan, the Winnipeg living wage would go down by $1 per hour to $13.54.
The largest component increase in the living wage is the cost of housing. All levels of government need to urgently address the shortage of adequate and affordable housing for low-income families.
A key way in which employers can reduce the payroll costs of the living wage is to advocate for progressive policy changes to increase government benefits to low-income earners and enhance public services that improve quality of life for all families. This is particularly true for single parent families, as the preceding one-parent – one-child sections demonstrate.
For example,
if Manitoba
implemented the
widely-endorsed
$10-a-day child care
plan, the Winnipeg
living wage would
go down by $1 per
hour to $13.54.

10 Canadian Centre for Policy Alternatives – Manitoba

A Family Living Wage for Manitoba. A 2016–17 Update 11
The Canadian Centre for Policy Alternatives is an independent, non-partisan research institute concerned with issues of social and economic justice. Founded in 1980, it is one of Canada’s leading progressive voices in public policy debates. The CCPA is a registered non-profit charity and depends on the support of its more than 10,000 members across Canada.
Unit 205 – 765 Main St., Winnipeg, MB R2W 3N5tel 204-927-3200 fax 204-927-3201email [email protected] www.policyalternatives.ca
ABOUT THE AUTHOR:
Lynne Fernandez holds the Errol
Black Chair in Labour Issues at
the Canadian Centre for Policy
Alternatives, MB where she has
worked for 10 years. She holds an MA
in Economics from the University of
Manitoba.
AKNOWLEDGEMENT:
With thanks to Iglika Ivanova and Seth Klein at CCPA BC. The text and methodology borrows heavily from their work.
ISBN: 978-1-77125-347-5