a f ra m e w o rk fo r u n ify in g p re s e n ta tio n s...
TRANSCRIPT

A Framework for Unifying Presentation Space
M.S. T. Carpendale and Catherine Montagnese Unive r s i t y o f Ca l g a r y
Department of Computer Science Calgary, Alberta, T2N 1N4 Canada E-mail: [email protected]
ABSTRACT Making effective use of the available display space has long been a fundamental issue in user interface design. We live in a time of rapid advances in available CPU power and memory. However, the common sizes of our computational display spaces have only minimally increased or in some cases, such as hand held devices, actually decreased. In addition, the size and scope of the information spaces we wish to explore are also expanding. Representing vast amounts of information on our relatively small screens has become increasingly problematic and has been associated with problems in navigation, interpretation and recognition. User interface research has proposed several differing presentation approaches to address these problems. These methods create displays that vary considerably, visually and algorithmically. We present a unified framework that provides a way of relating seemingly distinct methods, facilitating the inclusion of more than one presentation method in a single interface. Furthermore, it supports extrapolation between the presentation methods it describes. Of particular interest are the presentation possibilities that exist in the ranges between various distortion presentations, magnified insets and detail-in-context presentations, and between detail-in- context presentations and a full-zooming environment. This unified framework offers a geometric presentation library in which presentation variations are available independently of the mode of graphic representation. The intention is to promote the ease of exploration and experimentation into the use of varied presentation combinations.
KEYWORDS: Distortion viewing, screen layout, 3D inter- actions, information visualization, interface metaphors, interface design issues
INTRODUCTION All too often, when viewing information on a computer, it is the size of the screen on which the information is displayed that is the limiting factor. This can be true
Permission to make digilal or hard copies of all or part of fills work for personal or classroom use is granted without fee provided that copies are not made or distributed for profit or commercial advantage and that copies bear this notice and lhe full citation on the first page. To copy otherwise, to republish, to post on servers or to redistribute to lists, requires prior specific permission and/or a fee. UIST 01 Orlando FLA Copyright ACM 2001 1-58113-438 -x/01/11 ...$5.00
whether one is viewing a single image or map, coping with multiple files when editing or coding, or trying to organize the windows and icons that are necessary for one's current task. In fact, computational advances over the last twenty- five years have intensified this problem. Processing power and storage capacity have increased in leaps and bounds. In comparison, the sizes of our display screens have inched outwards. This discrepancy between a computer's display space and its information space has been called the screen real estate problem and is associated with problems in navigation, interpretation and recognition of relationships between individual items in information representations.
Creating interfaces that provide visual access to information can be considered to have two components: representation and presentation. Representation is the act of creating an image that corresponds to the information. Thus representation involves developing a mapping from the information to a structure that can be displayed visually. Presentation is the act of displaying this image, emphasizing and organizing areas of interest. For example, a map (representation) of a city in which one lives may be presented with one's route to work emphasized, revealing the street names. Changes in presentation involve exploring the representation by such methods as panning, scrolling, zooming, rotation and various distortion approaches. A change in presentation affects how the information can be viewed. This distinction between presentation and representation relates to Chi et al.'s [6] concepts of view and value operations in that changes in presentation are view operations and changes to the representation are value operations.
Presently, within the space of possible presentations many successful techniques have been discovered and new methods are being explored and refined, expanding our awareness of the scope of what is possible. In fact, the range of presentation possibilities can be considered as a presentation space and the individual successes as "point" solutions within this space. In these terms, we present a geometric framework that unifies this presentation space, describing a considerable number of existing point solutions and extrapolating between them. This is an Elastic Presentation Framework (EPF) since many of the described solutions are "elastic" in the sense that the adjustments and
~--L~IBI 3 (2) UIST '01 61

reorganizations offered are readily capable of reverting to previous presentations. The term elastic reflects the resilient deformability, implying both the ability to be stretched and the ability to return to its original shape. Aspects of the computer's elastic facility have been utilized in the creation of several existing techniques, for instance, Stretch Tools [23], Rubber Sheet [21], Malleable Graphics [7], Pliable Surfaces [2] and, more recently, Elastic Labels [11] and Elastic Windows [12].
EPF encompasses both distortion and non-distortion based presentation methods. This framework provides a way of relating seemingly distinct methods, facilitating the inclusion of more than one presentation method in a single interface. These include pan, scroll, zoom, insets, Drag- Mag [28] and various distortion approaches such as Graphical Fisheyes [21], Perspective Wall [t7], and Document Lens [20]. Furthermore, it supports interpolation between the presentation methods it describes. In particular we describe the presentation possibilities that exist in the ranges between various distortion presentations, between magnified insets and detail-in-context presentations, and between detail-in-context and full-zooming environments.
The next section provides the background for this work. This is followed by a brief description of EPF geometry. Section three presents the framework showing how EPF describes existing presentation techniques and explains the interpolations between them. Then we provide a brief overview of the EPF lens library, concluding with a discussion of the contributions and directions.
BACKGROUND Ideally one would like to be able to take advantage of our natural visual pattern recognition abilities by being able to see the entire information representation. It is also important to see areas of interest in sufficient detail, and to be able to relate these details to their immediate surroundings as well as their global context. This desire has fueled considerable 'detail-in-context' research, pioneered by Spence and Apperley's Bifocal Display [25] and Furnas' [8] paper on Generalized Fisheyes. Sarkar and Brown [21] expand upon Furnas' approach creating spatial reorganizations of visual representations. Hyperbolic Display [15] and Multi-Perspective Views [18] use mathematical functions, hyperbola and arctan respectively, to create detail-in-context presentations. Perspective Wall [17], Document Lens [20] and Pliable Surfaces [2] make use of 3D manipulations and perspective viewing. Other methods [1, 13, 14, 18, 21] create new presentations by using a 2D-transformation function to spatially adjust a given two-dimensional layout (for surveys see [16, 19]). Of particular relevance to this 3D framework is Space-Scale Diagrams [9], a 3D framework for zoomable interfaces. As Furnas and Bederson suggest many of their concepts are useful in distortion presentations.
Though visual communication issues have motivated
research in this area, new comprehension issues continue to arise. These techniques are said to support human potential for visual gestalt, to reduce the cognitive effort needed for the re-integration of information across separate views, and to address navigational problems by accessing spatial reasoning. Also, studies indicate that setting detail in its context is common practice in human memory patterns [8] and that there is increased user performance in path finding tasks [10, 24]. Other studies have less conclusive results [26, 27]. Though many varieties exist, detail-in-context techniques have not received widespread acceptance. This may be due to the fact that all of these methods make use of some form of distortion. Or it may be due to a general discomfort with the use of distortion and/or to the perception that the use of distortion and non-distortion based presentation methods are mutually exclusive. For instance, comments have been made like 'it is all very well to use a fisheye distortion to locate the details I am interested in, but when I find them I don't want all the space wasted for context' and ' I 'm happy with insets but sometimes they get in the way of seeing connections'l. A unified framework supports the provision of seamless transitions between distinct presentation techniques.
We suggest that the relative merit of differing presentation methods will be dependent on: the type of task, the nature of the information, and the preferences and skills of the person using it. Also, it is possible that these preferences will vary from task to task and perhaps from minute to minute. To support this variant and varying need we present a unified presentation framework.
ELASTIC PRESENTATION FRAMEWORK GEOMETRY This section wi l l explain the basic geometric concepts o f the EPF framework. These include the provision of precise magnification control, the creation of detail-in-context or multi-scale views, the integration of the possibility of re- positioning separate views with detail-in-context presentations through the idea of folding and the use of different distance metrics.
Basic Concepts The distinction between representation and presentation has allowed for the exploration of presentation space independent from information specifications other than the dimensionality of the representation. The following discussion applies to any two-dimensional visual representations. We have separated the presentation geometry from the graphic specifications, performing manipulations on sets of points. This allows the user of this framework to specify their graphics as desired. For purposes of illustration we have used either a two- dimensional grid or a texture-mapped surface. These representations could be replaced with whatever the preferred graphic mode is, including a node and edge graph, a scene graph or a vector representation.
1 Comments from participatory design sessions during the development of the Tardis [5]
62 UIST '01 November 11-14, 2 0 0 1

re~
~fu~mx~ vi~
ce~t~gd a
¢
Figure 1: The 3D viewing frustum. The 2D representation is initially placed on the baseplane and viewed from the reference viewpoint
The basic geometric concept is to place a two-dimensional information representation on a plane in three-dimensional space (Figure 1). This 2D plane is manipulated and viewed through single-point perspective projection. Presentation variations are achieved by appropriately displacing points on the plane.
~ L = = , = I I context I distortion J /
/ J
~ /focal centre
Z o
focus distortion ', context = ,
lens
Figure 2: The parts of a lens
The basic manipulation is based on a concept of a lens. A lens has a focus, a region of distortion, a distance metric, a viewer aligned vector, and a radius. A lens focus has a degree of magnification, a centre, a shape, and size information such as radius, width or length. Figure 2 illustrates these lens parts.
Magnification Control Using perspective projection and translation in z to affect magnification or zooming has been connected with
problems in fine control as the magnification increases. One suggested solution is to use a logarithmic function. This continually reduces the amount of z-translation used as the viewpoint is approached [20]. While this provides a great improvement, logarithmic functions still approach infinity, thus the problem is delayed rather than removed. In fact, it is still possible to translate the region of interest beyond the viewpoint, thus placing it out of sight. What is needed is an asymptotic function that relates degree of magnification to z-translation. This function can be derived from similar triangles shown in Figure 3 as follows:
Xm/Xt = d b / d s ; mag = xm/xi; h f = d b - ds;
where xl is a point on the baseplane that is raised to a height hf which provides a magnification of mag. The position xm is the apparent location after the displacement of the point xi to a height hf:
hf =db--(db/mag).
This function offers infinite magnification control, which is limited only by the numerical resolution of the computer. The coordinates (Xm, Ym) allow the option of performing transformations directly by translating the point in x and y , or through perspective by adjusting the height.
. . . . . . . . . . j reforence viewpoint
i i! \
h/
._L_i . . . . .
t ~ X h
\ '\
X i Xm "~ '~base plane
Figure 3: The relationships between the displaced points and the apparent magnification
Multi-scale Presentations Multi-scale, distortion, or fisheye presentations are made possible through the inclusion of drop-off (monotonically decreasing) functions. Selected focal regions can be set to a specified degree of magnification and integration between the magnified foci and their context is achieved through the use of drop-off fimetions (Figures 4 and 5). If any point Pl
~k.~U 3 (2) UIST '01 63
on the baseplane is in the focal region, then it is set to the specified focal height h~ Otherwise, the displacement hp of each point Pi in the z direction depends on the value of the drop-off function when evaluated at the shortest distance dp between a point and the focal region. To ensure that each focus stays within the field of view, the foci are viewer aligned (Figure 6) and the translation vectors are normalized in z (see [2]).
ht
dp
1
Figure 4: Using a linear drop-off function and the distance dp of a point p; to the focal region to calculate the z-displacement hp
Figure 5: The left image shows a single-focus detail- in-context presentation, the centre image shows a side view, and the right image is a cross-section showing the viewer-aligned translation vectors
Figure 6: This set of images illustrates an off-centre lens. The viewer-aligned translation vectors are directed towards the viewpoint
Folding While separate views provide freedom of re-positioning, detail-in-context presentations imprison their focal regions within their context. EPS extends detail-in-context presentations to include re-positioning of foci or folding [2]. When folding a focus, the region of the representation that is magnified remains constant. It is the position of the focus that changes, re-positioning the region of the surface in the focus, causing it to 'fold' over other regions of the
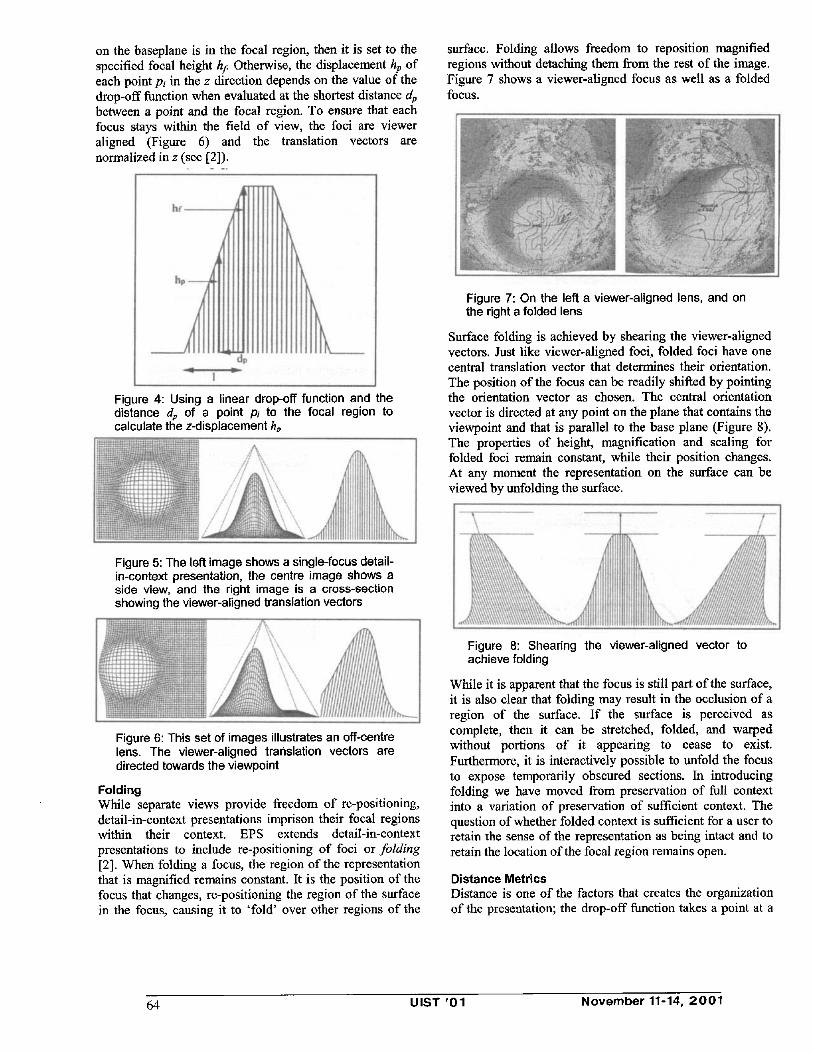
surface. Folding allows freedom to reposition magnified regions without detaching them from the rest of the image. Figure 7 shows a viewer-aligned focus as well as a folded focus.
Figure 7: On the left a viewer-aligned lens, and on the right a folded lens
Surface folding is achieved by shearing the viewer-aligned vectors. Just like viewer-aligned loci, folded foci have one central translation vector that determines their orientation. The position of the focus can be readily shifted by pointing the orientation vector as chosen. The central orientation vector is directed at any point on the plane that contains the viewpoint and that is parallel to the base plane (Figure 8). The properties of height, magnification and scaling for folded foci remain constant, while their position changes. At any moment the representation on the surface can be viewed by unfolding the surface.
j A/ Figure 8: Shearing the viewer-aligned vector to achieve folding
While it is apparent that the focus is still part of the surface, it is also clear that folding may result in the occlusion of a region of the surface. If the surface is perceived as complete, then it can be stretched, folded, and warped without portions of it appearing to cease to exist. Furthermore, it is interactively possible to unfold the focus to expose temporarily obscured sections. In introducing folding we have moved from preservation of full context into a variation of preservation of sufficient context. The question of whether folded context is sufficient for a user to retain the sense of the representation as being intact and to retain the location of the focal region remains open.
Distance Metrics Distance is one of the factors that creates the organization of the presentation; the drop-off function takes a point at a
64 UIST '01 November 11-14, 2 0 0 1
specific distance from the chosen focus and computes a new location for that point. Many types of distance concepts can be used; basing the distance function on L e- metrics can provide a continuum between radial and orthogonal layout. For two-dimensional distances between points p~ (x], y~) and p~ (x2, Y2), Lp -metric are defined as:
L(P)=~Ixl-x;IP+[yl-y21P ,
where L(2) is Euclidean distance. The L(oo) metric is:
z(°°) = lx -x F +ly -Yzr,
which resolves to:
L(oo) = max(Ix 1 - x2[,ly 1 - Y2D"
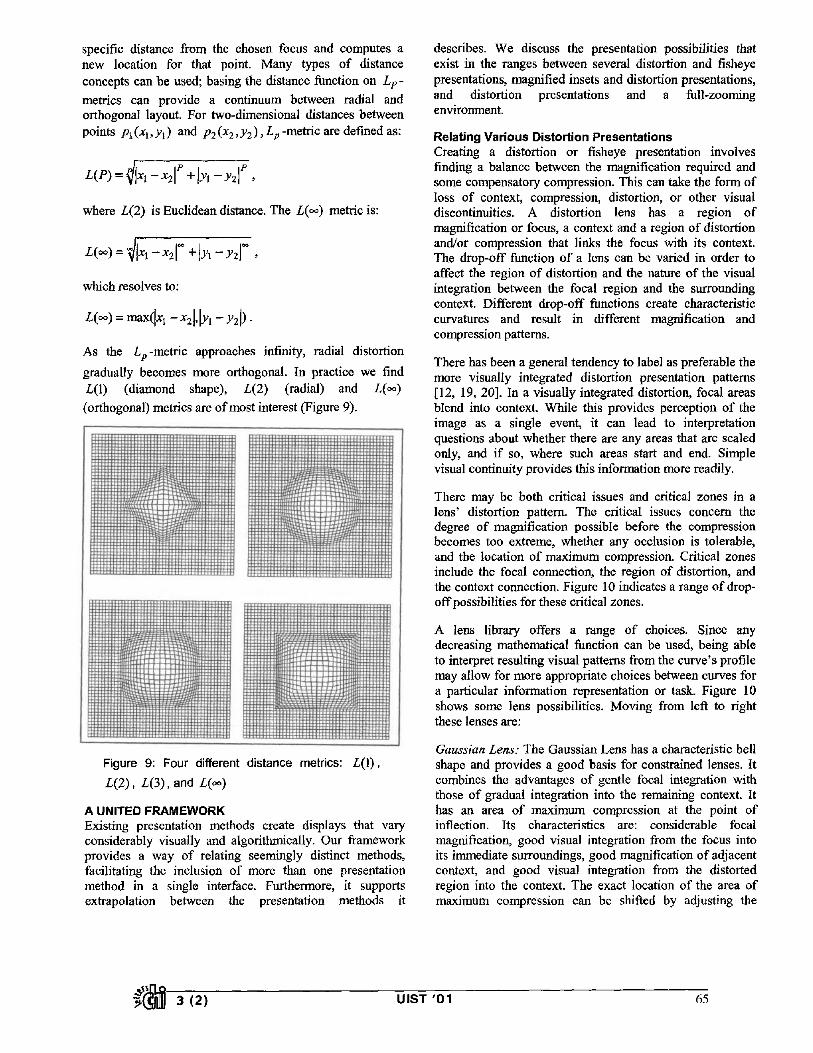
As the Lp-metric approaches infinity, radial distortion gradually becomes more orthogonal. In practice we find L(1) (diamond shape), L(2) (radial) and L(oo) (orthogonal) metrics are of most interest (Figure 9).
iii iiiii! i iiii!iiii!i iiiiiiiilli i il : : : | = I | : : : | : I I : : : : | I = : : : = I : : I I = : = : : : : ; I : = |
. = . = - - o . - . = - o . = . . ~ x a ~ M ~ . ' = : = - - ' . . = = | - : :
im=#=====l~nalllllJ=illlllltt.~tl=l=l==== Illlllllit'~t~ttlllliJll~lll//¢t4lll=ll=]
: : : : : : : : : : : : : : : : : : : : : : : : : : : : : : : : : : : : : : : : :
. . . . . = . = . . . : : . . . . = ! : : : . . = . : : | : = = : = : . . : : : : =
ilUiiEiiliiiliEii ii!iiii iZiliiilliiii ;- r m m :~,.,%J:'i,~ = = :=~.',.",%" -:-- : 'w .':.=- ..=,==,'~,,t~.=.= =_=_!;Ill~[~:==,!==-" == . . . . | . . ' " r ' J , = m = = - - - = = = m t ¢ . = d p . - ' : ; - ' - ' | "
:.'.%" :-= =-.%*;:~;,= me= | I l l l l l l l l l m ~= =a= . . . . . . . . . . ~ I l = a l l m u l l ' U l l l U l l l l U l ~ l l l l l l | l n l Itr~ n l o= l= |u ,,.....:::...,|~,I~||=~== = = .=~. ' , ! ' ; , :1 • : : = ." -': = . . . . . . . . . . . ~,,~,,, ~ = | == j = % , , I , , , ,
~ l l ,' ,' ,%' ,' I I ' ~ r ' r l . . . . . . . . . . . . . . . : J : " H : H H I I H I I I ; I H I (
bi4iiiiiii!~!!!!!!!i~iiiiiiiiiiiii!!!' ~)'J!JiiJii!ii~!~"!!;:::::
i i L i_#
:', ', ' , l ; H H , ' I : H H ' , : I H H ', : : : ; " " l : H " H I '
Figure 9: Four different distance metrics: L(1), L ( 2 ) , L (3 ) , and L(oo)
A UNITED FRAMEWORK Existing presentation methods create displays that vary considerably visually and algorithrnically. Our framework provides a way of relating seemingly distinct methods, facilitating the inclusion of more than one presentation method in a single interface. Furthermore, it supports extrapolation between the presentation methods it
describes. We discuss the presentation possibilities that exist in the ranges between several distortion and fisheye presentations, magnified insets and distortion presentations, and distortion presentations and a full-zooming environment.
Relating Various Distortion Presentations Creating a distortion or fisheye presentation involves finding a balance between the magnification required and some compensatory compression. This can take the form of loss of context, compression, distortion, or other visual discontinuities. A distortion lens has a region of magnification or focus, a context and a region of distortion and/or compression that links the focus with its context. The drop-off function of a lens can be varied in order to affect the region of distortion and the nature of the visual integration between the focal region and the surrounding context. Different drop-off functions create characteristic curvatures and result in different magnification and compression patterns.
There has been a general tendency to label as preferable the more visually integrated distortion presentation patterns [12, 19, 20]. In a visually integrated distortion, focal areas blend into context. While this provides perception of the image as a single event, it can lead to interpretation questions about whether there are any areas that are scaled only, and if so, where such areas start and end. Simple visual continuity provides this information more readily.
There may be both critical issues and critical zones in a lens' distortion pattern. The critical issues concern the degree of magnification possible before the compression becomes too extreme, whether any occlusion is tolerable, and the location of maximum compression. Critical zones include the focal connection, the region of distortion, and the context connection. Figure 10 indicates a range of drop- offpossibilities for these critical zones.
A lens library offers a range of choices. Since any decreasing mathematical function can be used, being able to interpret resulting visual patterns from the curve's profile may allow for more appropriate choices between curves for a particular information representation or task. Figure 10 shows some lens possibilities. Moving from left to right these lenses are:
Gaussian Lens: The Gaussian Lens has a characteristic bell shape and provides a good basis for constrained lenses. It combines the advantages of gentle focal integration with those of gradual integration into the remaining context. It has an area of maximum compression at the point of inflection. Its characteristics are: considerable focal magnification, good visual integration from the focus into its immediate surroundings, good magnification of adjacent context, and good visual integration from the distorted region into the context. The exact location of the area of maximum compression can be shifted by adjusting the
~k.~Ulll 3 ( 2 ) U IST 'O1 65
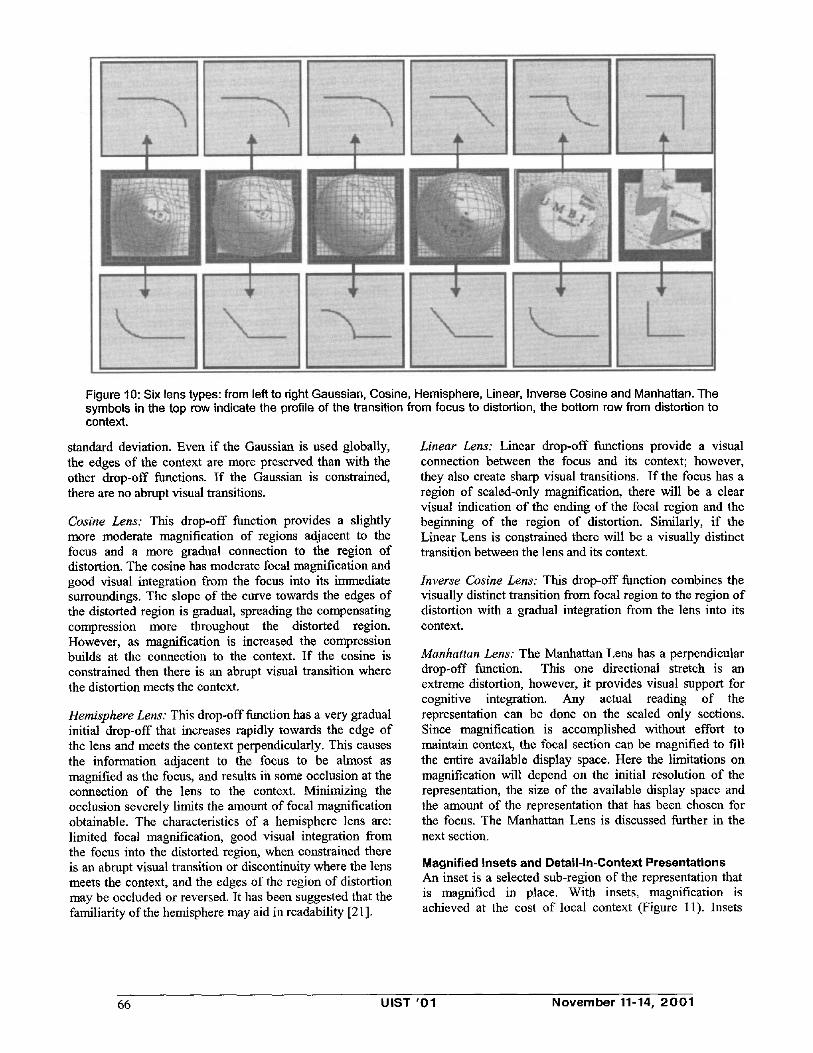
Figure 10: Six lens types: from left to right Gaussian, Cosine, Hemisphere, Linear, Inverse Cosine and Manhattan. The symbols in the top row indicate the profile of the transition from focus to distortion, the bottom row from distortion to context.
standard deviation. Even if the Gaussian is used globally, the edges of the context are more preserved than with the other drop-off functions. If the Gaussian is constrained, there are no abrupt visual transitions.
Cosine Lens: This drop-off function provides a slightly more moderate magnification of regions adjacent to the focus and a more gradual connection to the region of distortion. The cosine has moderate focal magnification and good visual integration from the focus into its immediate surroundings. The slope of the curve towards the edges of the distorted region is gradual, spreading the compensating compression more throughout the distorted region. However, as magnification is increased the compression builds at the connection to the context. I f the cosine is constrained then there is an abrupt visual transition where the distortion meets the context.
Hemisphere Lens: This drop-off function has a very gradual initial drop-off that increases rapidly towards the edge of the lens and meets the context perpendicularly. This causes the information adjacent to the focus to be almost as magnified as the focus, and results in some occlusion at the connection of the lens to the context. Minimizing the occlusion severely limits the amount of focal magnification obtainable. The characteristics of a hemisphere lens are: limited focal magnification, good visual integration from the focus into the distorted region, when constrained there is an abrupt visual transition or discontinuity where the lens meets the context, and the edges of the region of distortion may be occluded or reversed. It has been suggested that the familiarity of the hemisphere may aid in readability [21 ].
Linear Lens: Linear drop-off functions provide a visual connection between the focus and its context; however, they also create sharp visual transitions. If the focus has a region of scaled-only magnification, there will be a clear visual indication of the ending of the focal region and the beginning of the region of distortion. Similarly, if the Linear Lens is constrained there will be a visually distinct transition between the lens and its context.
lnverse Cosine Lens: This drop-off function combines the visually distinct transition from focal region to the region of distortion with a gradual integration from the lens into its context.
Manhattan Lens: The Manhattan Lens has a perpendicular drop-off function. This one directional stretch is an extreme distortion, however, it provides visual support for cognitive integration. Any actual reading of the representation can be done on the scaled only sections. Since magnification is accomplished without effort to maintain context, the focal section can be magnified to fill the entire available display space. Here the limitations on magnification will depend on the initial resolution of the representation, the size of the available display space and the amount of the representation that has been chosen for the focus. The Manhattan Lens is discussed further in the next section.
Magnified Insets and Detail-In-Context Presentations An inset is a selected sub-region of the representation that is magnified in place. With insets, magnification is achieved at the cost of local context (Figure 11). Insets
66 UIST '01 November 11-14, 2OO1
maintain partial context in that usually some context is still visible but the adjacent context is occluded, causing visual separation between the focus and its context. While the issues of occlusion and separation remain significant, allowing freedom of lateral translation through folding can provide the ability to see the region that was occluded. This action creates an offset (Figure 12). An offset is a selected sub-region of the representation that has been magnified and moved to one side or another. However, either a new region will be occluded or the offset and the context will be completely separate. Offsets are sometimes referred to as detail and context in that both detail and context are provided but they are not visually integrated. In EPF terms, an offset is a folded inset in that its viewer- aligned vector has been sheared to change its position with respect to the context. One method of linking an offset with its context is to provide connecting lines as visual cues. This was first suggested by Ware et al. [28] and named Drag-Mag (Figure 13).
Figure 13: Drag-Mag (Ware el a1.[28])
Figure 11: Inset
Figure 14: Manhattan
Figure 12: offset
Figure 15: A Manhattan Lens, on the left as an inset, on the right, folded
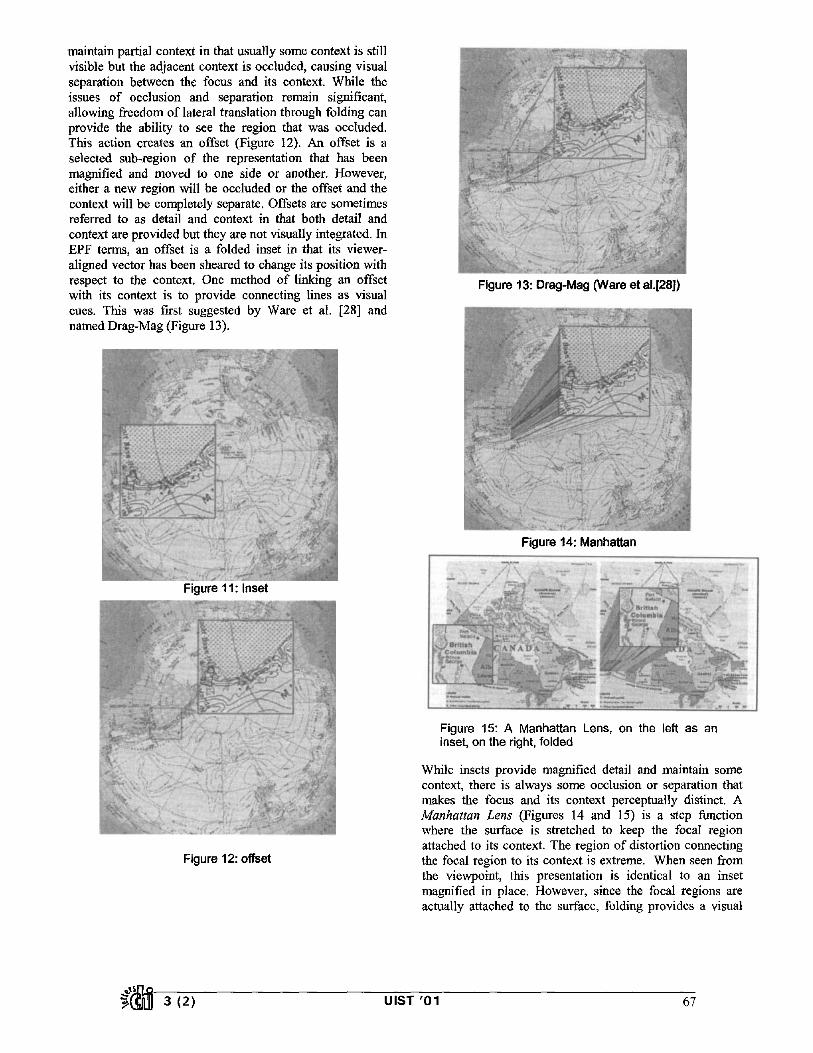
While insets provide magnified detail and maintain some context, there is always some occlusion or separation that makes the focus and its context perceptually distinct. A Manhattan Lens (Figures 14 and 15) is a step function where the surface is stretched to keep the focal region attached to its context. The region of distortion connecting the focal region to its context is extreme. When seen from the viewpoint, this presentation is identical to an inset magnified in place. However, since the focal regions are actually attached to the surface, folding provides a visual
~JlJII 3 (2) UIST '01 67

connection (Figure 15). Manhattan lenses provide interactive access to a modified detail-in-context reading. The name Manhattan comes from their appearance; in the profile view they look a little like skyscrapers, albeit, with more than a little influence from the Tower of Pisa. Magnification is provided to scale. Since roving search is possible while a lens is folded, the Manhattan lens can be folded slightly, showing the connection on one or two sides, and moved in that orientation. Figures 14 and 15 show Manhattan lenses folded slightly to reveal its connection to the rest of the map. At best a Manhattan Lens provides a detail-in-partial-context presentation. In EPF terms it is a lens with a rectangular focus, a linear drop-off, and a lens radius equal to its focal radius. Changing from a Manhattan Lens to a full detail-in-context lens is simply a matter of enlarging the lens radius. I f the L(oo)distance metric is maintained then the resulting lens is equivalent to a Document Lens [20] (Figure 16).
I]ll I I l l I F B l e l l l l e l r l m l m l l l l t l m m l i l m , li~ll~b[lilllll i I I I i I l | l l l ~ m ~ m ~ L ~ H l l l I I I I I I I I / l l l l m m m u l m l l I t ~ I I II t I II | l . l l ! l l l l l l l i I i i l l l i l l l l l l l l l l l l i l t i ! l | . l I I I , Ii I I ] l l l l l J l l l l l i l l l i i l l l l l l l i l l i i l l i I ' i l i I , l l l i l l l i l J l i i l i n i i i l l i l q l l i . l l i i I t ~1 I . . ~m . i i ,i 11! l l l W J I m M U l I U l B I I I I I I I I I I I I It ' Ill I J , | i l l l t . l l [ l l l l l l l l l l l - I . t l l l i | Ii ill
l q l l l l i l a ! l i | l I I I I I I I I I I I i | I ! ! ! ' i lllll',i l , l l l l l l l i l i l l l I l l i l i i l l l i l i i l l i l l l l l l l ' , l h . . i l i l l l i I I l i l i l l i l i l l l l l n i ium, l ,
P l l l l m n i U i l l i l l l i l i l l i i n l l l l IIII ii , , l l l l l ! ! ! ! ln i lmnnl ! ! ! ! l l l . , , , 11 II , i l l l ! ! ~ . i l - " - l l l l l i i l ! l l i ' ~ ! ! l l ,'-II I,I i,I l | l i i i l l . . l l l l l l l l ! i - l i l l ! |li~qll,,l i l l l l i l l . . l l i . ! l l l l l l l l U l i i n B I B l l ~ l t l . , i I , l i l t
i i l t l l h l l l l l l l l l l l l l l i l l ! l l l l | l I I I l i ! t l l ! l l l l l l l l l l l i l ' l l i l l l l l ~ l l l l l J l i d
i i I I I l l l l i ~ l l l l l l l l l l l l l l l w m l i ~ i l l i I i I i t t ~ i I I l l i " i ' i l i l l l i l i I I - ' ¢ ' i - ~ I ! I t ! i i I~I 0 I1"1 l l i l l l l l l l l l l l l l l l l l l J i " I I i
~ , ~ . ~.-"-:~-:-r.r.=r.=====r.=;=,.-~,.~,.r:,.r:,.r,.,,;,~ I
Figure 16: A Document Lens [18] format but with a point focus
Detail-In-Context Presentations and Zooming Drop-off functions that create lenses are calculated from a measure of distance. Thus far in this discussion, the distance, dp used to calculate the z translation is based on both x and y. In contrast, if dp is based solely on y (dp = abs(yi - y f )) , then any points that have the same y coordinate as those in the focal region will be translated as if they were in the focal region. This creates a region of scaled-only magnification that extends the width of the representation, creating the visual effect of a scroll. The same is true for x; i f the distortion is based solely on x, that is (dp = abs(xs - xf)) , then the magnified strip or scroll will extend from top to bottom of the image. Note that it is not possible to see the entire magnified region, as part of it is beyond the edge of the viewing frame. This is because for either the x or the y dimension, no distortion has been used to maintain context. However, this scroll is still a lens and has a viewer-aligned focal centre. Moving the centre of the lens towards either end of the scroll will bring that end of the scroll into view. Figure 17 (right) shows the effect of moving the focal centre towards the bottom of the image. This brings the bottom of the scroll into view. Just as a roving search is possible with these scrolls, so is folding.
~ z
/
Figure 17: A vertical scroll, on the left centred, on the right adjusted to reveal the bottom
_i !] !- Q Figure 18: On the left a 'full-zoom lens'; on the right a lens using partial x-distance
Figure 18 (left) shows a lens with distances calculated from neither x nor y. This is both a lens and a full zoom. Since it is a lens, moving the mouse as in a roving search will adjust the position of the image due to viewer-alignment. Moving the mouse as in folding will also re-position the image. Also, it has full, precise magnification control and, because this is a lens that has merely been extended in both x and y, the context is interactively retrievable. The ability to interactively select whether to use distortion in x or y, or either, or both, or partially, allows for rapid change from a full zoom environment to a detail-in-context environment (Figure 18, right). To allow interactive control of these features, distances in both x and y are multiplied by independent controllable factors which range between zero and one:
d p = ~/ X fac (X 1 -- x2) P + lY fac(Yl -- y2 )l e .
One can locate a region of interest with a detail-in-context lens, change to full zoom to be able to use the full frame for magnification, and return to a lens to relocate oneself in the context again.
THE EPF LIBRARY When developing the EPF library, a distinction was made between the representation of information and the presentation of information. Within the lens library, the representation of information is not considered; manipulation of surfaces, graphs, or any other data representation is performed identically. It is up to the user of the library to convert a specific data representation into a
68 UIST '01 November 11-14, 2 0 0 1

collection of data point triplets (x, y, z) on which all manipulation is performed.
The lens library provides a means for defining many diverse types of distortion lenses that can be used to manipulate the presentation of information. All lenses have precise magnification control and can be positioned at will. All lenses can be folded. Choice can be made between different focal shapes, such as a point, circle, square, rectangle, line, or polyline. The drop-off function for a lens may vary from a Gaussian, linear, hemispheric, cosine, or a Manhattan. The choice of different distance metrics, such as the L(1), L(2), L(3), and L(oo) metrics are available for a lens. Also, the x and y scaling factors that affect the distortion along the x and y axes may be modified. Multiple lenses of multiple types can exist within one presentation.
During the implementation of EPF library we created a trail application to allow us to test its functionality. Also, in parallel, this library was utilized in a project examining interactive solutions to edge congestion problems in graphs [5]. Though this library is still being extended, already researchers are expressing interest. Greenberg is currently applying it to a new awareness application for groupware. Gutwin (University of Saskachewan) is planning to use this library to facilitate the development of software for user studies. Baudisch (Xerox PARC) is also using results from this library for comparison purposes. Formal user studies have not yet been done but, to a great extent, that is the reason behind building this library. We hope that having varied and integrated presentation possibilities available in library format will be of general use to the community in performing studies.
CONCLUSION One of the hallmarks of a useful framework is its ability to explain and/or relate previous research. This paper has demonstrated how EPF achieves this.
Research into more effective use of current displays has been categorized as either distortion based or non-distortion based [16]. Non-distortion based screen real estate research has led to most of the more frequently used computational presentation paradigms such as windows with pan, scroll and zoom. However, no one is claiming, at least in their current manifestations, that they are the perfect solution. Even their general acronym WIMP is pejorative. Many researchers have noted limitations of access through pan, scroll and zoom. These include such things as getting lost in information spaces, problems with maintaining context when examining information details and interpretation issues in comparisons across disparate information spaces.
At the present time there is considerable discussion about the advantages and disadvantages of presentation methods that make use of distortion. There are studies that attribute advantages [8, 10, 24] to distortion based methods. There are also studies with inconclusive results [26, 27].
We present a framework that unifies distortion and non- distortion presentation paradigms. We hope that providing this framework as a library will encourage investigation into whether these characteristic patterns have advantages or disadvantages, and to improve our understanding of the extent to which these advantages or disadvantages are dependent on such things as the information, the task and the preferences of the user.
ACKNOWLEDGEMENTS The authors are grateful for support from Intel Research and thank Ann Grbavec and CJ Baker for the unstinting help in editing.
REFERENCES 1. L. Bartram, A. Ho, J. Dill and F. Henigman. The
continuous zoom: A constrained fisheye technique for viewing and navigating large information spaces. In Proceedings of the ACM Symposium on User Interface Software and Technology: UIST'95, pp. 207-215, 1995. ACM Press.
. M. S. T. Carpendale, D. J. Cowperthwaite and F. D. Fracchia. 3-Dimensional pliable surfaces: For effective presentation of visual information. In Proceedings of the ACM Symposium on User Interface Software and Technology: UIST'95, pp. 217-226, 1995. ACM Press.
. M. S. T. Carpendale, D. J. Cowperthwaite, F. D. Fracchia and T Shermer. Graph Folding: Extending detail and context viewing into a tool for subgraph comparisons. In Symposium on Graph Drawing, GD'95, pp. 127-139, 1995, Springer-Verlag.
. M. S. T. Carpendale, D. J. Cowperthwaite, M. Tigges, A. Fall and F. D. Fracchia. The Tardis: A Visual Exploration Environment for Landscape Dynamics. In SPIE, Conference on Visual Data Exploration and Analysis V1, 1999.
. M. S. T. Carpendale and R. Xing. Examining Edge CongestiorL In Conference Companion of CHI '01 Human Factors in Computing Systems, pp. 115-116, 2001.
. E. Chi and J. T. Riedl. An operator interaction framework for visualization systems. In Proceedings of the IEEE Conference on Information Visualization, pp. 19-25, Oct 1998. IEEE Computer Society Press.
. M. C. Chuah, S. F. Roth, J. Mattis and J. Kolojejchick. SDM: Malleable information graphics. In Proceedings of the IEEE Conference on Information Visualization, pp. 36-42, Oct 1995. IEEE Computer Society Press.
. G. W. Furnas. Generalized fisheye views. In Proceedings of the ACM Conference on Human- Computer Interaction: CHI'86, pp. 16-23, 1986. ACM Press.
~:=IB 3 (2) UIST '01 69

. G. W. Furnas, and B. B. Bederson. Space-scale diagrams: Understanding multiscale interfaces. In Proceedings of Human Factors in Computing Systems, CH1"95, ACM Press, pp. 234-241, 1995
10. J. C. Hollands, T. T. Carey and C. A. McCann. Presenting a graphical network: A comparison of performance using fisheye and scrolling views. In Designing and Using Human-Computer Interfaces and Knowledge Based Systems, pp. 313-320. Elsevier Science Publishers, 1989.
11. C. Iturriaga and A. Lubiw. Elastic labels: the two-axis case. In Proceedings of the fifth Symposium on Graph Drawing, pp. 181-192, September 1997. Springer- Verlag.
12. E. Kandogan and B. Shneiderman. Elastic windows: Improved spatial layout and rapid multiple window operations. In Proceedings of the ACM Conference on Advanced Visual Interfaces: AVI'96, pp. 250-257, 1996, ACM Press.
13. A. Keahey and E. Robertson. Techniques for nonlinear magnification transformations. In Proceedings of the IEEE Conference on Information Visualization, pp. 38-45, Oct 1996. IEEE Computer Society Press.
14. A. Keahey and E. Robertson. Nonlinear magnification fields. In Proceedings of the IEEE Conference on Information Visualization, pp. 51-58, Oct 1997. IEEE Computer Society Press.
15. J. Lamping, R. Rao and P. Pirolli. A focus and context technique based on hyperbolic geometry for visualizing large hierarchies. In Proceedings of the ACM conference on Human Factors in Computer Systems: CHI'95, pp. 401-408, May 1995. ACM Press.
16. Y. K. Leung and M. D. Apperley. A review and taxonomy of distortion-oriented presentation techniques. ACM Transactions on Computer-Human Interaction, 1(2):126-160, 1994, ACM Press.
17. J. D. Mackinlay, G. G. Robertson, and S. K. Card. The perspective wall: Detail and context smoothly integratec[ In Proceedings of the ACM Conference on Human Factors in Computing Systems: CHI'91, pp. 173-180, April 1991. ACM Press.
18. K. Misue and K. Sugiyama. Multi-viewpoint perspective display methods: Formulation and
19.
20.
21.
22.
23.
24.
25.
26.
27.
28.
application to compound digraphs. In Human Aspects in Computing: design and Use of Interactive Systems and Information Management, pp. 834-838. Elsevier Science Publishers, 1991.
E. G. Noik. A space of presentation emphasis techniques for visualizing graphs. In Graphics Interface '94, pp. 225-233, 1994.
G. Robertson and J. D. Mackinlay. The document lens. In Proceedings of the ACM Symposium on User Interface Software and Technology: UIST'93, pp. 101- 108, November 1993. ACM Press.
M. Sarkar and M. H. Brown. Graphical fisheye views. Communications of the ACM, 37(12):73-84, 1994.
M. Sarkar, S. Snibbe, O. J. Tversky, and S. P. Reiss. Stretching the rubber sheet: A metaphor for viewing large layouts on small screens. In Proceedings of the ACM Symposium on User Interface Software and Technology: UIST'93, pp. 81-91, November 1993. ACM Press.
M. Sarkar and S. P. Reiss. Manipulating screen space with stretchtools: Visualizing large structures on small screen. Technical Report CS-92-42, Brown University, 1992.
D. Schaffer, Z. Zuo, S. Greenberg, L. Bartram, J. Dill, S. Dubs, and M. Roseman. Navigating hierarchically clustered networks through fisheye and full-zoom methods. ACM Transactions on Computer-Human Interaction, 3(2): 162-188, 1996, ACM Press.
R. Spence, and M. D. Apperley. Data Base navigation: An office environment for the professional, Behaviour and Information Technology, 1(1):43-54, 19~6
M-A.D. Storey, K. Wong, and H. A. Miiller. How Do Program Understanding Tools Affect How Programmers Understand Programs? In Science of Computer Programming, 36(2-3), pp. 183-207, March 2000.
O. Kuederle, K. M. Inkpen, S. Atkins, and M.S.T. Carpendale. Interacting with Image Sequences: Detail- in-Context and Thumbnails. In Proceedings of Graphics Interface. June 2001.
C. Ware and M. Lewis. The DragMag image magnifier. In Conference companion on Human factors in computing systems, CH1'95, pp. 407 - 408, 1995, ACM Press.
70 UIST '01 November 11-14, 2 0 0 1