(a) explain either one demand or one supply factor that...
TRANSCRIPT

2015 C2 H2 BT2 CSQ1 (Microeconomics: DD/SS and Market Structure) (tutors’ copy)
(updated 21 Jul’15)
(a) Explain either one demand or one supply factor that has led to a rise in the world price of cocoa bean.
Explain one demand factor: [1m] Identify: Change in taste & preference [1m] Explain: Rise in demand for dark choc, which has higher
cocoa content → rise in demand for cocoa bean, which is a derived demand since cocoa bean is a factor of production → rise in price ceteris paribus.
Note to markers: Students will not be penalised for writing only derived demand or factor of production, but we need to give them the feedback that both concepts should be used to fully explain.
OR
Explain one supply factor:
[1m] Identify: Negative supply shock due to falling rainfall and rising extreme heat
[1m] Explain: Lower the amount of harvest → fall in supply → rise in price ceteris paribus.
Examiners’ Comments
Common Error Reason for why it is wrong, and Corrections
Failed to state the factor of DD or SS clearly
Wrong answering technique
Failed to cite clear evidence Wrong answering technique
Unable to explain the relationship between cocoa bean and chocolate, and thus the key concept of derived demand (and factor of production) is left out.
Answer lacks accurate and full explanation
Some candidates explain rise in chocolate and no mention of cocoa bean at all and will not be awarded any mark
Wrong question interpretation
Some students wrote that ‘a shortage means a fall in supply’, suggesting that a shortage leads to a fall in supply.
Wrong expression, or concept error. Correction: A shortage is a result of fall in supply or/and rise in demand.
[2]
(b) What can you conclude from evidence in Extract 1 about the value of the price elasticity of supply of cocoa beans in Ivory Coast? Note to markers: 0.5m per bullet point; and round down
PES is (positive and) <1
such that change (↑/↓) in quantity supplied is proportionately less
than change (↑/↓) in own price, in the same direction
long gestation/production period
takes one year to derive enough cocoa beans from 1 tree to make 450 gram of chocolate, which is approximately 90 Hershey’s Kisses
[2]
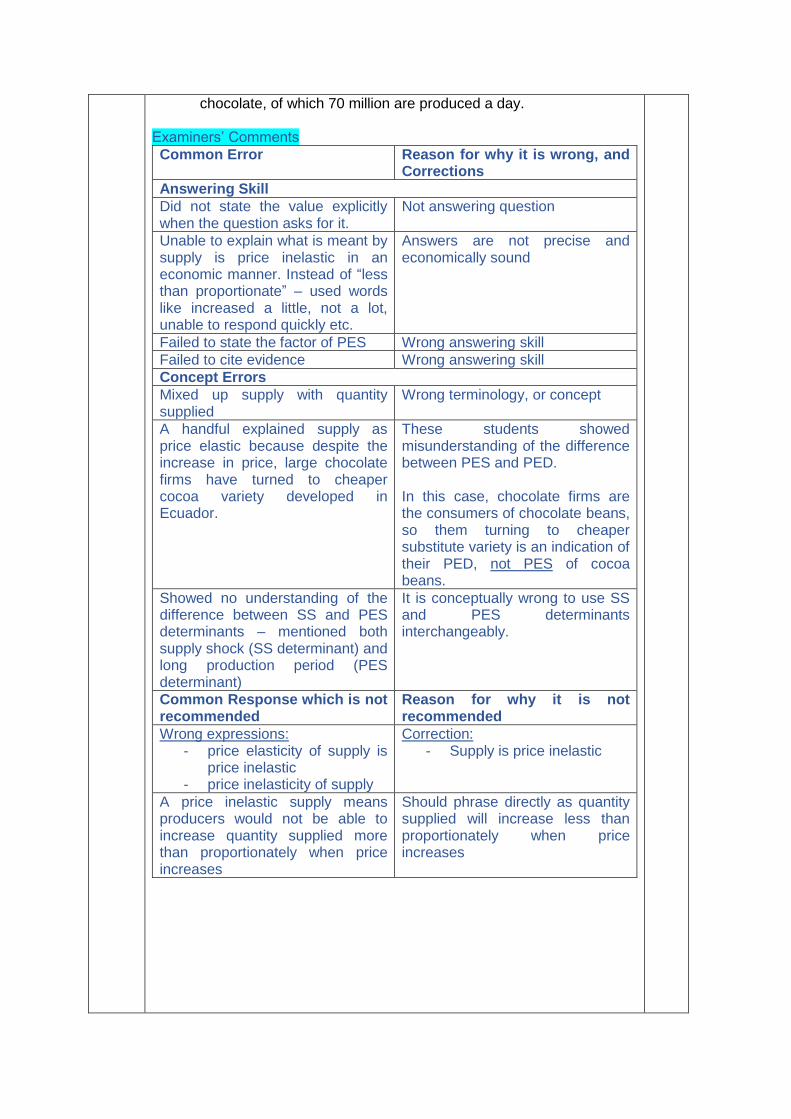
chocolate, of which 70 million are produced a day. Examiners’ Comments
Common Error Reason for why it is wrong, and Corrections
Answering Skill
Did not state the value explicitly when the question asks for it.
Not answering question
Unable to explain what is meant by supply is price inelastic in an economic manner. Instead of “less than proportionate” – used words like increased a little, not a lot, unable to respond quickly etc.
Answers are not precise and economically sound
Failed to state the factor of PES Wrong answering skill
Failed to cite evidence Wrong answering skill
Concept Errors
Mixed up supply with quantity supplied
Wrong terminology, or concept
A handful explained supply as price elastic because despite the increase in price, large chocolate firms have turned to cheaper cocoa variety developed in Ecuador.
These students showed misunderstanding of the difference between PES and PED. In this case, chocolate firms are the consumers of chocolate beans, so them turning to cheaper substitute variety is an indication of their PED, not PES of cocoa beans.
Showed no understanding of the difference between SS and PES determinants – mentioned both supply shock (SS determinant) and long production period (PES determinant)
It is conceptually wrong to use SS and PES determinants interchangeably.
Common Response which is not recommended
Reason for why it is not recommended
Wrong expressions: - price elasticity of supply is
price inelastic - price inelasticity of supply
Correction: - Supply is price inelastic
A price inelastic supply means producers would not be able to increase quantity supplied more than proportionately when price increases
Should phrase directly as quantity supplied will increase less than proportionately when price increases
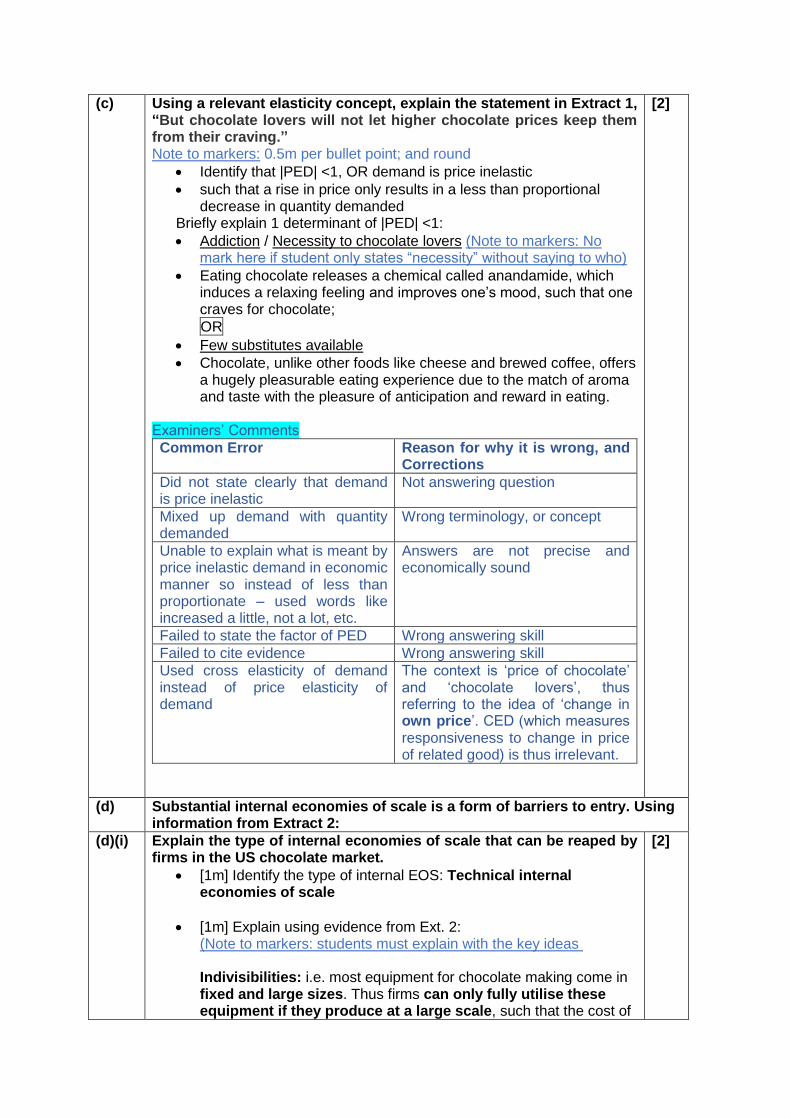
(c) Using a relevant elasticity concept, explain the statement in Extract 1, “But chocolate lovers will not let higher chocolate prices keep them from their craving.” Note to markers: 0.5m per bullet point; and round down
Identify that |PED| <1, OR demand is price inelastic
such that a rise in price only results in a less than proportional decrease in quantity demanded
Briefly explain 1 determinant of |PED| <1:
Addiction / Necessity to chocolate lovers (Note to markers: No mark here if student only states “necessity” without saying to who)
Eating chocolate releases a chemical called anandamide, which induces a relaxing feeling and improves one’s mood, such that one craves for chocolate;
OR
Few substitutes available
Chocolate, unlike other foods like cheese and brewed coffee, offers a hugely pleasurable eating experience due to the match of aroma and taste with the pleasure of anticipation and reward in eating.
Examiners’ Comments
Common Error Reason for why it is wrong, and Corrections
Did not state clearly that demand is price inelastic
Not answering question
Mixed up demand with quantity demanded
Wrong terminology, or concept
Unable to explain what is meant by price inelastic demand in economic manner so instead of less than proportionate – used words like increased a little, not a lot, etc.
Answers are not precise and economically sound
Failed to state the factor of PED Wrong answering skill
Failed to cite evidence Wrong answering skill
Used cross elasticity of demand instead of price elasticity of demand
The context is ‘price of chocolate’ and ‘chocolate lovers’, thus referring to the idea of ‘change in own price’. CED (which measures responsiveness to change in price of related good) is thus irrelevant.
[2]
(d) Substantial internal economies of scale is a form of barriers to entry. Using information from Extract 2:
(d)(i) Explain the type of internal economies of scale that can be reaped by firms in the US chocolate market.
[1m] Identify the type of internal EOS: Technical internal economies of scale
[1m] Explain using evidence from Ext. 2: (Note to markers: students must explain with the key ideas in bold below to get the 1m) Indivisibilities: i.e. most equipment for chocolate making come in fixed and large sizes. Thus firms can only fully utilise these equipment if they produce at a large scale, such that the cost of
[2]
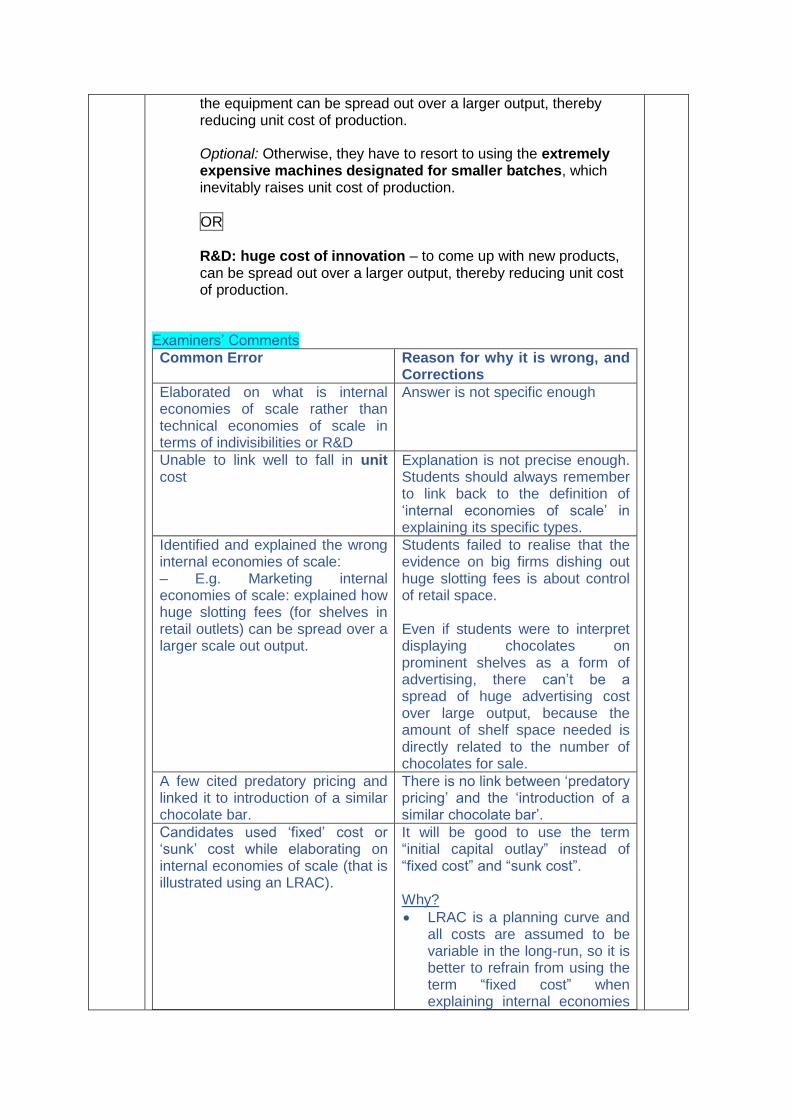
the equipment can be spread out over a larger output, thereby reducing unit cost of production. Optional: Otherwise, they have to resort to using the extremely expensive machines designated for smaller batches, which inevitably raises unit cost of production.
OR
R&D: huge cost of innovation – to come up with new products, can be spread out over a larger output, thereby reducing unit cost of production.
Examiners’ Comments
Common Error Reason for why it is wrong, and Corrections
Elaborated on what is internal economies of scale rather than technical economies of scale in terms of indivisibilities or R&D
Answer is not specific enough
Unable to link well to fall in unit cost
Explanation is not precise enough. Students should always remember to link back to the definition of ‘internal economies of scale’ in explaining its specific types.
Identified and explained the wrong internal economies of scale: – E.g. Marketing internal economies of scale: explained how huge slotting fees (for shelves in retail outlets) can be spread over a larger scale out output.
Students failed to realise that the evidence on big firms dishing out huge slotting fees is about control of retail space. Even if students were to interpret displaying chocolates on prominent shelves as a form of advertising, there can’t be a spread of huge advertising cost over large output, because the amount of shelf space needed is directly related to the number of chocolates for sale.
A few cited predatory pricing and linked it to introduction of a similar chocolate bar.
There is no link between ‘predatory pricing’ and the ‘introduction of a similar chocolate bar’.
Candidates used ‘fixed’ cost or ‘sunk’ cost while elaborating on internal economies of scale (that is illustrated using an LRAC).
It will be good to use the term “initial capital outlay” instead of “fixed cost” and “sunk cost”. Why?
LRAC is a planning curve and all costs are assumed to be variable in the long-run, so it is better to refrain from using the term “fixed cost” when explaining internal economies
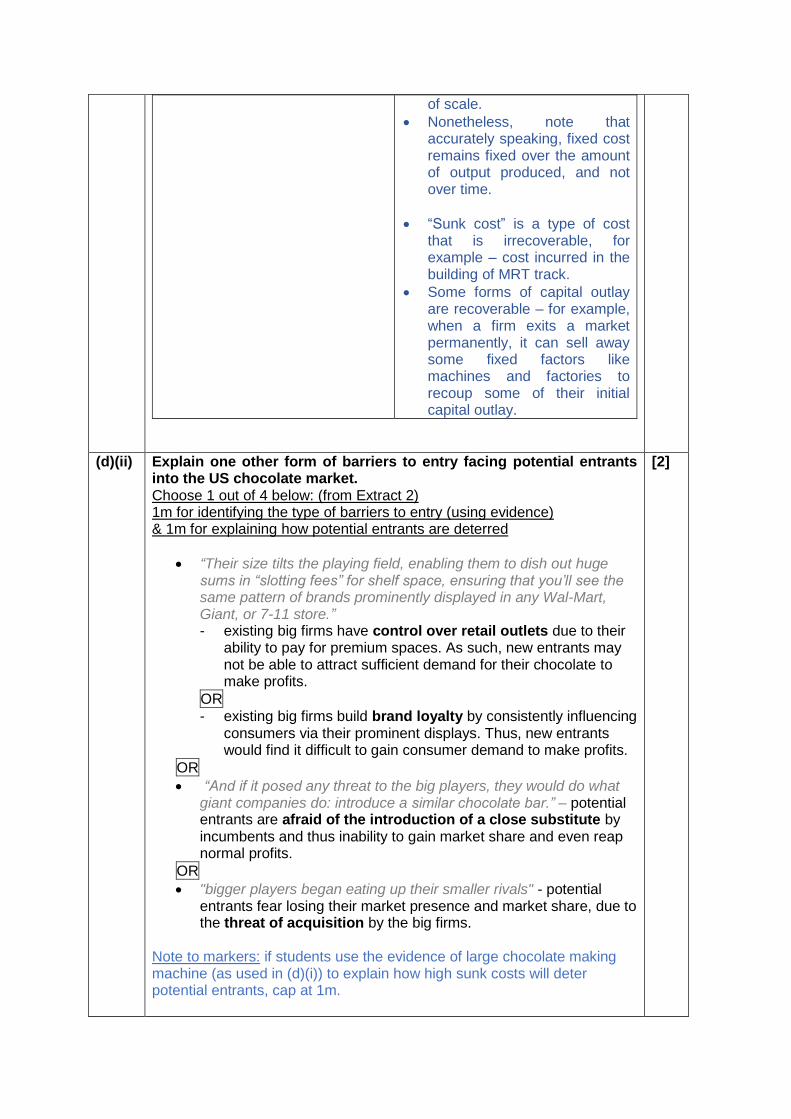
of scale.
Nonetheless, note that accurately speaking, fixed cost remains fixed over the amount of output produced, and not over time.
“Sunk cost” is a type of cost that is irrecoverable, for example – cost incurred in the building of MRT track.
Some forms of capital outlay are recoverable – for example, when a firm exits a market permanently, it can sell away some fixed factors like machines and factories to recoup some of their initial capital outlay.
(d)(ii) Explain one other form of barriers to entry facing potential entrants into the US chocolate market. Choose 1 out of 4 below: (from Extract 2) 1m for identifying the type of barriers to entry (using evidence) & 1m for explaining how potential entrants are deterred
“Their size tilts the playing field, enabling them to dish out huge sums in “slotting fees” for shelf space, ensuring that you’ll see the same pattern of brands prominently displayed in any Wal-Mart, Giant, or 7-11 store.” - existing big firms have control over retail outlets due to their
ability to pay for premium spaces. As such, new entrants may not be able to attract sufficient demand for their chocolate to make profits.
OR
- existing big firms build brand loyalty by consistently influencing consumers via their prominent displays. Thus, new entrants would find it difficult to gain consumer demand to make profits.
OR
“And if it posed any threat to the big players, they would do what giant companies do: introduce a similar chocolate bar.” – potential entrants are afraid of the introduction of a close substitute by incumbents and thus inability to gain market share and even reap normal profits.
OR "bigger players began eating up their smaller rivals" - potential
entrants fear losing their market presence and market share, due to the threat of acquisition by the big firms.
Note to markers: if students use the evidence of large chocolate making machine (as used in (d)(i)) to explain how high sunk costs will deter potential entrants, cap at 1m.
[2]
Note to students: Control of retail space and fear of introduction of a close substitute are the preferred answers, as the Extract explicitly hints at these as the barriers to entry. Examiners’ Comments
Common Error Reason for why it is wrong, and Corrections
Used information from other sources instead of the prescribed Extract 2
- E.g. brand loyalty with no link to any evidence in Ext. 2
Not answering question
Several stated high start-up cost due to the expensive machinery.
Not fulfilling question requirement. High start-up cost, in the context of Extract 2, is still closely related to the substantial technical internal economies of scale, which was explained in (d)(i). However, (d)(ii) asks for another source of barriers to entry.
Students explained types of barriers to entry for which there is no evidence of:
- Bulk purchasing
Not answering question
Students stating X-inefficiency without explaining the term. There are even some who explained that X-inefficiency causing allocative inefficiency!!!
(e) Identify the type of market structure that exists in the US chocolate market and explain the reason for your choice.
Oligopoly / Duopoly (not pure duopoly) [1]
2-firm market concentration ratio = 75%, signifies a few dominant firms in the market. [1]
Examiners’ Comments
Common Error Reason for why it is wrong, and Corrections
Some candidates either left out the MCR or key words like dominant firms
Answer is not precise enough in economic sense
Failed to calculate MCR from Figure 1 but instead, only used information from the extracts about ‘bigger players’
Answer is not precise enough in economic sense
Gave more than 1 reason when the question asks for ‘the reason’
Not answering question
Common Response which is not recommended
Reason for why it is not recommended
Students use MCR3 or MCR4 as evidence of oligopoly.
Students were not penalised but are encouraged in this case study,
[2]
to use MCR2 or MCR5, given that the market shares of the 3rd, 4th and 5th largest firms are almost the same.
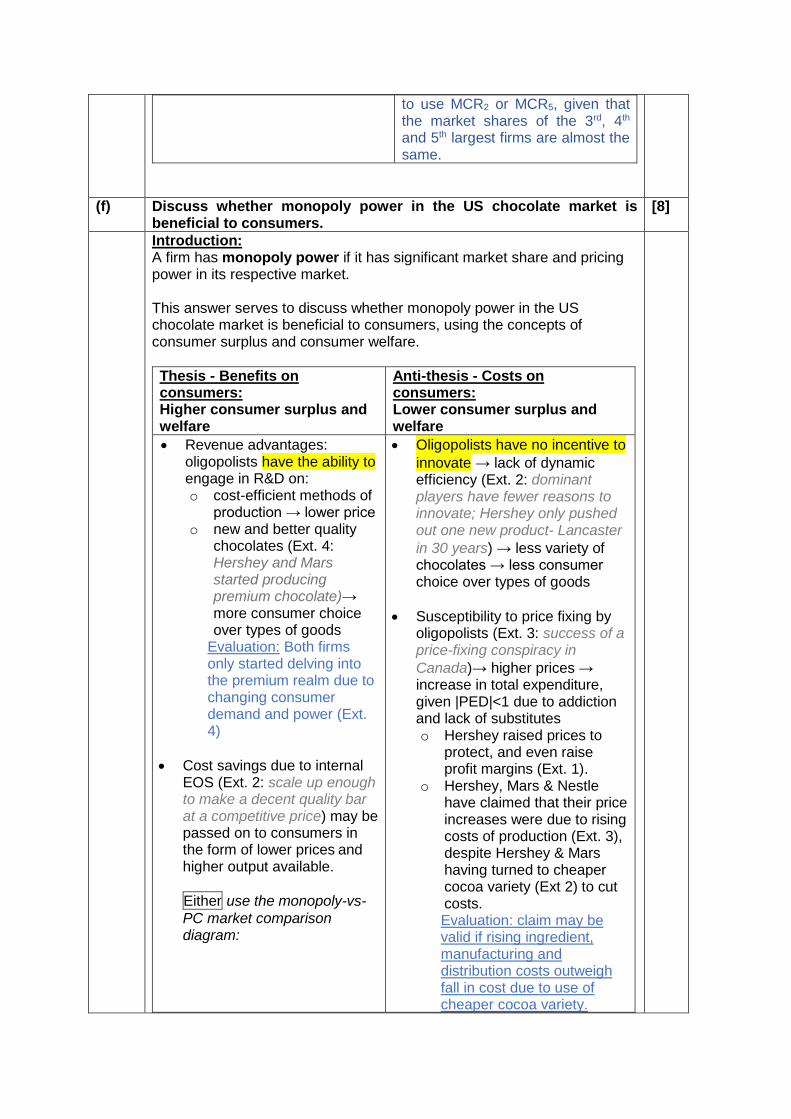
(f) Discuss whether monopoly power in the US chocolate market is beneficial to consumers.
[8]
Introduction: A firm has monopoly power if it has significant market share and pricing power in its respective market. This answer serves to discuss whether monopoly power in the US chocolate market is beneficial to consumers, using the concepts of consumer surplus and consumer welfare.
Thesis - Benefits on consumers: Higher consumer surplus and welfare
Anti-thesis - Costs on consumers: Lower consumer surplus and welfare
Revenue advantages: oligopolists have the ability to engage in R&D on: o cost-efficient methods of
production → lower price o new and better quality
chocolates (Ext. 4: Hershey and Mars started producing premium chocolate)→ more consumer choice over types of goods
Evaluation: Both firms only started delving into the premium realm due to changing consumer demand and power (Ext. 4)
Cost savings due to internal EOS (Ext. 2: scale up enough to make a decent quality bar at a competitive price) may be passed on to consumers in the form of lower prices and higher output available.
Either use the monopoly-vs-
PC market comparison diagram:
Oligopolists have no incentive to
innovate → lack of dynamic efficiency (Ext. 2: dominant players have fewer reasons to innovate; Hershey only pushed out one new product- Lancaster
in 30 years) → less variety of chocolates → less consumer choice over types of goods
Susceptibility to price fixing by oligopolists (Ext. 3: success of a price-fixing conspiracy in
Canada)→ higher prices → increase in total expenditure, given |PED|<1 due to addiction and lack of substitutes o Hershey raised prices to
protect, and even raise profit margins (Ext. 1).
o Hershey, Mars & Nestle have claimed that their price increases were due to rising costs of production (Ext. 3), despite Hershey & Mars having turned to cheaper cocoa variety (Ext 2) to cut costs. Evaluation: claim may be valid if rising ingredient, manufacturing and distribution costs outweigh fall in cost due to use of cheaper cocoa variety.
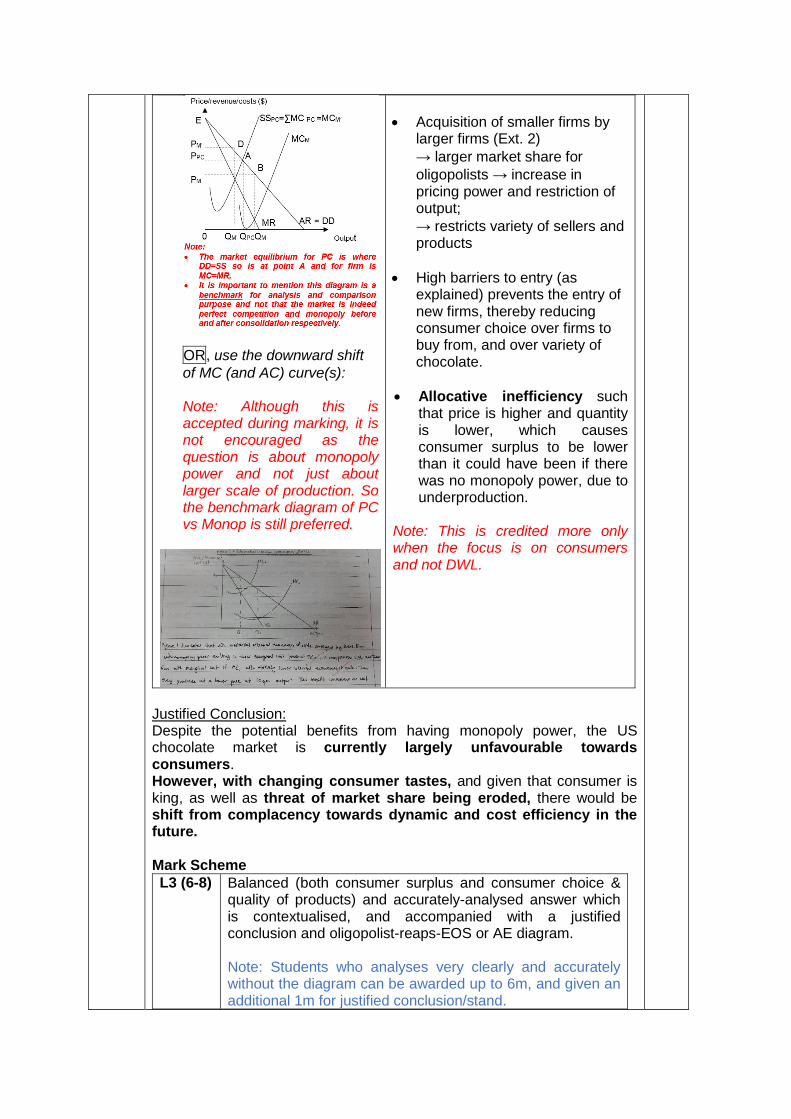
OR, use the downward shift
of MC (and AC) curve(s): Note: Although this is accepted during marking, it is not encouraged as the question is about monopoly power and not just about larger scale of production. So the benchmark diagram of PC vs Monop is still preferred.
Acquisition of smaller firms by larger firms (Ext. 2)
→ larger market share for
oligopolists → increase in pricing power and restriction of output;
→ restricts variety of sellers and products
High barriers to entry (as explained) prevents the entry of new firms, thereby reducing consumer choice over firms to buy from, and over variety of chocolate.
Allocative inefficiency such that price is higher and quantity is lower, which causes consumer surplus to be lower than it could have been if there was no monopoly power, due to underproduction.
Note: This is credited more only when the focus is on consumers and not DWL.
Justified Conclusion: Despite the potential benefits from having monopoly power, the US chocolate market is currently largely unfavourable towards consumers. However, with changing consumer tastes, and given that consumer is king, as well as threat of market share being eroded, there would be shift from complacency towards dynamic and cost efficiency in the future. Mark Scheme
L3 (6-8) Balanced (both consumer surplus and consumer choice & quality of products) and accurately-analysed answer which is contextualised, and accompanied with a justified conclusion and oligopolist-reaps-EOS or AE diagram. Note: Students who analyses very clearly and accurately without the diagram can be awarded up to 6m, and given an additional 1m for justified conclusion/stand.
L2 (4-5) Either: Lopsided answer with in-depth analysis, Or: Balanced answer but lacks depth in analysis. Both with some use of case evidence. (No use of case evidence – capped at Low L2: 4m)
L1 (1-3) High L1: List of relevant concepts and/or case evidence without explanation. Low L1: Largely irrelevant answer with major conceptual errors.
Examiners’ Comments
Common Error Reason for why it is wrong, and Corrections
There are a handful of students who defined ‘monopoly power’ as ‘monopoly’. Though explained why chocolate industry is an oligopoly in part (e), students kept using chocolate firm is monopoly in this question. Other stated monopoly is ability to set own price – this is true for monopolistic competitive firm also
‘Monopoly power’ exists in monopoly, oligopoly and monopolistic competition.
Students who used the AE framework pointed out the deadweight welfare loss, instead of loss of consumer surplus.
Given that the question is about impact on consumers, it is expected that the impact on higher price, lower output and thus loss of consumer surplus should be analysed.
Using the AE diagram, students wrongly identify the “total benefits foregone from underproduction” as the loss in consumer surplus.
Consumer surplus is the difference between price that consumers pay and the price which they are willing and able to pay. Hence, in the AE diagram, the loss of consumer surplus should be the trapezium bounded by the vertical difference between PM and PAE, and AR curve.
For the “PC market vs. monopoly firm/market” diagram and analysis: - often badly drawn or labelled,
especially the MC. - equilibrium points were
wrongly identified – e.g. use of AR=MC for both PC and monopoly, or use of MC=MR for PC and monopoly.
Corrections: - For the PC market,
equilibrium should be at AR=MC, representing market SS = market DD; whereas for the monopoly firm/market, equilibrium should be at MC=MR representing profit-maximisation.
- “PC market vs. monopoly firm/market” diagram and

- Students explain it is PC vs
oligopoly.
analysis is a benchmark or proxy diagram and analysis to compare a case of competition vs. no/little competition.
Many students either did not link their analysis to consumer surplus and consumer welfare, or did not differentiate between consumer surplus and consumer welfare.
Increase or decrease in consumer surplus and consumer welfare are consumer outcomes, and thus need to be highlighted. Consumer surplus, affected by price and quantity, is a subset of consumer welfare. Consumer welfare also consists of consumer choice (i.e. variety of goods and sellers to buy from) and quality of goods.
A few students illustrated how firms with monopoly power face higher and more price inelastic demand, thereby resulting in higher price and thus lower consumer surplus.
This analysis, by itself, is insufficient to justify that monopoly power is harmful to consumers because the higher price is a function of the firm’s larger market share. Moreover, the higher and more price inelastic demand also results in higher quantity, which raises consumer surplus. Note: only if students explain how bigger firms use product promotion to artificially raise demand and reduce its PED, is this analysis on how monopoly power is harmful to consumers justifiable.
MANY confused between “X-inefficiency” with “no dynamic efficiency”
X-inefficiency is lax in cost control so it is about SRAC lying above LRAC. No dynamic efficiency is usually about firms not engaging in R&D, and hence the concept is usually associated with lack of improvement in quality of product.
Quite often, the theory is supported with wrong evidence – example for no dynamic efficiency, instead of citing ‘dominant players have fewer reasons to innovate; Hershey only pushed out one new product- Lancaster in 30 years’, quite a handful cited the control of retail space which is irrelevant.
Students are reminded to use the appropriate pair of evidence and theory.
Extreme cases that do not score These scripts have failed to
well: – either a total theoretical approach like an essay, – or highly descriptive with lifting of many evidences but little theory.
balance use of evidence with depth of analysis.
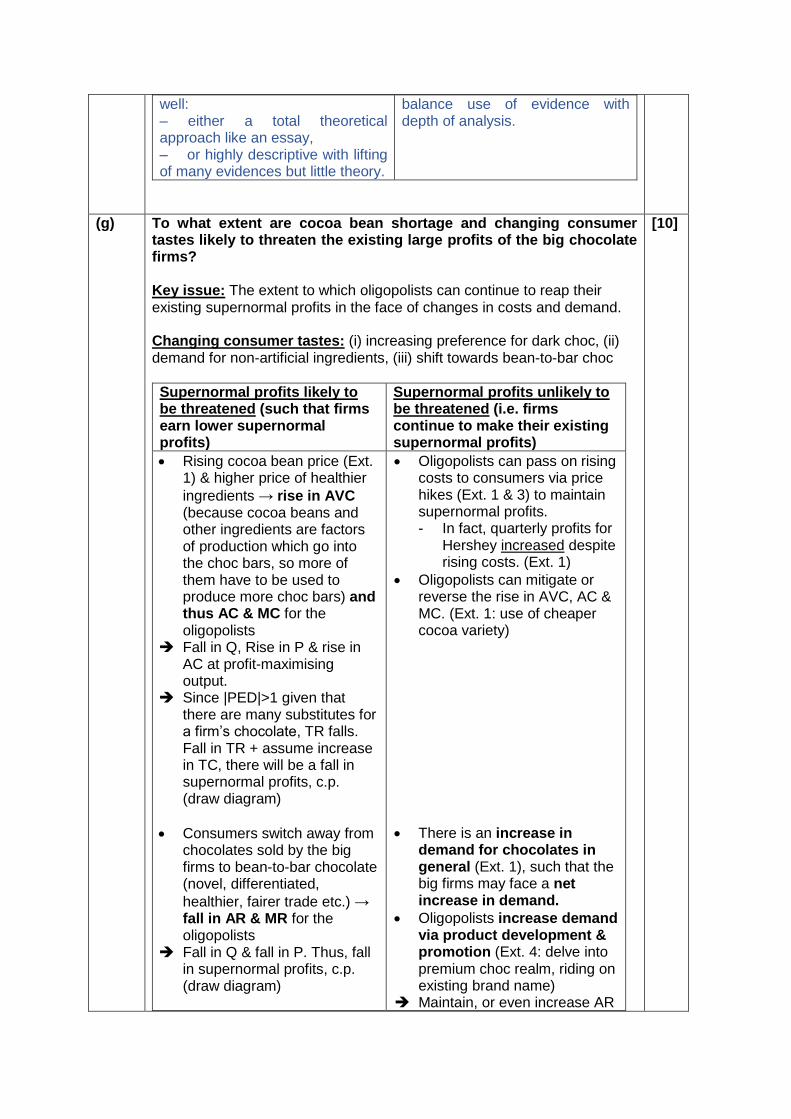
(g) To what extent are cocoa bean shortage and changing consumer tastes likely to threaten the existing large profits of the big chocolate firms? Key issue: The extent to which oligopolists can continue to reap their existing supernormal profits in the face of changes in costs and demand. Changing consumer tastes: (i) increasing preference for dark choc, (ii) demand for non-artificial ingredients, (iii) shift towards bean-to-bar choc
Supernormal profits likely to be threatened (such that firms earn lower supernormal profits)
Supernormal profits unlikely to be threatened (i.e. firms continue to make their existing supernormal profits)
Rising cocoa bean price (Ext. 1) & higher price of healthier
ingredients → rise in AVC (because cocoa beans and other ingredients are factors of production which go into the choc bars, so more of them have to be used to produce more choc bars) and thus AC & MC for the oligopolists
Fall in Q, Rise in P & rise in AC at profit-maximising output.
Since |PED|>1 given that there are many substitutes for a firm’s chocolate, TR falls. Fall in TR + assume increase in TC, there will be a fall in supernormal profits, c.p. (draw diagram)
Consumers switch away from chocolates sold by the big firms to bean-to-bar chocolate (novel, differentiated,
healthier, fairer trade etc.) → fall in AR & MR for the oligopolists
Fall in Q & fall in P. Thus, fall in supernormal profits, c.p. (draw diagram)
Oligopolists can pass on rising costs to consumers via price hikes (Ext. 1 & 3) to maintain supernormal profits. - In fact, quarterly profits for
Hershey increased despite rising costs. (Ext. 1)
Oligopolists can mitigate or reverse the rise in AVC, AC & MC. (Ext. 1: use of cheaper cocoa variety)
There is an increase in demand for chocolates in general (Ext. 1), such that the big firms may face a net increase in demand.
Oligopolists increase demand via product development & promotion (Ext. 4: delve into premium choc realm, riding on existing brand name)
Maintain, or even increase AR
[10]
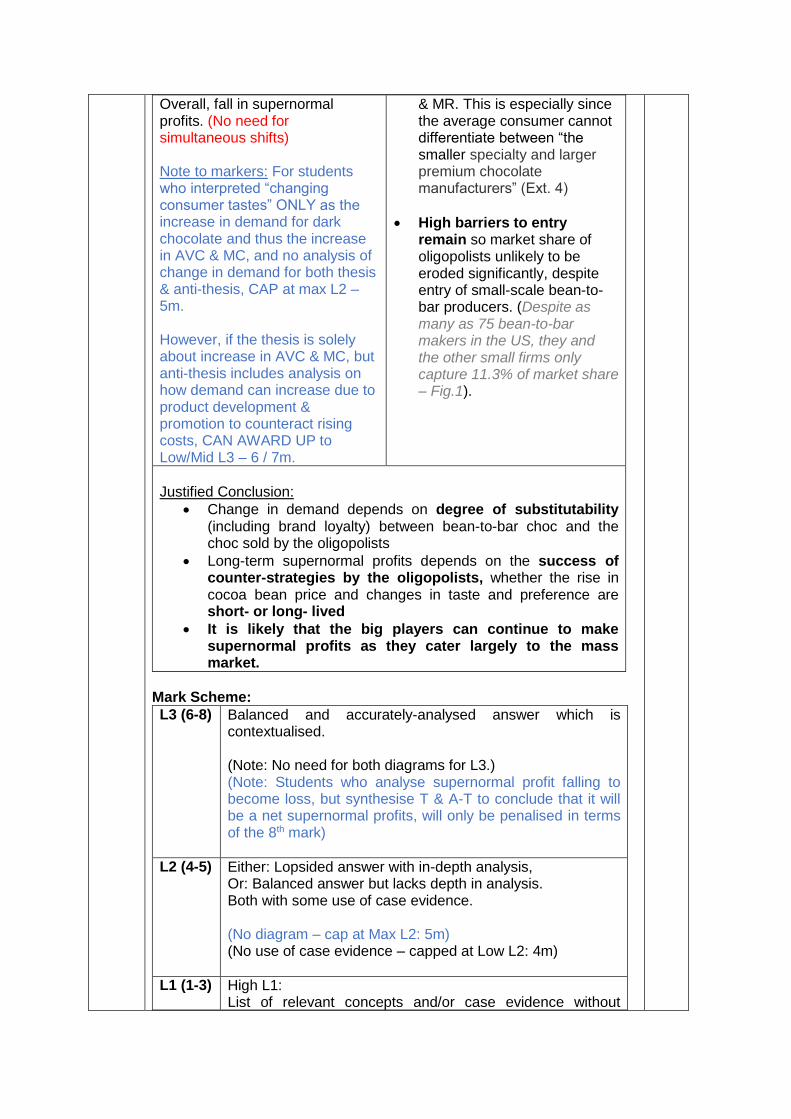
Overall, fall in supernormal profits. (No need for simultaneous shifts) Note to markers: For students who interpreted “changing consumer tastes” ONLY as the increase in demand for dark chocolate and thus the increase in AVC & MC, and no analysis of change in demand for both thesis & anti-thesis, CAP at max L2 – 5m. However, if the thesis is solely about increase in AVC & MC, but anti-thesis includes analysis on how demand can increase due to product development & promotion to counteract rising costs, CAN AWARD UP to Low/Mid L3 – 6 / 7m.
& MR. This is especially since the average consumer cannot differentiate between “the smaller specialty and larger premium chocolate manufacturers” (Ext. 4)
High barriers to entry remain so market share of oligopolists unlikely to be eroded significantly, despite entry of small-scale bean-to-bar producers. (Despite as many as 75 bean-to-bar makers in the US, they and the other small firms only capture 11.3% of market share – Fig.1).
Justified Conclusion:
Change in demand depends on degree of substitutability (including brand loyalty) between bean-to-bar choc and the choc sold by the oligopolists
Long-term supernormal profits depends on the success of counter-strategies by the oligopolists, whether the rise in cocoa bean price and changes in taste and preference are short- or long- lived
It is likely that the big players can continue to make supernormal profits as they cater largely to the mass market.
Mark Scheme:
L3 (6-8) Balanced and accurately-analysed answer which is contextualised. (Note: No need for both diagrams for L3.) (Note: Students who analyse supernormal profit falling to become loss, but synthesise T & A-T to conclude that it will be a net supernormal profits, will only be penalised in terms of the 8th mark)
L2 (4-5) Either: Lopsided answer with in-depth analysis, Or: Balanced answer but lacks depth in analysis. Both with some use of case evidence. (No diagram – cap at Max L2: 5m) (No use of case evidence – capped at Low L2: 4m)
L1 (1-3) High L1: List of relevant concepts and/or case evidence without
explanation. Low L1: Largely irrelevant answer with major conceptual errors.
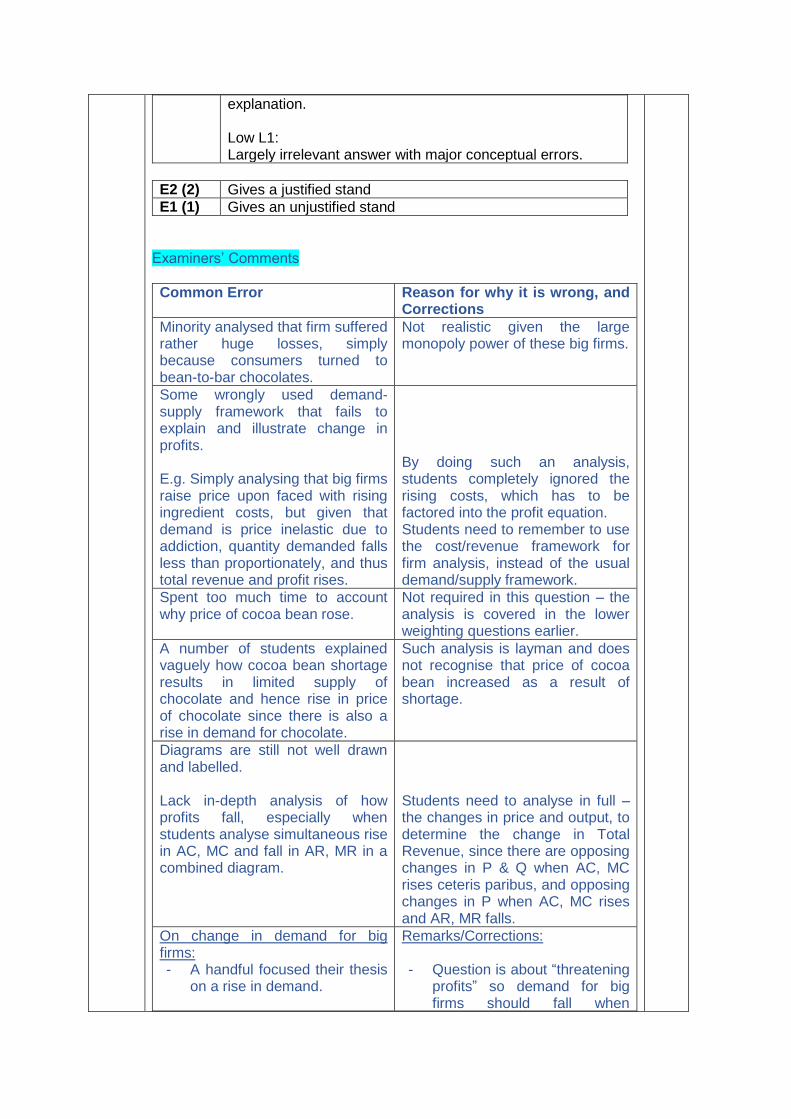
E2 (2) Gives a justified stand
E1 (1) Gives an unjustified stand
Examiners’ Comments
Common Error Reason for why it is wrong, and Corrections
Minority analysed that firm suffered rather huge losses, simply because consumers turned to bean-to-bar chocolates.
Not realistic given the large monopoly power of these big firms.
Some wrongly used demand-supply framework that fails to explain and illustrate change in profits. E.g. Simply analysing that big firms raise price upon faced with rising ingredient costs, but given that demand is price inelastic due to addiction, quantity demanded falls less than proportionately, and thus total revenue and profit rises.
By doing such an analysis, students completely ignored the rising costs, which has to be factored into the profit equation. Students need to remember to use the cost/revenue framework for firm analysis, instead of the usual demand/supply framework.
Spent too much time to account why price of cocoa bean rose.
Not required in this question – the analysis is covered in the lower weighting questions earlier.
A number of students explained vaguely how cocoa bean shortage results in limited supply of chocolate and hence rise in price of chocolate since there is also a rise in demand for chocolate.
Such analysis is layman and does not recognise that price of cocoa bean increased as a result of shortage.
Diagrams are still not well drawn and labelled. Lack in-depth analysis of how profits fall, especially when students analyse simultaneous rise in AC, MC and fall in AR, MR in a combined diagram.
Students need to analyse in full – the changes in price and output, to determine the change in Total Revenue, since there are opposing changes in P & Q when AC, MC rises ceteris paribus, and opposing changes in P when AC, MC rises and AR, MR falls.
On change in demand for big firms: - A handful focused their thesis
on a rise in demand.
Remarks/Corrections: - Question is about “threatening
profits” so demand for big firms should fall when
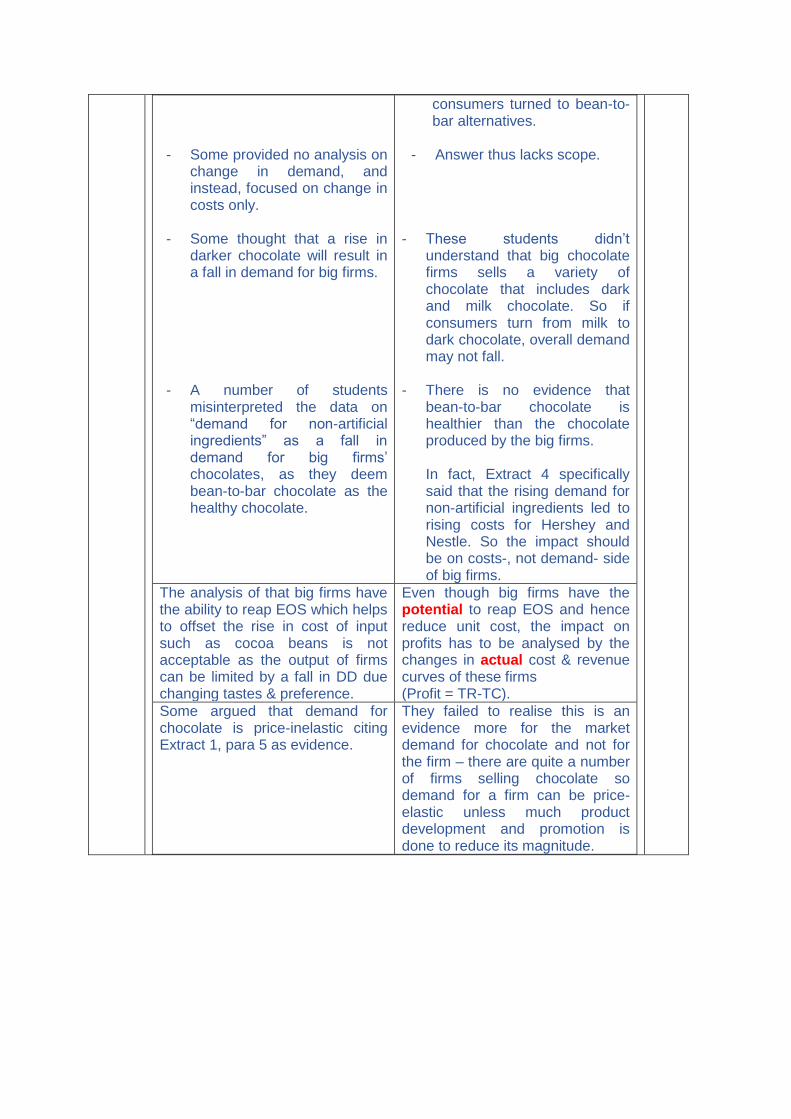
- Some provided no analysis on
change in demand, and instead, focused on change in costs only.
- Some thought that a rise in darker chocolate will result in a fall in demand for big firms.
- A number of students
misinterpreted the data on “demand for non-artificial ingredients” as a fall in demand for big firms’ chocolates, as they deem bean-to-bar chocolate as the healthy chocolate.
consumers turned to bean-to-bar alternatives.
- Answer thus lacks scope.
- These students didn’t
understand that big chocolate firms sells a variety of chocolate that includes dark and milk chocolate. So if consumers turn from milk to dark chocolate, overall demand may not fall.
- There is no evidence that
bean-to-bar chocolate is healthier than the chocolate produced by the big firms.
In fact, Extract 4 specifically said that the rising demand for non-artificial ingredients led to rising costs for Hershey and Nestle. So the impact should be on costs-, not demand- side of big firms.
The analysis of that big firms have the ability to reap EOS which helps to offset the rise in cost of input such as cocoa beans is not acceptable as the output of firms can be limited by a fall in DD due changing tastes & preference.
Even though big firms have the potential to reap EOS and hence reduce unit cost, the impact on profits has to be analysed by the changes in actual cost & revenue curves of these firms (Profit = TR-TC).
Some argued that demand for chocolate is price-inelastic citing Extract 1, para 5 as evidence.
They failed to realise this is an evidence more for the market demand for chocolate and not for the firm – there are quite a number of firms selling chocolate so demand for a firm can be price-elastic unless much product development and promotion is done to reduce its magnitude.