a dynamic cellular automaton model for large-scale pedestrian evacuation
TRANSCRIPT
Scientific Review
ISSN: 2412-2599 Vol. 1, No. 2, pp: 36-44, 2015
URL: http://arpgweb.com/?ic=journal&journal=10&info=aims
*Corresponding Author
36
Academic Research Publishing Group
A Dynamic Cellular Automaton Model for Large-Scale
Pedestrian Evacuation
Lim Eng Aik* Institut Matematik Kejuruteraan, Universiti Malaysia Perlis, 02600 Ulu Pauh, Perlis, Malaysia
Tan Wee Choon School of Mechatronic Engineering, Universiti Malaysia Perlis, 02600 Ulu Pauh, Perlis, Malaysia
Mohd. Syafarudy Abu Institut Matematik Kejuruteraan, Universiti Malaysia Perlis, 02600 Ulu Pauh, Perlis, Malaysia
1. Introduction Traffic modeling mainly in pedestrian dynamic study has become among the most interesting fields found in
transportation science. The modeling or experimental study in evacuation processes for various condition are
considers as one of the research focuses covers in pedestrian dynamic field. However, it is not an easy task to study
the pedestrian evacuation processes which is considered as a complex model to many researchers due to the human
unique behaviours toward awareness of danger or panic cause by incidents. Therefore, it is hard to capture a normal
pedestrian flow during evacuation for study purposes. Furthermore, a real-world experiment on evacuation process is
nearly impossible. This fact motivated researchers to carry out their studies in this field using different modeling
methods in order to developed simulation systems for studying pedestrian behavior during evacuation process.
Recently, there are various literature reports found on modeling crowd movements that deal with disaster events.
Many researchers from variety of disciplines have been successfully used to study the problem on this area and
obtained fruitful results. Numerous models have been developed and applied in engineering and also building design
[1]. A few of these are the particle flow model [2-4], Social Force Model (SFM) [5-9] and Cellular automata (CA)
[10-19]. Furthermore, there are some researchers carry out the experiments in order to test these models validity
[3, 4, 15]. In summary, more complex human behaviors such as pedestrian interaction among themselves, building
and environments during evacuation are able to be imitated by nowadays developed models [16]. Some of these
human behavior shown are jamming transition [20], “faster-is-slower” effect [21], pedestrian counter-flow that
created lane formation [20, 22] and going along with crowd behavior [15, 16]. Indeed, researcher still shown their
particularly interested in CA model among many other simulation methods. This is because CA model is able to
model both collective and individual behaviors of pedestrian dynamics that can be observed experimentally using its
simple computation which instead described by other as complex models [10, 11, 13-16].
In numerous CA evacuation models, one of the main concerns is the pedestrian selection for exiting route.
Furthermore, the main factor that affecting pedestrian exit route selection were pedestrian density at the exit area
[16] that rarely state by early researchers. Thus, the mentioned problem will be studies in this work using simulation
and comparing it with the experiment. Additionally, majority of the past researches focuses on making a more
realistic model with pedestrians are moving in uni-direction and fixing the building as a single simplify rectangular
room [4, 13, 15, 23, 24].
Abstract: An existing dynamic cellular automaton (CA) model is modified for simulating the hallway area
evacuation experiment. In this proposed model, some basic parameters that plays and important role in
evacuation process such as human psychology and pedestrian density around exits are considered. From the
simulation and experimental results obtained, it shows that the modification provides a reasonable improvement
as pedestrian also tends to select exit route according to occupant density around the exits area besides
considering the spatial distance to exits. The studies on pedestrian density effects on speed during the evacuation
process are performed. Comparison for both the experiment and simulation results verifies that the proposed
model is able to effectively reproduce the experiment. The proposed CA model improvement is valuable for more
extensive application study and aid the architectural design to increase public safety. Hence, we conclude our
paper by presenting some of the application from the proposed model in conjunction to forecast the particular
adjustment to the hallway area that would improve the output of the model.
Keywords: Cellular automata; Evacuation; Simulation; Safety.

Scientific Review, 2015, 1(2): 36-44
37
In this paper, a hallway area is described and simulated using the proposed CA model. From the simulation and
experiment results shows that pedestrian density around exit area affects their exit route selection behavior and the
proposed model can effectively reproduced the experiment. In addition, the outlines of this paper can be described as
follows: the static floor field model for determine pedestrian pre-movement are briefly described in Section 2;
Section 3 introduced the proposed dynamic CA model with impatient degree; For Section 4, the discussion on the
results of simulations are provided. Finally, we conclude our finding in Section 5.
2. Preliminaries The model is described as a room represented by a bi-dimensional grid with the size of cell as 0.5 x 0.5 m
2, that
represent a single pedestrian typical space in a crowded situation. The mean speed of pedestrian is assigned as 1.0
m/s for normal situation as reported in [12, 13, 15, 16], which also represent a pedestrian is moving at 0.5 m per
time-step, t that yields 0.5 s.t
Fig-1. An 18 x 24 floor field with 40 pedestrians near the left side of exit A
Consider a room with fixed dimensions. Each cell is assigned with a value representing its weight value to the
exit with a principle such that pedestrian will always travel to a cell with a lower weight than their current cell. In
short, the floor-field is formed by a rectangular grid with weight for each exit is assigned as 1, while its neighboring
cells value are assigned based on the static-floor rules defined by [14] as follows:
If a cell is assigned a value M, adjacent cells in the vertical or horizontal directions are each assigned a value M
+ 1. For diagonal directions, a value of M + is assigned adjacent cells, where 1.5.
The repetitive weight assigning procedure is proceeding until all cells are evaluated. In addition, each wall in the
field is also considered for weighting assignment by giving a very high weight value to ensure pedestrians will never
occupy them. During the simulation, only the position of occupant is update for each time-step while the floor
weight remains the same.
For addition, we set some intelligent local rules as introduced in [11] to the propose model to produce a non-
deterministic model. The rules are as follows:
(1) Determine the weighted value of each cell based on the distance between the exits, the location of the walls, and
the distribution of occupants. The closer to exits, the lower the weight;
(2) Each occupant chooses one of the neighboring cells based on their weighting in the grid;
(3) If multiple occupants try to enter the same cell, they are assigned a random number and the occupant with the
highest value moves there.

Scientific Review, 2015, 1(2): 36-44
38
Fig-2. Values of the floor field in Fig. 1 computed based on static field rules
As been mentioned above, it is known that the floor-field weight of the cell are depends to the location of cell to
exits and obstacles. Since the obstacle parameter is constant, so the obtained floor-field for obstacle is independent to
time and it is set to be static (see Fig. 1). We require the floor-field to update itself with respect to time for crowd
distribution. Fig. 2 illustrated the obtained floor-field of Fig. 1 using the static-floor rules mentioned above. By
applying this floor-field, the simulations show that all pedestrians will move towards exit A and none of them
moving to exit B. In real scenario such situation is not acceptable. In the following section, the proposed floor-field
which considered pedestrians distribution is establish.
3. Description for Dynamic Cellular Automaton Model For the purposes of considering the pedestrians distribution during the evacuation process, we establish a
dynamic floor-field model. By assuming that there are y (l = 1,2,3,…, k,…, y) evacuation exit, then this model is able
to determine the floor-weight of cell x with respect to exit y in i-th step, ( ) ( )y
iW x . There are three variables
considered in this model are:
(i) ( ) ( )y
staticW x : The floor weight from x to y with respect to applied metric.
(ii) ( ) ( )y
iD x : The number of pedestrians who are nearer than x to y in i-th
step.
(iii) ( ) ( )y
iP x : The probability of pedestrian x selecting exit y as evacuation
route at i-th step.
Therefore, we defined the dynamic floor-field in mathematical as ( ) ( ) ( ) ( )( ) ( ) ( ) ( )y y y y
i static i iW x W x P x D x
(1)
where
( ) ( )
( )
( )
1( )
2
y y
i iy
i
y
x
DE
(2)
and
( ) ( ) ( )
( ) ( ) ( )
| is occupied by a person in -th step ,
( ) | ( ) ( ) and ,
( ) | ( ) ( ) and ,
i
y y y
i static static i
y y y
i static static i
Z m m i
x m W y W x y Z
x m W y W x y Z
( ) ( ) ( )
1 2( ) (1 ( )) ( )y y y
i i iP x n x P n x P
(3)

Scientific Review, 2015, 1(2): 36-44
39
with P1 is the probability to nearest exit, P2 is the probability of jamming phenomenon at exit area, ni is the
impatient degree of pedestrian x at i-th step and ( )yE is the width for exit y. Here, the
( ) ( )y
i x and ( )y
i denote
the number of element of ( ) ( )y
i x and ( )y
i respectively. The ( ) ( )y
staticW x correspond to any other proper metric
such as Euclidean, Manhattan or Dijkstra, but in this simulation, we use the metric introduced in Section 2 for
computation. Also, ( ) ( )y
in x is define as
( ) ( )( ) 0
( ) ( )
max 0
( ) ( )( )
( ) ( )
y yy i
i y y
v x v xn x
v x v x
(5)
with ( ) ( )y
iv x as the speed of pedestrian x at i-th step, ( )
0 ( )yv x is the initial speed of pedestrian x, and ( )
max
iv
represent the maximum free-flow speed for pedestrian x.
We included the defined impatient degree into this proposed model because there are some researches showing
that pedestrian psychology such as impatient behavior could affects their choice in selecting evacuation route [2, 8,
15]. When ( ) ( )y
in x approximate to 0, meaning that pedestrian i is in normal mode. However, when ( ) ( )y
in x
approximate to 1, this shows that pedestrian i is in extreme impatient mode and they are in rush to go out from the
system as fast as possible. The probability to nearest exit, P1 is defined as follow: ( )
1 ( )
max
( )1
( )
y
i
y
d xP
d x
(5)
where ( ) ( )y
id x is the distance from x to exit y at i-th time step, and ( )
max ( )yd x is the maximum distance measures
from all pedestrian that nearer than x to y. Eq. (5) shows that the shorter the distance of x to y, the higher the
probability to select exit y as evacuation route. Conversely, if the distance of x is longer, then the probability to select
exit y as evacuation route would become lower. The probability of the jamming phenomenon at exit area is defined
as follow: ( )
2
( )y
i
Total
i
N xP
N
(6)
where( ) ( )y
iN x correspond to the number of pedestrian that nearer than x to y at i-th time step, and Total
iN is the
total number of pedestrian still exist in the evacuation system at i-th time step.
Since the proposed model is dynamic, thus, it is possible to observe that some of the pedestrians selecting an
exit at first might change their choice to another exit after several time steps, regarding to their current situation. Fig.
3 shows the snapshot of simulation after 90 time steps for the dynamic behavior mentioned above. From the figure,
we observed that nine of the pedestrians moving towards exit B from exit A region.
Fig-3. Snapshot of simulation given in Fig. 2 after 90 time step (left) and 120 time step (right) using
proposed model. Nine of the pedestrians move towards exit B (lower right corner).
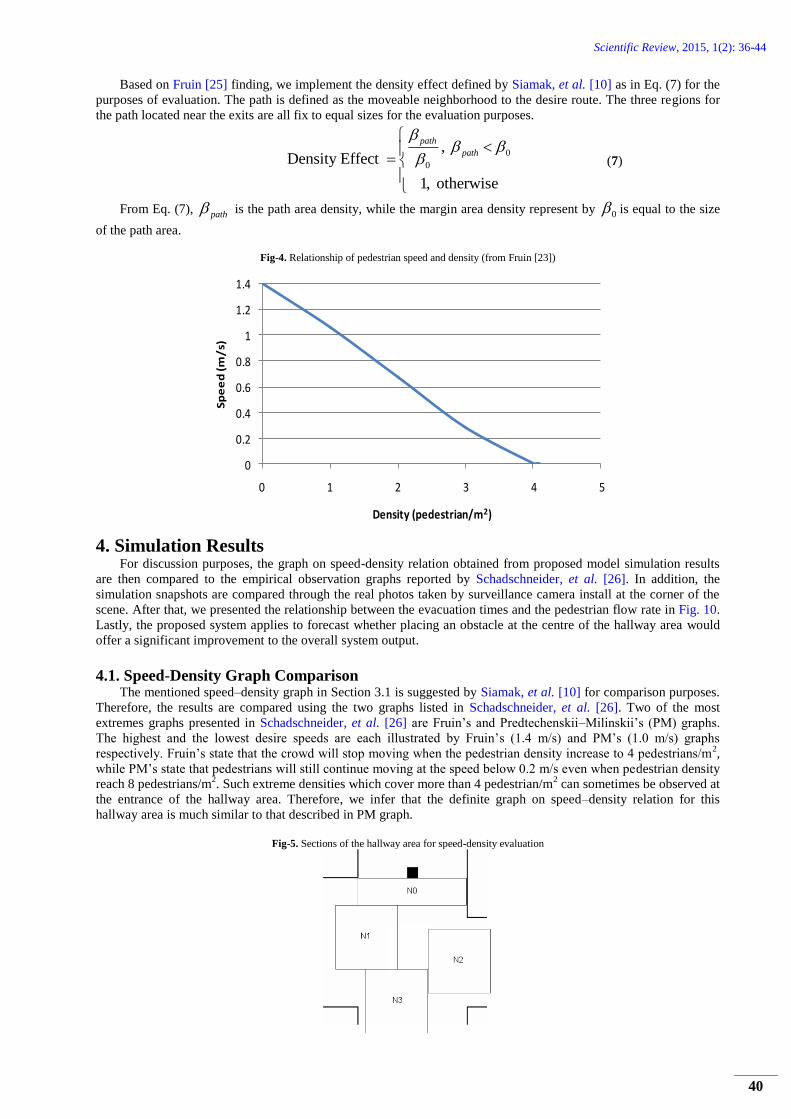
3.1. Pedestrian Density Effect on Speed The higher the density at an area, the more likely pedestrians to move slower compare to their free-flow desire
speed with the purpose to reduce the probability of a collision and injury. In the proposed model, pedestrians are
moving at maximum speed in the hallway area but the speed is reduces when there are obstacle or other pedestrians
around their neighborhood. Fruin [25] has studied the effect of density on speed and proposed that as the pedestrian
density increases, the speed of movements swiftly drops correspondingly. Fig. 4 shows a graph by Fruin [25], which
recommended that the movement speed reaches approximate to zero when the density approaches 4 pedestrians/m2.
Scientific Review, 2015, 1(2): 36-44
40
Based on Fruin [25] finding, we implement the density effect defined by Siamak, et al. [10] as in Eq. (7) for the
purposes of evaluation. The path is defined as the moveable neighborhood to the desire route. The three regions for
the path located near the exits are all fix to equal sizes for the evaluation purposes.
0
0
, Density Effect
1, otherwise
path
path
(7)
From Eq. (7), path is the path area density, while the margin area density represent by 0 is equal to the size
of the path area.
Fig-4. Relationship of pedestrian speed and density (from Fruin [23])
0
0.2
0.4
0.6
0.8
1
1.2
1.4
0 1 2 3 4 5
Sp
ee
d (
m/
s)
Density (pedestrian/m2)
4. Simulation Results For discussion purposes, the graph on speed-density relation obtained from proposed model simulation results
are then compared to the empirical observation graphs reported by Schadschneider, et al. [26]. In addition, the
simulation snapshots are compared through the real photos taken by surveillance camera install at the corner of the
scene. After that, we presented the relationship between the evacuation times and the pedestrian flow rate in Fig. 10.
Lastly, the proposed system applies to forecast whether placing an obstacle at the centre of the hallway area would
offer a significant improvement to the overall system output.
4.1. Speed-Density Graph Comparison The mentioned speed–density graph in Section 3.1 is suggested by Siamak, et al. [10] for comparison purposes.
Therefore, the results are compared using the two graphs listed in Schadschneider, et al. [26]. Two of the most
extremes graphs presented in Schadschneider, et al. [26] are Fruin’s and Predtechenskii–Milinskii’s (PM) graphs.
The highest and the lowest desire speeds are each illustrated by Fruin’s (1.4 m/s) and PM’s (1.0 m/s) graphs
respectively. Fruin’s state that the crowd will stop moving when the pedestrian density increase to 4 pedestrians/m2,
while PM’s state that pedestrians will still continue moving at the speed below 0.2 m/s even when pedestrian density
reach 8 pedestrians/m2. Such extreme densities which cover more than 4 pedestrian/m
2 can sometimes be observed at
the entrance of the hallway area. Therefore, we infer that the definite graph on speed–density relation for this
hallway area is much similar to that described in PM graph.
Fig-5. Sections of the hallway area for speed-density evaluation
Scientific Review, 2015, 1(2): 36-44
41
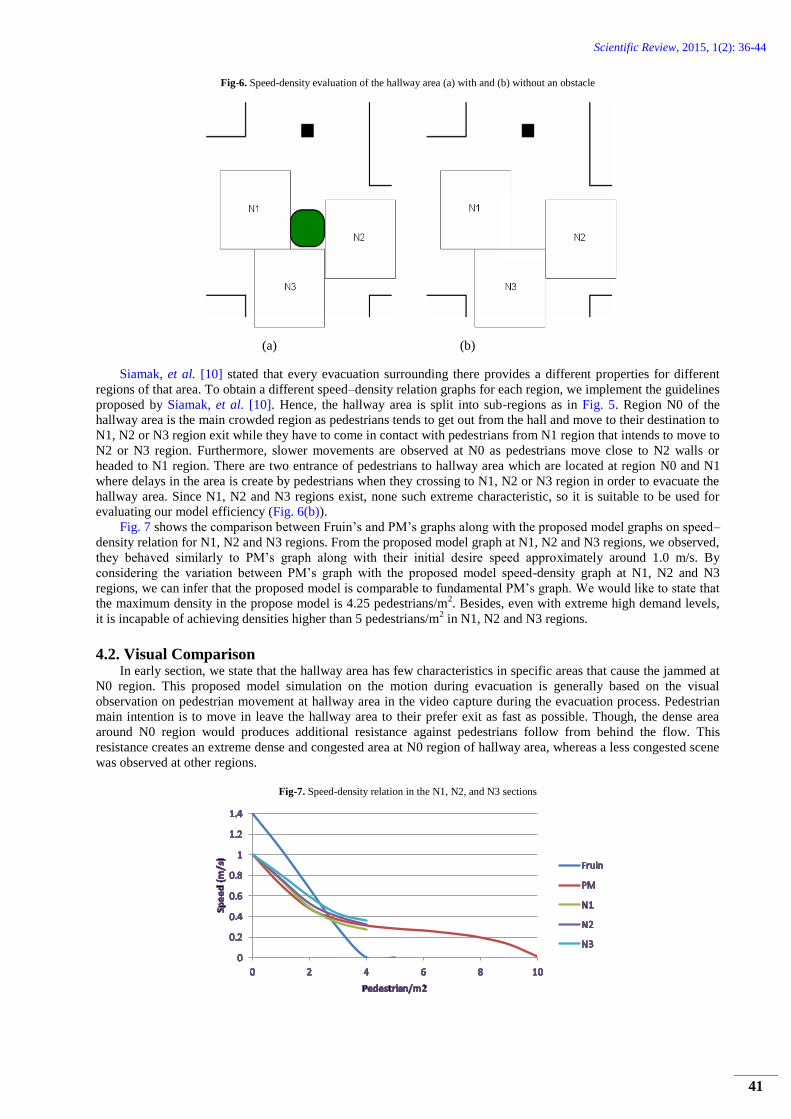
Fig-6. Speed-density evaluation of the hallway area (a) with and (b) without an obstacle
(a) (b)
Siamak, et al. [10] stated that every evacuation surrounding there provides a different properties for different
regions of that area. To obtain a different speed–density relation graphs for each region, we implement the guidelines
proposed by Siamak, et al. [10]. Hence, the hallway area is split into sub-regions as in Fig. 5. Region N0 of the
hallway area is the main crowded region as pedestrians tends to get out from the hall and move to their destination to
N1, N2 or N3 region exit while they have to come in contact with pedestrians from N1 region that intends to move to
N2 or N3 region. Furthermore, slower movements are observed at N0 as pedestrians move close to N2 walls or
headed to N1 region. There are two entrance of pedestrians to hallway area which are located at region N0 and N1
where delays in the area is create by pedestrians when they crossing to N1, N2 or N3 region in order to evacuate the
hallway area. Since N1, N2 and N3 regions exist, none such extreme characteristic, so it is suitable to be used for
evaluating our model efficiency (Fig. 6(b)).
Fig. 7 shows the comparison between Fruin’s and PM’s graphs along with the proposed model graphs on speed–
density relation for N1, N2 and N3 regions. From the proposed model graph at N1, N2 and N3 regions, we observed,
they behaved similarly to PM’s graph along with their initial desire speed approximately around 1.0 m/s. By
considering the variation between PM’s graph with the proposed model speed-density graph at N1, N2 and N3
regions, we can infer that the proposed model is comparable to fundamental PM’s graph. We would like to state that
the maximum density in the propose model is 4.25 pedestrians/m2. Besides, even with extreme high demand levels,
it is incapable of achieving densities higher than 5 pedestrians/m2 in N1, N2 and N3 regions.
4.2. Visual Comparison In early section, we state that the hallway area has few characteristics in specific areas that cause the jammed at
N0 region. This proposed model simulation on the motion during evacuation is generally based on the visual
observation on pedestrian movement at hallway area in the video capture during the evacuation process. Pedestrian
main intention is to move in leave the hallway area to their prefer exit as fast as possible. Though, the dense area
around N0 region would produces additional resistance against pedestrians follow from behind the flow. This
resistance creates an extreme dense and congested area at N0 region of hallway area, whereas a less congested scene
was observed at other regions.
Fig-7. Speed-density relation in the N1, N2, and N3 sections

Scientific Review, 2015, 1(2): 36-44
42
Some snapshots of simulation at low, medium and very high flow rate are shows in Fig. 8, and also available is
the actual scene from surveillance photo that shows the flow of pedestrians during the evacuation. From the
observation, it seems that the congested scene at east side and west side of N0 are reproduced using the proposed
model simulation.
4.3. Evacuation Times and Flow Rates The resulting slower motion is observed in simulation are due to the huge number of pedestrians that build up in
the hallway area. We run the simulation for 5 different flow rates, which are: 25, 75, 175, 225 and 275 pedestrians
per minute. Each of these levels correspond to low, medium, high, very high and extremely high flow rates (see Fig.
10). Fig. 9 shows the results of the mention simulations. From the simulations, decrement in average evacuation time
along with the increase of flow rate is observed.
Fig-8. Simulation snapshots of (a) medium, (b) high, and (c) very high pedestrian flow rates.
Surveillance photographs of real scenes (d–f)
Additionally, we also found out that there was a significant decrease in evacuation time before the flow rates
reach over 75 pedestrians per minute (see Fig. 10). The approximate flow rate that causes such significant decrease is
around 50 pedestrians per minute from the results finding. Simulation results also showed that pedestrian jamming
quickly build up at the area of N0 once the flow rate reach over 75 pedestrians per minute. At such stage of flow
rate, we observed that the jamming starting to extend to Region N1 and N2 which cause delays in evacuation time.
Such extreme jamming levels could develop into a hazardous situation as pedestrians tend to push each other during
this time due to influence of psychological factor i.e. impatient mood or panic.
The propose model shows that the average speeds and the evacuation times in the simulation matches the range
of speeds and duration in actual scene data. Thus, in near future, it is suggested to acquire more data in order to
perform an accurately calibrate with the simulation parameters in such event of pedestrian simulation.
Fig-9. Evacuation time for different pedestrian flow rates
Scientific Review, 2015, 1(2): 36-44
43
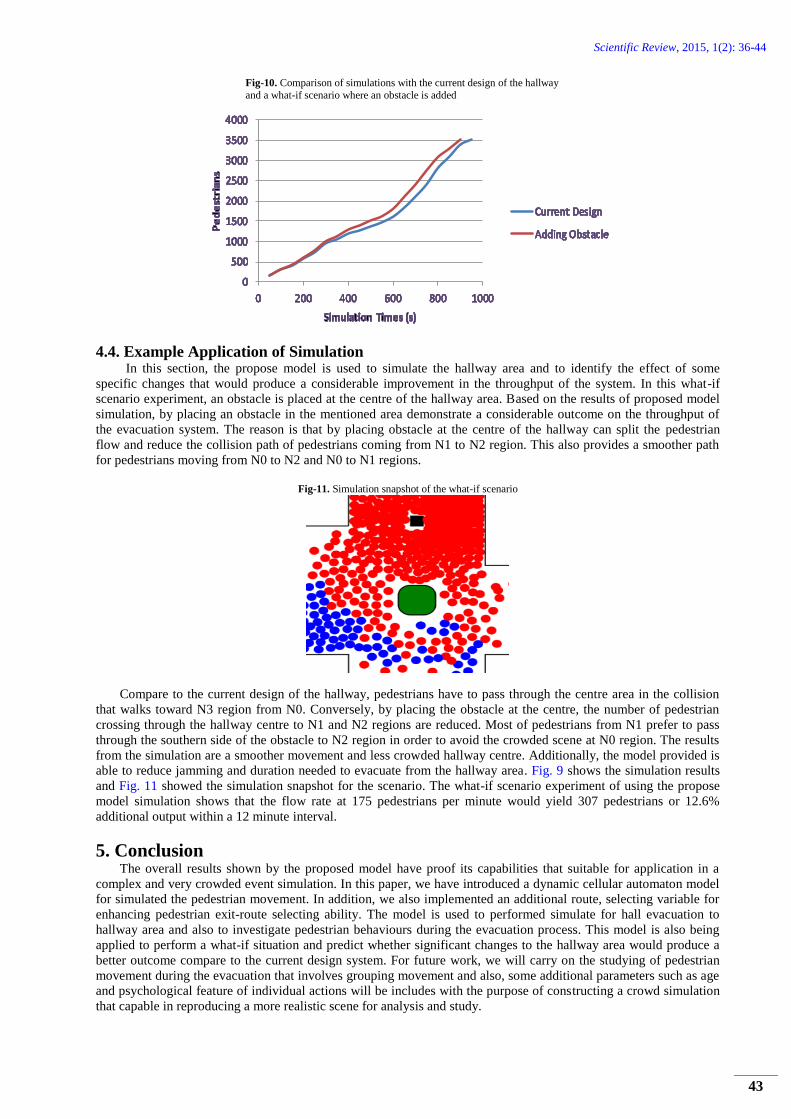
Fig-10. Comparison of simulations with the current design of the hallway
and a what-if scenario where an obstacle is added
4.4. Example Application of Simulation In this section, the propose model is used to simulate the hallway area and to identify the effect of some
specific changes that would produce a considerable improvement in the throughput of the system. In this what-if
scenario experiment, an obstacle is placed at the centre of the hallway area. Based on the results of proposed model
simulation, by placing an obstacle in the mentioned area demonstrate a considerable outcome on the throughput of
the evacuation system. The reason is that by placing obstacle at the centre of the hallway can split the pedestrian
flow and reduce the collision path of pedestrians coming from N1 to N2 region. This also provides a smoother path
for pedestrians moving from N0 to N2 and N0 to N1 regions.
Fig-11. Simulation snapshot of the what-if scenario
Compare to the current design of the hallway, pedestrians have to pass through the centre area in the collision
that walks toward N3 region from N0. Conversely, by placing the obstacle at the centre, the number of pedestrian
crossing through the hallway centre to N1 and N2 regions are reduced. Most of pedestrians from N1 prefer to pass
through the southern side of the obstacle to N2 region in order to avoid the crowded scene at N0 region. The results
from the simulation are a smoother movement and less crowded hallway centre. Additionally, the model provided is
able to reduce jamming and duration needed to evacuate from the hallway area. Fig. 9 shows the simulation results
and Fig. 11 showed the simulation snapshot for the scenario. The what-if scenario experiment of using the propose
model simulation shows that the flow rate at 175 pedestrians per minute would yield 307 pedestrians or 12.6%
additional output within a 12 minute interval.
5. Conclusion The overall results shown by the proposed model have proof its capabilities that suitable for application in a
complex and very crowded event simulation. In this paper, we have introduced a dynamic cellular automaton model
for simulated the pedestrian movement. In addition, we also implemented an additional route, selecting variable for
enhancing pedestrian exit-route selecting ability. The model is used to performed simulate for hall evacuation to
hallway area and also to investigate pedestrian behaviours during the evacuation process. This model is also being
applied to perform a what-if situation and predict whether significant changes to the hallway area would produce a
better outcome compare to the current design system. For future work, we will carry on the studying of pedestrian
movement during the evacuation that involves grouping movement and also, some additional parameters such as age
and psychological feature of individual actions will be includes with the purpose of constructing a crowd simulation
that capable in reproducing a more realistic scene for analysis and study.

Scientific Review, 2015, 1(2): 36-44
44
References [1] Olenick, S. M. and Carpenter, D. J., 2003. "An updated international survey of computer models for fire
and smoke." Journal of Fire Protection Engineering, vol. 13, pp. 87-110.
[2] Helbing, D., 1992. "A fluid-dynamic model for the movement of pedestrians." Complex Systems, vol. 6, pp.
391-415.
[3] Helbing, D., Isobe, M., Nagatani, T., and Takimoto, K., 2003. "Lattice gas simulation of experimentally
studied evacuation dynamics." Physical Review, vol. 67, pp. 067-101.
[4] Sakai, S., Nishinari, K., and Lida, S., 2006. "A new Stochastic cellular automaton model on traffic flow and
its jamming phase transition." Journal of Physics A: Mathematical and General, vol. 39, pp. 15327-15339.
[5] Helbing, D., Farakas, I., and Vicsek, T., 2000. "Simulating dynamical features of escape panic." Nature,
vol. 407, pp. 487-490.
[6] Helbing, D. and Molnar, P., 1995. "A social force model for pedestrian dynamics." Physical Review E, vol.
51, pp. 4282-4286.
[7] Helbing, D., Molnar, P., and Farkas, J., 2001. "Self-organizing pedestrian movement." Environment and
Planning B: Planning and Design, vol. 28, pp. 361-383.
[8] Okazaki, S. and Matsushita, S., 1993. "A study of simulation model for pedestrian movement with
evacuation and queuing," In Proceedings of International Conference on Engineering for Crowd Safety, pp.
271-280.
[9] Teknomo, K., Takeyama, Y., and Inamura, H., 2001. "Microscopic pedestrian simulation model to evaluate
lane-like segregation of pedestrian crossing," In Proceeding of Infrastructure Planning Conference, Japan,
pp. 208-218.
[10] Siamak, S., Fazilah, H., and Abdullah, Z. T., 2001. "A cellular automata model for circular movements of
pedestrians during Tawaf." Simulation Modeling Practice and Theory, vol. 19 pp. 969-985.
[11] Alizadeh, R., 2011. "A dynamic cellular automaton model for evacuation process with obstacles." Safety
Science, vol. 49, pp. 315-323.
[12] Kirchner, A., Klupfel, H., Nishinari, K., Schadschneider, A., and Schreckenberg, M., 2004. "Discretization
effects and the influence of walking speed in cellular automata models for pedestrian dynamics." Journal of
Statistical Mechanics, vol. 10, pp. 10011-10032.
[13] Burstedde, C., Klauck, K., Schadschneider, A., and Zittartz, J., 2001. "Simulation of pedestrian dynamics
using a two-dimensional cellular automaton." Physica A, vol. 295, pp. 507-525.
[14] Varas, A., Cornejo, M. D., Mainemer, D., Toledo, B., Rogan, J., Munoz, V., and Valdivia, J. A., 2007.
"Cellular automaton model for evacuation process with obstacles." Physica A, vol. 382, pp. 631-642.
[15] Fang, Z. M., Song, W. G., Zhang, J., and Wu, H., 2010. "Experiment and modelling of exit-selecting
behavior during a building evacuation." Physica A, vol. 389 pp. 815-824.
[16] Liu, S. B., Yang, L. Z., Fang, T. Y., and Li, J., 2009. "Evacuation from a classroom considering the
occupant density around exits." Physica A, vol. 388, pp. 1921-1928.
[17] Kunwar, B., Simini, F., and Johansson, A., 2014. "Large scale pedestrian evacuation modeling framework
using volunteered geographical information." Transportation Research Procedia, vol. 2, pp. 813-818.
[18] Wagoum, A. U. K., Steffen, B., Seyfried, A., and Chraini, M., 2013. "Parallel Real Time Computation of
Large Scale Pedestrian Evacuation." Advances in Engineering Software, vol. 60, pp. 98-103.
[19] Park, K., Ham, S., and Ha, S., 2015. "Validation of advanced evacuation analysis on passenger ships using
experimental scenario and data of full-scale evacuation." Computers in Industry, vol. 71, pp. 103-115.
[20] Tajima, Y., Takimoto, K., and Nagatani, T., 2002. "Pattern formation and jamming transition in pedestrian
counter-flow." Physica A, vol. 313, pp. 709-723.
[21] Helbing, D., Farkas, J., and Vicsek, T., 2000. "Freezing by heating in a driven mesoscopic system."
Physical Review Letters, vol. 84, pp. 12-40.
[22] Isobe, M., Adachi, T., and Nagatani, T., 2004. "Experiment and simulation of pedestrian counter flow."
Physica A, vol. 336, pp. 638-650.
[23] Frank, G. A. and Dorso, C. O., 2011. "Room evacuation in the presence of an obstacle." Physica A, vol.
390, pp. 2135-2145.
[24] Kirchner, A., Nishinari, K., and Schadschneider, A., 2003. "Friction effects and clogging in a cellular
automaton model for pedestrian dynamics." Physical Review E, vol. 67, pp. 056-122.
[25] Fruin, J. J., 1971. Pedestrian planning and design. New York, USA: Metropolitan Association of Urban
Designers and Environmental Planners
[26] Schadschneider, A., Klingsch, W., and Klupfel, H., 2008. Modeling and applications. Berlin: Springer