a drosophila protein-interaction map centered on cell-cycle regulators
TRANSCRIPT
com
ment
reviews
reports
deposited research
refereed researchinteractio
nsinfo
rmatio
n
Open Access2004Stanyonet al.Volume 5, Issue 12, Article R96ResearchA Drosophila protein-interaction map centered on cell-cycle regulatorsClement A Stanyon*, Guozhen Liu*, Bernardo A Mangiola*, Nishi Patel*, Loic Giot†, Bing Kuang†, Huamei Zhang*, Jinhui Zhong* and Russell L Finley Jr*‡
Addresses: *Center for Molecular Medicine & Genetics, Wayne State University School of Medicine, 540 E. Canfield Avenue, Detroit, MI 48201, USA. †CuraGen Corporation, 555 Long Warf Drive, New Haven, CT 06511, USA. ‡Department of Biochemistry and Molecular Biology, Wayne State University School of Medicine, 540 E. Canfield Avenue, Detroit, MI 48201, USA.
Correspondence: Russell L Finley. E-mail: [email protected]
© 2004 Stanyon et al. licensee BioMed Central Ltd. This is an Open Access article distributed under the terms of the Creative Commons Attribution License (http://creativecommons.org/licenses/by/2.0), which permits unrestricted use, distribution, and reproduction in any medium, provided the original work is properly cited.A Drosophila protein-interaction map centered on cell-cycle regulators<p>A <it>Drosophila </it>protein-protein interaction map was constructed using the LexA system, complementing a previous map using the GAL4 system and adding many new interactions.</p>
Abstract
Background: Maps depicting binary interactions between proteins can be powerful starting pointsfor understanding biological systems. A proven technology for generating such maps is high-throughput yeast two-hybrid screening. In the most extensive screen to date, a Gal4-based two-hybrid system was used recently to detect over 20,000 interactions among Drosophila proteins.Although these data are a valuable resource for insights into protein networks, they cover only afraction of the expected number of interactions.
Results: To complement the Gal4-based interaction data, we used the same set of Drosophila openreading frames to construct arrays for a LexA-based two-hybrid system. We screened the arraysusing a novel pooled mating approach, initially focusing on proteins related to cell-cycle regulators.We detected 1,814 reproducible interactions among 488 proteins. The map includes a largenumber of novel interactions with potential biological significance. Informative regions of the mapcould be highlighted by searching for paralogous interactions and by clustering proteins on the basisof their interaction profiles. Surprisingly, only 28 interactions were found in common between theLexA- and Gal4-based screens, even though they had similar rates of true positives.
Conclusions: The substantial number of new interactions discovered here supports theconclusion that previous interaction mapping studies were far from complete and that many moreinteractions remain to be found. Our results indicate that different two-hybrid systems andscreening approaches applied to the same proteome can generate more comprehensive datasetswith more cross-validated interactions. The cell-cycle map provides a guide for further definingimportant regulatory networks in Drosophila and other organisms.
Published: 26 November 2004
Genome Biology 2004, 5:R96
Received: 26 July 2004Revised: 27 October 2004Accepted: 1 November 2004
The electronic version of this article is the complete one and can be found online at http://genomebiology.com/2004/5/12/R96
Genome Biology 2004, 5:R96

R96.2 Genome Biology 2004, Volume 5, Issue 12, Article R96 Stanyon et al. http://genomebiology.com/2004/5/12/R96
BackgroundProtein-protein interactions have an essential role in a widevariety of biological processes. A wealth of data has emergedto show that most proteins function within networks of inter-acting proteins, and that many of these networks have beenconserved throughout evolution. Although some of these net-works constitute stable multi-protein complexes while othersare more dynamic, they are all built from specific binaryinteractions between individual proteins. Maps depicting thepossible binary interactions among proteins can thereforeprovide clues not only about the functions of individual pro-teins but also about the structure and function of entire pro-tein networks and biological systems.
One of the most powerful technologies used in recent yearsfor mapping binary protein interactions is the yeast two-hybrid system [1]. In a yeast two-hybrid assay, the two pro-teins to be tested for interaction are expressed with amino-terminal fusion moieties in the yeast Saccharomyces cerevi-siae. One protein is fused to a DNA-binding domain (BD) andthe other is fused to a transcription activation domain (AD).An interaction between the two proteins results in activationof reporter genes that have upstream binding sites for the BD.To map interactions among large sets of proteins, the BD andAD expression vectors are placed initially into different hap-loid yeast strains of opposite mating types. Pairs of BD andAD fused proteins can then be tested for interaction by mat-ing the appropriate pair of yeast strains and assaying reporteractivity in the resulting diploid cells [2]. Large arrays of ADand BD strains representing, for example, most of the pro-teins encoded by a genome, have been constructed and usedto systematically detect binary interactions [3-6]. Most large-scale screens have used such arrays in a library-screeningapproach in which the BD strains are individually mated witha library containing all of the AD strains pooled together.After plating the diploids from each mating onto medium thatselects for expression of the reporters, the specific interactingAD-fused proteins are determined by obtaining a sequencetag from the AD vector in each colony.
High-throughput two-hybrid screens have been used to mapinteractions among proteins from bacteria, viruses, yeast, andmost recently, Caenorhabditis elegans and Drosophila mela-nogaster [4-10]. Analyses of the interaction maps generatedfrom these screens have shown that they are useful for pre-dicting protein function and for elaborating biological path-ways, but the analyses have also revealed severalshortcomings in the data [11-13]. One problem is that theinteraction maps include many false positives - interactionsthat do not occur in vivo. Unfortunately, this is a commonfeature of all high-throughput methods for generating inter-action data, including affinity purification of protein com-plexes and computational methods to predict proteininteractions [11-14]. A solution to this problem has been sug-gested by several studies that have shown that the interac-tions detected by two or more different high-throughput
methods are significantly enriched for true positives relativeto those detected by only one approach [11-13]. Thus it hasbecome clear that the most useful protein-interaction mapswill be those derived from combinations of cross-validatingdatasets.
A second shortcoming of the large-scale screens has been thehigh rate of false negatives, or missed interactions. This is evi-dent from comparing the high-throughput data with refer-ence data collected from published low-throughout studies.Such comparisons with two-hybrid maps from yeast [13] andC. elegans [5], for example, have shown that the high-throughput data rarely covers more than 13% of the referencedata, implying that only about 13% of all interactions arebeing detected. The finding that different large datasets showvery little overlap, despite having similar rates of true posi-tives, supports the conclusion that high-throughput screensare far from saturating [10,12]. For example, three separatescreening strategies were used to detect hundreds of interac-tions among the approximately 6,000 yeast proteins, and yetonly six interactions were found in all three screens [10].These results suggest that many more interactions might bedetected simply by performing additional screening, or byapplying different screening strategies to the same proteins.In addition, anecdotal evidence has suggested that the use oftwo-hybrid systems based on different fusion moieties maybroaden the types of protein interactions that can be detected.In one study, for example, screens performed using the sameproteins fused to either the LexA BD or the Gal4 BD producedonly partially overlapping results, and each system detectedbiologically significant interactions missed by the other [15].Thus, the application of different two-hybrid systems and dif-ferent screening strategies to a proteome would be expectedto provide more comprehensive datasets than would any sin-gle screen.
We set out to map interactions among the approximately14,000 predicted Drosophila proteins by using two differentyeast two-hybrid systems (LexA- and Gal4-based) and differ-ent screening strategies. Results from the screens using theGal4 system have already been published [6]. In that study,Giot et al. successfully amplified 12,278 Drosophila openreading frames (ORFs) and subcloned a majority of them intothe Gal4 BD and Gal4 AD expression vectors by recombina-tion in yeast. They screened the arrays using a library-screen-ing approach and detected 20,405 interactions involving7,048 proteins. To extend these results we subcloned thesame amplified Drosophila ORFs into vectors for use in theLexA-based two-hybrid system, and constructed arrays of BDand AD yeast strains for high-throughput screening. Ourexpectation was that maps generated with these arrays wouldinclude interactions missed in previous screens, and wouldalso partially overlap the Gal4 map, providing opportunitiesfor cross-validation.
Genome Biology 2004, 5:R96

http://genomebiology.com/2004/5/12/R96 Genome Biology 2004, Volume 5, Issue 12, Article R96 Stanyon et al. R96.3
com
ment
reviews
reports
refereed researchdepo
sited researchinteractio
nsinfo
rmatio
n
Initially, we screened for interactions involving proteins thatare primarily known or suspected to be cell-cycle regulators.We chose cell-cycle proteins as a starting point for our inter-action map because cell-cycle regulatory systems are knownto be highly conserved in eukaryotes, and because previousresults have suggested that the cell-cycle regulatory networkis centrally located within larger cellular networks [16]. Thisis most evident from examination of the large interactionmaps that have been generated for yeast proteins using yeasttwo-hybrid and other methods. Within these maps there aremore interactions between proteins that are annotated withthe same function (for example, 'Pol II transcription', 'cellpolarity', 'cell-cycle control') than between proteins with dif-ferent functions, as expected for a map depicting actual func-tional connections between proteins. Interestingly, however,certain functional groups have more inter-function interac-tions than others. Proteins annotated as 'cell-cycle control', inparticular, were frequently connected to proteins from a widerange of other functional groups, suggesting that the processof cell-cycle control is integrated with many other cellularprocesses [16]. Thus, we set out to further elaborate the cell-cycle regulatory network by identifying new proteins that maybelong to it, and new connections to other cellular networks.
ResultsConstruction of an extensive protein interaction map centered on cell-cycle regulators by high-throughput two-hybrid screeningWe used the same set of 12,278 amplified Drosophila full-length ORFs from the Gal4 project [6] to generate yeastarrays for use in a modified LexA-based two-hybrid system(see Materials and methods). In the LexA system the BD isLexA and the AD is B42, an 89-amino-acid domain fromEscherichia coli that fortuitously activates transcription inyeast [17]. In the version that we used, both fusion moietiesare expressed from promoters that are repressed in glucose sothat their expression can be repressed during constructionand amplification of the arrays [18]. Previous results haveshown that this prevents the loss of genes encoding proteinsthat are toxic to yeast, and that interactions involving suchproteins can be detected by inducing their expression only onthe final indicator media [18,19]. The ORFs were subclonedinto the two vectors by recombination in yeast as previouslydescribed [3,6], and the yeast transformants were arrayed ina 96-well format. The resulting BD and AD arrays each haveapproximately 12,000 yeast strains, over 85% of which have afull-length Drosophila ORF insert (see Materials and meth-ods). For all strains involved in an interaction reported here,the plasmid was isolated and the insert was sequenced to ver-ify the identity of the ORF.
As a first step toward generating a LexA-based protein-inter-action map, we chose 152 BD-fused proteins that were eitherknown or homologous to regulators of the cell cycle or DNAdamage repair (see Additional data file 2). We used all 152
proteins as 'baits' to screen the 12,000-member AD array. Weused a pooled mating approach [19] in which individual BDbait strains are first mated with pools of 96 AD strains. Forpools that are positive with a particular BD, the correspond-ing 96 AD strains are then mated with that BD in an array for-mat to identify the particular interacting AD protein(s). Wehad previously shown that this approach is very sensitive andallows detection of interactions involving proteins that aretoxic to yeast or BD fused proteins that activate transcriptionon their own [19]. Moreover, the final assay in this approachis a highly reproducible one-on-one assay between an AD anda BD strain, in which the reporter gene activities are recordedto provide a semi-quantitative measure of the interaction.Using this approach we detected 1,641 reproducible interac-tions involving 93 of the bait proteins. We also performedlibrary screening [6] with a subset of the 152 baits that did notactivate the reporter genes on their own. This resulted in thedetection of 173 additional interactions with 57 bait proteins.Thirty-nine interactions were found by both approaches, andthese involved 21 of the 44 BD genes active in bothapproaches. There were 95 BD genes for which interactiondata was obtained by the pooled mating approach, and 59active BD genes in the library screening approach. The aver-age number of interactions was 18 per BD gene in the pooledmating data, while the library screening data had an averageof only four interactions per active BD gene. The average levelof reporter activation for the 39 interactions that weredetected in both screens was significantly higher than theaverage of all interactions (see Additional data file 3), sug-gesting that the weaker interactions are more likely to bemissed by one screen or another, even though they are repro-ducible once detected.
Altogether we detected interactions with 106 of the 152 baits,which resulted in a protein-interaction map with 1,814 uniqueinteractions among the products of 488 genes (see Additionaldata file 3). The map includes interactions that were alreadyknown or that could be predicted from known orthologous orparalogous interactions (see below). The map also includes alarge number of novel interactions, including many involvingfunctionally unclassified proteins.
Evaluation of the LexA-based protein interaction mapAs is common with data derived from high-throughputscreens, the number of novel interactions detected was large,making direct in vivo experimental verification impractica-ble. Thus, we set out to assess the quality of the data by exam-ining the topology of the interaction map, by looking forenrichment of genes with certain functions, and by compar-ing the LexA map with other datasets. First we examined thetopology of the interaction map, because recent studies haveshown that cellular protein networks have certain topologicalfeatures that correlate with biological function [20]. In ourinteraction map, the number of interactions per protein (k)varies over a broad range (from 1 to 84) and the distributionof proteins with k interactions follows a power law, similar to
Genome Biology 2004, 5:R96

R96.4 Genome Biology 2004, Volume 5, Issue 12, Article R96 Stanyon et al. http://genomebiology.com/2004/5/12/R96
previously described protein networks [6,21]. Most (98%) ofthe proteins in the map are linked together into a single net-work component by direct or indirect interactions (Figure 1a).The network has a small-world topology [22], characterized
by a relatively short average distance between any two pro-teins (Table 1) and highly interconnected clusters of proteins.Removal of the most highly connected proteins from the mapdoes not significantly fragment the network, indicating that
A protein interaction map centered on cell cycle regulatorsFigure 1A protein interaction map centered on cell cycle regulators. (a) The entire map includes 1,814 unique interactions (lines) among the proteins encoded by 488 genes (circles). The map has five distinct networks; one network contains 479 (98%) of the proteins, one has three proteins, and three have two proteins (upper right, green circles). (b) The interconnectedness of the map does not depend strongly on the proteins with the most interactions. The map shown comprises data filtered to remove proteins with more than 30 interactions (k > 30), leaving 792 interactions among 343 proteins. This produced only one additional network, which has two proteins (green circles on the left of (b)); 97% of the proteins still belong to a single large network. Further deletion of proteins with k > 20 removes an additional 469 interactions, which creates only four additional small networks and leaves 85% of the proteins in a single network (data not shown). A high-resolution version of this figure with live links to gene information can be drawn using a program available at [47].
Table 1
Comparison of Drosophila protein-interaction maps generated by high-throughput yeast two-hybrid methods
LexA cell-cycle map* Gal4 proteome-wide map† Common
Interactions 1,814 20,439 28
Proteins 488 6,951 347
Proteins as BD fusions 106 3,616 46
Proteins as AD fusions 403 5,425 250
Proteins as AD and BD 21 2,090 8
Degree exponent‡ 1.72 1.91 NA
Mean path length§ 3.3 4.1 NA
*The LexA interactions are from this study, listed in Additional data file 3. †The Gal4 interactions are from Giot et al. [6]. The chance of observing more than two common interactions between the Gal4 map and a random network with the same topological properties as the LexA map is < 10-6
(see Materials and methods). ‡The degree exponent and mean path length are topological properties of the networks. The degree exponent is γ in the equation P(k) = k-γ, where k is the degree or number of interactions per protein, and P(k) is the distribution of proteins with k interactions. §The mean path length is the shortest number of links between a pair of proteins, averaged over all pairs in the network.
Genome Biology 2004, 5:R96

http://genomebiology.com/2004/5/12/R96 Genome Biology 2004, Volume 5, Issue 12, Article R96 Stanyon et al. R96.5
com
ment
reviews
reports
refereed researchdepo
sited researchinteractio
nsinfo
rmatio
n
the interconnectivity is not simply due to the most promiscu-ously interacting proteins (Figure 1b). In other interactionmaps generated with randomly selected baits, proteins withrelated functions tend to be clustered into regions that aremore highly interconnected than is typical for the map as awhole [5,6,16]. Moreover, interactions within more highlyinterconnected regions of a protein-interaction map tend tobe enriched for true positives [6,23-25]. Thus, the overalltopology of the interaction map that we generated is consist-ent with that of other protein networks, and in particular,with the expectation for a network enriched for functionallyrelated proteins.
Next we assessed the list of proteins in the interaction map tolook for enrichment of proteins or pairs of proteins with par-ticular functions. An interaction map with a high rate of bio-logically relevant interactions should have a high frequency ofinteractions between pairs of proteins previously thought tobe involved in the same biological process. Among the 488proteins in the map, 153 have been annotated with a putativebiological function using the Gene Ontology (GO)classification system [26,27]. Because we used a set of BDfusions enriched for cell-cycle and DNA metabolic functions,we expected to see similar enrichments in the list of interact-ing AD fusions, as well as more interactions between geneswith these functions. Both of these expectations are borneout. In the list of BD genes, both cell-cycle and DNA metabo-lism functions are enriched approximately 17-fold compared
to similarly sized lists of randomly selected proteins (P <0.00002). In the AD list, these two functions are enrichedfour- and threefold, respectively (Table 2). The frequencywith which interactions occur between pairs of proteins anno-tated for DNA metabolism is five times more than expected bychance; similarly, cell-cycle genes interact with each other sixtimes more frequently than expected (P < 0.001). Thus, theenrichment for proteins and pairs of interacting proteinsannotated with the same function suggests that many of thenovel interactions will be biologically significant. It also sug-gests that the map will be useful for predicting the functionsof novel proteins on the basis of their connections with pro-teins having known functions, as described for other interac-tion maps [16,28].
Comparison of the Drosophila protein-interaction mapsDirect comparison of the LexA cell-cycle map with the Gal4data revealed that only 28 interactions were found in com-mon between the two screens (Table 1). Moreover, more thana quarter of the proteins in the LexA map were absent fromthe Gal4 proteome-wide map. Among the 106 baits that hadinteractions in the LexA map, for example, 60 failed to yieldinteractions in the Gal4 proteome-wide map, even though allbut six of these were successfully cloned in the Gal4 arrays [6](see Additional data file 6). Similarly, 46 of the 152 LexA baitsthat we used failed to yield interactions from our work, yet 14of these had interactions in the Gal4 map. Thus, the lack of
Table 2
Enrichment of the most frequently classified gene functions
Description BD genes AD Genes Same-pair interactions
Exp Rand P Ratio Exp Rand P Ratio Exp Rand P Ratio
Protein modification 30 2.92 <0.00002 10.3 21 11.12 0.00210 1.9 25 14.86 0.09916 1.7
Cell cycle 22 1.27 <0.00002 17.3 19 4.83 <0.00002 3.9 26 4.40 0.00006 5.9
DNA metabolism 14 0.79 <0.00002 17.7 6 2.99 0.03006 2.0 6 1.15 0.00860 5.2
Transcription 9 2.04 0.00002 4.4 14 7.77 0.01134 1.8 7 1.85 0.00242 3.8
Gametogenesis 9 1.49 <0.00002 6.0 13 5.69 0.00172 2.3 7 1.53 0.00072 4.6
Neurogenesis 8 1.91 0.00018 4.2 12 7.29 0.03142 1.6 14 3.75 0.00168 3.7
Cell-surface receptor-linked signal transduction
8 2.48 0.00088 3.2 11 9.39 0.23272 1.2 5 3.05 0.12498 1.6
DNA repair 6 0.45 <0.00002 13.4 7 1.71 0.00030 4.1 3 0.28 0.00064 10.8
Intracellular signaling cascade 6 0.65 0.00002 9.3 6 2.44 0.01036 2.5 3 0.98 0.03602 3.1
Imaginal disk development 5 0.80 0.00022 6.3 9 3.04 0.00092 3.0 3 0.45 0.00266 6.7
Average 11.7 1.48 0.00022 9.2 11.8 5.63 0.03209 2.4 9.9 3.23 0.02769 4.71
The top 10 most frequently classified BD gene functions, derived from GO biological process level 4 (see Materials and methods), are shown. The number of proteins or pairs of proteins in our experimental data (Exp) with each GO function is shown, alongside the average number of times the function would appear in a random interaction map (Rand) having the same topology and number of proteins (see Materials and methods), and the ratio of Exp/Rand. The functions listed are significantly enriched in the BD list, to P < 0.001, and most to P < 0.0003. Cell cycle, DNA metabolism and DNA repair (highlighted) are the three most proportionally enriched classifications in the BD list, These classes are also enriched for self-associations in the interaction list, with cell cycle and DNA metabolism around six- and fivefold enriched, while DNA repair is approximately 11-fold more self-associated than expected by chance. Of these three, DNA metabolism is not significantly enriched in the AD gene list (P > 0.03), while the other two classifications are approximately fourfold enriched. A complete list of all functions and function pairs found in the interaction data is in Additional data file 4.
Genome Biology 2004, 5:R96
R96.6 Genome Biology 2004, Volume 5, Issue 12, Article R96 Stanyon et al. http://genomebiology.com/2004/5/12/R96
overlap between the two datasets is partly due to their uniqueabilities to detect interactions with specific proteins. Never-theless, for the 347 proteins common to both maps, the twoscreens combined to detect 1428 interactions, and yet only 28of these were in both datasets. This indicates that the twoscreens detected mostly unique interactions even among thesame set of proteins. Comparison with a set of approximately2,000 interactions recently generated in an independent two-hybrid screen [29] showed only three interactions in commonwith our data, in part because only eight of the same bait pro-teins were used successfully in both screens.
Although only 28 interactions were found in both the Gal4map and our map, this rate of overlap is significantly greaterthan expected by chance (p < 10-6; Table 1). To show this, wegenerated 106 random networks having the same BD proteins,total interactions and topology as the LexA map, and foundthat none of these random maps shared more than two inter-actions in common with the Gal4 map. To assess the relativequality of the 28 common interactions we used the confidencescores assigned to them by Giot et al. [6]. They used a statis-tical model to assign confidence scores (from 0 to 1), such thatinteractions with higher scores are more likely to be biologi-cally relevant than those with lower scores. The average con-fidence scores of the 28 interactions in common with ourLexA data (0.63), was higher than the average for all 20,439Gal4 interactions (0.34), or for random samplings of 28 Gal4interactions (0.32; P < 0.0001), indicating that the overlap ofthe two datasets is significantly enriched for biologically rele-vant interactions. Thus, the detection of interactions by bothsystems could be used as an additional measure of reliability.The surprisingly small number of common interactions, how-ever, severely limits the opportunities for cross-validation,and suggests that both datasets are far from comprehensive.
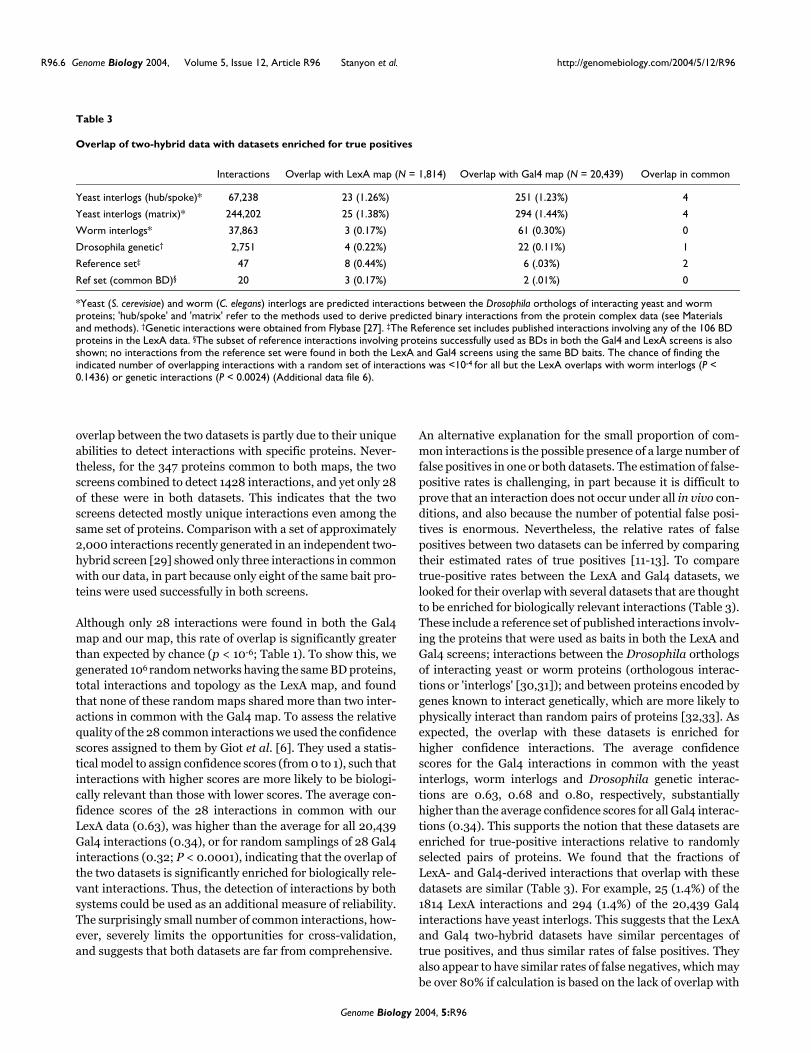
An alternative explanation for the small proportion of com-mon interactions is the possible presence of a large number offalse positives in one or both datasets. The estimation of false-positive rates is challenging, in part because it is difficult toprove that an interaction does not occur under all in vivo con-ditions, and also because the number of potential false posi-tives is enormous. Nevertheless, the relative rates of falsepositives between two datasets can be inferred by comparingtheir estimated rates of true positives [11-13]. To comparetrue-positive rates between the LexA and Gal4 datasets, welooked for their overlap with several datasets that are thoughtto be enriched for biologically relevant interactions (Table 3).These include a reference set of published interactions involv-ing the proteins that were used as baits in both the LexA andGal4 screens; interactions between the Drosophila orthologsof interacting yeast or worm proteins (orthologous interac-tions or 'interlogs' [30,31]); and between proteins encoded bygenes known to interact genetically, which are more likely tophysically interact than random pairs of proteins [32,33]. Asexpected, the overlap with these datasets is enriched forhigher confidence interactions. The average confidencescores for the Gal4 interactions in common with the yeastinterlogs, worm interlogs and Drosophila genetic interac-tions are 0.63, 0.68 and 0.80, respectively, substantiallyhigher than the average confidence scores for all Gal4 interac-tions (0.34). This supports the notion that these datasets areenriched for true-positive interactions relative to randomlyselected pairs of proteins. We found that the fractions ofLexA- and Gal4-derived interactions that overlap with thesedatasets are similar (Table 3). For example, 25 (1.4%) of the1814 LexA interactions and 294 (1.4%) of the 20,439 Gal4interactions have yeast interlogs. This suggests that the LexAand Gal4 two-hybrid datasets have similar percentages oftrue positives, and thus similar rates of false positives. Theyalso appear to have similar rates of false negatives, which maybe over 80% if calculation is based on the lack of overlap with
Table 3
Overlap of two-hybrid data with datasets enriched for true positives
Interactions Overlap with LexA map (N = 1,814) Overlap with Gal4 map (N = 20,439) Overlap in common
Yeast interlogs (hub/spoke)* 67,238 23 (1.26%) 251 (1.23%) 4
Yeast interlogs (matrix)* 244,202 25 (1.38%) 294 (1.44%) 4
Worm interlogs* 37,863 3 (0.17%) 61 (0.30%) 0
Drosophila genetic† 2,751 4 (0.22%) 22 (0.11%) 1
Reference set‡ 47 8 (0.44%) 6 (.03%) 2
Ref set (common BD)§ 20 3 (0.17%) 2 (.01%) 0
*Yeast (S. cerevisiae) and worm (C. elegans) interlogs are predicted interactions between the Drosophila orthologs of interacting yeast and worm proteins; 'hub/spoke' and 'matrix' refer to the methods used to derive predicted binary interactions from the protein complex data (see Materials and methods). †Genetic interactions were obtained from Flybase [27]. ‡The Reference set includes published interactions involving any of the 106 BD proteins in the LexA data. §The subset of reference interactions involving proteins successfully used as BDs in both the Gal4 and LexA screens is also shown; no interactions from the reference set were found in both the LexA and Gal4 screens using the same BD baits. The chance of finding the indicated number of overlapping interactions with a random set of interactions was <10-4 for all but the LexA overlaps with worm interlogs (P < 0.1436) or genetic interactions (P < 0.0024) (Additional data file 6).
Genome Biology 2004, 5:R96

http://genomebiology.com/2004/5/12/R96 Genome Biology 2004, Volume 5, Issue 12, Article R96 Stanyon et al. R96.7
com
ment
reviews
reports
refereed researchdepo
sited researchinteractio
nsinfo
rmatio
n
published interactions (Table 3). This supports the explana-tion that the main reason for the lack of overlap between thedatasets is that neither is a comprehensive representation ofthe interactome, and suggests that a large number of interac-tions remain to be detected.
Biologically informative interactionsFurther inspection of the LexA cell-cycle interaction maprevealed biologically informative interactions and additionalinsights for interpreting high-throughput two-hybrid data.For example, we expected to observe interactions betweencyclins and cyclin-dependent kinases (Cdks), which havebeen shown to interact by a number of assays. Our interactionmap includes six proteins having greater than 40% sequenceidentity to Cdk1 (also known as Cdc2). A map of all the inter-
actions involving these proteins reveals that they are multiplyconnected with several cyclins (Figure 2). For example, all ofthe known cyclins in the map interacted with at least two ofthe Cdk family members. The map includes 20 interactionsbetween five Cdks and six known cyclins plus one uncharac-terized protein, CG14939, which has sequence similarity tocyclins. Only one of these interactions (Cdc2c-CycJ) is knownto occur in vivo [34], and several others are thought not tooccur in vivo (for example Cdc2-CycE [35]). Similarly, theGal4 interaction map has three Cdk-cyclin interactions [6],including one known to occur in vivo (Cdk4-CycD) and twothat do not occur in vivo [35].
Thus, while some of these interactions are false positives inthe strictest sense, the data is informative nevertheless, as it
A map of the interactions involving cyclin-dependent kinases (Cdks)Figure 2A map of the interactions involving cyclin-dependent kinases (Cdks). All the interactions involving at least one of the six Cdks (Cdc2, Cdc2c, Cdk4, Cdk5, Cdk7) and Eip63E (red nodes) are shown. All the Cdks except Cdk7 interacted with at least two cyclins (red text). All the cyclins interacted with at least two Cdks, with the exception of the novel cyclin-like protein CG14939, which only interacted with Eip63E. Other known or paralogous interactions include, Cdc2c-dap, Cdc2-twe, and the interactions of Cdc2 and Cdc2c with CG9790, a Cks1-like protein. Proteins are depicted according to whether they appear in the map only as BD fusions (squares), only as AD fusions (circles), or as both BD and AD fusions (triangles). Proteins connected to more than one Cdk are green. Interactions are colored if they involve proteins contacting two Cdks (red), three Cdks (blue), or five Cdks (green).
DIICG8993
ena
E5CG4858CG4673
CG6488
CG14534CG31204
CG13510CG13558
CG5714
CSN3
CG16866CG13344
CG18614CG13806
CG14864CG6985
CG18806CG7296
CG11652
TH1CG4269CG6923CG11486
CG14056CG11138
SmBCG18745
CG15861CG17006
EG:25E8.4
crn
CG13900CG5568
panCG11824
CG17309
BcDNA:GH07485
His3.3ACycC
CycE
CycH
CycK
CycJ
CycG
Gel
tws
e(r)Prosbeta5
CG11849
CG7980bcd
Pp4-19CSox21b
eIF3-S9
CG7922
CG9868
CG5390
CG12116
CTCFLip3
CG13846
CG3850
EG:63B12.4CG17768CG14937CG17847
CG14317CG10600
CG17706CG15043
CG6293dap
Mistrtoy
BcDNA:LD34343
Vm26AbArc105
Dfd
Rad 51CG5708
CG5731EcRCG2948CG11963PHDP
CG3925
CG9821
CG15911
CG4335
amd
twe
CG12792
CG13625
CG9790
fryCG14119CG2944Pp1-87B
CG15676
CG14619
CG17508
BcDNA:GH06193
SAK
14-3-3epsilonBG:DS00941.12
CG14939Trx-2
Eip63ECdk7
Cdc2
Cdc2cCdk4
Cdk5
Genome Biology 2004, 5:R96

R96.8 Genome Biology 2004, Volume 5, Issue 12, Article R96 Stanyon et al. http://genomebiology.com/2004/5/12/R96
clearly demonstrates a high incidence of paralogous interac-tions - where pairs of interacting proteins each have paralogs,some combinations of which also interact in vivo. Such pat-terns are consistent with potential interactions betweenmembers of different protein families, even though they donot reveal the precise pair of proteins that interact in vivo.This class of informative false positives may be common intwo-hybrid data where the interaction is assayed out of bio-logical context. Experimentally reproducible interactions,whether or not they occur in vivo, can be used to discoverinteracting protein motifs or domains [6,36]. They can alsosuggest functional relationships between protein families andguide experiments to establish the actual in vivo interactionsand functions of specific pairs of interacting proteins.
The Cdk subgraph also illustrates that proteins with similarinteraction profiles may have related functions or structuralfeatures. To look for other groups of proteins having similarinteraction profiles we used a hierarchical clustering algo-rithm to cluster BD and AD fusion proteins according to theirinteractions (see Materials and methods). The resulting clus-tergram reveals several groups of proteins with similar inter-action profiles (Figure 3). One of the most prominent clusters(Figure 3, circled in blue) includes three related proteinsinvolved in ubiquitin-mediated proteolysis, SkpA, SkpB andSkpC. Skp proteins are known to interact with F-box proteins,which act as adaptors between ubiquitin ligases, known asSCF (Skp-Cullin-F-box) complexes, and proteins to be tar-geted for destruction by ubiquitin-mediated proteolysis [37].A map of the interactions involving the Skp proteins shows agroup of 21 AD proteins that each interact with two or three ofthe Skp proteins (Figure 4). This group is highly enriched forF-box proteins, including 13 of the 15 F-box proteins in the
AD list; the other two F-box proteins interacted with only oneSkp (Figure 4). Several of the interactions in common withthe Gal4 data are also in the Skp cluster, and 12 out of 16 ofthese involve proteins that interact with two or more Skpproteins.
Thus, the Skp cluster provides another example of how pro-teins with similar interaction profiles may be structurally orfunctionally related, and how such clusters may be enrichedfor biologically relevant interactions. This is consistent withprevious results showing that protein pairs often have relatedfunctions if they have a significantly larger number of com-mon interacting partners than expected by chance [24,38].These groups of proteins are likely to be part of more exten-sive functional clusters that could be identified by moresophisticated topological analyses (for example [39-44].Maps showing several other major clusters derived from thecluster-gram are shown in Additional data file 7.
The interaction profile data is statistically confirmed bydomain-pairing data, which shows that certain pairs ofdomains are found within interacting pairs of proteins morefrequently than expected by chance (Table 4). These includethe Skp domain and F-box pair, the protein kinase and cyclindomains, and several less obvious pairings. For example, thecyclin and kinase domains are observed to be associated withvarious zinc-finger and homeodomain proteins, and thekinase domain with a number of nucleic-acid metabolismdomains (Table 4). A similar analysis of the Gal4 data, per-formed by Giot et al. [6], revealed a number of significantdomain pairings, including the Skp/F-box and the kinase/cyclin pairs and several others found in the LexA dataset.Therefore, although the number of proteins in the LexA data-
Proteins clustered by their interaction profilesFigure 3Proteins clustered by their interaction profiles. BD fused proteins (y-axis) and AD fused proteins (x-axis) were independently clustered according to the similarities of their interaction profiles using a hierarchical clustering algorithm (see Materials and methods). An interaction between a BD and AD protein is indicated by a small colored square. The squares are colored according to the level of two-hybrid reporter activity, which is the sum of LEU2 (0-3) and lacZ (0-5) scores, where higher scores indicate more reporter activity (1, yellow; 5+, red). The cluster circled in blue (center) corresponds to interactions involving SkpA, SkpB and SkpC BD fusions, which are mapped in Figure 4. Maps of other clusters (circled in green) are shown in Additional data file 7. The large cluster at upper left is due primarily to AD proteins that interact with many different BD proteins. A larger version of the figure with the gene names indicated in the axes is in Additional data file 8.
AD proteins
BD
proteins5+
0
Genome Biology 2004, 5:R96

http://genomebiology.com/2004/5/12/R96 Genome Biology 2004, Volume 5, Issue 12, Article R96 Stanyon et al. R96.9
com
ment
reviews
reports
refereed researchdepo
sited researchinteractio
nsinfo
rmatio
n
set is relatively small, domain associations are observed in thedata, demonstrating that a high-density interaction map,with a high average number of interactions per protein, pro-vides insight into patterns of domain interactions that isequally valuable as that obtained from a proteome-wide map.
DiscussionProteome-wide maps depicting the binary interactionsamong proteins provide starting points for understandingprotein function, the structure and function of proteincomplexes, and for mapping biological pathways andregulatory networks. High-throughput approaches havebegun to generate large protein-interaction maps that haveproved useful for functional studies, but are also oftenplagued by high rates of false positives and false negatives.Several analyses have shown that the set of interactionsdetected by more than one high-throughout approach isenriched for biologically relevant interactions, suggestingthat the application of multiple screens to the same set of pro-
teins results in higher-confidence, cross-validated interac-tions [11-13]. Such cross-validation has been limited,however, by the lack of overlap among high-throughput data-sets. Here we describe initial efforts to complement a recentlypublished Drosophila protein interaction map that was gen-erated using the Gal4 yeast two-hybrid system [6]. We con-structed yeast arrays for use in the LexA-based two-hybridsystem by subcloning approximately 12,000 DrosophilaORFs, using the same PCR amplification products used in theGal4 project, into the LexA two-hybrid vectors. Initially, weused a novel pooled mating approach [19] to screen one of the12,000-member arrays with 152 bait proteins related to cellcycle regulators. By using both a different screening approachand a different two-hybrid system, we expected to increasecoverage and to validate some of the interactions detected bythe Gal4 screens.
The level of coverage for a high-throughput screen can be esti-mated by determining the percentage of a reference datasetthat was detected; reference sets have been derived from pub-
A map of the interactions in the Skp clusterFigure 4A map of the interactions in the Skp cluster. All the interactions with the BD fusions SkpA, SkpB and SkpC, are shown. Proteins (green) interacting with more that one Skp paralog are enriched for proteins possessing an F-box domain (red text). Other colors and shapes are as in Figure 2.
bdc
BEST:GH10766
CG10395
CG10805
CG10855
CG11486
CG11963
CG12432
CG1244
CG13085
CG13213
CG14009
CG14317
CG14937
CG15010
CG18614
CG18745
CG2010
CG3640
CG4221
CG4496
CG4643
CG4911
CG6758CG7922
CG8272
CG9316
CG9461
CG9772
CG9882
crn
Doa
e(r)
EG:171D11.6
TH1
ppa
slmb
CG11824
CG5003
EG:BACR42I17.5
SkpB
SkpC
SkpA
Arc105
aru
CG11120
CG11849
CG14056
CG14833
CG15043
CG15410
CG15676
CG2944
CG5731
CG6488
CG9527
CycG
CG17706
tws
Vm26Abras
Rad51
Genome Biology 2004, 5:R96

R96.10 Genome Biology 2004, Volume 5, Issue 12, Article R96 Stanyon et al. http://genomebiology.com/2004/5/12/R96
lished low-throughput experiments, for example, which areconsidered to have relatively low false-positive rates. High-throughput two-hybrid data for yeast and C. elegans proteinswere shown to cover only about 10-13% of the correspondingreference datasets [5,10,13]. Two factors may contribute tothis lack of coverage. First, some interactions cannot bedetected using the yeast two-hybrid system, even though theycould be detected in low-throughput studies using othermethods. Examples include interactions that depend on cer-tain post-translational modifications, that require a freeamino terminus or that involve membrane proteins. Second,high-throughput yeast two-hybrid screens often fail to test allpossible combinations of interactions; in other words, thescreens are not saturating or complete.
Although the relative contribution of these two factors is dif-ficult to estimate, results from screens to map interactionsamong yeast proteins suggest that the major reason for thelack of coverage is that the screens are incomplete. Completescreens would identify all interactions that could possibly bedetected by a given method; ideally therefore, two completescreens using the same method would identify all the sameinteractions. However, the rate of overlap among the differentyeast proteome screens is low, even though they used verysimilar two-hybrid systems. Moreover, the overlap betweenscreens is not significantly greater than the rate at which theyoverlap any reference set [4,10]. This is true even when onlyhigher-confidence interactions are considered; for example,two large interaction screens of yeast proteins detected 39%and 65% of a higher-confidence dataset, respectively, but only11% of the reference set was detected by both screens [12].These results indicate that the lack of coverage in high-
throughput two-hybrid data is largely due to incompletescreening, and that significantly larger datasets than thosecurrently available will be needed before different datasetscan be used to cross-validate interactions.
The rates of coverage and completeness from our high-throughput two-hybrid screening with Drosophila proteinsare consistent with those for the yeast proteins. We used theLexA system to detect 1,814 reproducible interactions to com-plement the 20,439 interactions previously detected in aproteome-wide screen using the Gal4 system [6]. The overlapbetween the LexA and Gal4 screens is less than 2% of eachdataset, whereas their overlap with a reference set was 17%and 14%, respectively, and only 2% of the reference set wasdetected by both screens (Table 2). Taken together, theseresults suggest that, like the yeast interaction data, both Dro-sophila datasets are far from complete and that many moreinteractions could be detected by additional two-hybridscreening.
The actual number of interactions that might be detected bycomplete two-hybrid screening might be roughly estimatedfrom the partially overlapping datasets, as was performed foraccurate estimation of the number of genes in the humangenome [45,46]. In this approach, the overlap of two subsets,given that one subset is a homogeneous random sample of thewhole, is sufficient to estimate the size of the whole. To makesuch an estimate with high-throughput two-hybrid data,however, it is necessary to first filter out false positives, asthey are mostly different for the two datasets, as suggested bythe fact that the nonoverlapping data has a lower rate of truepositives than the overlapping data. Giot et al. estimated that
Table 4
Domain pair enrichment
AD domain BD domain Domain pairings
Name Exp Rand Fold P Name Exp Rand Fold P Exp Rand Fold P
Cyclin 8 0.5 16 <0.00002 Protein kinase 30 1.7 18 <0.00002 38 0.6 60 <0.00002
F-box 17 1.2 15 <0.00002 Skp1 4 0.1 75 <0.00002 34 0.3 123 <0.00002
F-box 17 1.2 15 <0.00002 Skp1_POZ 4 0.1 65 <0.00002 34 0.3 123 <0.00002
Homeobox 9 2.9 3 0.00080 Protein kinase 30 1.7 18 <0.00002 33 3.7 9 0.00002
Extensin_2 20 11.0 2 0.00316 Protein kinase 30 1.7 18 <0.00002 33 14.0 2 0.01536
Cyclin_C 4 0.3 15 <0.00002 Protein kinase 30 1.7 18 <0.00002 26 0.3 76 <0.00002
Drf_FH1 11 4.3 3 0.00128 Protein kinase 30 1.7 18 <0.00002 19 5.5 3 0.01278
Cyclin 8 0.5 16 <0.00002 RIO1 11 0.3 39 <0.00002 19 0.3 59 <0.00002
Rrm 12 4.3 3 0.00032 Protein kinase 30 1.7 18 <0.00002 18 5.5 3 0.01692
The top 10 domain pairs observed in the interaction list are shown. As expected from interaction profiles (see text), cyclin and protein kinase domains are significantly associated, as are F-box and Skp domains. RIO1 is a recently described kinase domain [62] while the Extensin_2 domain is a proline-rich sequence. Drf_FH1 is the Diaphanous-related formin domain, a low-complexity 12-residue repeat found in proteins involved with cytoskeletal dynamics and the Rho-family GTPases [63], and the Rrm is an RNA-recognition motif. There are also additional associations between protein kinase domains and nucleic acid metabolism domains (see Additional data file 5). These data demonstrate the capacity of relatively small sets of proteins to generate high-confidence domain associations. A complete list of all domains and domain pairs found in the interaction data is in Additional data file 5.
Genome Biology 2004, 5:R96

http://genomebiology.com/2004/5/12/R96 Genome Biology 2004, Volume 5, Issue 12, Article R96 Stanyon et al. R96.11
com
ment
reviews
reports
refereed researchdepo
sited researchinteractio
nsinfo
rmatio
n
at least 11% of the Gal4 interactions are likely to be biologi-cally relevant, based on the prediction accuracy of their statis-tical model [6]. We found by comparison with other datasetsthat the rates of true positives are not substantially differentbetween the LexA and Gal4 data (Table 3). Thus, if we use 11%as the minimal rate of true positives in each dataset, we obtain200 true interactions from the LexA screen and 2,248 fromthe Gal4 screens. If we further assume that all of the 28 com-mon interactions are true positives, we can estimate thatcomplete screens should be able to detect around 16,000 truepositive interactions (200 × 2,248/28). If each screeningapproach has a false-positive rate of 89%, then around150,000 interactions from each approach would be requiredin order to create complete, cross-validating datasets, wherethe overlap would be comprised of true positives. This esti-mate is highly sensitive to both the frequency of true positivesin the two datasets, and the number of positives in the overlapbetween the datasets; for example, if true-positive frequencyis underestimated by only twofold, there will be four times asmany interactions.
False-positive interactions have been classified as technicalor biological [5]. A technical false positive is an artifact of theparticular interaction assay, and the two proteins involved donot actually interact under any setting. A biological false pos-itive is one in which the two proteins genuinely and reproduc-ibly interact in a particular assay, but the interaction does nottake place in a biological setting; for example, the interactingproteins may never be temporally or spatially co-localized invivo. Using the approach described here, the interactions areshown to be reproducible during the one-on-one two-hybridassays that are used to record reporter activity scores,suggesting that we have minimized the frequency of technicalfalse positives.
We suggest that the biological false positives might be furtherclassified as informative and non-informative. Informativefalse positives are interactions that do not occur in vivo, butthat nevertheless have some biological basis for beingdetected and are potentially useful for guiding future experi-ments. In our data, for example, the Cdk and Skp proteinseach interact with a different group of targets, which in turninteract with multiple Cdk or Skp proteins. From this dataalone, we would accurately predict that Cdk proteins interactwith cyclins, and that Skp proteins interact with F-box pro-teins, even though only some of the specific combinations aretrue in vivo partners. Similarly, from analysis of domain pairsin the LexA dataset, other patterns are evident, such as home-obox domains being associated with both protein kinase andcyclin domains (Table 4). Additional information or experi-mentation would be needed to determine which of the specificparalogous interactions function in vivo. Co-affinitypurification, for example, might be used to directly test allpossible pairs of paralogous interactions implied by the two-hybrid map. Alternatively, the genes encoding each possiblepair of proteins could be examined for correlated expression
patterns, for example, to suggest more likely pairs or toexclude pairs that are not coexpressed.
ConclusionsWe used high-throughput screening to detect 1,814 proteininteractions involving many proteins with cell-cycle andrelated functions. The resulting interaction map is similar inquality to other large interaction maps and is predominatedby previously unidentified interactions. The majority of theproteins in the map have not been assigned a biological func-tion, and the map provides a first clue about the potentialfunctions of these proteins by connecting them withcharacterized proteins or pathways. High-throughput inter-action data such as this should allow researchers to quicklyidentify possible patterns of protein interactions for use inselecting additional functional assays to perform on theirgene(s) of interest. This narrows down the number of poten-tial assays necessary to establish function for a given genefrom hundreds to just a handful; conversely, when studying aspecific function, such as the cell cycle, interaction data canidentify which few genes, selected from thousands, may havea role in the process. Just as the sequencing of variousgenomes has not allowed unambiguous ascription of biologi-cal function to the majority of the identified genes, mappingof an interactome by high-throughput methods does notallow final assignment of interaction capacity or of higherfunctionality to a protein. This requires additional experi-ments, guided by these and other high-throughput data. Theresults presented here show that extending and combiningdifferent two-hybrid datasets will allow further refinement ofthe selection of functional analyses to be performed for eachprotein of the proteome.
Materials and methodsPlasmids and strainsYeast two-hybrid vectors used are related to those originallydescribed for the LexA system [17]. The vector for expressingamino-terminal LexA DNA-binding domain (BD) fusions waspHZ5-NRT, which expresses fusions from the regulatedMAL62 promoter [18]. The vector for expressing amino-ter-minal activation domain (AD) fusions from the GAL1 pro-moter was pJZ4-NRT, which was constructed from pJG4-5[17] by replacing the ADH1 terminator with the CYC1 termi-nator and inserting the 5' and 3' recombination tags (5RT1and 3RT1 [18]) into the cloning site downstream from the ADcoding region. Construction details can be found in Addi-tional data file 1. Maps and sequences are available at [47].Yeast (S. cerevisiae) strain RFY231 (MAT trp1::hisG his3ura3-1 leu2::3Lexop-LEU2) and RFY206 (Mata his3∆200leu2-3 lys2∆201 ura3-52 trp1∆::hisG) were previouslydescribed [2,48]. RFY206 containing the lacZ reporter plas-mid pSH18-34 [49] is referred to here as strain Y309.
Genome Biology 2004, 5:R96

R96.12 Genome Biology 2004, Volume 5, Issue 12, Article R96 Stanyon et al. http://genomebiology.com/2004/5/12/R96
Yeast two-hybrid arraysTwo yeast arrays were constructed by homologous recombi-nation (gap repair) in yeast [3]. We began with the 13,393unique PCR products, which were generated using gene-spe-cific primer pairs corresponding to the predicted DrosophilaORFs, from ATG to stop codon, described in Giot et al. [6].For the AD array, we co-transformed RFY231 with each PCRproduct along with pJZ4-NRT that had been linearized withEcoRI and BamHI, and selected recombinants on glucoseminimal media lacking tryptophan. Five colonies from eachtransformation were picked and combined into a well of a 96-well plate. For the BD array, we co-transformed Y309 witheach PCR product along with pHZ5-NRT that had been line-arized with EcoRI and BamHI, and selected recombinants onglucose minimal medium lacking histidine and uracil. BDclones used in the screens and AD clones showing positiveinteractions were sequenced to verify the ORF identities. SeeAdditional data files for details.
Two-hybrid screeningThe BD fused proteins used as baits in our screens are listedin Additional data file 2. The AD array was screened using atwo-phase pooled mating approach [19]. First, pools contain-ing the 96 AD strains from each plate in the AD array wereconstructed by scraping strains grown on agar plates, dispers-ing in 15% glycerol, and aliquoting into a 96-well format; the142 pools, representing approximately 13,000 AD strains,were arrayed on two 96-well plates. In the first phase, individ-ual BD strains were mated with the 142 AD pools bydispensing 5-µl volumes of each culture onto YPD platesusing a Biomek FX robot (Beckman Coulter). After 2 daysgrowth at 30°C, yeast were replicated to medium selective fordiploids, which have the AD, BD and lacZ reporter plasmids,and containing both galactose and maltose to induce expres-sion of the AD and BD fusions, respectively. The plates alsolacked leucine to assay for expression of the LEU2 reporter,and contained X-Gal (40 µg/ml) to assay for expression oflacZ. These plates were photographed after 5 days at 30°Cand interactions were scored as described [19]. In the secondphase of screening, single BD strains were mated with theappropriate panel(s) of 93 AD strains corresponding to thepools that were positive in the first phase. The LEU2 and lacZreporters were assayed on separate plates: growth on plateslacking leucine was scored from 0 (no growth) to 3 (heavygrowth); the extent of blue on the X-Gal plates was scoredfrom 0 (white) to 5 (dark blue). After re-testing interactions(see Additional data files) the AD plasmids from interactingAD strains were rescued in bacteria and clones weresequenced to verify insert identity. Cloned plasmids werethen reintroduced into RFY231 and used in all possible com-binations of one-on-one mating operations with the appro-priate BD strains to repeat the interaction assay a third time.The same set of BDs was also used to screen a pool of allapproximately 13,000 AD strains using a library screeningapproach as described in the Additional data files. All interac-tion data from both screens are listed in Additional data file 3
and are also available at [47,50] and at IntAct [51] in the Pro-teomics Standards Initiative - Molecular Interactions (PSI-MI) standard exchange format [52].
Data analysisThe interaction profiles for the BD fused proteins and ADfused proteins were independently clustered and are plottedin Figure 3 using Genespring software (Silicon Genetics). Pro-tein-interaction map graphs in Figures 1, 2 and 4 and Addi-tional data file 7 were drawn with a program developed byLana Pacifico (L. Pacifico, F. Fotouhi and R.L.F., unpublishedwork) available at [47]. To determine Drosophila interlogs ofyeast or worm interactions, a list of Drosophila proteinsbelonging to eukaryotic clusters of orthologous groups(KOGs) [53] was obtained from the National Center for Bio-technology Information (NCBI) [54]. Each fly protein wasassigned one or more KOG IDs, based on the cluster(s) towhich it belongs. A list of interactions among yeast (S. cerevi-siae) proteins, derived mostly from high-throughput yeasttwo-hybrid screens [4,55] and from the determination of pro-teins in precipitated complexes [56,57], was obtained fromthe Comprehensive Yeast Genome Database [58,59].
For the interactions determined by precipitation of com-plexes, two lists were generated. One list includes the binaryinteractions between the bait protein and every protein thatwas co-precipitated, but not between the precipitated pro-teins (hub and spoke model). The second list included all pos-sible binary interactions among the members of a complex(matrix model). The lists were each used to generate a list ofinteractions between KOG pairs, which in turn was used togenerate a list of potential interactions between pairs of Dro-sophila proteins belonging to those KOGs. Similarly, Dro-sophila-worm (C. elegans) interlogs were determined usingthe list of interactions between worm proteins determined byhigh-throughput yeast two-hybrid screening [5]. Drosophilagenetic interactions were obtained from Flybase [27,60]. Tocompare the two-hybrid data with other datasets we gener-ated random interaction maps having the same BD proteins,total interactions and topological properties as the LexA orGal4 data. The AD clones in each interaction list wereindexed, an array of the same number of genes as the ADclones was randomly fetched from the Drosophila Release 3.1genome [61] and these genes were used to replace the originalAD clones at the same indexed positions.
Fifty thousand such random networks were generated foreach two-hybrid dataset, and then compared with the yeastinterlogs, worm interlogs, and genetic interactions to deter-mine the amount of overlap expected by chance. P values rep-resented the number of times that the observed number ofoverlapping interactions was detected in 50,000 iterations ofa random network, divided by 50,000. In most cases P <0.0002 (see Additional data file 6). Additional methods are inAdditional data file 1. To compare the number of commoninteractions between the LexA and Gal4 maps with the
Genome Biology 2004, 5:R96

http://genomebiology.com/2004/5/12/R96 Genome Biology 2004, Volume 5, Issue 12, Article R96 Stanyon et al. R96.13
com
ment
reviews
reports
refereed researchdepo
sited researchinteractio
nsinfo
rmatio
n
number expected by chance, we generated 106 random LexAmaps and found that they never contained more than twointeractions in common with the Gal4 map; thus, the P-valuefor the 28 common interactions is significantly less than 10-6.
Additional data filesThe following additional data are available with the onlineversion of this paper. Additional data file 1 contains Supple-mentary materials and methods; Additional data file 2 con-tains Supplementary Table 1, BD 'baits' used in the LexAscreens; Additional data file 3 contains Supplementary Table2, Interactions detected in the LexA screens; Additional datafile 4 contains Supplementary Table 3, Enrichment of GeneOntology classes, complete list; Additional data file 5 containsSupplementary Table 4, Enrichment of Domain pairs, com-plete list; Additional data file 6 contains Supplementary Table5, P-values for overlap among datasets, and SupplementaryTable 6, Interactions from the LexA and Gal4 screens thatsuccessfully used the same BD bait proteins; Additional datafile 7 is a PDF containing Supplementary Figure 1, Interactionmaps of other clusters; Additional data file 8 is a PDF contain-ing Supplementary Figure 2, Proteins clustered by interactionprofile; Additional data file 9 contains the legends to Supple-mentary Figures 1 and 2.Additional data file 1Supplementary materials and methodsSupplementary Materials and methodsClick here for additional data fileAdditional data file 2Supplementary Table 1: BD 'baits' used in the LexA screensSupplementary Table 1: BD 'baits' used in the LexA screensClick here for additional data fileAdditional data file 3Supplementary Table 2: Interactions detected in the LexA screensSupplementary Table 2: Interactions detected in the LexA screensClick here for additional data fileAdditional data file 4Supplementary Table 3: Enrichment of Gene Ontology classes (the complete list)Supplementary Table 3: Enrichment of Gene Ontology classes (the complete list)Click here for additional data fileAdditional data file 5Supplementary Table 4: Enrichment of Domain pairs (the com-plete list)Supplementary Table 4: Enrichment of Domain pairs (the com-plete list)Click here for additional data fileAdditional data file 6Supplementary Table 5: P-values for overlap among datasetsa nd Supplementary Table 6: Interactions from the LexA and Gal4 screens that successfully used the same BD bait proteinsSupplementary Table 5: P-values for overlap among datasetsa nd Supplementary Table 6: Interactions from the LexA and Gal4 screens that successfully used the same BD bait proteinsClick here for additional data fileAdditional data file 7Supplementary Figure 1: Interaction maps of other clustersSupplementary Figure 1: Interaction maps of other clustersClick here for additional data fileAdditional data file 8Supplementary Figure 2: Proteins clustered by interaction profileSupplementary Figure 2: Proteins clustered by interaction profileClick here for additional data fileAdditional data file 9The legends to Supplementary Figures 1 and 2The legends to Supplementary Figures 1 and 2Click here for additional data file
AcknowledgementsWe thank Ari Firestone for developing the array of AD pools and membersof the Finley laboratory for helpful discussions and technical assistance. Wealso thank Kyle Gardenour and Jodi Parrish for critical comments on themanuscript. We are particularly grateful to Mike McKenna for his help inthe initial stages of this project. This work was supported by NIH grantsHG01536 and GM62403.
References1. Fields S, Song O: A novel genetic system to detect protein-pro-
tein interactions. Nature 1989, 340:245-246.2. Finley RL Jr, Brent R: Interaction mating reveals binary and ter-
nary connections between Drosophila cell cycle regulators.Proc Natl Acad Sci USA 1994, 91:12980-12984.
3. Hudson JR Jr, Dawson EP, Rushing KL, Jackson CH, Lockshon D,Conover D, Lanciault C, Harris JR, Simmons SJ, Rothstein R, Fields S:The complete set of predicted genes from Saccharomycescerevisiae in a readily usable form. Genome Res 1997,7:1169-1173.
4. Uetz P, Giot L, Cagney G, Mansfield TA, Judson RS, Knight JR, Lock-shon D, Narayan V, Srinivasan M, Pochart P, et al.: A comprehen-sive analysis of protein-protein interactions in Saccharomycescerevisiae. Nature 2000, 403:623-627.
5. Li S, Armstrong CM, Bertin N, Ge H, Milstein S, Boxem M, VidalainPO, Han JD, Chesneau A, Hao T, et al.: A map of the interactomenetwork of the metazoan C. elegans. Science 2004, 303:540-543.
6. Giot L, Bader JS, Brouwer C, Chaudhuri A, Kuang B, Li Y, Hao YL,Ooi CE, Godwin B, Vitols E, et al.: A protein interaction map ofDrosophila melanogaster. Science 2003, 302:1727-1736.
7. Rain JC, Selig L, De Reuse H, Battaglia V, Reverdy C, Simon S, LenzenG, Petel F, Wojcik J, Schachter V, et al.: The protein-protein inter-action map of Helicobacter pylori. Nature 2001, 409:211-215.
8. McCraith S, Holtzman T, Moss B, Fields S: Genome-wide analysisof vaccinia virus protein-protein interactions. Proc Natl Acad SciUSA 2000, 97:4879-4884.
9. Bartel PL, Roecklein JA, SenGupta D, Fields S: A protein linkagemap of Escherichia coli bacteriophage T7. Nat Genet 1996,12:72-77.
10. Ito T, Chiba T, Ozawa R, Yoshida M, Hattori M, Sakaki Y: A compre-hensive two-hybrid analysis to explore the yeast proteininteractome. Proc Natl Acad Sci USA 2001, 98:4569-4574.
11. Bader GD, Hogue CW: Analyzing yeast protein-protein inter-action data obtained from different sources. Nat Biotechnol2002, 20:991-997.
12. Deane CM, Salwinski L, Xenarios I, Eisenberg D: Protein interac-tions: two methods for assessment of the reliability of high-throughput observations. Mol Cell Proteomics 2002, 1:349-356.
13. von Mering C, Krause R, Snel B, Cornell M, Oliver SG, Fields S, BorkP: Comparative assessment of large-scale data sets of pro-tein-protein interactions. Nature 2002, 417:399-403.
14. Jansen R, Yu H, Greenbaum D, Kluger Y, Krogan NJ, Chung S, EmiliA, Snyder M, Greenblatt JF, Gerstein M: A Bayesian networksapproach for predicting protein-protein interactions fromgenomic data. Science 2003, 302:449-453.
15. Fromont-Racine M, Mayes AE, Brunet-Simon A, Rain JC, Colley A,Dix I, Decourty L, Joly N, Ricard F, Beggs JD, Legrain P: Genome-wide protein interaction screens reveal functional networksinvolving Sm-like proteins. Yeast 2000, 17:95-110.
16. Schwikowski B, Uetz P, Fields S: A network of protein-proteininteractions in yeast. Nat Biotechnol 2000, 18:1257-1261.
17. Gyuris J, Golemis E, Chertkov H, Brent R: Cdi1, a human G1 andS phase protein phosphatase that associates with Cdk2. Cell1993, 75:791-803.
18. Finley RL Jr, Zhang H, Zhong J, Stanyon CA: Regulated expressionof proteins in yeast using the MAL61-62 promoter and a mat-ing scheme to increase dynamic range. Gene 2002, 285:49-57.
19. Zhong J, Zhang H, Stanyon CA, Tromp G, Finley RL Jr: A strategyfor constructing large protein interaction maps using theyeast two-hybrid system: regulated expression arrays andtwo-phase mating. Genome Res 2003, 13:2691-2699.
20. Barabasi AL, Oltvai ZN: Network biology: understanding thecell's functional organization. Nat Rev Genet 2004, 5:101-113.
21. Jeong H, Mason SP, Barabasi AL, Oltvai ZN: Lethality and central-ity in protein networks. Nature 2001, 411:41-42.
22. Watts DJ, Strogatz SH: Collective dynamics of 'small-world'networks. Nature 1998, 393:440-442.
23. Saito R, Suzuki H, Hayashizaki Y: Interaction generality, a meas-urement to assess the reliability of a protein-proteininteraction. Nucleic Acids Res 2002, 30:1163-1168.
24. Goldberg DS, Roth FP: Assessing experimentally derived inter-actions in a small world. Proc Natl Acad Sci USA 2003,100:4372-4376.
25. Bader JS, Chaudhuri A, Rothberg JM, Chant J: Gaining confidencein high-throughput protein interaction networks. NatBiotechnol 2004, 22:78-85.
26. Ashburner M, Ball CA, Blake JA, Botstein D, Butler H, Cherry JM,Davis AP, Dolinski K, Dwight SS, Eppig JT, et al.: Gene ontology:tool for the unification of biology. The Gene OntologyConsortium. Nat Genet 2000, 25:25-29.
27. FlyBase Consortium: The FlyBase database of the Drosophilagenome projects and community literature. Nucleic Acids Res2003, 31:172-175.
28. Vazquez A, Flammini A, Maritan A, Vespignani A: Global proteinfunction prediction from protein-protein interactionnetworks. Nat Biotechnol 2003, 21:697-700.
29. Hybrigenics web site [http://www.hybrigenics.com]30. Yu H, Luscombe NM, Lu HX, Zhu X, Xia Y, Han JD, Bertin N, Chung
S, Vidal M, Gerstein M: Annotation transfer between genomes:protein-protein interologs and protein-DNA regulogs.Genome Res 2004, 14:1107-1118.
31. Ge H, Liu Z, Church GM, Vidal M: Correlation between tran-scriptome and interactome mapping data from Saccharomy-ces cerevisiae. Nat Genet 2001, 29:482-486.
32. Tong AH, Lesage G, Bader GD, Ding H, Xu H, Xin X, Young J, BerrizGF, Brost RL, Chang M, et al.: Global mapping of the yeastgenetic interaction network. Science 2004, 303:808-813.
33. Tewari M, Hu PJ, Ahn JS, Ayivi-Guedehoussou N, Vidalain PO, Li S,Milstein S, Armstrong CM, Boxem M, Butler MD, et al.: Systematicinteractome mapping and genetic perturbation analysis of aC. elegans TGF-beta signaling network. Mol Cell 2004,13:469-482.
34. Kolonin MG, Finley RL Jr: A role for cyclin J in the rapid nucleardivision cycles of early Drosophila embryogenesis. Dev Biol2000, 227:661-672.
35. Lane ME, Sauer K, Wallace K, Jan YN, Lehner CF, Vaessin H:Dacapo, a cyclin-dependent kinase inhibitor, stops cell prolif-
Genome Biology 2004, 5:R96

R96.14 Genome Biology 2004, Volume 5, Issue 12, Article R96 Stanyon et al. http://genomebiology.com/2004/5/12/R96
eration during Drosophila development. Cell 1996,87:1225-1235.
36. Reiss DJ, Schwikowski B: Predicting protein-peptide interac-tions via a network-based motif sampler. Bioinformatics 2004,20(Suppl 1):I274-I282.
37. Jackson PK, Eldridge AG: The SCF ubiquitin ligase: an extendedlook. Mol Cell 2002, 9:923-925.
38. Samanta MP, Liang S: Predicting protein functions from redun-dancies in large-scale protein interaction networks. Proc NatlAcad Sci USA 2003, 100:12579-12583.
39. Rives AW, Galitski T: Modular organization of cellularnetworks. Proc Natl Acad Sci USA 2003, 100:1128-1133.
40. Spirin V, Mirny LA: Protein complexes and functional modulesin molecular networks. Proc Natl Acad Sci USA 2003,100:12123-12128.
41. King AD, Przulj N, Jurisica I: Protein complex prediction viacost-based clustering. Bioinformatics 2004. doi:10.1093/bioinfor-matics/bth351
42. Bu D, Zhao Y, Cai L, Xue H, Zhu X, Lu H, Zhang J, Sun S, Ling L,Zhang N, et al.: Topological structure analysis of the protein-protein interaction network in budding yeast. Nucleic Acids Res2003, 31:2443-2450.
43. Bader GD, Hogue CW: An automated method for findingmolecular complexes in large protein interaction networks.BMC Bioinformatics 2003, 4:2.
44. Gagneur J, Krause R, Bouwmeester T, Casari G: Modular decom-position of protein-protein interaction networks. Genome Biol2004, 5:R57.
45. Ewing B, Green P: Analysis of expressed sequence tags indi-cates 35,000 human genes. Nat Genet 2000, 25:232-234.
46. Aparicio SA: How to count ... human genes. Nat Genet 2000,25:129-130.
47. Welcome to the Finley Lab [http://proteome.wayne.edu/finlabindex.html]
48. Kolonin MG, Finley RL Jr: Targeting cyclin-dependent kinases inDrosophila with peptide aptamers. Proc Natl Acad Sci USA 1998,95:14266-14271.
49. Golemis EA, Serebriiskii I, Finley RL Jr, Kolonin MG, Gyuris J, BrentR: Interaction trap/two-hybrid system to identify interactingproteins. In Current Protocols in Molecular Biology Volume 20.1. Editedby: Ausubel FM, Brent R, Kingston RE, Morre D, Seidman JG, StruhlK. New York: John Wiley & Sons; 1998.
50. FlyGrid [http://biodata.mshri.on.ca/fly_grid/servlet/SearchPage]51. IntAct Interaction database [http://www.ebi.ac.uk/intact/
index.html]52. Hermjakob H, Montecchi-Palazzi L, Bader G, Wojcik J, Salwinski L,
Ceol A, Moore S, Orchard S, Sarkans U, von Mering C, et al.: TheHUPO PSI's molecular interaction format - a communitystandard for the representation of protein interaction data.Nat Biotechnol 2004, 22:177-183.
53. Koonin EV, Fedorova ND, Jackson JD, Jacobs AR, Krylov DM,Makarova KS, Mazumder R, Mekhedov SL, Nikolskaya AN, Rao BS, etal.: A comprehensive evolutionary classification of proteinsencoded in complete eukaryotic genomes. Genome Biol 2004,5:R7.
54. NCBI Clusters of Orthologous Groups database [ftp://ftp.ncbi.nih.gov/pub/COG]
55. Ito T, Tashiro K, Muta S, Ozawa R, Chiba T, Nishizawa M, YamamotoK, Kuhara S, Sakaki Y: Toward a protein-protein interactionmap of the budding yeast: a comprehensive system to exam-ine two-hybrid interactions in all possible combinationsbetween the yeast proteins. Proc Natl Acad Sci USA 2000,97:1143-1147.
56. Ho Y, Gruhler A, Heilbut A, Bader GD, Moore L, Adams SL, Millar A,Taylor P, Bennett K, Boutilier K, et al.: Systematic identificationof protein complexes in Saccharomyces cerevisiae by massspectrometry. Nature 2002, 415:180-183.
57. Gavin AC, Bosche M, Krause R, Grandi P, Marzioch M, Bauer A,Schultz J, Rick JM, Michon AM, Cruciat CM, et al.: Functional organ-ization of the yeast proteome by systematic analysis of pro-tein complexes. Nature 2002, 415:141-147.
58. Mewes HW, Amid C, Arnold R, Frishman D, Guldener U, MannhauptG, Munsterkotter M, Pagel P, Strack N, Stumpflen V, et al.: MIPS:analysis and annotation of proteins from whole genomes.Nucleic Acids Res 2004, 32 (Database issue):D41-D44.
59. CYGD: MIPS Comprehensive Yeast Genome Database[http://mips.gsf.de/proj/yeast/CYGD/interaction]
60. Flybase [http://flybase.net]
61. Celniker SE, Wheeler DA, Kronmiller B, Carlson JW, Halpern A,Patel S, Adams M, Champe M, Dugan SP, Frise E, et al.: Finishing awhole-genome shotgun: release 3 of the Drosophila mela-nogaster euchromatic genome sequence. Genome Biol 2002,3:research0079.1-0079.14.
62. Angermayr M, Bandlow W: RIO1, an extraordinary novel pro-tein kinase. FEBS Lett 2002, 524:31-36.
63. Wallar BJ, Alberts AS: The formins: active scaffolds thatremodel the cytoskeleton. Trends Cell Biol 2003, 13:435-446.
Genome Biology 2004, 5:R96