a diversified energy portfolio
TRANSCRIPT

A Diversified Energy Portfolio
for SEWA’s Water Processes
By
Isabelle Chan
Brendan Train
Veronika Enis

A Diversified Energy Portfolio for SEWA’s
Water Processes
An Interactive Qualifying Project
submitted to the Faculty of
WORCESTER POLYTECHNIC INSTITUTE
in partial fulfilment of the requirements for the
degree of Bachelor of Science
by
Isabelle Chan
Brendan Train
Veronika Enis
Date: 11 December 2019
Report Submitted to:
Dr. AlaEldin Idris, Ms. Mayyada Al Bardan, and Mr. Waleed El Damaty
Sharjah Electricity and Water Authority
Professors Joseph Doiron and John Bergendahl
Worcester Polytechnic Institute
This report represents work of WPI undergraduate students submitted to the faculty as evidence
of a degree requirement. WPI routinely publishes these reports on its web site without editorial
or peer review. For more information about the projects program at WPI, see
http://www.wpi.edu/Academics/Projects.

Full Report: A Diversified
Energy Portfolio for SEWA’s
Water Processes
By
Isabelle Chan
Brendan Train
Veronika Enis

i
Abstract
The emirate of Sharjah is a rapidly growing region looking to decrease its carbon
footprint in a country known for its fossil fuel supplies. Sharjah Electricity and Water Authority
(SEWA), a local public works ministry, is also building new desalination plants to meet the
increasing water demand in the emirate. Our project is to create a diversified energy portfolio
including renewable energy to power its water processes. Through interviews and a series of
three surveys via the Delphi method, we learned about the advantages and disadvantages of
different renewable energy sources as well as received feedback on potential energy portfolios.
Our team then used the information gathered to build energy portfolios for both 2020 and 2050
that we recommended to SEWA to assist in increasing their renewable energy options in the
region. We suggested that SEWA increase efforts in the research and development of solar
energy, especially solar PV, and conduct a feasibility study building upon the results of our
project.

ii
Acknowledgments
We would like to thank Dr. AlaEldin Idris, Ms. Mayyada Al Bardan, and Mr. Waleed El
Damaty for answering our questions, allowing us to conduct this study, and giving us a letter of
support. Additionally, we would like to thank Eng. Othman Suroor Al Mas, for providing us with
data. We would like to thank the Sharjah Electricity and Water Authority as a whole for
sponsoring our project. We would also like to thank the American University of Sharjah (AUS)
for allowing us to stay on their campus and work in their buildings. We would also like to thank
all of our participants who were willing to be a part of our study. They were an integral part in
our studies success, we could not have done this study without them. We would also like to
thank the AUS professors, specifically, for participating in the study as well as the interviews
after Round 3. Thank you also, to Sarah Tariq and Urooj Ilyas, who helped us with data
collection and editing of the paper. Finally, we would like to express our utmost gratitude to Dr.
Joseph Doiron and Dr. John Bergendahl for advising us and supporting us throughout our study.

iii
Table of Contents
Abstract i
Acknowledgments ii
List of Figures vi
List of Tables vi
Executive Summary vii
Background vii
Methodology viii
Findings ix
Finding 1: Final Portfolio for 2020 ix
Finding 2: Final Portfolio for 2050 x
Recommendations xi
Recommendation 1: Continuation of Round 3 xi
Recommendation 2: Feasibility Study xi
Recommendation 3: Potential Research & Development xi
Conclusion xi
Chapter 1: Introduction 1
1.1: Context of the Problem 1
1.2: This Project 3
1.3: Problem Statement 6
1.4: Summary 6
Chapter 2: Literature Review 8
2.1: Project Site and Sponsor 8
2.1.1: Site Description 8
2.1.2: Agency Profile 9
2.2: Stakeholders 9
2.3: Benefits & Background of Renewable Energy 10
2.4: Power Consumption and the Desalination Process 12
2.5: Summaries of Case Studies 15
2.5.1 Renewable Energy Prospects: Ghana 15
2.5.2 Renewable Energy Prospects: Germany 17
2.5.3 Renewable Energy Prospects: Jordan 19
2.5.4: Cross-Case Analysis 21
Increasing Renewable Energy Contribution to Energy Portfolio 21
Increase Public Involvement 21
Financial Resources to Invest 22
2.6: Summary 22
Chapter 3: Methodology 24
3.1: Delphi Method 24

iv
3.2: Participant Criteria 25
3.3 Data Collection Methods 25
3.3.1: Pilot Test 26
Participants 27
Procedure 27
Anticipated Outcome 28
3.3.2: Round 1 28
Participant Recruitment, Selection, and Enrollment 28
Data Collection 28
Analysis & Round One Report 29
3.3.3: Round 2 29
Data Collection 29
Data Analysis & Round Two Report 30
3.3.4: Round 3 31
Data Collection 31
Data Analysis 32
3.4: Ethical Considerations and IRB Documentation 32
Chapter 4: Findings 33
4.1: Pilot Test 33
4.1.1: Round 1 33
4.1.2: Round 2 34
4.1.3: Round 3 36
4.2: Delphi Study 36
4.2.1: Round 1 36
Participants 36
Round 1: 2020 37
Round 1: 2050 38
Round 1: 2020 vs. 2050 39
4.2.2: Round 2 41
Participants 41
Round 2: 2020 41
Round 2: 2050 46
Round 2: 2020 vs 2050 48
4.2.3: Round 3 50
Participants 50
Round 3: 2020 51
Round 3: 2050 51
Round 3: 2020 vs. 2050 52
Round 3: Interviews 53
Chapter 5: Discussion 62

v
5.1: 2020 Discussion 63
5.2: 2050 Discussion 65
5.3: Things to Consider 68
Feasibility 68
Interpretation of “Ideal” 69
Biases 70
5.4: Limitations 70
5.5: Recommendations for Future Research 71
Recommendation 1: Continuation of Round 3 71
Recommendation 2: Feasibility Study 71
Recommendation 3: Potential Research & Development 72
Chapter 6: Conclusion 73
Appendices 76
Appendix A: IRB Consent Form 76
Appendix B: Letter of Support from SEWA 78
Appendix C: Round 1 Survey Questions 79
Appendix D: Round 1 Report 80
Appendix E: Round 2 Survey Questions 84
Appendix F: Round 2 Report 85
Appendix G: Round 3 Survey Questions 88
Appendix H: Transcript for Interview with Professor 1 90
Appendix I: Transcript for Interview with Professor 2 92
Appendix J: Transcript for Interview with Professor 3 95

vi
List of Figures
Figure 1: Predicted Population of the UAE through 2050 .............................................................. 2
Figure 2: Population of Sharjah Municipalities .............................................................................. 3
Figure 3: The Emirate of Sharjah (UAE) ........................................................................................ 8
Figure 4: Electricity Generated for Sharjah’s Water Production 2014-2018 ............................... 13
Figure 5: Round 1 Survey Question.............................................................................................. 29
Figure 6: Round 2 Survey Question (2020) .................................................................................. 30
Figure 7: Round 3 Survey Question - “No” .................................................................................. 31
Figure 8: Original Question and Options for Round 1 ................................................................. 34
Figure 9: Original Question for Round 2 ...................................................................................... 35
Figure 10: Original Question for Round 3 .................................................................................... 36
Figure 11: Number of Times each Energy Source was Picked (2020) ......................................... 38
Figure 12: Number of Times each Energy Source was Picked (2050) ......................................... 39
Figure 13: Change in Number of Votes between 2020 and 2050 ................................................. 40
Figure 14: Mean Energy Portfolio (2020) .................................................................................... 42
Figure 15: Academia vs Non-Academia (R2: 2020) .................................................................... 43
Figure 16: Academia vs Non-Academia No Importance (R2: 2020) ........................................... 45
Figure 17: Academia vs Non-Academia High Importance (R2: 2020) ........................................ 45
Figure 18: Mean Energy Portfolio (2050) .................................................................................... 46
Figure 19: Academia vs Non-Academia (R2: 2050) .................................................................... 47
Figure 20: Academia vs. Non-Academia WTE Levels (R2: 2050) .............................................. 48
Figure 21: Change in the Contribution of Energy Sources from 2020 to 2050 ............................ 49
Figure 22: Final Portfolio 2020..................................................................................................... 51
Figure 23: Final Portfolio 2050..................................................................................................... 52
Figure 24: Change in Contribution from 2020 to 2050 from Round 3 Results ............................ 53
Figure 25: Distribution of points in Round 2 (2020) .................................................................... 59
Figure 26: Distribution of points in Round 2 (2050) .................................................................... 61
List of Tables
Table 1: Contribution of the Economic Sectors in GDP for 2017 .................................................. 5
Table 2: The main goals of the Energiekonzept policy ................................................................ 17
Table 3: Relationship between investments made & capacity installed at RE sites (Jordan)....... 19
Table 4: Breakdown of Participants for Round 1 ......................................................................... 37
Table 5: Breakdown of Participants from Round 2 ...................................................................... 41
Table 6: Breakdown of Participants from Round 2 ...................................................................... 50
Table 7: Statistics of distribution of points in Round 2 (2020)..................................................... 60
Table 8: Statistics of distribution of points in Round 3 (2020)..................................................... 60
Table 9: Statistics of distribution of points in Round 2 (2050)..................................................... 61
Table 10: Statistics of distribution of points in Round 3 (2050)................................................... 62
vii
Executive Summary
Background
Many countries are starting to transition from fossil fuels to renewable energy sources to
help combat climate change. Climate change causes many problems worldwide including
temperature increases, rising sea levels, and increased concentrations of carbonate in ocean
water. For the UAE, rising sea levels are a serious danger. By 2100, it is projected that the UAE
will lose 6% of its coastline due to the increasing sea levels and the lack of sediment available in
the area. The country’s main protection against this threat is the mangrove forests at the coast.
However, due to urbanization these groves are decreasing in number. The UAE needs to join the
effort to diversify their portfolio in order to help prevent against these changes.
The UAE is a quickly developing country. Due to the arid climate, the country depends
heavily on desalination to provide drinking water. As a result, the country has become heavily
dependent on fossil fuels to meet its energy demands. As the population continues to increase,
the energy demand needed to produce water increases. The UAE is now unable to produce
enough natural gas to meet this demand, forcing the country to import natural gas from other
places. For economic and environmental reasons, the country has begun transitioning to
renewable energy sources. Diversifying the energy portfolio will allow the country to be able to
be more self-reliant and environmentally friendly.
Sharjah is one of the emirates that has not begun the process of transitioning to a new
energy portfolio. The current energy portfolio is 100% natural gas, with oil as reserve. The
emirate is the third largest in the UAE, with a population of 1.4 million people as of 2015. Like
UAE, the population of Sharjah is increasing dramatically, and to meet the increased water
demand the emirate is building a new desalination plant. Sharjah Electricity and Water Authority

viii
(SEWA) is the governing body that provides water and electricity to the emirate. SEWA is
looking to incorporate renewable energy to meet this increased energy demand. Our study aims
to help SEWA create a diversified energy portfolio including renewable energy to power its
water processes.
Methodology
We used the Delphi method to conduct our project due to this being a policy study
focused on a technical subject. The Delphi method uses a set of surveys sent to experts to narrow
down an answer that generates consensus and divergence. Round one asks broader questions to
get the participants to start thinking about the subject of the study. Using the answers obtained
from round one, a second survey is sent out to narrow down the scope of the study. After the data
is obtained from round two, the most common answer is sent out in round three asking if the
participants agree or disagree and their explanation as to why.
In order to test our surveys before they were sent out, we asked a few experts from
Worcester Polytechnic Institute to take the questionnaires to confirm there were no errors and
that the questions we had were worded in the best and most accurate way possible. Based on
their comments, we attempted to make sure each round was easy to understand and error free
before sending them out to the participants.
In Round 1, we asked participants to provide a general idea of the energy sources they
would like to include in an ideal diversified energy portfolio and to explain their answers for
both a 2020 portfolio and a 2050 portfolio. Then, using thematic coding, we chose explanations
that best summarizes the views of the survey pool to present in the report of Round 1. The report
was sent out with Round 2 offered the experts a chance to learn from their peers.

ix
Before taking the Round 2 survey, participants were asked to look at the Round 1 report.
In the survey, we asked the participants to assign each energy source a number of points based
on how much they wanted that source to contribute to energy portfolios for 2020 and 2050. We
planned to create an average portfolio from the answers we received. We found the average of
the points for each option as well as analyzed the explanations regarding their choices again. Our
findings from Round 2 were presented alongside the survey for Round 3.
For Round 3, survey takers were instructed to read through the report before completing
the questionnaires again. Then, survey participants were asked to decide if the portfolio
presented to them was ideal for Sharjah for both 2020 and 2050. If they did not believe the
portfolio was optimal then they were asked to create a new portfolio using the energy sources
they were presented in Round 2. It was important that the participants were able to come to a
consensus on an energy profile because the goal of this survey was to arrive at a consensus
among the experts about an energy portfolio.
Findings
Finding 1: Final Portfolio for 2020
The energy portfolio for 2020 can be found in Figure A below. Natural gas was given an
average of 43 out of 100 points. After natural gas comes oil with an average of 21 points. Next,
comes solar PV energy with an average of 19 points. Then, waste-to-energy with an average of 6
points and solar CSP with an average of 5 points, followed by solar thermal with an average of 4
points and offshore wind turbines with an average of 1 point. Inland wind turbines comes last
with an average of 1 point of the overall portfolio.

x
Figure A: Final Portfolio 2020
Finding 2: Final Portfolio for 2050
Figure B shows the final portfolio for 2050. Solar PV was given an average of 40 out of
100 points for the final portfolio for 2050. Next, solar CSP was given an average of 15 points.
After solar CSP, natural gas was given an average of 12 points. Then, waste-to-energy with an
average of 9 points. After WTE, nuclear was given an average of 8 points. Then, solar thermal
energy with an average of 7 points. Following solar thermal energy comes offshore wind
turbines with an average of 4 points. Then, oil with an average of 3 points. Finally comes
standard inland wind turbines with an average of 2 points of the final portfolio for 2050.
Figure B: Final Portfolio 2050

xi
Recommendations
Recommendation 1: Continuation of Round 3
Round 3 could be repeated with different groups of experts in order to obtain a more
thorough portfolio. By adding another diverse group of participants, the response would reflect
the opinions of a wider group of experts. This could be repeated as many times as necessary in
order to obtain a consensus among a wide group of experts.
Recommendation 2: Feasibility Study
Our ideal study gives SEWA a very optimistic goal to aim for. We advise SEWA to
conduct a feasibility study to find what portfolio experts believe would be a plausible goal for
SEWA to aim for in the future. This feasibility study could be structured similarly to this study
but use the world “feasibility” instead of “ideal” when asking about the portfolios.
Recommendation 3: Potential Research & Development
SEWA may also look at these portfolios as a prioritizing tool. The portfolios can be used
to help decide where to invest research and development efforts. For example, because solar PV
was predicted to have a high contribution, it may be wise to prioritize efforts in R&D regarding
solar PV to further advance the technology and make it more cost-effective in the futures.
Conclusion
In 2020, we recommend that the energy portfolio remain mainly fossil fuels. Solar energy
has the greatest potential for being a substantial contributor to SEWA’s energy portfolios. Even
in 2020, without many technological advancements, solar PV was found to be the most
economically feasible out of all the renewable energy options. WTE should also be considered to
also act as a method of waste management.

xii
In 2050, solar PV and solar CSP are the main contributors to the energy portfolio. By
2050, innovations should render these technologies more efficient and lower in costs. Natural gas
should remain a small part of the energy portfolio due to its extremely low costs and
accessibility. Nuclear, while an efficient means of producing energy, faces several concerns
relating to safety and area needed for installation. If wind turbines become cost-efficient in the
near future, we recommend placing them offshore in Sharjah’s areas on the Gulf of Oman.
Our recommendations and suggestions from this study reflect the opinions of several
different experts in the field of renewable energy and energy production. Our analysis has shown
that solar energy has the strongest potential out of all the renewable energy options to be a major
contributor to SEWA’s energy for its water processes. Fossil fuels should still comprise a portion
of the 2050 energy portfolio due to its reliability and its accessibility. However, the nature of this
study attempted to focus on ideal portfolios for these year.

1
Chapter 1: Introduction
1.1: Context of the Problem
Countries everywhere face the challenge of generating enough energy for the public
while lowering carbon emissions due to the impact of fossil fuel consumption on the
environment. One country that has already taken initiative to implement more renewable energy
practices is the UAE, a nation known for its abundant fossil fuel supply. With time, there have
been several technological improvements in different types of clean energy technology, making
alternative options more cost-efficient and accessible. Additionally, due to the climate and
environment of the UAE, a large amount of energy is spent on processing the country’s water
supply in order to be ready for public use. Currently, the country primarily uses fossil fuels,
which release greenhouse gases that contribute to climate change throughout the world.
Climate change caused by greenhouse gases provides ongoing problems that threaten the
environment of the planet, such rising sea levels. For the UAE and other coastal countries, rising
sea levels present a danger to coastal infrastructure as well as native animal and plant species.
Unlike many countries, the UAE lacks the type of soil that is carried and deposited by ocean
currents along the shore, which helps prevent coastal flooding. Studies have found that along the
Arabian Peninsula, the wetlands and mangrove trees are very important for protection against
flooding due to sea level rise. Urbanization has resulted in damage and destruction of many of
these areas, reducing the protection against coastal flooding (Sandre et.al, 2018). For this reason,
countries around the world are starting to implement policies to increase the amount of clean
energy generated in order to reduce greenhouse gases and slow the effects of climate change.
The UAE has experienced a large population increase since its founding. In 1971, the
population was a little under 300,000. In the present day, the population stands at 9.4 million, 31

2
times larger than in 1971. This number is expected to increase, according to the World Data
Bank. The population is predicted to climb up to 10.6 million for 2030 as seen below in Figure 1
(World Bank Group, 2019).
Figure 1: Predicted Population of the UAE through 2050
In a 2015 census conducted by the Department of Statistics and Community
Development in Sharjah (DSCD), they found that more than 1.4 million people live in the
emirate of Sharjah alone. 90% of the population, almost 1.3 million people, reside in Sharjah
city, resulting in a population density of 5143 people per square kilometer. As with any growing
population, the electricity and water demand of the emirate will increase as a result (The Editor,
2017).

3
Figure 2: Population of Sharjah Municipalities
Reprinted from Sharjah Update, by The Editor, 2017, Retrieved from
http://www.sharjahupdate.com/2017/01/sharjah-census-2015-results-announced-sharjah-population-reaches-1-4-
million/ Copyright 2017 by Sharjah Update
1.2: This Project
The UAE has become dependent on oil and gas resources due to the location of the
country and its availability. However, the increase in energy demands due to the increased
population means that the amount of natural gas needed is higher than the amount it produces,
making it an importer of the resource. The natural gas produced in the country also needs to be
treated due to its high Sulphur content, making it more difficult for the country to produce
enough. Along with the potentially increased prices of exports the UAE will potentially face in
the future due to increased international tensions, this represents a large cost to the UAE
economically. These present both security and economic problems to the country (Masdar
Institute of Science and Technology & International Renewable Energy Agency, 2015).
Aside from its plentiful reserves of oil and natural gas and its quickly increasing
population size, the UAE is also well known for its rapidly growing and developing economy,

4
especially its growth from the past 30 years. The country’s economy ranks high in terms of GDP
per capita, human development, and energy consumption per capita (Al-Mulali & Che Sab,
2018). From 2016 to 2017, the UAE’s GDP increased by 0.8%. However, oil and natural gas
contributed the most to the GDP as presented in Table 1 below. This shows that the UAE is still
highly dependent on oil and gas as part of their economy. InIn 2012, the Green Economy
Initiative was launched by Sheikh Mohammed with the plan of both further developing the
country’s economy and becoming a more environmentally friendly nation. This initiative
included encouraging investments in renewable energy and the development of other green
technologies. In order to maintain the twin goals of economic growth and reduction of fossil fuel
consumption, local energy and water authorities like SEWA must consider diversifying their
energy portfolio with renewable energy options (The Official Portal of the UAE Government,
2019).

5
Economic sector Sector contribution to
the GDP for 2017 (%)
(Extractive Industries (including Crude Oil and Natural Gas 29.5
Wholesale and Retail Trade; Repair of Motor Vehicles and
Motorcycles
11.7
Financial and Insurance Activities 8.6
Construction and Building 8.4
Transformative Industries 8.3
Public Administration and Defense; Compulsory Social Security 5.8
Real Estate Activities 5.7
Transport and Storage 5.4
Electricity, Gas and Water 3.2
Information and Communications 2.9
Professional, Scientific and Technical Activities 2.6
Accommodation and Food Services Activities 2.2
Administrative and Support Services Activities 1.9
Other sectors 3.9
Table 1: Contribution of the Economic Sectors in GDP for 2017
Adapted from The Official Portal of the UAE Government, by UAE Government, 2018, Retrieved from
https://www.government.ae/en/about-the-uae/economy. Copyright 2019 by Government.ae.
As a country, the UAE has plans to obtain its energy from 12% clean coal, 38% gas, 6%
nuclear, and 44% renewable energy by the year 2050. Currently, the clean energy efforts in the
UAE are primarily centered in Dubai and Abu Dhabi. The largest source of renewable energy in
the UAE is solar power. Solar panels are used by residents and businesses alike in Dubai and
Abu Dhabi due to the initiatives that allow solar panels to be installed on one’s property in
exchange for reduced electricity bills, with Dubai having installed solar panels on 1,354
buildings as of October 2019. The UAE also has multiple large solar parks and projects and
plans to build more. The electricity is used on site and the surplus is exported to the emirates’
electrical network. Along with solar power, the UAE has plans for nuclear power plants. With

6
the help of US financing, four nuclear power plants are intended to be constructed in 2020, 2021,
2022, and 2023 in Abu Dhabi, where it is feasible due to the large land area (International Trade
Administration, 2019). While Sharjah doesn’t have the resources available for some of these
methods, others could be potential energy sources for the emirate.
Research concerning the potential of wind energy has been done for the emirate of
Sharjah. A study used 16 different types of wind turbines to find the most efficient models for a
wind park in Sharjah when considering several factors such as energy output and the price of
power generation. Models with higher hubs performed better, due to the higher speed of wind
found at their respective elevations. Despite the increased elevation, the wind speeds were still
quite low, with an average speed of around 3.64 m/s at 10 m. Due to these slower wind speeds,
models with lower rated wind speeds worked more effectively than those with high wind speeds
(Al-Tajer & Poullikkas, 2015). In spite of the low wind speeds in the emirate, this study shows
that there is potential for this energy types in Sharjah, making it a candidate for powering
SEWA’s water processes.
1.3: Problem Statement
SEWA is looking to create a diversified energy portfolio for their water processes that
includes renewable energy. WPI-AUS students will work with the appropriate SEWA
department to identify which potential renewable energy sources are most appropriate for
Sharjah.
1.4: Summary
In this chapter we looked at the context of the problem, our project, and our problem
statement. We looked at the climate and population of the UAE and Sharjah specifically. In

7
addition, we examined the available energy technologies for the UAE and introduced our
problem statement.
In chapter two we provide more detail concerning the background of our project. We
explain who our sponsor is and present some background specifically about renewable energy
technologies. We then go over a few case studies to inquire about renewable energy policies. In
chapter three, we explain the methodology of our project, our data collection, and how we will
analyze our findings. In chapter four, we look at our findings from each round of our project. In
chapter five, we analyze our findings from chapter 4 and find common trends among data.
Finally, chapter six is our conclusion and we talk about where to go in the future regarding our
project.

8
Chapter 2: Literature Review
2.1: Project Site and Sponsor
2.1.1: Site Description
Figure 3: The Emirate of Sharjah (UAE)
Adapted from “Dhaid, ” by M. Dörrbecker, 2018, 2018, May 6, Wikipedia. Retrieved Sept 12, 2019, from
https://en.wikipedia.org/wiki/Dhaid.
Sharjah is the third largest emirate in the UAE with a population of 1.41 million people
as of 2015 and an area of 2590 square kilometers (The Editor, 2017). It is located in the northern
region of the UAE and has land on both the western coast (Arabian Gulf) and eastern coast (Gulf
of Oman). Within Sharjah, there are five major cities: Khorfakkan, a port city, Kalba, a historic
hub, Dibba, a set of coastal villages, Al Dhaid, the agricultural center of the UAE, and Al
Badayer, a popular desert area. Sharjah is also well-known for being a cultural hub. Because the
emirate is only a short drive from Dubai and rich with the arts, tourism is a substantial part of

9
their economy. It is home to almost 25% of all museums in the UAE, including the Sharjah
Museum of Islamic Civilization. Sharjah is ruled by His Highness Sheikh Dr. Sultan bin
Muhammad Al Qasami, whose family has ruled since 1600AD (The Official Portal of the UAE
Government, 2019).
2.1.2: Agency Profile
The UAE government supplies water and electricity to its people through four different
authorities: Federal Electricity & Water Authority (FEWA), Abu Dhabi Electricity & Water
Authority (ADWEA), Dubai Electricity & Water Authority (DEWA), and our sponsor, Sharjah
Electricity & Water Authority (SEWA). SEWA aims to provide the necessary resources to the
public while also engaging in sustainable practices to preserve the environment. In order to help
preserve the environment and follow in the rest of the UAE’s footsteps, SEWA has turned
toward generating electricity using renewable energy sources (SEWA, 2019).
2.2: Stakeholders
SEWA is the main stakeholder of our project. The authority is looking to provide
drinkable water for Sharjah’s residents through more sustainable means. SEWA is invested in the
results of this project as they believe the findings from our study will be useful in making
decisions concerning what renewable energy options to use in the future. To accommodate for
the increase in water needs and the desire to shift away from fossil fuels, SEWA needs a wider
variety of energy sources to produce potable water. As a result of their investment in our project,
they have given us access to some of their data as well as members of their engineering team,
hoping that these resources will help us in our study.
A less direct stakeholder is the UAE government. The UAE government’s oversight is
larger than SEWA, so they might like to see what other effects our analysis might have. For

10
example, they might be involved because several studies have proven that energy consumption
and economic growth are very closely related (Keček, Mikulić, & Lovrinčević, 2019). By 2050,
the UAE also hopes to create over 90,000 jobs in the renewable energy field. The goal to
experience an increase in renewable energy related jobs for economic growth puts the federal
government in a position to be a stakeholder in this project (International Trade Administration,
2019).
2.3: Benefits & Background of Renewable Energy
Modern power distribution systems made energy reliably available and relatively
independent from energy plant location. More than two centuries of past industrialization took
advantage of non-renewable energy resources, often with undesirable side effects such as
pollution and other damages to the environment. Extraction from nuclear energy grew in
popularity in the second half of the 20th century, relieving some demands on limited fossil fuel
reserves. The most common renewable energy systems worldwide are hydroelectric, solar PV,
and wind. In 2007, the world's renewable energy production share was calculated to be 19%.
Approximately 16% was due to hydroelectric energy production. Wind and PV energy
production, the two most promising renewable energy resources, was still very modest. The wind
energy production forecast for 2011 was more than 200 GW and, despite the silicon shortages in
years prior, the PV industry is growing at more than 30% per year. Other emerging renewable
technologies include wave and tidal energy conversion, biomass energy conversion, and small
scale hydroelectric plants (Liserre, Sauter, & Hung, 2010). By the end of 2018, renewable energy
production equated to 26% of global energy production. This increase is driven by targets and
stable policies (GSR, 2019).

11
Solar cells directly convert the sun’s energy into electricity without any moving parts.
This includes solar CSP and solar PV. CSP uses mirrors and/or lenses in order to concentrate
solar power, which can then be converted to heat and electricity. PV devices such as solar panels
use semiconductor cells in order to convert solar energy into electricity. The ocean is Earth’s
largest collector of solar energy, and ocean thermal platforms have a large potential for
electricity generation. The UAE has a number of viable solar energy options to choose from. In
addition to solar energy, the UAE could explore using wind energy technologies. Wind energy
represents the most cost-competitive renewable energy source in most countries. Regarding the
UAE, solar energy is the most promising energy source due to extremely sunny conditions year-
round. Wind as an energy source can be used anywhere in the world and represents a dual-use
technology: the land under the wind turbines can still be used for farming, ranching, and forestry.
Biomass power ranges from burning wood chips in power plants to burning biogas from waste
treatment plants to generate methanol and ethanol, which can be used as fuels (Turner, 1999).
There is a connection between renewable energy and sustainable development.
Environmental issues humans face today need long-term solutions for sustainable development.
Environmental problems span a continuously growing range of pollutants, hazards, and
ecosystem degradation. Renewable energy technologies produce marketable energy by
converting natural phenomena into useful energy forms. These technologies use the energy
present in sunlight and its direct and indirect impacts on Earth, gravitational forces, and the heat
from the Earth’s core as the resources from which they produce energy. These renewable energy
technologies use resources that are readily available, infinite, and have little to no negative
environmental impact. These resources represent a massive energy potential which mimics that
of equivalent fossil resources. Renewable energy technologies become important as

12
environmental concerns increase, utility costs climb, and labor costs rise. Renewable energy
technologies require a low operating cost whereas fossil-based technologies require a high
operating cost. Development of advanced renewable energy technologies can serve as cost-
effective and environmentally responsible alternatives to conventional energy generation
(Dincer, 2000).
2.4: Power Consumption and the Desalination Process
Because the UAE is a constantly growing country, more power is needed to meet the
needs of the people as the population increases. Air conditioning and clean water processing are
two of the main factors as to why the UAE has one of the highest electricity consumption per
capita (Sgouridis et al., 2016). Presently, Sharjah has a desalination capacity of 115 million
Imperial gallons per day (MIGD). As seen in Figure 4, the electricity generated for water
production has slowly declined in the past three years. However, there is a drastic rise between
2014 and 2015 due to the installation of the latest desalination plant in Hamriyah. The amount of
electricity generated will experience a similar surge in the coming years once the new 60 MIGD
capacity desalination plant opens in 2020 (SEWA Research and Studies Department, 2019).

13
Figure 4: Electricity Generated for Sharjah’s Water Production 2014-2018
In 2010, electricity and desalination accounted for around 36% of the UAE’s total natural
gas consumption (Said, Alshehhi, & Mehmood, 2018). In 2018, because of Sharjah’s extremely
arid climate, only about 10% of their water supply came from groundwater. The rest of the water
that they produced had to be taken from the sea and brackish water and desalinated in one of
SEWA’s nine processing facilities (SEWA Research and Studies Department, 2019).
Currently, a major concern for incorporating more renewable energy into the current
energy portfolio is dealing with the dependence of water processing methods on electricity
generation. This is because most of the water is desalinated using heat for thermal cogeneration
plants, where excess heat is repurposed. In water processing, the excess heat is used for the heat
needed in multi-stage-flash (MSF) desalination (Masdar Institute of Science and Technology &
International Renewable Energy Agency, 2015). About 95% of the UAE’s desalination plants
process water by thermal desalination using MSF technology. Since most renewable energy

14
sources will only directly generate electricity, they must be able to provide enough energy to
produce the heat needed for MSF desalination while maintaining both cost efficiency and
production capacity of fossil-fuel powered plants.
While MSF has a high installed capacity, it is much less efficient than reverse-osmosis
(RO) plants (Sgouridis et al., 2016). There are already six desalination plants using RO that
process their water on the Gulf of Oman where salinity is relatively low. If attempts were made
to desalinate water in higher salinity areas, a higher amount of waste brine should be expected.
This may be a concern as the brine may contain toxic chemicals leftover from previous stages of
the desalination process. Despite the fact that RO technology is much harder to maintain, it has
great potential to be powered by clean energy sources because RO technology requires less
power (Masdar Institute of Science and Technology & International Renewable Energy Agency,
2015).
Sharjah plans to build a new desalination plant due to its anticipated 2022 population
boom. SEWA is exploring possible renewable energy sources to use when powering the new
desalination plant to reduce the region’s reliance on fossil fuels. The plant will function on the
basis of reverse osmosis technology, a less energy-intensive method of desalinating seawater
(Gnana, 2019). A typical reverse osmosis desalination plant consumes 10-13kWh per every 1000
US gallons. As Sharjah’s new desalination plant is expected to have a capacity of 60 million
imperial gallons per day, this will amount to an energy consumption of at least 720MWh per day.
Implementing some renewable energy sources into its energy portfolio will assist SEWA in
offsetting some of the CO2 emissions that may accompany this increase in energy consumption
(Peterson, 2017).

15
2.5: Summaries of Case Studies
In this section we review three case studies regarding renewable energy technologies to
assist in determining possible problems we may encounter as part of this policy study. In the first
case study, we discuss Ghana’s struggles to move toward an energy portfolio supported by
renewable energy. The second case study we review is about the use of renewable energy in
Germany. The study examines the implementation of an energy transition policy to switch over
to renewable energy sources. In the final case study we review, we explore the renewable energy
technologies in Jordan. Jordan has experimented with renewable energy but due to the lack of
investment in the entire system, they have not been able to optimize its usage.
2.5.1 Renewable Energy Prospects: Ghana
Ghana has a number of natural resources that can be used to power different types of
renewable energy including solar, wind, biomass, and hydroelectric. Despite the abundance of
resources, Ghana lacks the policies and regulations that can allow them to truly take advantage of
what they have. The country aimed to have renewable energy contributed to at least 10% of the
national grid’s electricity by 2020. Ghana also plans on increasing access to renewable energy,
effectively monitoring the importation and local production of renewable energy technology, as
well as developing sustainable markets for renewable energy (Gboney, 2009).
To help achieve its goals, Ghana established the Energy Commission (EC), the Public
Utilities Regulatory Commission (PURC), and Energy Federation (EF) in 1997. The EC
recommends the development and utilization of Ghana’s natural resources develops renewable
energy regulatory and legislative framework. It also acts as a principal advisor to Ghana’s
Ministry of Energy. The EC’s work ensures that the more renewable energy will be incorporated
into Ghana’s energy portfolio. The PURC is responsible for regulating the distribution of

16
renewable energy technologies. That is, it facilitates the renewable energy technologies’
connection to the national grid. Additionally, it is also responsible for regulating prices and
quality of service. Lastly, the EF promotes the development of energy efficiency and providing
consumers with energy solutions. The already-existing Ministry of Energy is responsible for
creating policies for the energy sector (Gboney, 2009).
Several obstacles slowed or hindered the effects of the above policies. The majority of
the problems encountered were either financial or regulation-based. For example, there is a lack
of favorable pricing framework for renewable energy technology. The 2008 pricing approach
failed to address the benefits renewable energy could provide for the environment, favoring the
conventional fossil fuel based energy production methods. Additionally, there is a severe lack of
information for renewable energy technology consumers to make well-informed decisions and
many investors are unable to secure the capital to invest in this technology (Gboney, 2009).
There are also many assumptions people make about renewable energy technologies that
deter them from becoming supporters of clean energy implementation. Upfront, the cost of
renewable energy is typically much higher than that of fossil fuels. People also tend to believe
that these technologies are risky and unreliable. As time goes on, innovations in renewable
energy make for more reliable equipment, eliminating this belief. Poor access to capital as well
as the high costs associated with investing deter people from renewable energy. For example,
people of low income in rural areas who may need access to electricity the most typically cannot
afford the cost of purchasing and installing renewable energy generators. Additionally, a lack of
government incentives and outreach to communities promoting renewable energy hinder the
growth of renewable energy access. In order to effectively implement these technologies, the
public must also be invested in using renewable energy. Communities must further be educated

17
on these matters and encouraged to develop the systems, regulate the framework for the systems,
and manage the system. A combination of financial help combined with outreach to encourage
people to be more invested in renewable energy technologies will push Ghana towards
incorporating more green energy in the country’s energy portfolio (Gboney, 2009).
2.5.2 Renewable Energy Prospects: Germany
Germany is seen as a leader in renewable energy efforts, due to their energy transition
policy adopted in 2010, called Energiekonzept. This policy sets long term goals for the country
to change its energy sources to renewable and environmentally friendly sources rather than fossil
fuels. The goals have changed while the policy has been in place, but the current goals can be
seen in the table below (Kuittinen & Velte, 2018).
Table 2: The main goals of the Energiekonzept policy
Adapted from “Case Study Report:Energiewende,” by H.Kuittinen & D. Velte, 2018, 2018, January , European
Commision. Retrieved Sept 13, 2019, from
https://ec.europa.eu/info/sites/info/files/mission_oriented_r_and_i_policies_case_study_report_energiewende-
de.pdf
These reforms are backed both by political parties and the public. There are multiple
driving forces behind this movement, which include environmental concerns, concerns for safe

18
and sustainable energy sources, and the desire to be less dependent on imports. According to
surveys, most of the German population feels strongly about climate change and how it affects
the environment, along with their sense of duty to make an effort to protect the planet. Germans
have also been against using nuclear power for decades, aiming to shut down all nuclear power
plants in the country by 2032. However, the 2011 nuclear accident in Fukushima, Japan in which
an earthquake and tsunami caused three nuclear cores to melt down spurred the passing of a law
requiring all nuclear power plants to cease operation by 2022 (Kuittinen & Velte, 2018).
All levels of government participate in efforts for this project. At the federal level, the
Ministry for Economic Affairs and Energy is the branch in charge of this transition away from
nuclear power. The regional presidents in charge meet with the federal government to discuss the
efforts and outcomes. Along with these groups, other branches of the government coordinate
their own efforts that relate to this initiative. While this works well with communication, some
people believe that having a horizontal system can lead to disconnects among the different
regions (Kuittinen & Velte, 2018).
The cost of these reforms cannot be calculated very accurately due to the complexity.
Some critics say that the costs are primarily paid by the consumers, due to the extra tariff prices
that cause higher electric bills. The price of power has increased by 50% in 2018 when compared
to 2007. However, this switch offers opportunities for new jobs. Germany is the leader in Europe
when it comes to the number of jobs in the renewable energy market sector, causing the
transition to produce both financial costs and financial benefits (Kuittinen & Velte, 2018).
German greenhouse gas emissions have decreased by 27% since 1990. However, since
2016 emissions have been on the increase. This is thought to be due to lack of gas emission
reductions in the transportation, power, industrial, and heating industries. By reducing nuclear

19
power and simultaneously dealing with increased energy demands, conventional energy sources
have not decreased in quantity, making the greenhouse gas emissions the same (Kuittinen &
Velte, 2018).
2.5.3 Renewable Energy Prospects: Jordan
Jordan has been at the forefront of renewable energy deployment in the Middle East, with
the sector accounting for 7.9% of the country’s total electricity generation in 2018 compared to
2% in 2013. Jordan aims for around 20% of the energy mix to come from renewables by 2020.
Yet, challenges hindering the upscaling of renewables are multiplying as the sector gains
momentum. Being an early adopter of renewables, Jordan’s experience should serve as lessons
both for economies in the region and developing countries around the world (Obeid, 2019).
Table 3: Relationship between investments made & capacity installed at RE sites (Jordan)
Adapted from: “Jordan: A case study in expanding renewable energy” by Jessica Obied
Jordan is a highly indebted economy and heavily reliant on fossil fuels. Violent conflicts
have disrupted the fuel supply over different periods in the past 16 years, revealing the fragility
of the kingdom’s energy security. To improve energy security and lessen the economic burden,
in 2012 Jordan put in place a phased removal of fuel and electricity subsidies, and adopted

20
aggressive renewable energy targets to mitigate its dependency on fossil fuels. Since 2007
renewable energy had been a central energy policy, with the authorities pledging to increase the
sector’s share in the energy mix to 10% by 2020, a goal which was modified in 2018 to 20%. In
2012, the kingdom became the first country in the region to develop a regulatory framework for
the sector, through issuance of the Renewable Energy and Energy Efficiency Law (REEEL) No.
13. It has adopted net-metering and power wheeling policies to facilitate the deployment of small
scale wind and solar projects and invested heavily in utility scale projects. In 2018, the country
was ranked as having the third most attractive environment for renewable energy investment
among developing countries by the Bloomberg Climatescope Index (Obeid, 2019).
The cost of developing many of the thermal projects and early renewable energy plants is
higher than in other countries in the region, which hinders the government’s ability to decrease
electricity tariffs. While the government has been focusing on attracting renewable energy
projects, it has neglected the status of the grid, the balance and flexibility of the system, control
and demand side management, and energy storage. The lack of investment in the grid is a key
barrier to increase renewable energy generation. The kingdom has focused on two types of
renewable energy technologies: solar photovoltaic and wind farms. While focusing on these
energy technologies, the kingdom has failed to focus on energy storage. Without having storage,
the excess energy created will go to waste (Obeid, 2019).
Jordan is not a success story yet, but the challenges it has faced are a learning case for
other developing countries. The intermittency of renewables will become an increasingly
significant challenge for the electrical grid as renewables cross the 10% threshold of the primary
energy mix. This will require costly system balancing, storage, and control. Development of the
sector cannot take place without accounting for the broader power sector in terms of the energy

21
mix, implementation of thermal generation regulations, and investment in the grid and other
components (Obeid, 2019).
2.5.4: Cross-Case Analysis
We analyzed the three case studies presented above using the cross-case analysis
technique in order to find common trends in the policies of the country, as well as the differences
and how effective they were. We will look at the similarities and differences in investment,
policies, and public opinion of transitioning to renewable energy.
Increasing Renewable Energy Contribution to Energy Portfolio
The case studies from above all aimed to increase the contribution of renewable energy to
the national energy portfolio by 2020. All countries were originally fossil fuel-based, and hoped
to use more solar power and wind energy achieve their respective goals. While Germany did not
face many financial obstacles, developing countries like Ghana and Jordan struggled mainly due
to lack of capital. The absence of financial support and regulation in the market also led to the
slow spread of renewable energy technology. Due to the lack of policies supporting renewable
energy technology in these countries, access to clean energy is difficult for those who may need
it the most, including people in areas already lacking electricity. Both Ghana and Jordan lack
investment in an energy storage system and therefore let excess energy go to waste.
Increase Public Involvement
One commonality that Germany and Ghana shared was their attempt to encourage the
public and private businesses to install renewable energy devices on their land to contribute to
the energy production. This was far more effective in Germany. The German public supports
expansion into renewable energy, with 95% of the public considering the transition to renewable
energies very important. Ghana’s biggest difficulty with convincing the public is the financial

22
cost of these technologies. These devices are more expensive than fossil fuels, and people in low
income areas can’t afford to install them. The public also trusts conventional methods more due
to their reliability. Due to outdated pricing framework, fossil fuels are typically more favored as
the pricing approach fails to account for the many health and environmental benefits that come
with renewable energy. This distancing from renewable energy translates into a public
disinterested in renewable energy technology. Without people in communities involved and
interested in implementing renewable energy, systems are less likely to be maintained and
managed.
Financial Resources to Invest
While Jordan and Ghana are considered developing countries, the UAE is not. However,
it is not at the same level of development as Germany. The UAE has the financial resources
required to invest in renewable energy as well as other energy storage systems like more
developed countries. It is easier to incorporate renewable energy technologies in areas of the
world that can afford to invest heavily into the system as a whole. This is evident when looking
at the three case studies we reviewed. Jordan and Ghana are not as capable as Germany when it
comes to investing in renewable energy technologies.
2.6: Summary
With a growing population and higher demand for water, SEWA needs more energy
options to continue to provide the public with drinkable water. SEWA already has several
desalination plants, with more to come in the near future. Because the power consumption of
desalination plants is so large, SEWA needs to determine how it can meet its future energy
demands. As part of its search for more energy production methods, SEWA hopes to power its
water processes with more renewable energy in order to step away from using finite fossil fuels

23
and reduce their carbon footprint. By incorporating more clean energy into their energy portfolio,
Sharjah is helping the UAE achieve its goal of having renewable energy contribute to 44% of the
country’s total energy mix by 2050. Doing so will also help in mitigating the effects of climate
change.
It has become apparent, however that SEWA’s goal is something that cannot be
accomplished by a single expert. Rather, we need the knowledge of several experts with
backgrounds in clean energy and powering SEWA’s water processes to create an optimal energy
portfolio. Moving forward, we will be looking into methods to gather information from these
experts to build the energy portfolio.

24
Chapter 3: Methodology
As part of the UAE's plan to become a greener and more environmentally friendly nation,
a public works authority for Sharjah, SEWA has decided to reconsider how its water processes
are powered. Currently, these processes are powered almost exclusively through fossil fuels, but
SEWA’s goal was that this project would assist in building an energy profile that will both
supply enough water to its customers while also decreasing its greenhouse gas emissions. This
included providing recommendations of green energy sources and projected relative generation
capacities of each source. The following section will review how and when we accomplished
this task, including what we accomplished each step, goals for data collection, and any problems
encountered. The objectives of this project were the following:
● Understand the advantages and disadvantages of using certain types of renewable
energy
● Create a diversified energy portfolio for SEWA’s water processes that includes
renewable energy for both 2020 and 2050
3.1: Delphi Method
We used the Delphi method to conduct our project due to this being a policy study
focused on a technical subject. The Delphi method uses a set of surveys or questionnaires sent to
experts to narrow down an answer that generates consensus and divergence. For the Delphi
method to work, round one should ask broader questions that participants answer to the best of
their abilities. Using the answers obtained from round one, a second survey is sent out with more
specific questions being asked. After the data is obtained from round two, the most common
answer is sent out in round three asking if the participants agree or disagree and their explanation

25
as to why they agree or disagree. This step can be used as many times as needed to come to a
consensus from the participants (Twin, 2019).
3.2: Participant Criteria
To conduct a Delphi study, participants in the study must be experts in the field. Our
team defined experts as people who have been studying renewable energy or energy production
or working in the industry for several years. We intended to use a variety of experts local to the
area as part of our participant pool. Professors at local universities were invited to participate in
the survey. Understanding our need for a variety of local experts, SEWA also provided a letter
supporting our study and encouraging people to take our survey. Using this letter as support, we
reached out to contacts who did not work in academia provided by SEWA and our American
University of Sharjah (AUS) partners asking them to either take the survey or distribute it to
people with the appropriate background.
Our final participants pool include professors from AUS and WPI in the chemical, civil,
electrical, environmental, and mechanical engineering departments also well as various engineers
who work in consulting firms and environmental waste management companies.
3.3 Data Collection Methods
Our goal in performing a decision-making Delphi study was to understand expert
opinions on different energy sources to propose an ideal energy portfolio and policy
recommendations for SEWA’s water processes. Because this is such a complex and technical
problem, this cannot be achieved without the knowledge and expertise of several people in the
field of energy production. The desired result from the study is a list of renewable energy
options, each with a value describing its proposed contribution to powering water processes, that
the survey-takers could generally agree upon. Not only did we need to determine which energy

26
sources would work best, we also needed to understand why they worked best to recommend
informed policy decisions. For example, responses may include why using solar PV to power
10% of the energy needed for a facility is better than using wind energy to power the same
amount.
Questionnaires and surveys were used to collect our data. The way in which we
structured the surveys meant that the answers would not be biased by the other experts opinions,
allowing any consensus to be natural agreement rather than influenced by response bias. To
collect data from the participants in this study, we used the survey software from Qualtrics.
Qualtrics offered a simple interface that also allowed for sophisticated data collection, analysis,
and reporting. The information we gathered could also be exported as a spreadsheet and
formatted for easy reporting. Qualtrics was also considered to look more professional than other
available survey software such as Google Forms. When distributing the surveys, it was critical
that we captured the attention of the participant and that they regarded our study seriously so that
they would continue to participate in all three rounds of our survey.
To obtain more detailed answers, we conducted 3 follow up interviews with AUS
professors. In these interviews, we asked for clarification for some of their answers as well as
questions aimed to obtain more detailed reasonings as to their answers. We looked for trends
among their answers in order to get a better idea of their reasonings for their responses. We also
asked for why they changed their answers and about whether the structure of the Delphi study
changed their opinions in the subsequent rounds or not.
3.3.1: Pilot Test
Pilot testing is a key component of a research study used to catch errors and give
researchers a chance to reflect on and change their procedures. In order to ensure that the surveys

27
for each round were designed properly and that the questions asked were structured in a manner
that facilitated responses from experts, we ran a pilot study with a small number of participants
before each round. Doing so would help ensure that questions were properly understood by the
experts and that we were prepared to conduct analysis on each round for the actual Delphi study.
Participants
Due to the time constraints and nature of our methodology, we enrolled WPI students and
faculty to participate in our pilot test. We believed that because members of the WPI community
were familiar with IQPs, they better understood our urgency and would be more willing to
provide prompt and meaningful responses. Because we also wanted to confirm that experts
understood our project, we reached out to members of WPI’s Renewable Energy Innovation Lab
as well as faculty members with a background in renewable energy to pilot test each round.
Procedure
Before we sent the surveys for each round in the Delphi study, we asked various people
to take the questionnaires in order to confirm there were no errors and that the questions we had
were worded in the best and most accurate way possible. The pilot test for Round 1 was sent out
after the pilot tester agreed to participate. This meant anywhere from a couple of weeks to a few
days before the official distribution of Round 1. The pilot tests for Rounds 2 and 3 were sent out
a few days after we received responses from Rounds 1 and 2, respectively, so that we had a mock
report of the previous round to present to the pilot testers, allowing the pilot test to resemble the
actual Delphi study as closely as possible. As with the actual study, links to each of the surveys
were sent to the pilot testers. They were asked to complete the questionnaire and inform us if
they encountered anything that may cause confusion. If major changes were made to the survey,
we would reach out to pilot testers again and see if their answer would have changed.

28
Anticipated Outcome
We expected the pilot testers to find some parts of the survey that were worded poorly or
difficult to understand. Based on their comments, we planned to edit the survey in order to make
sure that when the final survey was sent out the participants were able to understand what was
being asked of them.
3.3.2: Round 1
Participant Recruitment, Selection, and Enrollment
Prior to arriving to Sharjah, we compiled a list of professors from AUS and University of
Sharjah who have a background in the field of renewable energy. We also compiled a list of
companies in the area who had sections that worked with energy generation or water processes.
When arriving to Sharjah, we visited the professors in AUS to explain our project and ask for
their participation. We were also given a list of businesses that SEWA recommended we contact,
along with a letter from SEWA endorsing our project. Those who we deemed to have an
appropriate background were sent the Round One link through email, and those who responded
were sent the subsequent surveys.
Data Collection
We created all our surveys using Qualtrics. The survey was sent out through email to the
experts we wanted to participate in our study. After two days we sent a follow up email to the
experts who had not answered the survey. The final day the survey was open we sent one last
reminder email to the experts that had not answered the survey. We left the survey open for a
few days after for those who may have wanted to answer but didn’t have time, and after a few
days we closed the survey.

29
Figure 5: Round 1 Survey Question
Analysis & Round One Report
In the first round we looked at the results and selected the most common energy options.
Analyzing the data we received in the first round was key in creating the questionnaire for the
following round. Using thematic coding, we chose explanations that best summarizes the views
of the survey pool to present in the report of Round 1 accompanying the second round. Google
Sheets was also utilized to further analyze the data and as a thematic coding assistant through its
conditional formatting tools.
3.3.3: Round 2
Data Collection
A link to Round 2 and PDF of the Round 1 report were emailed to the participants that
completed Round 1. Before participants filled out Round 2, people were asked to read through
the report of Round 1. Using a constant sum survey, survey takers were asked to allocate exactly

30
100 points to different renewable energy sources based on how much they expected each energy
source to contribute to the portfolio. Additionally, participants were asked to explain the
reasoning behind their choices.
Figure 6: Round 2 Survey Question (2020)
Data Analysis & Round Two Report
We created a mean portfolio from the answers we received. We found the average and
standard deviation of the points for each option as well as analyzed the explanations regarding
their choices again. We used Google Sheets and Microsoft Excel to create a table with the
averages of each energy source. We then created a pie chart showing the mean portfolio using
the table we created. Selection of explanations to be presented in the report of Round 2 were
dependent on the argument presented and how strongly the argument was defended.

31
3.3.4: Round 3
Data Collection
Our findings from Round 2 were presented alongside the survey for Round 3. The link to
Round 3 and a PDF of the Round 2 report were emailed to people who completed the Round 2
survey. Survey takers were again instructed to read through the report before completing the
questionnaires. Then, survey participants were asked to decide if the portfolio presented to them
was optimal for Sharjah for both 2020 and 2050. If they did not believe the portfolio was ideal,
then they were asked to create a new portfolio with the same energy sources from Round 2,
without an OTHER category, and explain the reasoning behind their new portfolio. If they did
believe the portfolio was optimal, they were asked to explain why.
Figure 7: Round 3 Survey Question - “No”

32
Data Analysis
Because the goal of this survey was to create a portfolio, it was important that the
participants were able to come to a consensus on an energy profile. However, we needed to also
see that opinions of the minority were heard to encourage survey participants to consider all
options. The goal of this round was to take people’s opinions on the portfolio created from
Round 2 and adjust it based on the responses. However, because people who agreed with the
portfolio did not input any new point values for the contributions of each energy source, we
substituted the point values for each energy source with those found in that year’s portfolio. For
example, consider the scenario in which a survey taker agreed with an energy portfolio. If the
contribution from energy sources A, B, and C in the Round 2 portfolio were 20, 30, and 50%,
then in our calculations for the final portfolio, we treated this response as if the participant
answered “No” to the main question and allocated 20, 30, and 50 points to energy options A, B,
and C. This final portfolio was then presented as a final deliverable.
3.4: Ethical Considerations and IRB Documentation
This project did not present any risks to the participant. Their data was kept confidential
by using an anonymous feature of Qualtrics which allowed the responses to be anonymous and
unable to be traced back to the participant that had filled the form out. The questions that we
asked were questions one may expect as an engineer, professor, or manufacturing position level
executive to receive in their daily life.

33
Chapter 4: Findings
In the following sections, we will discuss the results from each of the rounds. Each round
will be divided into a breakdown of the participants, and the reporting of findings from both the
2020 questions and the 2050 questions. We will report the most popular and least popular energy
sources as well as energy sources with the largest contributions and smallest contributions for
each energy portfolio. Additionally, we will highlight a few explanations that best summarizes
trends in people’s reasoning.
4.1: Pilot Test
In the section below, we reflect on our survey design and what steps we took to ensure
proper understanding of questions. We will discuss changes made to the original surveys after
conducting the pilot tests for each round. This is an important process in our study to ensure
utmost understanding of our questions for each round.
4.1.1: Round 1
When pilot testing Round 1, we learned that our original idea of including a large amount
of specific energy types made it difficult for the experts to select choices. Our first pilot tester let
us know that they were not familiar with some of the very specific energy sources, such as
Orimulsion, despite having many years of experience in the field. We realized that this may
occur with other experts and condensed the list of energy types into general categories, which we
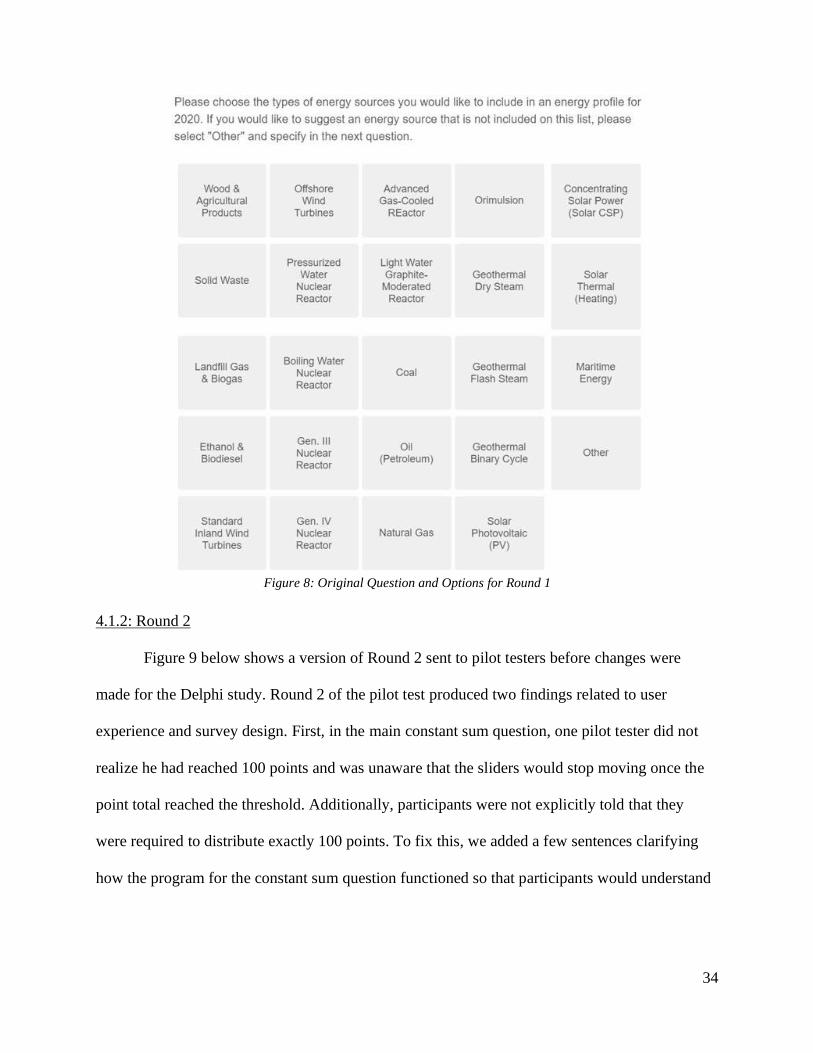
implemented in the round prior to sending it to the experts. Figure 8, below, shows the original
copy of the Round 1 survey prior to condensing it into general categories to show how detailed
the energy types originally were.
34
Figure 8: Original Question and Options for Round 1
4.1.2: Round 2
Figure 9 below shows a version of Round 2 sent to pilot testers before changes were
made for the Delphi study. Round 2 of the pilot test produced two findings related to user
experience and survey design. First, in the main constant sum question, one pilot tester did not
realize he had reached 100 points and was unaware that the sliders would stop moving once the
point total reached the threshold. Additionally, participants were not explicitly told that they
were required to distribute exactly 100 points. To fix this, we added a few sentences clarifying
how the program for the constant sum question functioned so that participants would understand

35
why sliders would not move, or why they were instructed to fix their answers when their
portfolio did not add up to 100 points.
Figure 9: Original Question for Round 2
Second, we realized from an early response that people may want to put more than one
energy source under the OTHER category. Participants were not provided with instructions on
how to specify multiple energy sources or how to inform us of how many points each option was
given. As a result, we quickly adjusted the question asking for the energy sources put under
OTHER to specify the number of points for each energy source if there was more than one.
Energy sources would be split with commas and points allocated towards an option would be put
in parentheses next to the energy source.

36
4.1.3: Round 3
Pilot testing Round 3 revealed that there was an issue with question phrasing. Some pilot
testers didn’t understand what we were asking them to agree or disagree with or the original
question found in Figure 10 below. We changed the question to ask if they believe the portfolio
shown to them is optimal or not optimal for the future of Sharjah. Additionally, we clearly
defined what it is meant when we ask them whether they believe or do not believe it is an
optimal portfolio in the answer choices presented to them.
Figure 10: Original Question for Round 3
4.2: Delphi Study
4.2.1: Round 1
Participants
To recruit participants for our survey, we reached out to several AUS professors who had
a background in renewable energy or energy production and emailed them about our project.
After agreeing to participate, they were sent a link to Round 1 and asked to complete it.
Additionally, using personal connections and contacts provided to us by SEWA, we emailed
potential survey participants at non-academic companies a link to Round 1 asking them to
participate. Table 4 provides a breakdown of participants’ employers. Also, professors were

37
divided into institutional affiliation and departments. The majority of the survey-takers were
from an academic background, stretching across the different departments specified below.
Company/Department Number of Participants
AUS Civil Engineering 2
AUS Electrical Engineering 6
AUS Mechanical Engineering 2
WPI Environmental Engineering 2
WPI Chemical Engineering 1
Al Mostajed Technologies Co. L.L.C. 1
Bee'ah 2
Etihad ESCO 1
Griffin Consultants 2
Honeywell UOP 1
IDOM Consulting 1
Total 21
Table 4: Breakdown of Participants for Round 1
Round 1: 2020
In Round 1, we asked the participants to create a diversified energy portfolio for 2020 to
power SEWA’s water processes which includes renewable energy. We know that 2020 is only a
month away. Because of this we expected to see many portfolios with minimal amounts of
renewable energy due to the feasibility of putting them in place in such a short period of time.
The graph below shows how frequently each energy source was chosen. Solar PV was
the most common answer with 17 people choosing to include this in their energy portfolio. This
was followed closely by solar CSP with 14 people, then solar thermal heating with 12 people.
Next was natural gas with 10 people, followed by offshore wind turbines with eight people, then
oil with seven people. Biomass with six people followed, then standard inland wind turbines with
four people, then nuclear and maritime with three people. Geothermal was chosen by two people,

38
which is followed by wood & agricultural products which was chosen by one person. Finally,
coal was chosen by zero people.
Figure 11: Number of Times each Energy Source was Picked (2020)
Round 1: 2050
In the second part of Round 1 we asked the participants to select energy types for their
2050 portfolio. The graph below shows how frequently each energy source was chosen. Solar PV
was picked the most often, with 19 out of 21 picking it as an option. Solar PV was followed by
solar CSP with 18 people and solar thermal heating with 14 people. Both types of wind energy
were the next most frequently picked, with 12 people picking offshore wind turbines and eight
people picking standard inland wind turbines. The rest of the results included six people picking
maritime, five picking biomass, four picking natural gas, nuclear energy, and geothermal, two
picking wood and agricultural products, and one picking other and oil. Coal was the least chosen
with zero of the participants picking it as an energy source.

39
Figure 12: Number of Times each Energy Source was Picked (2050)
Round 1: 2020 vs. 2050
In order to compare the portfolios from 2020 and 2050, the number of times each energy
source was chosen should be looked at more closely. Figure 13 shows the change in the number
of times each energy source was chosen from the 2020 portfolio to the 2050 portfolio.

40
Figure 13: Change in Number of Votes between 2020 and 2050
Figure 13 shows that natural gas and oil have decreased between the portfolio for 2020
and 2050. Natural gas and oil both were chosen six less times for the 2050 portfolio than the
2020 portfolio. Natural gas, in particular, went from 10 people choosing the energy source for
2020 to four people choosing the energy source for 2050. This was expected due to the increased
efficiencies of renewable energy technologies in the future, there being only a finite amount of
natural resources, and the environmental impacts of natural resources. On average across all
renewable energy technologies, 2.2 more people chose them for the 2050 portfolio than the 2020
portfolio. As expected, all forms of solar energy have increased on average by 2.67 people. In
addition to solar energy, we expected to see a jump in wind energy as well. When taking a closer
look at wind energy, both offshore wind turbines and standard inland wind turbines increased by
four people between the 2020 portfolio and the 2050 portfolio. Maritime was chosen by three
more people for 2050 than 2020. Geothermal was chosen two more times for 2050 than 2020.

41
Nuclear energy and wood & agricultural products were both chosen by one more person for 2050
than 2020. Biomass was chosen by one less person for 2050 than 2020.
4.2.2: Round 2
Participants
Table 5 shows the number of participants from each company or university who filled out
the survey for Round 2. In Round 1, 21 people took the survey. In Round 2, 17 people completed
the survey, resulting in an 81% retention rate from Round 1. Two professors from WPI, one
engineer from Griffin Consultants, and one engineer from Etihad ESCO did not complete the
questionnaire for Round 2.
Company/Department Number of Participants
AUS Civil Engineering 2
AUS Electrical Engineering 6
AUS Mechanical Engineering 2
WPI Chemical Engineering 1
Al Mostajed Technologies Co. L.L.C. 1
Bee'ah 2
Griffin Consultants 1
Honeywell UOP 1
IDOM Consulting 1
TOTAL 17
Table 5: Breakdown of Participants from Round 2
Round 2: 2020
In Round 2 we asked the participants to assign a number of points representing the
contribution they wanted each energy type to contribute to the portfolio. These energy sources
were the eight most common choices from Round 1. In addition, participants were given an

42
OTHER option so they could add any energy sources they deemed fit for their portfolio. Below
is a pie chart with the mean energy portfolio. Natural gas had the highest contribution, with an
average of 31 points of the portfolio. This is followed by oil and solar PV both with an average
of 24 points. Next came waste-to-energy with an average of 8 points. We grouped biomass into
WTE, as biomass is a portion of WTE. Following WTE comes solar CSP with an average of 7
points, then solar thermal with an average of 4 points. Both offshore wind turbines and standard
inland wind turbines were the least chosen with an average of 1 point of the final portfolio.
Figure 14: Mean Energy Portfolio (2020)
To look for trends based on the background of the experts we compared those from
companies and those from academia. We looked at the differences between how experts from
academia assigned points compared employees from companies. We chose these two groups due
to the low numbers of experts from different academic disciplines and the low number of experts
who responded from each company, so to retrieve meaningful data we combined them into these
two general groups. In terms of fossil fuels, experts from academia overall allotted more points

43
to natural gas and oil than those from companies, with professors assigning an average of 34.3
points to natural gas and 33.3 points to oil, while those from companies assigned an average of
23.3 points to natural gas and 6.2 points to oil.
Experts from companies on average allocated more points to solar PV and WTE than
professors, with experts from companies assigning solar PV an average of 34.0 points and WTE
an average of 18.5 points, while professors assigned solar PV an average of 18.1 points and
WTE an average of 1.4 points.
Figure 15: Academia vs Non-Academia (R2: 2020)
We then looked at how often the experts picked these energy types. Based on the number
of points the expert assigned each energy source the choices were given a ranking of high
importance (35+ points), medium importance (10-35), low importance (1-10), or no importance
(0). We decided that assigning an energy source more than one third of the portfolio meant they
considered it a highly important energy source, which is why we ranked 35+ as high. We chose

44
the medium as being between one tenth and one third. Our reasoning was that one tenth of the
portfolio was still a considerable portion, but it was not at the same level of importance than the
high valued ones were. Then, we separated those who added a few points and those who added
no points at all.
As can be seen in Figure 17, 33% percent of those from companies did not allocate any
points to natural gas and 50.0% of company employees did not assign any points to oil, as
compared to 9.1% of professors who did not assign any points to natural gas and 0% who did not
choose oil. Similarly, 83.3% of professors considered natural gas highly important and 54.6% of
professors considered oil highly important, compared to 33.3% of those from companies who
considered natural gas highly important and 0.0% who considered oil highly important.
All experts allocated points to solar PV. 81.8% of professors did not allocate any points
to WTE, while 50.0% of experts from companies allocated no points to WTE. No professors
considered WTE as highly important, while 33.3% of experts from companies considered WTE
highly important.
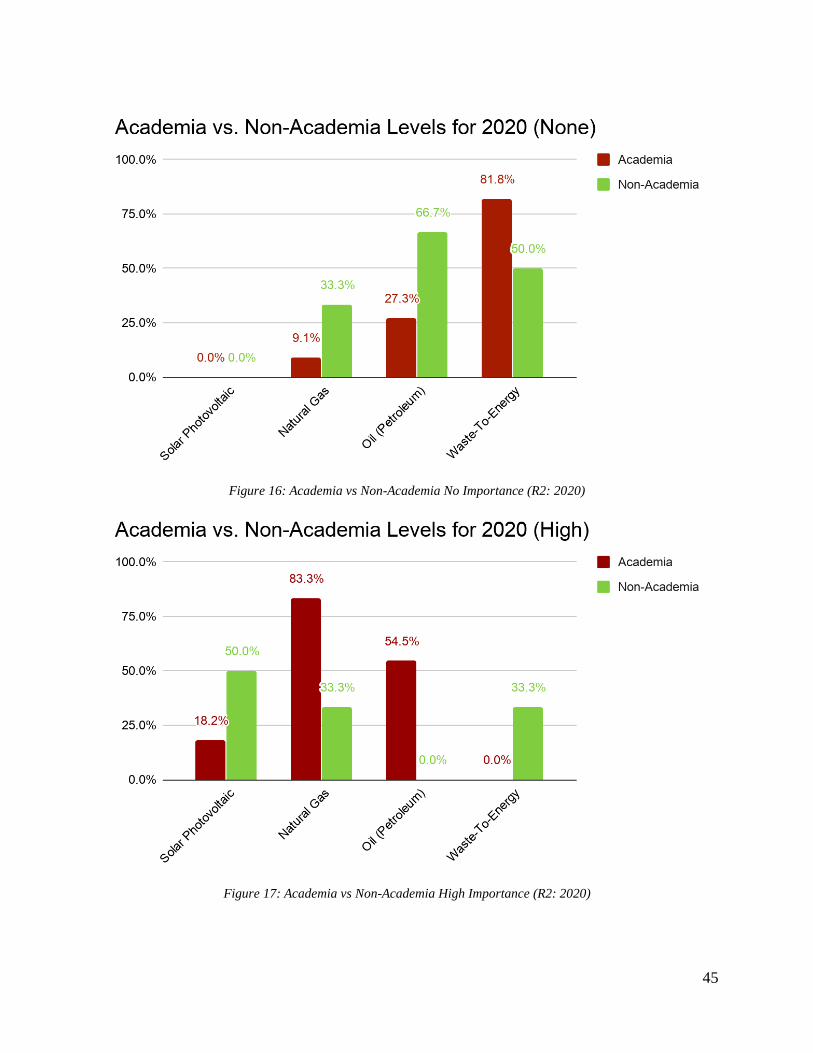
45
Figure 16: Academia vs Non-Academia No Importance (R2: 2020)
Figure 17: Academia vs Non-Academia High Importance (R2: 2020)

46
Round 2: 2050
For 2050, the seven most commonly picked energy sources in Round 1, in addition to an
OTHER option for additional energy sources, were provided as options to allocate points to.
Figure 18 below is a graph showing the average points allocated to each energy type. Solar PV
was given the most points, with an average of 43 out of 100 points. Solar CSP was given the next
highest point value, with people giving it an average of 16 points. Solar CSP was followed by
waste-to-energy and solar thermal, each with an average of nine points. Natural gas was picked
as an OTHER option and received an average of eight points. Offshore wind turbines was next
with five points. Nuclear was also picked as an OTHER option and received four points.
Standard inland wind turbines and oil were the least picked with three points.
Figure 18: Mean Energy Portfolio (2050)

47
Figure 19 below shows the average points allotted to each energy source in the year 2050
by people in academia, and people working outside of academia. On average, professors
designated more points to several renewable energy sources than everyone else.
Figure 19: Academia vs Non-Academia (R2: 2050)
Figure 20 shows the distribution of people from academia vs. non-academia who
included WTE in their portfolios. For example, 50.0% of people from businesses allotted more
than 35 points to WTE. We can see that only 9.1% of professors included WTE in their
portfolios while all non-academic participants opted to include WTE in their portfolios.

48
Figure 20: Academia vs. Non-Academia WTE Levels (R2: 2050)
Round 2: 2020 vs 2050
In order to examine the differences between the 2020 portfolio and the 2050 portfolio, we
should take a closer look at the percentage change of the energy sources. Figure 15 below shows
the change in percentage of each energy source.

49
Figure 21: Change in the Contribution of Energy Sources from 2020 to 2050
When we look closer at the difference between 2020 and 2050 of fossil fuels, a
substantial decrease in the percentage it makes up of the portfolio is shown. Looking specifically
at oil, we see a decrease of 21.0%. For the 2020 portfolio, oil was assigned 24% of the entire
portfolio, while oil was assigned only 3% of the portfolio for 2050. When looking at natural gas,
the decrease between the 2020 portfolio and the 2050 portfolio is 22.4%. For the 2020 portfolio,
natural gas was assigned 31% of the entire portfolio. In contrast, natural gas was assigned 8% of
the portfolio for 2050. This massive decrease for fossil fuels is due to the harmful environmental
effects of using oil to generate electricity as well as the development of renewable energy. The
most substantial increase is for solar PV with 19.1%. Solar PV was assigned 24% for 2020 and
43% for 2050. This increase is due to the increasing efficiency and decreasing cost of solar PV.
After solar PV, solar CSP had the second largest increase with 9.1%. Solar CSP was given 7% of
the 2020 portfolio and 16% of the 2050 portfolio. After solar CSP comes solar thermal with a

50
positive change in percentage of 5.2%. Solar thermal energy increased from 4% of the 2020
portfolio to 9% of the 2050 portfolio. After all the solar energy types comes nuclear energy with
a positive change in percentage of 4.3%. Nuclear was assigned 0% for 2020 and 4.33% for 2050.
Next, offshore wind turbines was assigned 1.4% for the 2020 portfolio and 4.7% for the 2050
portfolio giving it an overall change in percentage of 3.4%. After offshore wind turbines comes
waste-To-Energy with 7.6% for 2020 and 9.4% for 2050, creating an overall change of
percentage of 1.9%. Finally, after WTE, standard inland wind turbines were assigned 1.3% of the
2020 portfolio and 3.1% of the 2050 portfolio giving it an overall positive change in percentage
of 1.8%.
4.2.3: Round 3
Participants
Table 6 shows the employers of the participants in our Round 3 survey. Between Rounds
2 and 3, we experienced a retention rate of 65%, significantly less than our retention rate
between rounds 1 and 2. The majority of the electrical engineering professors from AUS, as well
as one participant from Bee’ah and Griffin Consultants did not take the survey from Round 3.
Company/Department Number of Participants
AUS Civil Engineering 2
AUS Electrical Engineering 2
AUS Mechanical Engineering 2
WPI Chemical Engineering 1
Al Mostajed Technologies Co. L.L.C. 1
Bee'ah 1
Honeywell UOP 1
IDOM Consulting 1
TOTAL 11
Table 6: Breakdown of Participants from Round 2
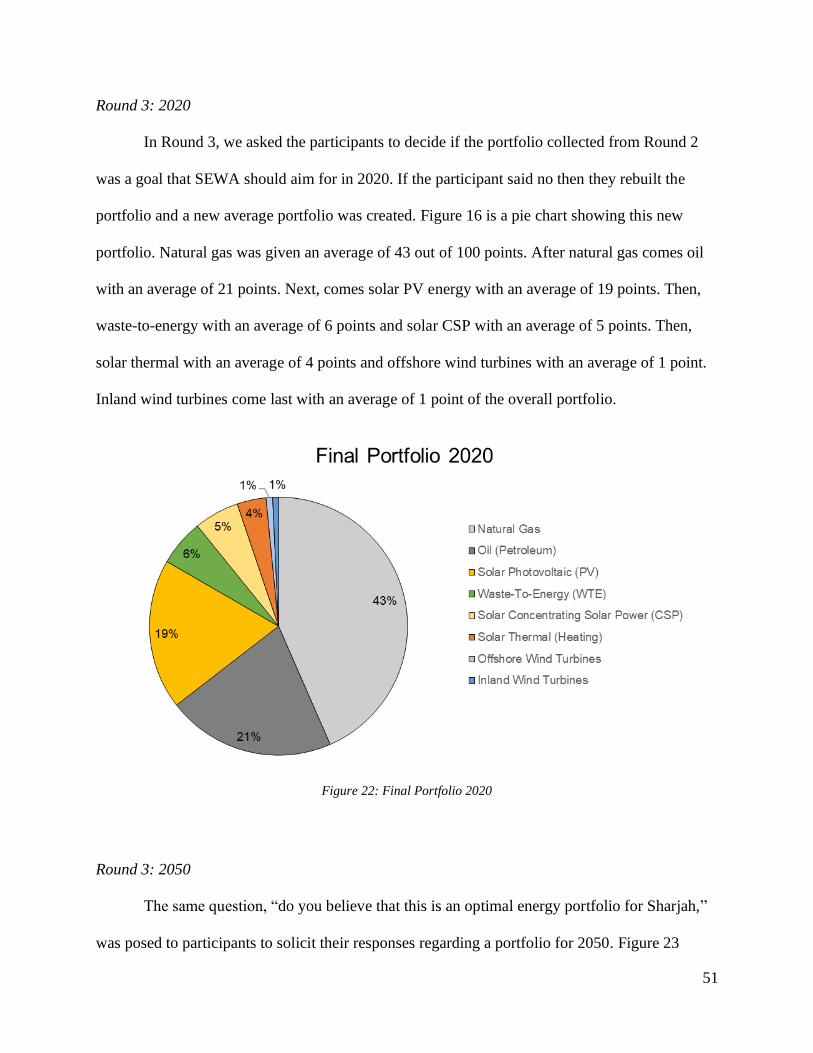
51
Round 3: 2020
In Round 3, we asked the participants to decide if the portfolio collected from Round 2
was a goal that SEWA should aim for in 2020. If the participant said no then they rebuilt the
portfolio and a new average portfolio was created. Figure 16 is a pie chart showing this new
portfolio. Natural gas was given an average of 43 out of 100 points. After natural gas comes oil
with an average of 21 points. Next, comes solar PV energy with an average of 19 points. Then,
waste-to-energy with an average of 6 points and solar CSP with an average of 5 points. Then,
solar thermal with an average of 4 points and offshore wind turbines with an average of 1 point.
Inland wind turbines come last with an average of 1 point of the overall portfolio.
Figure 22: Final Portfolio 2020
Round 3: 2050
The same question, “do you believe that this is an optimal energy portfolio for Sharjah,”
was posed to participants to solicit their responses regarding a portfolio for 2050. Figure 23

52
shows the final portfolio for 2050. Solar PV was given an average of 40 out of 100 points for the
final portfolio for 2050. Next, solar CSP was given an average of 15 points. After solar CSP,
natural gas was given an average of 12 points. Then, waste-to-energy with an average of 9
points. After WTE, nuclear was given an average of 8 points. Then, solar thermal energy with an
average of 7 points. Following solar thermal energy comes offshore wind turbines with an
average of 4 points. Then, oil with an average of 3 points. Finally comes standard inland wind
turbines with an average of 2 points of the final portfolio for 2050.
Figure 23: Final Portfolio 2050
Round 3: 2020 vs. 2050
As in Round 2, the largest positive change in contribution from 2020 to 2050 was by
solar PV. Similarly, the two largest drops in contribution from 2020 to 2050 were natural gas and
petroleum again as several participants wish to move away from complete dependency on fossil

53
fuels. All other energy options, besides solar CSP experienced a less than 4% increase in
contribution. Survey takers cited technological innovations in the coming years for the
differences in solar energy contribution from 2020 to 2050.
Figure 24: Change in Contribution from 2020 to 2050 from Round 3 Results
Round 3: Interviews
We interviewed 3 AUS professors to gain a deeper understanding of their thought
processes and why they changed their opinion on some of their answers. Prior to the interview,
we looked at the professors’ survey responses for all three rounds. We took note of responses
that needed clarification as well as looked at how their responses changed between rounds and
compiled a list of questions to ask based on these observations. We also asked about their
opinions as to the final portfolio in order to get more detailed responses. The questions we asked
as well as their responses can be found below.

54
Professor 1:
Our first question was about their difference of energy sources between Round 1 and
Round 2. In the 2020 Round 1, the professor included both nuclear and geothermal as energy
options he would like to see in a portfolio. Neither of the options were included in the 2020
portfolio for Round 2 due to the low number of people picking it, although we left in the OTHER
option in case they wanted to add some points to it. We asked whether the professor would have
assigned points to the two sources if they were given as slider choices. The professor responded
that he would have assigned points to the two sources if they were options in the 2020 Round 2
choices, but said that in his opinion they could be replaced with other choices.
For our next question, we asked about the discrepancy between one of their comments in
Round 1 for 2050 and their response for Round 2. In Round 1, the professor said that we should
be able to eliminate fossil fuels by 2050, and therefore did not add natural gas or oil as options he
would have liked to see in the portfolio. However, in Round 2, the professor selected the
OTHER option and added natural gas and oil as energy sources he would like to see. When
asked, the professor said that in the first round he was very optimistic and in the second round he
was more realistic and decided that it would be unreasonable to eliminate all fossil fuels by 2050.
For this reason, he added fossil fuels for the 2050 portfolio that he expected to see, despite his
earlier beliefs.
To obtain a better understanding of how the overall responses influenced his opinions, we
asked the professor if reading the results of the rounds affected how they answered for the
subsequent rounds. He replied that it did to an extent, but his answers didn’t change dramatically
based on the answers of the other professors. As for results, he was surprised, he said that he was
not expecting such a high percentage of WTE as an energy source. However, he did agree that

55
with Bee’ah’s new waste management plant, WTE may become a feasible option. He also
mentioned that in Abu Dhabi they were looking into WTE as an option as well.
Lastly, we asked if while answering he focused more on an idealized answer or a
practical one. He replied that it was a mixture of both. He believed that the portfolios were very
optimistic and mentioned that without knowing the constraints and limitations of SEWA, it was
difficult to know exactly what portfolio would be a realistic one.
Professor 2:
Our first question was to clarify some of the professor’s choices for the Round 1 portfolio
between 2020 and 2050. In the Round 1 portfolio, the professor included biomass as a choice in
their biomass portfolio but did not include it in the 2050 portfolio. When asked, he responded
that he changed his mind due to the lack of available waste in the area, as Sharjah in specific
does not have a lot of waste. He considered waste conversion as recycling acceptable, but he did
not think it would provide a substantial part of an energy portfolio for 2050.
Next, we asked about the differences between his answers in Round 1 and Round 2. For
Round 1, he included both nuclear and maritime energy as possible sources for 2020, However,
in Round 2, he did not assign any points to either. His response was that in Round 1 he likely did
not notice the timing and therefore decided to not include them in his next portfolio. He was also
less sure about adding nuclear into 2050 due to the nature of a nuclear power plant. He said that a
nuclear power plant would need to be built on a large scale. However, nuclear energy would be
covering the baseload of the energy source, which for Sharjah is quite small, resulting in a small
nuclear power plant. Along with this, he said that the load varied very significantly in the
different seasons. The issue was that the load for winter is significantly smaller than in the
summer. Nuclear power plants are intended to be run at full capacity all the time, which would

56
force the nuclear power plant to have an output that would be enough for the winter, but not
enough for the summer.
We then asked about the professor's choice to include fossil fuels in the Round 3
portfolio, despite not including it in his Round 2 portfolio. When asked about the reasoning he
said that he changed their mind due to the fast response rate of natural gas and the need for a
fast-acting energy source. He agreed that natural gas could be eliminated if the other emirates
were able to provide fast response energy by using natural gas. However, it would be working
off the assumption that the other emirates would be providing this source, which would not be a
guarantee. Even by increasing the efficiency of natural gas and making a combined cycle, the
cycle would slow down dramatically. In Round 2, he said that he was very optimistic, but then
later looked back and realized the technical problems with eliminating natural gas.
In Round 2, the professor recommended large scale storage devices as an OTHER option.
However, this is not considered an energy generation source, which he agreed with, so it would
not belong in a portfolio. He did say that it would be a good option, albeit an expensive one, and
it would solve some of the issues with requiring a fast response, as storage has the fastest
response speed.
The final question was about the reasoning he gave in Round 3 for offshore wind
turbines. In his response he was giving a reasoning for the energy sources inclusion, but he did
not finish his argument. He explained that offshore wind turbines could be effective in the
section of Sharjah on the Gulf of Oman, due to the higher wind speeds of the area.
Lastly, we asked about how he believed that the reports influenced his responses for
subsequent rounds. The professor believed that the reports changed his responses and that as he
learned from the other experts’ thoughts he changed his responses.

57
Professor 3:
To begin with the third professor, we asked about one of his Round 1 answers that
changed throughout the subsequent rounds. The third professor picked nuclear energy as an
option for an energy source in the first round for 2050. However, he did not assign any points to
nuclear energy in the second round. He stated that he did not believe nuclear energy was a good
option due to the safety problems with nuclear energy. However, he did accept that a baseload
was needed and that without oil, nuclear energy would be the best environmentally friendly
option for a reliable energy source. However, he did not wish to see it implemented due to the
scale of the accidents that would occur if the plant broke down. As a result, he preferred using
fossil fuels as a baseload rather than nuclear energy, but he believed that nuclear would be the
best option if fossil fuels were completely eliminated.
We asked about the professor's choice to remove offshore and inland wind turbines in his
portfolios between Round 2 and Round 3 for both years. When asked about the reasons, he
responded that after thinking about it he decided that there is not sufficient wind speeds inland
for turbines to be affected. He stated that he was not familiar enough with the offshore wind
speeds to make judgments as to whether they would be effective offshore, but he did not think
there was enough of a coastal area for them to be a good option. Therefore, he decided they
weren’t suitable energy sources for SEWA.
When asked about his reasoning for adding waste to energy in 2050 in Round 3, he
replied that he thought that it would make sense to use as an energy source because the waste
was being burned anyway. Because of this, it would make sense to use it as an energy source as a
result, although only when oil was gone from the portfolio. He did not see WTE as the most

58
effective source due to the need to import bio waste due to the lack of agricultural and animal
waste in the area.
When we inquired about his opinions on the reports and whether they changed his
answers in the subsequent rounds he said that he did take into account the reports. However, he
found some of the responses too idealistic. He did not believe that the emirate would be able to
get rid of oil completely due to its high availability in the area and the ease with which it could
be obtained. He also believed that WTE would not be able to contribute such a large amount of
the portfolio due to the lack of biofuels in the area.
Overall:
All three professors said that they believed that they were too optimistic in the earlier
rounds, and as a result changed their answers in either Round 2 or Round 3 in order to account
for that. Despite this change in their responses, they still believed that the overall portfolio was
too optimistic. They did not necessarily think it was a major problem however, expressing that
having an optimistic goal has its benefits.
Two of the three professors believed that nuclear energy could cover the baseload in the
future, as they considered it a more environmentally friendly energy source than fossil fuels
while being able to reliably provide energy. However, both professors were concerned about
safety, and for that reason it was not their first choice for an energy type. One of the professors
said he would rather have fossil fuels as a baseload rather than nuclear energy despite their
negative environmental impact. The last professor did not think nuclear energy was
economically feasible due to a combination of factors including fluctuating energy demands and
the size of a power plant.

59
All three professors were surprised by the high average WTE had in the portfolio. Two
out of the three did not think it was the most economically feasible due to the lack of waste in the
UAE, however, all three still supported the use due to the fact that waste will always be available
and Bee’ah’s current waste plant. Although they all supported the use, whether for energy
generation or recycling, one professor did not believe that it would provide a significant
contribution to an energy portfolio.
Round 2 vs Round 3 Distributions:
We looked at the distribution of points for each energy type in Round 2 and the
minimum, maximum, and mean for Round 3 for both 2020 and 2050. We looked at the overall
distributions and trends, as well as comparing the two rounds to see how the overall numbers
changed between the two rounds.
Figure 25: Distribution of points in Round 2 (2020)

60
Round 2-2020 Solar PV Solar CSP Solar Thermal Natural Gas Offshore Wind Oil WTE Inland
Wind Nuclear
Minimum 6 0 0 0 0 0 0 0 0
1st Quartile 10 0 0 4.5 0 0 0 0 0
Median 12.5 5 2.5 28.5 0 29 0 0 0
3rd Quartile 23.5 8.5 5 36.25 3.5 47 11.25 0.25 0
Maximum 42 25 19 80 10 75 60 5 10
Mean 24 7 4 30 1 24 7 1 1
Table 7: Statistics of distribution of points in Round 2 (2020)
For 2020, all three types of solar energy had similar distributions, as can be seen in
Figure 25 above. Solar PV was the most popular, with three out of four people assigning it at
least 10 points and all participants assigning it some number of points. The majority of people
assigned solar PV between six and 23.5 points. There were a few outliers with the maximum
allocation being 42 points. There was only one other energy source in which at least 75% of
people assigned some points.
The top quartile of natural gas and WTE were significantly larger than the rest of the
quartiles, with the top 25% having over two times wider of a point distribution than the bottom
75%. WTE especially had a very large distribution, as the bottom 50% did not assign any points
to WTE and the third quartile assigned between zero and 11.25 points, while the top percentile
assigned between 11.25 and 60 points. For both energy types, it is likely that outliers affected the
mean dramatically.
Round 3-2020 Solar PV Solar CSP Solar Thermal Natural Gas Offshore Wind Oil WTE Inland Wind
Minimum 3 0 0 0 0 0 0 0
Maximum 42 25 19 95 5 75 60 5
Mean 22 6 4 35 0 23 7 1
Table 8: Statistics of distribution of points in Round 3 (2020)

61
Between Round 2 and Round 3 the most notable changes were in natural gas and nuclear
energy. Both the maximum and average increased between the two rounds, with a 15 point
increase in the maximum and a 5 point increase in the average. Nuclear energy was not a popular
choice in Round 2, with only a 10 point maximum from one expert. In Round 3 nuclear energy
was completely eliminated. The other energy types were very similar between both rounds.
Figure 26: Distribution of points in Round 2 (2050)
Round 2-2050 Solar PV Solar CSP Solar Thermal Offshore Wind Inland Wind Maritime WTE Nuclear Oil Natural Gas
Minimum 9 0 0 0 0 0 0 0 0 0
1st Quartile 35 15 0 0 0 0 0 0 0 0
Median 40 20 10 0 0 0 0 0 0 0
3rd Quartile 50 20 16 10 5 0 10 7.5 0 0
Maximum 70 30 25 20 15 10 60 55 20 53
Mean 43 16 9 5 3 1 9 8 3 7
Table 9: Statistics of distribution of points in Round 2 (2050)
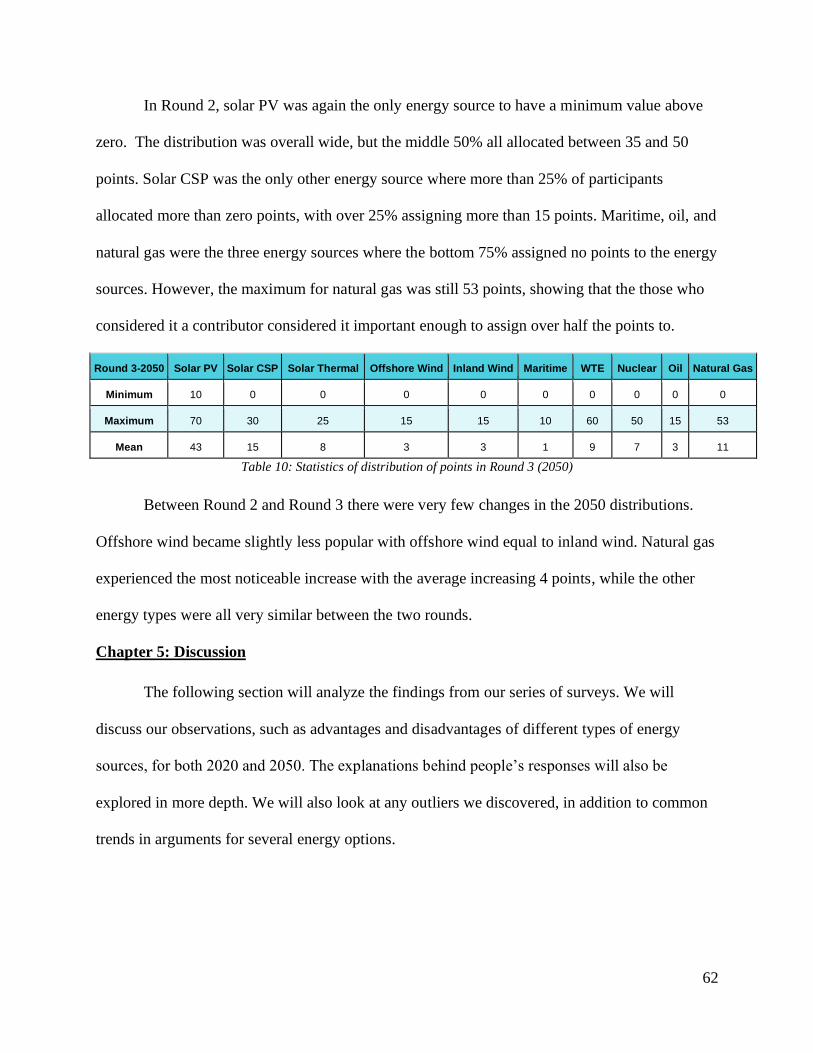
62
In Round 2, solar PV was again the only energy source to have a minimum value above
zero. The distribution was overall wide, but the middle 50% all allocated between 35 and 50
points. Solar CSP was the only other energy source where more than 25% of participants
allocated more than zero points, with over 25% assigning more than 15 points. Maritime, oil, and
natural gas were the three energy sources where the bottom 75% assigned no points to the energy
sources. However, the maximum for natural gas was still 53 points, showing that the those who
considered it a contributor considered it important enough to assign over half the points to.
Round 3-2050 Solar PV Solar CSP Solar Thermal Offshore Wind Inland Wind Maritime WTE Nuclear Oil Natural Gas
Minimum 10 0 0 0 0 0 0 0 0 0
Maximum 70 30 25 15 15 10 60 50 15 53
Mean 43 15 8 3 3 1 9 7 3 11
Table 10: Statistics of distribution of points in Round 3 (2050)
Between Round 2 and Round 3 there were very few changes in the 2050 distributions.
Offshore wind became slightly less popular with offshore wind equal to inland wind. Natural gas
experienced the most noticeable increase with the average increasing 4 points, while the other
energy types were all very similar between the two rounds.
Chapter 5: Discussion
The following section will analyze the findings from our series of surveys. We will
discuss our observations, such as advantages and disadvantages of different types of energy
sources, for both 2020 and 2050. The explanations behind people’s responses will also be
explored in more depth. We will also look at any outliers we discovered, in addition to common
trends in arguments for several energy options.

63
5.1: 2020 Discussion
The portfolio created for 2020 includes primarily natural gas and oil as predicted.
Because the energy portfolio of Sharjah is currently 100% natural gas with small reserves of oil
in the case of emergency, it would realistically be extremely difficult to change the energy
portfolio in such a short period of time. However, we asked for an ideal portfolio, implying that
time and other resources were not an issue. In the 2020 portfolio, fossil fuels make up 60% of the
energy profile. This indicates that while natural gas and oil should still be the main energy source
in 2020’s energy portfolio, there is plenty of room for improvement to include renewable energy
options.
After reviewing our findings, seeing that all three types of solar energy (PV, CSP, and
thermal) were selected as some of the most popular renewable energy choices was not a surprise.
From prior research and knowledge, we predicted that solar power would be a favorite due to the
area’s sunny climate. Experts reaffirmed this by explaining that the high irradiance levels
(~2000-2200 kWh/m2) made the area ideal for solar power. There is also already a precedent for
solar energy in the UAE as there are several solar-energy-based projects, both completed and
under development, around the country. A couple of well-known ones mentioned by participants
include solar parks in Abu Dhabi and Dubai. Additionally, all types of solar energy were chosen
due to the financial advantages they had when compared to other renewable energy options. For
example, as seen in the report for Round 1 found in Appendix D, survey participants believed
that solar energy had a great cost/benefit ratio and a high return on investment over time. Out of
all the renewable energy options, solar energy, particularly PV, would have the best economic
feasibility in 2020. If SEWA is looking to transition to renewable energy immediately, solar PV
would be the best place to start due to its low price and great potential in the area. Additionally,

64
SEWA should begin planning for the future by beginning implementation of the solar CSP and
thermal to take advantage of the region’s resources.
A notable energy source that participants wanted to include in their energy portfolio was
waste-to-energy (WTE). WTE involves the incineration of all types of waste, not just biomass, to
produce energy. The method also doubles as a waste management process to reduce the amount
of trash that ends up in landfills. Upon further research and analyzing the understanding of
participants’ interpretations of biomass and WTE, we decided to combine the two categories into
WTE as it was more general and inclusive. A pattern observed was that people who chose WTE
and biomass often cited the growing population as a reason to turn towards these technologies.
As long as people live in the area, the community will always generate waste to burn and
produce energy with. Also, like solar energy, there is already a precedent for WTE technology in
the area as Bee’ah plans to open a WTE plant in Sharjah within the next couple of years.
Directing the waste to incineration plants will also move waste out of landfills, working toward
the UAE’s goal of diverting 75% of its solid waste away from landfill sites by 2021 (Bee’ah,
2017).
Despite the fact that almost 40% of participants included wind energy in their portfolio,
many believed that low wind speed, availability of land, and inability to supply as much energy
as other resources made it unfavorable. The number of people showing support for wind energy
demonstrates the country’s desire to move toward sustainable energy sources. Wind energy,
while not widely supported, can still also be considered, especially offshore wind options on
Sharjah’s regions bordering the Gulf of Oman. However, the area’s lack of ideal conditions for
wind turbines may render wind energy unfit for the 2020 portfolio. Without time for innovations
65
in wind energy technology, wind-energy-based projects should be the last option considered,
behind solar energy and WTE.
5.2: 2050 Discussion
As with 2020, the three types of solar energy were the most commonly chosen. As
expected, many people cited the need to reduce carbon emissions in the environment as a major
factor for their choice. Along with that, the decreasing price of solar energy was also mentioned,
and how in the future it would become cost effective enough to warrant using over fossil fuels.
One expert stated that they believed solar PV technology would advance far enough in the future
that solar PV alone could provide enough energy for residential purposes. However, one
participant stated that they did not think that solar energy alone would be able to provide enough
energy for the emirate. Solar heating was picked the least, but of the people who selected it, one
stated that the heating would be useful for the process of desalination. Those in academia showed
more support for Solar CSP than those from outside companies, which may have to do with
current research into the technology.
The greatest change seen in allocations for the energy portfolio in 2050 was for solar PV
systems. Multiple experts believed solar energy development is on the rise, with predictions of
heavy reliance on the energy source by 2050. Two experts also highlighted the potential for
impact that 30 years of development will have on the efficiency of the PV and concentrated solar
power (CSP) systems. As the technology for capture and storage of sunlight improves, cost of
solar energy development projects will also see a decline. A combination of rising demand and
an affordable renewable energy alternative may allow for the exponential increase in solar
energy use in the future. The biggest source of agreement was when it came to the use of
photovoltaic cells. Many of the experts believed that the potential of solar was very high,

66
although one expert did point out the problems the cells may face due to temperature and sandy
conditions. Between Round 2 and Round 3 the percentage did decrease slightly, but the
reasonings given continued to support their use. One experts suggested that solar CSP may be
more effective than PV. While the technology is less advanced, their belief was that with
technological improvements solar CSP would be more effective than solar PV in the future.
Wind energy was picked by many experts, making up the next largest selections of the
portfolio. Offshore wind turbines were more popular than inland wind turbines, which was
expected due to the low inland wind speeds, although one expert believes that with technological
advancements inland wind turbines could still be effective by this time. Not all the experts
believed that wind is a good option, with one expert stating that they did not think wind energy
would be very effective due to the distance the energy needed to be moved. However, they stated
that if technology advances as rapidly as it has been, they may change their mind.
Geothermal was not selected often as a whole. However, about one quarter of professors
selected it of the time, while those in industry did not select it at all. One of the reasons against
the usage included the fact that the UAE does not lie in a position where geothermal is an
economically efficient option, due to the temperature variations and thickness of the earth's crust
in the area. There were no experts that gave reasonings for the use of geothermal.
We were surprised to see oil and natural gas appear several times each in the OTHER
category as natural gas was only selected four times, and oil was only selected once in Round 1.
Oil and natural gas were picked because they are so readily available in the UAE. Because the
rest of the world will also likely steer away from fossil fuels, there will be cheap and abundant
fossil fuel supplies for the UAE. Sharjah will also have limitations in implementing solar
expansion due to its smaller land area in comparison with other emirates. Therefore, the process

67
of phasing out natural gas might be slower for the emirate to implement. Additionally, people are
still unsure if renewable energy sources will be as reliable as conventional energy sources by
2050. Leaving some fossil fuels in the mix for 2050 will help create a portfolio that even people
who are wary of complete dependence on renewable energy can trust.
Nuclear was also selected multiple times in the OTHER category. One expert believed
that nuclear energy plants have the potential to be the primary source for energy generation, as it
was believed to be a source of clean energy requiring little maintenance. It can produce enough
energy to compete with conventional power plants, making it a great energy source to include.
However, like some forms of solar energy, nuclear energy requires a lot of space that the emirate
does not have due to its small size, making it a less than ideal energy source to include.
Participants also strongly expressed safety fears in installing nuclear plants, referencing disasters
like Chernobyl and Fukushima. Their argument for the use of nuclear energy was that it would
take only trained staff in order to run the plant, making it effective as a primary energy source
due to the limited resource use. This differed dramatically with professors who were interviewed.
Two out of three professors who were interviewed saw potential in the use of nuclear energy.
However, due to the dangers of nuclear power plants, they were unwilling to make it a large
source of contribution and wary of the potential dangers. The third professor did not believe that
it would be economically feasible due to load variances throughout the year and how it would
affect the output and usage of the plant. While nuclear plants would be able to generate clean
energy, it may be difficult to convince officials due to these types of concerns.
68
5.3: Things to Consider
Feasibility
The energy portfolio for 2020 is made up of 60% fossil fuels and 40% renewable energy.
Despite the fact that experts believe implementing this particular portfolio for 2020 is unrealistic,
the percent contribution of each energy source can still serve as a guide for prioritizing the
implementation of different energy options. It would be difficult to turn away from natural gas
because it is so cheap and plentiful. As a result, SEWA may be reluctant to shy away from gas
due to its cost-effectiveness. Additionally, many participants noted that installing solar energy
systems of any kind will take time and lots of land to accomplish. Solar PV, specifically, as it is
one of the cheapest options, has the greatest potential to become a major contributor to the
energy portfolio.
Among those who agreed with the 2050 portfolio in Round 3, there were some that stated
that although they wanted SEWA to aim for this portfolio, they saw it as very optimistic and did
not think it was an attainable goal. One expert said that reaching 80% renewables would be easy
to achieve but the rest would take decades to complete the transition based on the 80-20
principle, which would assume that 20% of the effort would be needed to reach the 80% mark,
while reaching the 100% mark would take the rest of the effort.
One problem that some of the experts and the professors who were interviewed believed
would make a big impact was the desire to change to a renewable energy source. They believed
that while it was possible, it would be difficult to do so due to a perceived lack of need to change
to these energy sources, which are less reliable and oftentimes more expensive.

69
Interpretation of “Ideal”
Between rounds 2 and 3, renewable energy sources contributed less to the 2020 portfolio.
Overall, in Round 2, renewable energy sources accounted for 45% of the entire portfolio, but in
Round 3, they only accounted for 37% of the portfolio. This difference suggests that people’s
definition of “ideal” between rounds 2 and 3 changed. After interviewing a few participants, and
following people’s responses throughout the rounds, we learned that many people started out
answering “optimistically” in Round 1, but by Round 3, they had begun to look at the portfolio
more realistically and assigned more points to fossil fuels, resulting in a 12% increase in natural
gas alone for our final portfolio. Even people who agreed with the portfolios for both 2020 and
2050 believed that these portfolios were too optimistic or ambitious. People who disagreed with
the portfolio tended to have a preference for fossil fuels 2020. We observed that people from
academia assigned more points to fossil fuels in 2020, while experts from non-academic
backgrounds assigned more points to renewable energy sources for 2020. This may be because
the professors looked at the portfolio from a more realistic perspective than those from non-
academia.
Because 2020 was only a month away when the surveys were sent out, people began to
argue that little to no change could be accomplished between when they took the survey and
2020. Even people who agreed with the portfolio believed it was too optimistic and were
wondering why fossil fuels did not account for more of the portfolio. These differences among
participants’ definitions of “ideal” may have skewed the results. For example, one person may
have approached building the portfolio being 25% realistic whereas another participant may have
been 100% realistic.

70
Biases
Professors typically had renewable energy sources contribute a higher percentage than
those in the non-academic fields. One energy source where this trend did not exist was WTE.
This particularly high contribution from WTE was likely due to the engineers we included from
Bee’ah, a waste management company planning on finishing construction on a WTE facility in
Sharjah by 2021. As a result, Bee’ah, the only company to have more than one participant in
Round 2, may have had a strong impact concerning WTE contributions. One AUS professor also
cited Bee’ah’s projects as reasoning for allocating points to WTE.
Additionally, because a large portion of renewable energy research done at AUS focuses
on solar energy, all types of solar energy were allotted more points by professors than other
engineers. For example, as seen in Figure 19, there was a big difference between the percentage
of professors picking solar PV in 2050 rather than companies. This highlights that there may
have also been a bias towards solar energy in this study.
We attempted to avoid these biases by including as many people from non-academic
backgrounds and include a wide variety of companies. However, we were unable to receive
responses from many businesses in the area, making it biased toward the companies who had
more people participate in the study. All biases should be kept in mind when looking at the final
portfolio.
5.4: Limitations
Throughout our study we encountered a few limitations that might have hindered our
results. In our study, we had a high academic expert to non-academic expert ratio which may
have its benefits, but we believe including more experts from different companies in the field of
energy generation, power systems, renewable energy, or water processing would improve the

71
quality of our study. We would like to have seen more participants from oil and natural gas
companies to incorporate the positives of those energy generation technologies. In addition to not
having a diversified pool of participants, we only had a maximum total of 21 participants. While
21 participants is well within the guidelines for a successful Delphi Study, we believe that the
findings could be more robust with a higher number of participants.
5.5: Recommendations for Future Research
Recommendation 1: Continuation of Round 3
Round 3 could be repeated with different groups of experts in order to obtain a more
thorough portfolio. By adding another diverse group of participants, the response would reflect
the opinions of a wider group of experts. This could be repeated as many times as necessary in
order to obtain a consensus among a wide group of experts.
Recommendation 2: Feasibility Study
In the future, we advise SEWA to conduct a feasibility study to find what experts believe
would be possible for the future of Sharjah’s energy portfolio. Due to a large number of factors,
including economic reasons, the unique government structure, and the lack of public awareness
about the topic, it may be difficult to show a need to change to renewable energy sources,
especially when current energy sources are so cheap. These aspects were not considered in this
study, but in the future would be important in order to find a feasible energy portfolio from an
economic, social, and political standpoint. Our ideal study gives SEWA a very optimistic goal to
aim for. On the contrary, we believe a feasibility study would provide SEWA with a plausible
goal to aim for in the future. This feasibility study could be structured the same way as this study
but use the world “feasibility” instead of “ideal” when asking about the portfolios.

72
Recommendation 3: Potential Research & Development
SEWA may also look at this portfolios as a prioritizing tool. The portfolios can be used to
help in deciding where to invest research and development efforts. For example, because solar
PV was predicted to have a high contribution, it may be wise to prioritize efforts in R&D
regarding solar PV to further advance the technology and make them more cost-effective in the
future.

73
Chapter 6: Conclusion
In this chapter, we will summarize the findings of our study and review recommendations
we have for SEWA in building its future energy portfolio. Through our project, we gained a
better understanding of what renewable energy sources experts think should be in the future of
Sharjah’s energy mix. By analyzing the experts’ opinions, we developed two energy portfolios,
one for 2020, and one for 2050, that SEWA should ideally aim to achieve by the respective
years. We also briefly suggest how to build upon this study in the future.
In the 2020 portfolio, it was determined that the energy portfolio mix should remain
mainly fossil-fuel-dependent. Different renewable energy options made up the remaining 40% of
the energy portfolio. Solar based energy sources comprised the majority of the renewable energy
contribution, followed by WTE and wind energy. Solar energy was commonly picked and given
a higher contribution to the portfolio due to the area’s ideal climate for these types of
technologies. Solar PV was mainly chosen due to its low cost and great efficiency when
compared with other clean energy options. It was the only renewable energy source where the
majority of the participants agreed that immediate installation was economically feasible. Solar
CSP should also be implemented to take advantage of the area’s resources. The addition of solar
thermal to help in heating during the desalination process would also decrease the amount of
energy needed to power the desalination plant. Wind energies would also constitute a very small
portion of the energy portfolio. The lack of ideal conditions in Sharjah do not make them a
priority in Sharjah’s energy portfolio for its water processes in 2020. Rather, they are simply an
option SEWA should keep an eye while they wait for innovations to make wind energy more
cost-efficient.

74
Based on the results we received, we recommend that the 2050 portfolio is comprised of
40% solar PV and 15% solar CSP. By this point in time, experts predict that there will be several
technological advancements in both solar PV and solar CSP making them more economical.
Solar thermal will constitute a small portion of this portfolio to continue to assist in the heating
stages in the desalination process. Natural gas should still make up a significant portion of the
portfolio due to its fast response time, low costs, and reliability. Additionally, WTE should still
make up about 10% of the energy portfolio to not only generate electricity for its desalination
plants, but to also assist in the waste management of Sharjah’s population by 2050. We
recommend that SEWA also consider looking into incorporating nuclear into the energy
portfolio. Due to the nature of nuclear plants and their ability to produce large amounts of
energy, nuclear energy could also be used to generate electricity for other needs in addition to
powering desalination plants. However, there are strong feelings against nuclear energy based on
safety fears. As mentioned before, wind energy technologies over time will become more
efficient. By 2050, we suggest that offshore wind turbines be installed in Sharjah’s regions
bordering the Gulf of Oman. Offshore winds are typically stronger than inland winds, making
offshore wind turbines a more ideal electricity generator.
Our recommendations and suggestions from this study reflect the opinions of several
different experts in the field of renewable energy and energy production. Our analysis has shown
that solar energy has the strongest potential out of all the renewable energy options to be a major
contributor to SEWA’s energy for its water processes. Fossil fuels should still comprise a portion
of both the 2020 and 2050 energy portfolios due to its reliability and its accessibility. However,
the nature of this study attempted to focus on ideal portfolios for these years. Our team observed
that there were several interpretations of the word “ideal,” resulting in responses varying in

75
levels of practicality. We recommend that there be future studies follow up on this study
discussing and determining the feasibility of these portfolios.

76
Appendices
*Note: Text in brackets [] indicate the type of response requested in the survey question.
Appendix A: IRB Consent Form
Informed Consent Agreement for Participation in a Research Study
Investigators: Isabelle Chan, Brendan Train, Veronika Enis
Contact Information:
Sponsor: Sharjah Electricity and Water Authority
Title of Research Study: A Diversified Energy Portfolio for Powering Water Processes
Introduction
You are being asked to participate in a research study. This study will take approximately
twenty minutes to complete, spread over the span of six weeks. Before you agree, however, you
must be fully informed about the purpose of the study, the procedures to be followed, and any
benefits, risks or discomfort that you may experience as a result of your participation. This form
presents information about the study so that you may make a fully informed decision regarding
your participation.
Purpose of the study: This study is investigating renewable energy sources and how they can be
used to create a diversified energy portfolio in the emirate of Sharjah in the UAE.
Procedures to be followed: A preliminary form will ask for your participation in the study. You
will be asked to fill out a series of three surveys. The first will ask the participant to build an
energy portfolio and explain their choices. One week later, we will send out another survey
based on the results of the first survey requesting participants to predict the energy source’s
contribution to the portfolio and explain. Then, we will send out a common portfolio from the
last round and ask the participants to agree or disagree with an explanation of their answers.
Risks to study participants: There are minimal risks associated with this participating in this
study. You may wish to give an answer that others would want to hear rather than what you truly
believe. There is also a very small chance that others will find out how you have answered,
which may make an impact on your personal or professional life.
Benefits to research participants and others: There are minimal benefits associated with
participating in this study. Participant may benefit from this study by being given the opportunity

77
to learn from their peers. Findings from this study will potentially benefit governments pursuing
renewable energy policies.
Record keeping and confidentiality: Responses will be stored in the Qualtrics survey system.
Records of your participation in this study will be held confidential so far as permitted by law.
However, the study investigators and under certain circumstances, the Worcester Polytechnic
Institute Institutional Review Board (WPI IRB) will be able to inspect and have access to
confidential data that identify you by name. Any publication or presentation of the data will not
identify you.
Cost/Payment: There is no direct cost or payment for participation.
For more information about this research or about the rights of research participants, or in
the case of research-related injury, contact:
Professor Kent Rissmiller
WPI IRB Chair
508-831-5019
Gabriel Johnson
Human Subjects Administrator
508-831-4989
Your participation in this research is voluntary. Your refusal to participate will not result in
any penalty to you or any loss of benefits to which you may otherwise be entitled. You may
decide to stop participating in the research at any time without penalty or loss of other benefits.
The project investigators retain the right to cancel or postpone the experimental procedures at
any time they see fit.
By signing below, you acknowledge that you have been informed about and consent to be a
participant in the study described above. Make sure that your questions are answered to your
satisfaction before signing. You are entitled to retain a copy of this consent agreement.
___________________________ Date: ___________________
Study Participant Signature
______________________________
Study Participant Name (Please print)
____________________________________ Date: ___________________

78
Appendix B: Letter of Support from SEWA

79
Appendix C: Round 1 Survey Questions
1. First Name [Text Entry]
2. Last Name [Text Entry]
3. Employer [Text Entry]
4. Position [Text Entry]
5. Email [Text Entry]
6. IRB Consent Form [Yes/No]
7. Please choose the types of energy sources you would like to include in an energy profile
for 2020. If you would like to suggest an energy source that is not included on this list,
please select "OTHER" and specify in the next question. If you would like to specify
more than one unlisted energy source, please separate your choices with commas in the
following question. [Multiple Choice, Can Select Multiple Choices]
Wood & Agricultural Products Oil (Petroleum)
Biomass Coal
Standard Wind Turbines Natural Gas
Offshore Wind Turbines Nuclear Energy
Solar Thermal (Heating) Maritime Energy
Solar Photovoltaic (PV) Geothermal
Solar Concentrating Solar Power (CSP) OTHER
8. If you selected "OTHER" in the previous question, please name the energy source(s).
[Text Entry, Minimum 100 Characters]
9. Using the energy sources you selected above for 2020, please describe why you chose
these options. [Text Entry, Minimum 100 Characters]

80
Appendix D: Round 1 Report
Findings for 2020 Portfolio:
Summary of Responses
This graph shows the number of times each energy source was selected to be included in a
survey taker’s energy portfolio for the year 2020.
Arguments for Energy Sources
Below are reasons survey takers decided to include, or not include, a certain energy source in
his or her 2020 energy portfolio. Unless noted, all responses below are “Pros” or benefits of the
listed energy sources.
*Note: Responses may have been edited for clarity and grammatical errors.
Key: Energy Source (Number of Votes)
General Solar Energy - PV(17), CSP(14), Heating(12):
“The renewable resources in the form of solar (PV and CSP) have great potential in UAE and their
projects are economically feasible.”
“However, apart from the obvious benefits to the climate, solar power also has an extremely high Return
On Investment over the long term.”
Solar PV (17):
“Photovoltaic cells is being more and more attractive with the increase in its efficiency and reduction in its
costs.”
Solar Heating (12):
“For water desalination, solar thermal heating and concentrating solar power can be used for partial
heating of water as part of the desalination process.”
Natural Gas (10):
“Since the target is 2020, I would like to keep the more common source of energy, such as natural gas
and oil.”
“Natural gas generation power plants is a must as it is characterized by a fast response to meet load
variations. Natural gas is the lowest emission fossil fuel resource.”

81
“A gas powered plant is over 40% efficient in terms of power production, and combined cycle plants are
over 60% efficient.”
Offshore Wind Turbines (8) & Standard Inland Wind Turbines (4):
“For 2020, renewable energy should have an important presence in the [energy] mix, especially wind and
solar photovoltaic, which has a very good benefit/cost ratios.”
Oil (7):
“Conventional energy generation from oil (petroleum) is still needed until full dependence on renewable
energy sources is achieved.”
“Oil and Natural gas because of availability and economical values.”
“Maximize the usage of natural energy sources at a low cost.”
Biomass (6):
“Lot of waste available that can be used as an energy source.”
Nuclear Energy (3):
“Nuclear energy is a clean source and is a perfect option for baseload as renewable resources can not be
dispatched.”
Maritime Energy (3):
“I wish to see Maritime energy as UAE is surrounded by the Arabian Gulf and the Gulf of Oman or the
Indian ocean. However, I am not sure how mature is this technology.”
OTHER: Waste-To-Energy (1)
“Waste-to-Energy plant is a sustainable source of energy and does not require a huge area like a solar
farm. Waste remains a part of our daily lives, from organic matter to petroleum-based plastic, waste
comes in many forms. So as long as the community continue producing waste, the WTE plants continue
to generate energy.”
Findings for 2050 Portfolio:
Summary of Responses

82
This graph demonstrates the number of times each energy source was selected to be included
in a survey taker’s energy portfolio for the year 2050.
Arguments for Energy Sources
Below are reasons survey takers decided to include, or not include, a certain energy source in
his or her 2050 energy portfolio. Unless noted, all responses below are “Pros” or benefits of the
listed energy sources.
*Note: Responses may have been edited for clarity and grammatical errors.
Key: Energy Source (Number of Votes)
General Solar Energy - PV(19), CSP(18), Heating(14):
“The penetration of solar can be much higher in 2050 because of decreasing solar cost.”
“The Gulf region is one of the world’s richest areas in sunshine. Average annual sun irradiation:
~ 2000 – 2200 kWh/m2."
Cons:
“Considering the high demand of energy I am not too optimistic on just solar energy.”
Solar PV (19):
“I think in 2050, efficiency of solar photovoltaic cells will have increased to enable full dependence on
solar power to generate electricity for residential purposes.”
Solar CSP (18):
“Within this time frame, other sources can be completed, such as solar thermal or CSP.”
Solar Heating (14):
“Solar thermal will continue to [contribute a] large part in water desalination.”
Offshore Wind Turbines (12):
“I will go with the same options but added off-shore wind turbines as Wind energy has no potential in UAE
due to low average wind speeds; however, off-shore wind could be feasible.”

83
“ I do believe that by 2050 these are essentially inevitable, especially offshore wind (again, depends on
the wind resource and where the turbines would be) and photovoltaics.”
Cons:
“ Wind turbines are not there yet in my view due to the distance the energy has to be moved. However,
with the rapid pace at which technology is moving, my views may change in the next decade.”
Standard Inland Wind Turbines (8):
“Hopefully, wind turbines technology will also have evolved to enable energy generation from low wind
speeds inland and can be used for residential power generation.”
Maritime Energy (6):
“Maritime energy should be explored since Sharjah has a long coastline.”
Biomass (5):
Cons:
“I would think that biomass and wood products would have source limitations”
Natural Gas (4):
“Conventional and less pollutant sources, such as natural gas, might be still in use, just to regulate
renewable ones.”
“Oil and gas may become expensive commodity or vanish in that case the other reliable option will be
nuclear.”
Nuclear Energy (4):
“Nuclear Energy is a clean form of energy that is also very efficient.”
Geothermal (4):
Cons:
“I excluded geothermal because of harmful gases besides, due to the thickness of the earth's crust and
the variation of temperature with depth, UAE does not lie in economically feasible areas for geothermal
energy.”
Oil (1):
Cons:
“By 2050, we should have enough reasons to switch completely away from the traditional fossil fuel and
towards more environment friendly and renewable solutions.”
OTHER: Waste-To-Energy (1)
“The volume of waste is proportional to the growth of the population and the GDP of the country. By [the]
year 2050, I believe that the waste generated in Sharjah will also increase due to the development of area
and population growth. The more waste generated, the more energy will be produced and delivered to the
grid of Sharjah by the year 2050.”

84
Appendix E: Round 2 Survey Questions
1. First Name [Text Entry]
2. Last Name [Text Entry]
3. Using the given renewable energy sources, please allocate points based on how much you
expect the energy source to contribute to the entire portfolio for 2020. You have exactly
100 points to distribute. You may use no more than and no less than 100 points. The
survey software will prevent you from going above 100 points and moving on if your
total is below 100 points. There is a counter at the bottom displaying the total number of
points you have already used. [Constant Sum via Sliders]
Solar PV Oil (Petroleum)
Solar CSP Biomass
Solar Thermal (Heating) Standard Inland Wind Turbines
Natural Gas OTHER
Offshore Wind Turbines
4. Using the energy sources you selected above for 2020, please describe the reasoning
behind your distribution of points. [Text Entry, Minimum 150 Characters]
5. Using the given renewable energy sources, please allocate points based on how much you
expect the energy source to contribute to the entire portfolio for 2050. You have exactly
100 points to distribute. You may use no more than and no less than 100 points. The
survey software will prevent you from going above 100 points and moving on if your
total is below 100 points. There is a counter at the bottom displaying the total number of
points you have already used. [Constant Sum via Sliders]
Solar PV Standard Inland Wind Turbines
Solar CSP Maritime
Solar Thermal (Heating) Biomass
Offshore Wind Turbines OTHER
6. Using the energy sources you selected above for 2020, please describe the reasoning
behind your distribution of points. [Text Entry, Minimum 150 Characters]

85
Appendix F: Round 2 Report
Reasons survey takers decided to assign a certain energy source points in his or her 2020
energy portfolio are in quotes below. Responses may have been edited for clarity and
grammatical errors.
Key:
Energy Source (% Avg. Contribution):
[Respondent’s Points Allotted]: Explanation
Note: If multiple energy sources are listed, points
given are separated by commas for each source.
Findings for 2020:
Proposed Energy Portfolio for 2020
Arguments for Energy Sources
Solar Energy (PV (24%), CSP (7%), Heating (4%)):
[15, 5, 5]: “[I]t will take some time before solar power is considered an efficient source of energy. Solar PV
and Solar CSP farms require a considerable area to provide the quantity of power that would be relevant
to compensate for gas and petroleum based turbines currently used in conventional power plants.”
Natural Gas (31%) & Oil (24%):
[35, 5]: “Natural Gas and Oil (petroleum) have been included for obvious reasons, that is the current
dependence on these fuels mandates that conventional turbines are always available in energy portfolios
of the immediate future, at least on a standby basis.”
[30 ,45]: “Oil … due to its availability will keep dominating the market.”
Waste-to-Energy & Biomass (8%):

86
[?, 15]: “Biomass power plants are not efficient in terms of power generation. However, a reason for its
inclusion is the ample amount of [biomass available] as fuel for these power plants. Municipal Solid
Waste (MSW) is the general waste that is produced by humans all over the world. An efficient way of
reducing this waste [and it's disposing space] is to convert it to fuel for power plants. It won't increase
[overall] efficiency but will greatly impact the efficiency with respect to environment[al] conservation.”
Findings for 2050:
Proposed Energy Portfolio for 2050
Arguments for Energy Sources
Solar Energy (PV (43%), CSP (16%), Heating (9%)):
[9,15,1]: “Both [solar and biomass] are plentiful in this region and a good form of ensuring a clean
environment and atmosphere, without the emissions that are expended from conventional power plants.”
[50, 20, 0]: “Double sided panels, partly translucent panels will aid the spread of solar panels. But Sharjah
does not have a lot of land compared to other Emirates. So PV is capped at 50, CSP will thus need to be
developed. But time and cost may impede CSP, so capped at 20”
[35, 15, 10]: “SEWA can't completely rely on solar power because its not reliable and will require very
large energy storage batteries which is just not feasible”
Offshore Wind Turbines (5%) & Standard Inland Wind Turbines (3%):
[0, 15]: “Further inland in Sharjah near the mountains the wind speeds may be favourable because of low
population and no man made obstructions to wind. But wind is not very reliable, and UAE doesn't have
very high wind speeds as needed for very large power generation.”

87
Waste-to-Energy & Biomass(9%):
[60]: “Also, Waste to energy power plant[s] produce clean and renewable energy through thermochemical
process. The energy generated from WTE plants, reduces the dependency on the production of power
plants based [on] fossil fuels”
OTHER:
Hydroelectric (0.33%):
[5]: “[There is a] lack of information online regarding the availability of areas in the country for
development of hydroelectric power plants. [However] if the area is available, hydroelectric plants are
very easily a highly efficient and clean form of energy.”
Nuclear (4%):
[55]: The only resource needed to make nuclear energy a primary fuel is fully trained and dedicated staff
to run nuclear power plants. Nuclear energy can fully compensate for power generation, keep the
environment clean and necessitate the overall technological development of a country.
Natural Gas (8%):
[63]: “Gas is a local resource and will become more difficult to sell as the rest of the world moves to
renewables. Therefore, the producing countries will use [gas] to supply their own needs.”
Oil (3%):
[15]: “One reason being the characteristically unreliable nature of renewable resources. So to meet base
load demands, but to have a practical goal of weaning of oil I think a 15 percent generating capacity
based on oil is ok for 2050.”

88
Appendix G: Round 3 Survey Questions
1. First Name [Text Entry]
2. Last Name [Text Entry]
3. Do you believe that this is an optimal energy portfolio for Sharjah in the year 2020?
[Yes/No]
Yes, I think that this portfolio is something that Sharjah should aim to achieve for 2020.
No, I think this portfolio can be improved.
4. If answer to Q3 is “Yes”, complete 4a. If answer to Q3 is “No”, complete 4b and 4c.
a. Please explain why you agree with Sharjah's 2020 energy portfolio. [Text Entry,
Minimum 200 Characters]
b. Using the given renewable energy sources, please allocate points based on how
much you expect the energy source to contribute to the entire portfolio for 2020.
You have exactly 100 points to distribute. You may use no more than and no
less than 100 points. The survey software will prevent you from going above 100
points and moving on if your total is below 100 points. There is a counter at the
bottom displaying the total number of points you have already used. [Constant
Sum via Sliders]
Solar PV Oil (Petroleum)
Solar CSP Waste-To-Energy (WTE)
Solar Thermal (Heating) Offshore Wind Turbines
Natural Gas Standard Inland Wind Turbines
c. Using the energy sources you selected above for 2020, please fully describe the
reasoning behind your distribution of points. [Text Entry, Minimum 150
Characters]
5. Do you believe that this is an optimal energy portfolio for Sharjah in the year 2050?
[Yes/No]
Yes, I think that this portfolio is something that Sharjah should aim to achieve for 2050.
No, I think this portfolio can be improved.
6. If answer to Q5 is “Yes”, complete 6a. If answer to Q3 is “No”, complete 6b and 6c.
a. Please explain why you agree with Sharjah's 2050 energy portfolio. [Text Entry,
Minimum 200 Characters]
b. Using the given renewable energy sources, please allocate points based on how
much you expect the energy source to contribute to the entire portfolio for 2050.
You have exactly 100 points to distribute. You may use no more than and no
less than 100 points. The survey software will prevent you from going above 100
points and moving on if your total is below 100 points. There is a counter at the
bottom displaying the total number of points you have already used. [Constant
Sum via Sliders]
Solar PV Offshore Wind Turbines
Solar CSP Natural Gas

89
Solar Thermal (Heating) Nuclear
Waste-To-Energy (WTE) Oil (Petroleum)
Standard Inland Wind Turbines
c. Using the energy sources you selected above for 2050, please fully describe the
reasoning behind your distribution of points. [Text Entry, Minimum 150
Characters]

90
Appendix H: Transcript for Interview with Professor 1
Note: Transcripts may have been edited for conciseness or clarity. Text in italics indicate a
member of our team speaking. All other text is the survey participant speaking.
So we just have a few questions concerning some of your answers. Between round one and round
two, in round one, you included nuclear and geothermal, you said you wanted it in your
portfolio. But then in round two we removed geothermal because it was one of the least popular
options. But we did leave the other in case people wanted to add it back in there. So we were
wondering why you didn't include nuclear and geothermal.
I mean, I'm not a big fan of nuclear and geothermal as a whole. But we do have a lot of nuclear
plants throughout the world, and there's no sign that it is going to go away anytime soon. So
there are also a lot of places nuclear energy plants are getting built, UAE including. I mean, it
has his own plus and minus, of course, because nuclear compared to other fossil fuel based
energy technologies, definitely many people view it as environmental friendly, because it doesn't
produce carbon dioxide to some degree. But definitely it has its own bottleneck of what to do
with the waste. So that is one of the reasons, especially after what happened to Japan. Everybody
started being a bit conservative on not going full blown on nuclear, but many people were
advocates of nuclear in the past and their big argument was that it's much more environmentally
friendly. And also cost wise I think is much lower cost compared to many other many other
options. So if you asked me, if it is not a choice definitely I could replace it with some other
choices. But this is this is probably the reason you saw me. I'm not a big advocate on that on this.
Geothermal on the other hand, yes, I do like this, not that I don't have positive feelings for
geothermal. But the problem with geothermal, whether the contribution of geothermal could be
very significant or not in the years to come is not something I'm as certain as some of the other
choices. For example, we know that solar cost wise we can compete, which is not necessarily the
case for many other emerging technologies where, theoretically, this sounds nice, they look nice,
but no guarantee that in the long term you're going to see that happening.
If we did keep geothermal in round two and three, if we kept that as a slider choice, do you think
you would have given it points?
Yeah, given choice I definitely would.
As a follow up to those two questions, were your answers usually like a balance of practical and
an idealistic view. What were you thinking when you when you were thinking about a possible
portfolio?
Of course, there's a balance. Sometimes it is easy to get too idealistic and say we're going to
change the world. I mean, obviously reality is if you don't find it realistic enough, which is still
ambitious, by the way. I saw that the plan that you put, I still find it ambitious because shooting a
target of more than 60% based on solar energy, even by 2050 is a very ambitious target to begin
with. Which is fine. We do need to have some ambitious target as well. They need a push, if they

91
have the push that will be able to at least come closer, which itself would be a become a big
accomplishment on itself. But we still want to see that the other side of the constraint we
understand and appreciate that we don't understand their limitations. So that's something that’s
definitely the biggest trend not only for this. Everywhere the biggest bottleneck is that the
technologies that we use, we are comfortable. So the question is, why do we want to change?
Right? So the motivation has to be strong enough, big enough to put it away from the fossil fuel.
Especially, we're talking in a place where we do have natural resources in terms of oil and gas. If
it’s something they already have, they know the plus and minus of these technologies, the
question is not an easy sale for them, even to their management. Why they need an abrupt shift to
something that we actually don't know. A lot of things about them. There's positive and negative
in both sides.
In round one, you said that by 2050 we should have enough reasons to completely step away
from fossil fuel and towards more environmentally friendly and renewable solutions. Why did
you add natural gas and oil in 2050?
Yeah, I think it's more of a realistic side of me, which more or less accepts the fact that we
probably would not be able to completely eliminate it, knowing the fact that Sharjah do have
some of the natural resources. So I doubt they're going to go completely away from it. If they
didn't have it, if they had to bring it from somewhere else, then things would have been a bit
different. But that's not the case.
And in for rounds two and three, we had a report from the previous rounds before the survey. Do
you think that affected how you answered?
I'm not sure. Yes, it does to some degree, but I wouldn't say dramatically.
Was it surprising to see some of the results or was there anything that caught your eye from what
the other experts mentioned?
A little bit more reliance on biomass. I probably wasn't expecting that. But it kind of makes sense
to me, because SEWA is building a waste to energy power plant. Following SEWA Abu Dhabi
also started discussing that possibility. So there could be a scenario where we might be seeing
more and more. UAE in general, I would say it's a more of a consumer country. So more of
consumption, meaning more of waste that is getting generated. So managing those waste has
always been a will always be a problem. So for that reason, biomass and waste-to-energy based
facilities are probably going to be more popular than we think. And this is worldwide. This is not
a new technology, by the way. I mean, lots of places already have it. So they have enough reason
to believe that this is going to work.
Great. Thank you. I think that's all the questions that we had for today. Thank you.

92
Appendix I: Transcript for Interview with Professor 2
Note: Transcripts may have been edited for conciseness or clarity. Text in italics indicate a
member of our team speaking. All other text is the survey participant speaking.
In round one: You had biomass in the portfolio for 2020, but you excluded it from 2050. Can you
explain why you did so?
Specific reason, no. I just changed my mind about this. I wrote a reason for the biomass on the
2050. It's not a clean source. Besides, Sharjah in specific, they don't have these kind of industries
that provide these kind of wastes. Meaning, it's like the waste that are useful biomass, and
biomass generation are not just the ordinary user’s residential wastes, so it's too costly to do it
from residential waste. Recycling is okay, but producing electricity is another thing.
In round one in 2020, you pick both nuclear and maritime as energy sources, but then in round
two, you didn't assign any points to either of them. Was there a reason for this?
For 2020, maybe I didn't take much notice much of the timeline, the year is less than a year
away. When I noticed that, when I talked about 2050, nuclear had a lot of problems especially
for SEWA as UAE as a whole. But for SEWA, in specific, it's going to be problematic. More of
technical points. And there are other, like emissions, emissions production are not priorities now.
It is not how clean the sources is. It is technically how the source could meet the requirements.
Nuclear. First, it cannot be built in small scale, it has to be built in a massive scale. So, building
nuclear power plants, would possibly cover all SEWA requirements, which is not possible
because the nuclear power plants you cannot trap it. So don’t go for it if this is going to cover all
the requirements. It usually covers what is called the base load, the part of your load that is
almost fixed. For SEWA, maybe you are talking about one giga or 1.5, which is a quarter power
plant, very small.
In round three: You added natural gas in the portfolio for 2050 after you excluded it from round
two. Can you explain why you did so?
At SEWA, there is currently 100% natural gas. Usually other countries or other utilities always
have natural gas, as an element. It cannot be decreased. Because natural gas, among other
resources, the only one that turns a micro-gas turbine, where it's just gas, not steam, just exhaust
gases. So it responds much faster than the other through steam. So this is maybe the fastest
option they have. So they cannot get rid of it. But here comes some politics. I mean, if you can
rely on another emirate with providing you with this fast response, you can have your system
without natural gas. But it's all like this part is have to go to the interlinks between SEWA,
Dubai, Fujairah, and all the other emirates. And if everyone realized that other Emirates will be
providing the fast response units, then it's a big problem. No one will have it, you get the
problem. So, like, as optimistic point of view and emissions. Let's get rid of natural gas, but we
can't. Even if you want to increase the efficiency of natural gas and provide a combined cycle of
the natural gas, you take the exhaust and use it to produce steam. It will slow down your
response. Because now if you have steam and gas in the same cycle you have to follow the speed

93
of the steam. So the whole system efficiency will increase the response will decrease, meaning as
if you converted, just from natural gas, using a gas turbine to any resources that can use steam,
like nuclear like fuel, oil, so on. So, yeah, some of the responses for the beginning, I was
optimistic about and looking at the emissions. And then I start looking at some technical aspects.
For round two, you picked an “OTHER” option saying you wanted large scale storage devices.
Can you please explain?
Yeah, this is not a generation option, but this could replace the natural gas. I mean, storage has a
very fast response, faster than any generation unit we have. The idea that, if you have, for
example, nuclear, which you cannot control it, and you have storage, both together will be a fast
responding generation system. But the problem with the storage system is that it's too expensive.
And the portfolio I don't know if you're talking about an energy generation portfolio. I'm not sure
if you want include storage or not, but possibly it's a technical part of it.
This is back to nuclear. So, you said that loads vary significantly from summer 100%, to winter,
30%. What were you referring to?
So it's the demand of the SEWA network that goes from 100% in summer to 30% in winter. If
you have a nuclear power plant rated at 100% of your load, then you will not utilize it fully
meaning in the winter. You have to reduce it up to 30%. The main idea for nuclear power plants
to be economically feasible is that you utilize it almost 100% all the time, you just turn it off for
maintenance, you don't reduce the output. In this case, the only way to have a nuclear power
plant is to have it at 30%, which covers the winter, and also would run in the summer
continuously. This is too small for a nuclear project. You see where the problem lies?
In your response for round three 2050, in the very last in the very last sentence, you just said
offshore wind turbines, and then nothing else. We were just wondering if you wanted to explain
anything in that section?
The speed inland is not sufficient economically compared to other wind turbines. With offshore
there is a chance. SEWA, and I think even Abu Dhabi and Masdar in specific, they're investing
in wind turbines in the UK. They are not investing in wind turbines in the region, because of the
average wind speeds, even if you go offshore. Yes, it's economically feasible, but not that much.
If you are going to invest, at that point you will invest in another country. SEWA, if they want
the best, it's going to be offshore, they cannot put it inland. There are two ways, SEWA only
have a shore on the Arabian Gulf. On the other side, on the Indian Ocean, which is called the
Gulf of Oman. There are small spots actually related to Sharjah, related to the same Emirate
SEWA covering, but they are like they are separated. These spots will be the perfect location if
you want to put offshore wind turbines, because the speeds over there, are much more than the
Arabian Gulf.
Do you think that reading through the reports changed how you answered in the next round?

94
Yes, yes, of course. I did read some of these responses and I changed my mind about some
things.

95
Appendix J: Transcript for Interview with Professor 3
Note: Transcripts may have been edited for conciseness or clarity. Text in italics indicate a
member of our team speaking. All other text is the survey participant speaking.
Alright so then from round one to round two. For at least in round one for 2050, you had nuclear
energy is one of the options. We were wondering why you didn't assign nuclear any points in the
Round 2 portfolio.
I don't have preferences for nuclear I even wrote it for the first of it. Like, I'm not a fan of
nuclear, even with all the safety because one incident could happen and it can damage, really big
area. But, again, since baseload is needed. And let's say 50 years from now, there is no oil, then
we have to have a base load and the only stable one would be nuclear. So, we can, or were forced
to use it but bare minimum. That's what we will use whatever like I think 25% will be the base
load. At that time, with huge capacity of batteries available with customers.
Okay, all right, and then so for round three. Well for rounds one and two you added offshore
wind for both of them, and then in round three you removed it for both 2020 and 2050. Why'd
you decide to remove it?
Well, again because I just really thought about it. If you're thinking only short term, I understand
that they're gonna have really wide coastal region that they can put this wind turbine, but wind
turbine will not work actually in all UAE, because the speed. The average or what they call it the
rule of thumb, speed has to be above three meter per second, to have feasible wind turbine. Here
it's always below that value inland. Offshore I don't know the statistics for the offshore I think
they can use it but it came to me that this is for Sharjah and they don't have really big coastal
area to have an offshore wind turbine.
In round three, you said, "A baseload is still needed for a stable electric network with either,
which either will come from fossil fuel or nuclear." We're just wondering, why do you prefer
fossil fuels over nuclear.
Because if an accident happened at the fossil fuel plant, I think long term that small area gonna
get damaged, if it happened in power plant, it will go across borders to other countries. I cannot
understand people going to nuclear, and they will sit next to them, even if they agree then will
the people next, next to them, like their neighbors agree? I will not accept it will be disaster such
a small scale disaster and disaster will happen. All engineering projects, whatever, anything you
think about can explode. It's really scary thing to do fossil fuel cannot stay just longer period
until enough good capacity of batteries will be available within the customer base even houses,
then baseload will not be a problem, which means every house has to have batteries. And this
needs enough time to get penetrated in the market because we cannot even, even on centralized
batteries.
In round three you added waste-to-energy for 2050. And so what are your thoughts on the waste-
to-energy system?

96
We are burning the waste. So, this will contribute to pollution anyhow so I thought on it. And
then we need to have electricity we need to have this energy. I thought about it once more I said
well biofuel will be feasible, when only oil is not there, especially in this region because still
producing oil for even what they call it shell oil in this area. It's on the surface so it's not difficult
to produce and it will be cheaper than treating waste, so I added this just because you say 2050,
if there will be regulation banning people from using oil, let's say for pollution and it will be
enforced by other countries, then we have to use any other source of energy.
All right, and then just one last question. Do you think that reading through the report after each
round, do you think affected your answers for the next round.
I think the second round for sure. Firstly I was surprised on the first report, it just made me think,
or see how other people think about energy resources. But some of that for me was not feasible
like I mean, especially people for enforcing or liking to have nuclear or seeing the value of
biofuels. I'm not saying biofuel is of no use. Putting without produce enough bio material to
accept our regular voice we're not an agriculture country that produces lots of agriculture waste
or like animal waste, so you need to import this to make it feasible to produce power. Even UAE
is one of the highest in producing waste per capita or per person, but still it's not enough to
produce sustainable energy and make it as cheap of oil. Again, oil costs three to $4 a barrel to
produce other countries it take them, 20 from regular oil. And if you're going to go to with Shell
Oil, it goes $40 per barrel, so there isn't. As I said, if everyone's switch to renewable that's fine.
People still gonna use oil because it used to come out to the ground so people without the need to
produce oil. They used to see oil coming out of the ground. Now maybe it's not the case. But it
doesn't cost that much to get it out. Like in the UK or what they call it, north of UK, they need to
drill, really deep sea to get there, the UAE doesn’t have to go thousand meters down to get oil so
production is not that difficult.
One other question actually you're saying the main issue with nuclear for you personally is the
safety Yeah, yeah, there's actually, I mean I don't know the name of it but there's statistics to tell
that per like deaths per terawatt of power produced. Coal has the highest number of deaths
Because the nuclear for this amount of energy you can tell much energy we use from nuclear to
call it was still a small portion. So, when you tell me like nuclear use now let's say we have 5%.
So 5% percentage of accident in the 5% compared to percentage of accident in to the whole oil I
mean coal use, I think it is much lower and I don't think that statistic is correct, in Ukraine,
Power plant that Chernobyl. Chernobyl 200,000 people were affected. They brought 20,000
workers just to fix the structure. It was saying that the 20,000 will die within two to four years.
And these guys are not in an accident they're coming to fix the accident. And they said, it was a
dilemma for the project engineer, he will recruit workers, and he knows these guys will not die
between two to four years. Tell them or not this is an ethical or professional dilemma. So, one
small accident, it's a disaster.

97
It's not about the amount produced, it's sorry it's not about the amount that we're using its
terawatt that's produced. So the capacity compared to the deaths, even though those individual
cases of Fukushima Ukraine, whatever. Even in total, it's not like the number of deaths actually
more for traditional fossil fuels and they are for nuclear, but if that's the case, would it change
your mind you think.
I don't think so. One thing just happened like this in one of these factories. We're going to keep
suffering for the next 50 years until this gets cleaned up, and bad enough, it won't get cleaned up.
I think this is a really big mess. To use nuclear said I'm not saying I'm against nuclear, there is a
way, they can build plant in very rural area with the really dramatic safety because who want this
to be next to his house even like when disaster happen it will go to the neighboring countries.
Thank you again for your participation.

98
References
Al-Mulali, U., & Che Sab, C.,Normee Binti. (2018). Energy consumption, CO. Energy Sources,
Part B: Economics, Planning, and Policy, 13(4), 231.
doi:10.1080/15567249.2012.689796
Al-Tajer, Y., & Poullikkas, A. (2015). Parametric analysis for the implementation of wind
power in United Arab Emirates. Renewable and Sustainable Energy Reviews, 52, 635–
644. doi: 10.1016/j.rser.2015.07.169
Bee'ah. (2017). Bee’ah and masdar launch joint venture to develop the first waste-to-energy
plant in the region. Retrieved from
https://beeah.ae/en/news/bee-ah-and-masdar-launch-joint-venture-to-develop-the-first-
waste-to-energy-plant-in-the-region
Dincer, I. (2000). Renewable energy and sustainable development: A crucial
review. Renewable and Sustainable Energy Reviews, 4(2), 157-175. doi:10.1016/S1364-
0321(99)00011-8
Dörrbecker, M. (2018). Municipalities of the emirate of sharjah (UAE) Wikipedia.
Gboney, W. (2009). Policy and regulatory framework for renewable energy and energy
efficiency development in ghana. Climate Policy, 9(5), 508-516.
doi:10.3763/cpol.2009.0636
Global Status Report (GSR). (2019, Jun 14,). Webinar invitation: The global status of
renewables - Ren21's 2019 global status report. Plus Company Updates
Gnana, J. (2019). Sharjah utility to tender water desalination plant in 2020 to meet rising
demand. Retrieved from https://www.thenational.ae/business/energy/sharjah-utility-to-
tender-water-desalination-plant-in-2020-to-meet-rising-demand-1.835326
International Trade Administration. (2019, August 7). United Arab Emirates - Renewable
Energy UAE - Renewable Energy. Retrieved from
https://www.export.gov/article?id=United-Arab-Emirates-Renewable-Energy
Keček, D., Mikulić, D., & Lovrinčević, Ž. (2019). Deployment of renewable energy: Economic
effects on the croatian economy. Energy Policy, 126, 402-410.
doi:10.1016/j.enpol.2018.11.028
Kuittinen, H., & Velte, D. (2018, January). Case Study Report Energiewende - ec.europa.eu.
Retrieved from
https://ec.europa.eu/info/sites/info/files/mission_oriented_r_and_i_policies_case_study_r
eport_energiewende-de.pdf
Liserre, M., Sauter, T., & Hung, J. Y. (2010). Future energy systems: Integrating renewable
energy sources into the smart power grid through industrial electronics. IEEE Industrial
Electronics Magazine, 4(1), 18-37. doi:10.1109/MIE.2010.935861
Masdar Institute of Science and Technology, & International Renewable Energy Agency. (2015).
Renewable energy prospects: United arab emirates. (). Retrieved from
https://www.irena.org/-
/media/Files/IRENA/Agency/Publication/2015/IRENA_REmap_UAE_report_2015.pdf

99
Obeid, J. (2019). Jordan: A case study in expanding renewable energy Castle Associates.
Peterson, B. (2017). Desalination and energy consumption. Retrieved
from https://www.energycentral.com/c/ec/desalination-and-energy-consumption
Saderne, V., Cusack, M., Almahasheer, H., Serrano, O., Masqué, P., Arias‐Ortiz, A., … Duarte,
C. M. (2018). Accumulation of Carbonates Contributes to Coastal Vegetated Ecosystems
Keeping Pace With Sea Level Rise in an Arid Region (Arabian Peninsula). Journal of
Geophysical Research: Biogeosciences, 123(5), 1498–1510. doi: 10.1029/2017jg004288
Said, Z., Alshehhi, A. A., & Mehmood, A. (2018). Predictions of UAE's renewable energy
mix in 2030. Renewable Energy, 118, 779-789. doi:10.1016/j.renene.2017.11.075
SEWA. (2019). About US. Retrieved from
https://www.sewa.gov.ae/en/content.aspx?P=mMVyU3I8qgk%2bJD3MkzcmSA%3d%3
d&mid=I82X5exjK422E8H%2bqZdAJg%3d%3d
Saderne, V., Cusack, M., Almahasheer, H., Serrano, O., Masqué, P., Arias‐Ortiz, A., … Duarte,
C. M
Sgouridis, S., Abdullah, A., Griffiths, S., Saygin, D., Wagner, N., Gielen, D., . . . McQueen, D.
(2016). RE-mapping the UAE's energy transition: An economy-wide assessment of
renewable energy options and their policy implications. Renewable and Sustainable
Energy Reviews, 55, 1166. doi:10.1016/j.rser.2015.05.039
Solar powered art installation on the Abu Dhabi Corniche for Sustainability Week 2013. (2013).
Retrieved from https://www.flickr.com/photos/gordontour/8430611366
The Editor. (2017). Sharjah census 2015 results announced: Sharjah population reaches 1.4
million. Retrieved from
http://www.sharjahupdate.com/2017/01/sharjah-census-2015-results-announced-sharjah-
population-reaches-1-4-million/
The Official Portal of the UAE Government. (2019, March 10). 15. Life on land. Retrieved
from https://www.government.ae/en/about-the-uae/leaving-no-one-behind/15lifeonland
The Official Portal of the UAE Government. (2019). Economy. Retrieved from
https://www.government.ae/en/about-the-uae/economy
Turner, J. A. (1999). A realizable renewable energy future. Science, 285(5428), 687-689.
doi:10.1126/science.285.5428.687
Twin, A. (2019). Delphi method. Retrieved from
https://www.investopedia.com/terms/d/delphi-method.asp
World Bank Group. (2019). The world data bank The World Bank Group.