a distributed programs monitor for berkeley unix … a distributed programs monitor for berkeley...
TRANSCRIPT

A Distributed Programs Monitor for Berkeley UNIX
Barton P. Miller Cathryn Macrander
Stuart Sechrest
Computer Systems Research Group Computer Science Division
Department of Electrical Engineering and Computer Sciences
University of California Berkeley, CA 94720
Abstract Writing and debugging distributed programs can be difficult. When a program is working, it
may be difficult to achieve reasonable execution performance. A major cause of these difficulties
is a lack of tools Cor the programmer.
We use a model of distributed computation and measurement to implement a program
monitoring system Cor programs running on the Berkeley UNIX 4.2BSD operating system. The
model or distributed computation describes the activities or the processes within a distributed
program in terms of computation (internal events) and communication (external events). The
measurement model separates the detection of external events, event record selection, and data
analysis.
The implementation of the measurement tools involved changes to the Berkeley UNIX
kernel, and the addition of daemon processes to allow the monitoring activity to take place across
machine boundaries. A user interface has also been implemented. We present a users' manual
and an example or the use or the measurement system.
Keywords Distributed, performance, debugging, monitor, UNIX.
Research tupported by the National Science Foundation K"oDt MCS-80tOG88, the State or Calif'omia MICRO
program, and the Derense Advance Research Projects Agency (DoD) Arpa Order No. 4031 monitored by Naval Electronic
System Command under Contract No. N00030-82-C-0235. The views and conclusions contained in this document are
those or the authors and should not be interpreted u representing official policies either expressed or implied, or the
Derense Advance Research Projects Agency or ol the United States Government.

Report Documentation Page Form ApprovedOMB No. 0704-0188
Public reporting burden for the collection of information is estimated to average 1 hour per response, including the time for reviewing instructions, searching existing data sources, gathering andmaintaining the data needed, and completing and reviewing the collection of information. Send comments regarding this burden estimate or any other aspect of this collection of information,including suggestions for reducing this burden, to Washington Headquarters Services, Directorate for Information Operations and Reports, 1215 Jefferson Davis Highway, Suite 1204, ArlingtonVA 22202-4302. Respondents should be aware that notwithstanding any other provision of law, no person shall be subject to a penalty for failing to comply with a collection of information if itdoes not display a currently valid OMB control number.
1. REPORT DATE OCT 1984 2. REPORT TYPE
3. DATES COVERED 00-00-1984 to 00-00-1984
4. TITLE AND SUBTITLE A Distributed Programs Monitor for Berkeley UNIX
5a. CONTRACT NUMBER
5b. GRANT NUMBER
5c. PROGRAM ELEMENT NUMBER
6. AUTHOR(S) 5d. PROJECT NUMBER
5e. TASK NUMBER
5f. WORK UNIT NUMBER
7. PERFORMING ORGANIZATION NAME(S) AND ADDRESS(ES) University of California at Berkeley,Department of ElectricalEngineering and Computer Sciences,Berkeley,CA,94720
8. PERFORMING ORGANIZATIONREPORT NUMBER
9. SPONSORING/MONITORING AGENCY NAME(S) AND ADDRESS(ES) 10. SPONSOR/MONITOR’S ACRONYM(S)
11. SPONSOR/MONITOR’S REPORT NUMBER(S)
12. DISTRIBUTION/AVAILABILITY STATEMENT Approved for public release; distribution unlimited
13. SUPPLEMENTARY NOTES
14. ABSTRACT Writing and debugging distributed programs can be difficult. When a program is working, it may bedifficult to achieve reasonable execution performance. A major cause of these difficulties is a lack of toolsfor the programmer. We use a model of distributed computation and measurement to implement aprogram monitoring system for programs running on the Berkeley UNIX 4.2BSD operating system. Themodel of distributed computation describes the activities of the processes within a distributed program interms of computation (internal events) and communication (external events). The measurement modelseparates the detection of external events, event record selection, and data analysis. The implementation ofthe measurement tools involved changes to the Berkeley UNIX kernel, and the addition of daemonprocesses to allow the monitoring activity to take place across machine boundaries. A user interface hasalso been implemented. We present a users’ manual and an example of the use of the measurement system.
15. SUBJECT TERMS
16. SECURITY CLASSIFICATION OF: 17. LIMITATION OF ABSTRACT Same as
Report (SAR)
18. NUMBEROF PAGES
32
19a. NAME OFRESPONSIBLE PERSON
a. REPORT unclassified
b. ABSTRACT unclassified
c. THIS PAGE unclassified
Standard Form 298 (Rev. 8-98) Prescribed by ANSI Std Z39-18

1
1. Introduction
1.1. Overview
Most operating systems being designed today support some level or concurrent programming
and multiple machine environments(Almes et al 83, Cheriton 6l Zwaenepoel 83]. Despite the
increased activity in distributed systems, there is no agreed upon model or computation, nor is
there a widely accepted model or program performance monitoring.
When we monitor a traditional, single process program, we observe such well defined metrics
as the paging activity or the frequency or subroutine calls. For programs consisting or multiple
processes cooperating in a computation, there are no such standards. Applying the traditional
metrics to the each or the processes in a multiple-process program does not provide a complete
solution. These programs present a new level or complexity. The main factors that contribute to
this complexity are a3ynchrony, time, and delay.
Asynchrony occurs when more than one piece or the distributed program is executing
simultaneously on different machines. A program that runs on a single machine, while possibly
having the illusion or parallel execution, really executes a single instruction at a time. When a
program runs in a distributed environment, we can have many instructions in the program
executing at the same time. Thus, synchronization or the different pieces or a computation is
more important and more difficult than in the single machine case.
Time is a factor or additional complexity because we cannot provide a universal time base
for all the machines. Time can be synchronized in a relative sense between processors(Lamport
78], but a complete ordering or events (full synchronization) is not possible. There have been
algorithms designed to keep an approximation or a universal time(Gusella 6l Zatti 83], but even
algorithms that work well cannot guarantee perfectly synchronized clocks.
The delay factor is due to the finite and non-deterministic time needed for communications
between machines. No action affecting a part or a computation on one machine can instantly
affect other parts or the computation on different machines. This causes two problems. The first
problem is that there is no way or obtaining an instantaneous picture, or 3nllp3hot, or the state or
a computation. The second problem is that there is no way of causing an instantaneous change of
control for all parts of a computation on different machines. Nor is it possible to arrange for
actions to occur at an agreed on time in the future, since we cannot keep the clocks fully
synchronized.
Traditional performance measurement and debugging tools do not provide enough
information to deal with the problems or a distributed environment. The concept or a
computation consisting or numerous concurrently executing parts is missing in them. The
primary goal or this research is to provide the tools and the methodology to deal with the
problems one encounters when developing distributed computations. In particular, we present the
Berkeley UNIX implementation or a system or tools(Miller 84] for monitoring such computations.
These tools are intended to aid the programmer in developing, debugging, and measuring the
performance or distributed programs. This is the second implementation or these tools. The first
implementation, described in (Miller 84], was for the DEMOS/MP operating system.
The remainder or this section describes the basic terms and definitions that will be used
throughout this paper. This will present a more concrete definition or the problem we are trying
to solve. The basic measurement model and methodology are presented in Section 2, which
includes a description or the components and structure or the model. Section 3 describes the
structure or the implementation or the measurement system for Berkeley UNIX. The structure or
monitoring facilities, both within the operating system kernel and outside, are described. Section
4 describes the user interfaces to the various parts or the measurement system. That section also
includes a user manual for programmers wishing to measure distributed computations.

I
1.2. What l• a Dl•trlbuted Program? And Other Deflnltlona
We define a distributed program (or more simply, a computation) to be a collection of
processes cooperating to perform a common task. The component processes are not constrained
to run on the same machine; no assumptions are made about the locations of the processes. The
two extremes are the case where aU processes run on the same machine and the case where each
process runs on its own machine. The tools and methodologies that we are describing do not
depend on how the program is physically distributed.
A process is the basic building block of a computation. It consists of an address space
containing code and data, and an execution stream. Each process has access only to its own
address space. Processes do two things: compute and communicate. Computing is the normal
execution of instructions. Communication is the means by which a process interacts with other
processes and with the operating system. An interaction is an activity that involves more than
one process, or a process and part of the operating system. The complexities of the distributed
environment become apparent when a process in a computation interacts with another part of the
computation.
Communication is based on messages. A message allows the copying of part of one process's
address space into that of another process. A message is an interaction involving exactly two
processes, the process originating the data (the Bender) and the process consuming the data (the
receiver). We make no assumptions about the network underlying the communications
mechanism. The model of communications described here is applicable to a wide range of
systems.
Berkeley UNIX is not a message based operating system. This means that some of the
interactions between a process and the operating systems (e.g., file system operations) will not
involve message communications, but rather a subroutine call style interface. The subroutine call
can be modeled as a request/reply message pair.
Processes execute on machinu, each consisting of a central processor (CPU), memory, and
peripheral devices. Machines do not have direct access to each other's memories. Each machine
has a portion of the operating system running on it to support process execution, communications,
memory management, and device management. The communication functions supplied by the
operating system provide for interprocess communications both within and between machines.
2. The Measurement Model and Tool Dnlp
1.1. Measurement Model
The model or processes cooperating via messages provides a uniform structuring for a
computation. The communications in a computation involve the processes performing the
communication functions, and the objects being communicated. This dictates the types of events
we will need to monitor to understand the behavior or a computation. First, we must monitor
events such as processes being created or destroyed, or starting or stopping execution. Second,
activities associated with the shipment, delivery, and receipt of a message must be monitored.
Also in this category are events describing the creation or destruction of communication paths.
There are two major requirements for the measurement model described above. These are
transparency and consistency. Transparency means that, when we talk of measuring events
associated with the execution or a computation, we assume that the measurement of these events
will do nothing (or at least as little as possible) to change how the events occur. Monitoring the
program is a passive activity. This is in contrast to message debuggers, which allow
rearrangement of the messages sent!Philips 82, Schifrenbauer 81]. No actions such as redirection of
messages, breakpoints, and modifications of the message streams are done. The measurement
facility should be an observer of the computation, and not in any way a participant.
3
Consistency means providing a uniform view of the computation being measured. The
programmer uses a certain set of primitive functions to build a distributed computation. The
programmer's model or computation and communication tends, therefore, to be based on these
primitives. The events defined in our measurement model should be consistent with this view.
Consider, for example, the problem or monitoring a message sent from one process to another.
The programmer would see und and receive operations. The actual communications may be
implemented using a protocol that involves acknowledgements, division of the message into fixed
size packets, routing decisions, and so on. Viewing the communications at this more detailed level
would obscure message delivery in unnecessary detail. Likewise, adding an extra level or
semantics to the measurement events!Baiardi et al 83, Bates 8l Wiled en 83J may be inconvenient
to the programmer. For example, if a formal description language is used to describe the correct
sequence or communications, we must ensure that the description is correct before we can
determine whether the program is correct.
Z.2. Measurement Tool Design
The design or a monitoring tool must embody the characteristics of the model described in
the previous section. In particular, our measurement tool must adhere to the principles of
transparency and consistency.
The measurements must be done in a transparent manner. This means that, to measure a
program, we cannot require a priori knowledge of the computation. No special action by the
programmer or the computation should be necessary, and we should be able to measure any
program. The program ought to be unaware that it is being monitored, and none or the interfaces
to the operating system should be changed. The measurements will cause some degradation of
the computation's performance, but this degradation should be kept as small as possible. This is a
standard goal for any measurement facility, and early examples of this can be found in !Ferrari
78J.
We require the measurements to be consistent with the programmer's view. The
measurements are based on the recording or interesting actions occurring during the lire or
processes within a computation. These actions, called meter event8, or simply event3, consist
primarily or activities that reflect interactions between processes (such as messages being sent and
received). Events related to communications are recorded, as are events that pertain to the
change of state of the processes in the computation. These events include the creation of a
process, the starting and stopping or its execution, and the destruction (termination) or the
process.
.,
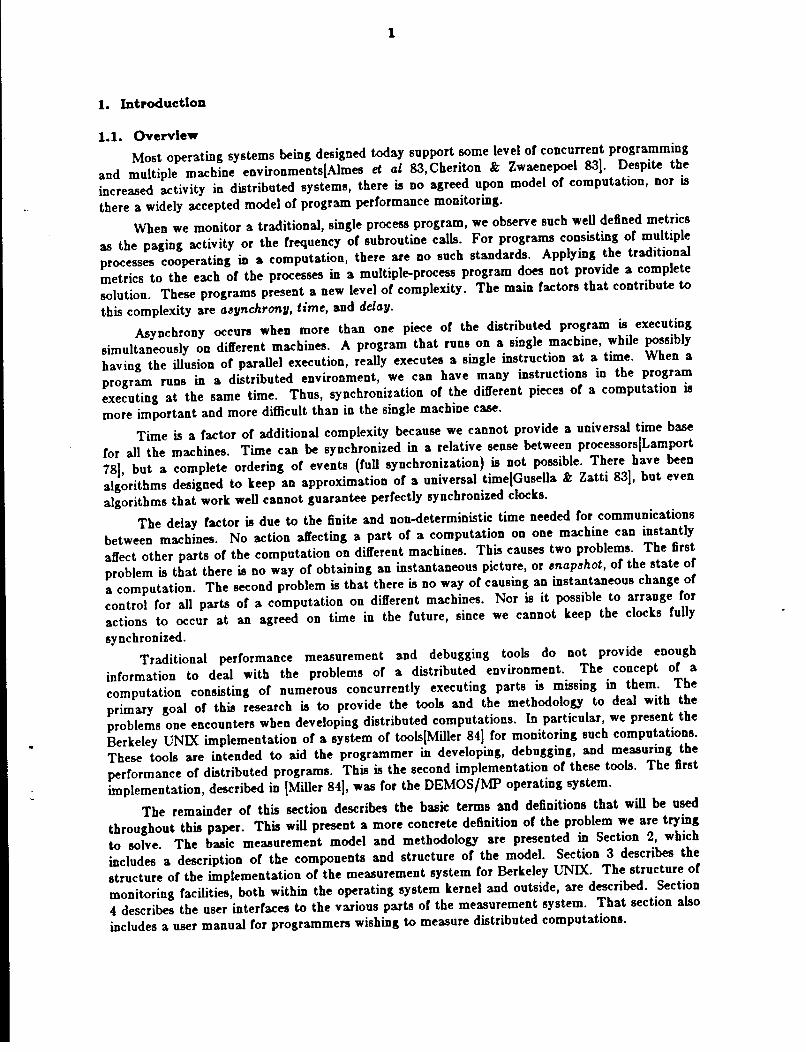
Figure 1.1 Overview of Meuurement Faclllty
The overall structure or the measurement facility is shown in Figure 2.1. The three stages
of measurement are called metering, filtering, and analy.!i.!. Metering is the extraction of the
data from the operating system for processing outside of it. We refer to the operating system
kernel as that part or the system that implements the basic objects and communications
primitives. The ho.!t kernel is the kernel for the machine on which a particular process currently
resides. Note that this implies that each machine bas a kernel or portion of a kernel resident on
it. The ho.!t operating .!y.!tem is the operating system of which the host kernel forms a part.
Filtering does selection and reduction of the data. This stage records or passes the reduced data
on for analysis. Analysis is the extraction or information from the collected data. For a complete
motivation and overview or the parts of the measurement system, see !Miller 84J.
The measurement structure is similar to that of METRIC!McDaniel 75J. Our measurement
system differs from METRIC in a number or ways. First, METRIC was not transparent;
programmers bad to explicitly insert trace calls into their programs. Second, METRIC used a
different model or distributed processing. The design or METRIC incorporates the concept or a
broadcast network media, with the structure or the network visible to the measurement tools.
3. Structure of the Meuurement Tool
The measurement tools for Berkeley UNIX have a structure dictated by the model or the
previous section. Metering is implemented in the UNIX kernel by examining the system calls
made by metered processes and generating meter messages. The meter messages are sent to a
filter across a communication path provided for each metered process. In addition to the metered
processes and the filters, there is a user interface process, called the control process, that assists in
the creation and control of the metered processes and filters. The following sections describe
interprocess communication in Berkeley UNIX 4.2BSD, the implementation or metering within the
kernel, the design or a filter process, and the design or the control process. The control commands
available to the user are discussed in Section 4.3.
3.1. UNIX Interproceaa Communication
This section briefly reviews the interprocess communication (IPC) mechanism available in
Berkeley UNIX 4.2BSD. The system calls that provide the interface to the IPC mechanism are
discussed to clarify the relationship between the calls included in a program and the events that

6
are metered by the monitor. For a more complete description or Berkeley UNIX 4.2BSD IPC
see !Leffler 83, Sechrest 84J.
Communication in Berkeley UNIX is based on ~ocket~. A socket is an endpoint or
communication. Sockets are created by processes in order to be able to communicate with one
another. A socket, once created, exists independent or the creating process. Several processes
might have access to the same socket at the same time. A socket disappears when it is no longer
reCerenced by any process. Ir a process Corks, its child gains access to the parent's sockets, just as
the child gains access to the parent's open files. Pointers to sockets and open files are recorded Cor
each process in a descriptor table.
Communication has two phases: establishing a channel Cor communication, and transCerring
data. A channel may be established between two sockets beCore any messages are sent. This is
done Cor connection-based, or ~tream communication. A new channel may also be established Cor
each message as it is sent. Connectionless communication is done with datagrams. The term
datagram has certain other implications that will be discussed below.
Datagrams are messages exchanged between unconnected sockets. The delivery or the
messages is not guaranteed, though it is likely. Nor is the order in which a set or datagrams
arrive guaranteed to be the order in which they were sent. A datagrams is read as a complete
message. Each new read will obtain bytes Crom a new message.
Stream communication concatenates messages into a single, reliable, ordered byte stream.
In this case, message delivery is guaranteed and messages arrive in the same order as they were
sent. As many bytes as possible are delivered Cor each read without regard Cor whether or not the
bytes originated rrom the same message.
When two processes communicate with datagrams, each creates a socket with a call to
socket(}. To send a message rrom one socket to the other, it is necessary to speciCy the
prospective recipient. A name is given to the recipient when the owner or the target socket calls
bind{}. Once the receiving socket has a name, the sender may send a message by calling the
routine ~endto(), with arguments speciCying the message and the name or the recipient. (It is also
possible Cor the sender to predefine the recipient by calling the routine connect(), specifying the
recipient's name, and then calling ~end(}, speciCying the message.) The receiver reads the message
by calling one or five routines, read(}, readv(}, recv(), recvfrom() or recvmsg(). These routines are
only slight variations or one another, and thus we may assume that the program always calls
read(}.
Stream communication requires that a connection be established between two sockets.
Typically, connections are formed Collowing a client-server model, though after the connection is
established there is no difference between the two processes in their use or the connection Cor
communication. One or the processes must initiate the connection, acting as a client; the other,
acting as server, must have bound a name to its socket, must have initialized a queue or pending
requests, and must accept the connection. As before, sockets are created by calling socket(}, and
names are bound by calling bind(}. The list or pending connections is initialized by calling
listen(), specifying the maximum number or connections allowed to wait. Connections are
initiated by calling connect() and specifying a name, and accepted by calling accept(), without
speciCying a name. To be successCul, these calls must Collow the binding or the target name and
the initialization or the pending connection list by a call to li~ten(}. Either call can result in the
process blocking until the other process bas made its call and the connection is established. The
result or the calls is the creation or a new connection ~ocket owned by the accepting process and
connected to the initiating process's socket. The accepting process's original socket is only used
for the establishment or connections. Transfer or data is done through the connection socket,
which disappears when the connection is broken. A connection consists or a pair or byte streams
traveling in opposite directions. Hence one can both read from and write to a connected socket.
Either process may send a message to the other by calling one or four routines, namely write(),
writev(}, und(} or ~endm~g(}, that may all be thought or as variations or write(). Messages are
0
read by calling some variety of read(}.
It is also possible for a process to obtain a pair of connected sockets by calling the routine
~ocketpair(). Since the sockets created can be inherited by a child process when the process forks,
processes can use socket pairs to set up communication between their children in a simple way.
Socket pairs provide stream communication identical to that provided by sockets connected using
connect(} and accept().
3.1. Kernel Level Structur•
To monitor a process's communications, it is necessary for the process's IPC events to be
detected, and for a filter process to be informed when one of these events occurs. Typically these
events are associated with system calls. For every metered process, a connection is established
with the filter. On every call to a routine that might initiate a meter event, the kernel checks
whether the call is currently metered for the process that is making the call. If the call is
metered, the kernel creates and stores a message containing trace data. When a sufficient number
of messages have been stored, the kernel sends them together to the filter across the meter
connection. AB part of process termination, any unsent messages are forwarded to the filter. Of
course, it is also possible to have aU meter messages sent immediately after the occurrence of each
event.
In UNIX each process is described by an entry in the process table. This entry is available
even when the process is not running. For the purpose of metering, three fields have been added
to the process structures in the process table. One field is a pointer to the meter ~ocket, a socket
which has been connected to a filter process. This connection differs from other IPC connections
in that the descriptor of the socket through which meter messages are sent to the filter is not
stored in the process's descriptor table and is, therefore, not directly accessible by the process. A
second field is a bit mask indicating the events to be metered. (This is currently a 32 bit word,
but it could be expanded.) The third field is a pointer to meter messages that have yet to be sent.
The meter socket is created and connected to the filter by the control program. The fields
of the process table that point to the meter socket and hold the meter event bit mask are set by
the system call ~etmeter(), described in a later section. The bits of the bit mask are called the
meter flag~. Both the meter ftags and _the meter socket can be changed at any point during
process execution by any process having the same effective user id or any superuser process.
When a process forks, the child process inherits the meter socket and the meter ftags of the
parent. Thus, all of the children of a metered process will also have the same events monitored. If
an outside agent is used to create a process, such as the system rezec server, the new process will
be monitored only if the server is being monitored or if monitoring is explicitly set for the new
process after it is created.
In general, each communication event for a process corresponds to a meter event. For
example, one can meter both accepts and connects, or only one of the two or neither. However,
the many versions of write{) all correspond to the same meter event, as do the varieties of read(}.
It is not important to distinguish between the varieties of these operations to understand the
communication taking place. Similarly, ~ocketpair() is not treated differently from a pair of
socket creates followed by separate connects and accepts; all four messages are produced.
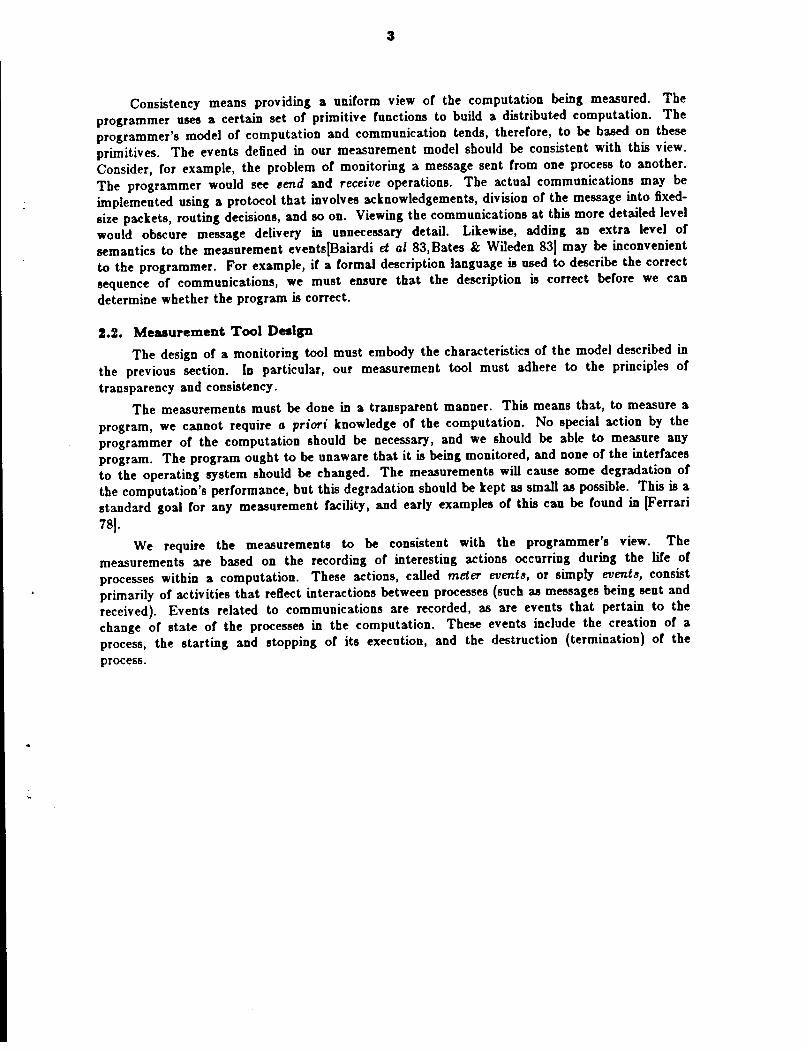
3.3. Proceu Structure of the Measurement Sy•tem
The measurement system is a distributed program in that it is structured as a group of
cooperating processes not required to execute on the same machine. Active cooperation among
these processes is necessary. The measurement system has four parts, the meter~, the filter
processes, the control process, and the analy~i3 routines. This structure is illustrated in Figure
3.1.

Dnetered processes
o9 il-9 i :
0 0
L.~------·-·-·-·-i
7
filter
Dneter . . -·······························
. .
..............................................................................................................................
IPC connections
control process
\ \
6J rdaeDnon
Figure 3.11 Structure of 4.JBSD Meterln1 Toola
The meter is responsible for the extraction or event data. Metering requires the ability to
detect process events and to subsequently pass the event data on to the next stage or
measurement. Events are detected in the kernel, data are extracted from operating system data
structures, and these data are sent as an event record over an IPC connection to a filter process.
The selection, reduction, and storage or trace data is the responsibility or a filter process.
This represents the second stage or measurement. A filter is the recipient or the measurement
data that are generated by the meters. The user may only be interested in saving meter events
which match certain criteria. For example, the user may only want to save event records or
messages having a message length over a specified minimum, or event records or a process only
when the CPU time is under a specified maximum. It is the filter that interprets the selection
criteria and decides which event records are to be kept and which are to be discarded. Filter
processes do not exist by default in the measurement tool. The user must tell the control process
to create a filter process. Many filter processes may exist simultaneously. Usually, there will be a
filter process created per computation. A standard filter, described in section 3.4, is provided by
the measurement tool. However, given a few basic constraints, custom filters can be easily
written.
The task or organmng the parts or the measurement system and providing a control
interface to the user is performed by the control process (or controller}. The controller provides
the mechanisms for establishing the communication paths between all or the components or the
measurement system. The controller is a command interpreter. It provides the user with a
concise menu or commands to use in the measurement and control or one or more distributed
computations. The controller, upon receiving a command, interprets the command and perforDns
the requested function. Executing this request may require interacting with other components or
the measurement system and establishing communication paths between the various components.
The analysis routines provide the means for interpreting the traces created by filters. They
give meaning to the data by summarizing and operating on the event records collected. The user
produces his own analysis routines according to the purpose or the study. Examples or some
analyses that have been performed are detailed in !Miller 84]. These analyses include
communications statistics, measurement or parallelism, and structural studies.
8
3.4. Dealgn of the Filter
Difl'erent filter processes can be used in the measurement system. Given one basic
constraint, a user can write a custom fitter. This one constraint is that a filter process must listen
to its standard input in order to receive meter messages from the kernel meter. Once the filter
has received these messages, it8 actious should not afl'ect the operation or the rest or the
measurement system processes. A staadll.rd filter is provided by the measurement tool. Arter
receiving a message from standard input, the default filter performs selection and reduction
operations on the event records received. It uses event record descriptions and selection rules to
specify the criteria for data selection and reduction.
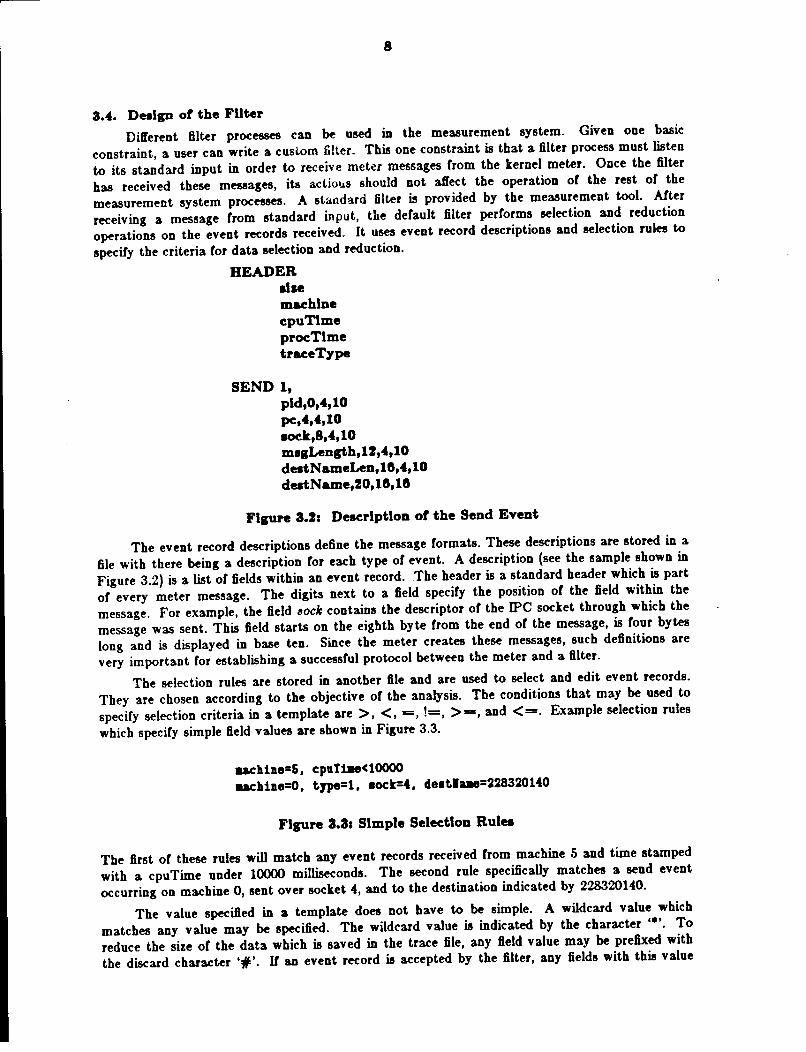
HEADER 1lse maehlne cpu Time procTime traeeT;ype
SEND 1, pld,0,4,10 pc,4,4,10 10Ck,8,4,10 msgLength,U,4,10 destNameLen,1&,4,10 destName,20,1&,1&
Figure 3.2: Description of the Send Event
The event record descriptions define the message formats. These descriptions are stored in a
file with there being a description for each type or event. A description (see the sample shown in
Figure 3.2) is a list or fields within an event record. The header is a standard header which is part
or every meter message. The digits next to a field specify the position or the field within the
message. For example, the field 3ock contains the descriptor or the IPC socket through which the
message was sent. This field starts on the eighth byte from the end or the message, is four bytes
long and is displayed in base ten. Since the meter creates these messages, such definitions are
very important for establishing a successful protocol between the meter and a filter.
The selection rules are stored in another file and are used to select and edit event records.
They are chosen according to the objective or the analysis. The conditions that may be used to
specify selection criteria in a template are >, <, =, !=, >=, and <=. Example selection rules
which specify simple field values are shown in Figure 3.3.
aachine=&, cpuTt.e<10000 aachine=O, tJP8=1, •oct=4, destlaae=228320140
Figure 3.3: Simple Selection Rules
The first or these rules will match any event records received from machine 5 and time stamped
with a cpuTime under 10000 milliseconds. The second rule specifically matches a send event
occurring on machine 0, sent over socket 4, and to the destination indicated by 228320140.
The value specified in a template does not have to be simple. A wildcard value which
matches any value may be specified. The wildcard value is indicated by the character '*'. To
reduce the size or the data which is saved in the trace file, any field value may be prefixed with
the discard character '#'. II an event record is accepted by the filter, any fields with this value

prefix will be discarded. Examples of selection rules which use these options are shown in Figure
3.4.
.achine--t•. type=1, pid=l•, •1ze>=612
type=8, •octlue=peerlue
Figure 3.4& Selection Rulu
A filter sends its output to a log file located in the "/usrftmp" directory. Each filter has its
own log file. This file is used to store the trace messages collected by the filter. When a
computation is associated with a filter, all or the event records produced by processes which are
part of the computation are stored in that filter's log file. U desired, it is possible to have one
filter collect data from several computations. The events detected and logged by the filter process
are not seen by the user as they occur. Event records are sent directly to the filter. When the
computation has completed, the user then retrieves the trace file produced by the filter and has
the data analyzed.
There are no restrictions placed on the locations of the processes in the computation and on
the location or the filter to which the processes are connected. A filter process may execute on a
machine that is disjoint from the set of machines on which the processes of the computation are
executing. In situations where filter operations contribute significantly to the system load (i.e,
when large computations are being metered), this ftexibility may be useful.
3.5. Deelp of the Controller
The design or a distributed computation is often more complicated than a program designed
Cor a single machine environment. Issues which demand little or no attention when only one
machine is involved may demand significant attention when addressed in a distributed computing
environment. Since the measurement system is a distributed program, the implementation of its
control program addresses many or the issues involved in distributed computing. We discuss a
number of these issues in the remainder of this section.
3.5.1. Proce•• Control
The first design issue to be addressed is process control. The minimal requirement Cor
establishing a distributed computation is to have a facility Cor creating processes on the various
machines that are to be involved in executing the computation. A more powerful tool should also
provide mechanisms to specify the events to be metered Cor a newly created process, change this
specification Cor an existing process, start a remote process, and stop a remote process.
Furthermore, when a process is created, it should be suspended prior to the start of its execution.
This is necessary to give a user sufficient time to specify the desired measurement strategy and
provide some control over the time that various processes start executing.
Process control is easily accomplished within a single machine environment. To create a
process, a standard UNIX system provides the fork(} and e:eec(} functions. To subsequently start,
stop, and terminate the execution or a process, UNIX signals are used. Through the UNIX
aignal(} system call, changes in a process's state (such as normal process termination) can be
detected and control can temporarily be given to signal handling routine Cor signal processing.
Thus, the problem or process control has a readily available solution Cor a single machine
environment running under Berkeley UNIX.
The situation is not as simple Cor controlling processes across machine boundaries. The
controller must have the power to play an active role in the control of a process on another
machine. U the operating system underlying the measurement system made no distinction
between different machines as in DEMOS/MP[Powell & Miller 83J, process control in a distributed
system would be as simple as it is Cor a single machine. The boundaries between machines in

10
4.2BSD are not transparent. In a 4.2BSD system, the identifiers of a process only have meaning
for the local operating system under which the process is executing. Consequently, direct control
or a process on another machine is impossible.
Machine B
-~E7· ,.... Machine A / :
I I
e<---/e pro
/<.,.,.,..,.>....,._, .....,..cr-.t
I<-..!>
\ J
I \ I I
Flpre 3.6& Role of Daemon Proeeuee
To provide process control across machine boundaries, we use daemon processes executing
on each machine. This situation is exemplified in Figure 3.5. Here, the user is working from a
terminal connected to machine A and is running the control process. The user issues commands
to the controller. The controller uses the daemons on other machines when it needs to step over
to another machine to perform a process control function. The daemons serving the controller are
referred to as meterdaemon8. There must be a meterdaemon on each machine that supports the
measurement system. The sole purpose or the meterdaemons is to carry out control functions for
the controller.

11
type body
11: create request filename
parameter count
parameter list
filter port
filter host
meter ftap
control port
control host
18: create reply pid
status
Figure 3.8: Example Formata of a Controller /Daemon Message
The cooperation between the controller and the meterdaemons implies a need for a
communication protocol. This protocol defines the information to be exchanged, the
synchronization of the exchange, and the procedure for establishing communication connections.
Examples of the format of messages exchanged between· the controller and the meterdaemons
shown in Figure 3.6. This format includes a message type and a message body. The type field
identifies the purpose of the message. This may either be the type of request issued by the user or
the type of reply returned from the meterdaemon. The remainder of the message, the body, is
variable format and depends on the message type. All of the information that is required for the
execution of the operation (in the case of a request) or for reporting the operation's result (in the
case of a reply) is contained in the message body.
The exchange is structured as a remote procedure call. A meterdaemon spends most of its
time listening for an IPC connection request from a controller process. When a controller needs
the services of a meterdaemon, it issues a request for a connection to that meterdaemon. When
the connection is established, the controller sends a request message to the meterdaemon over this
connection, and then waits for the meterdaemon 's reply. When the request message is received by
the meterdaemon, the meterdaemon carries out the requested function, sends a reply message
back to the controller over the connection, closes the connection, and then waits for a new
connection request. Upon receiving the reply from the meterdaemon, the controller closes its end
of the IPC connection, completes the processing of the request, displays any relevant information
to the user, and prompts the user for the next command.
There is one exception to this protocol. When a process terminates, connection
establishment is initiated by a meterdaemon rather than by the controller. The meterdaemon is
the parent of all processes it creates. Consequently, a meterdaemon is signaled when one of its
processes terminates. When a process changes state (stops or terminates}, a signal handling
procedure in the meterdaemon is activated. Upon receiving such a notification, the meterdaemon
requests a connection to the controller responsible for the terminating process, and then sends the
information about tht: change of state to this controller. A controller maintains an IPC socket Cor
the purpose of establishing connections Cor state change reports. It listens to this socket to detect
messages arriving from meterdaemons. The controller informs the user or the new state or his
computation upon being notified of a termination.
A reliable communication path is desirable between the controller and a meterdaemon. For
this reason, a stream connection is used instead of a datagram connection. The stream connection
between the controller and a meterdaemon exists Cor the duration of a single exchange of
messages. The reason Cor the temporary connection is that long-standing stream connections can
be undependable when used across machine boundaries. Furthermore, communication between
the controller and the meterdaemons is infrec:iuent enough that establishing these connections as
they are needed does not introduce significant overhead.
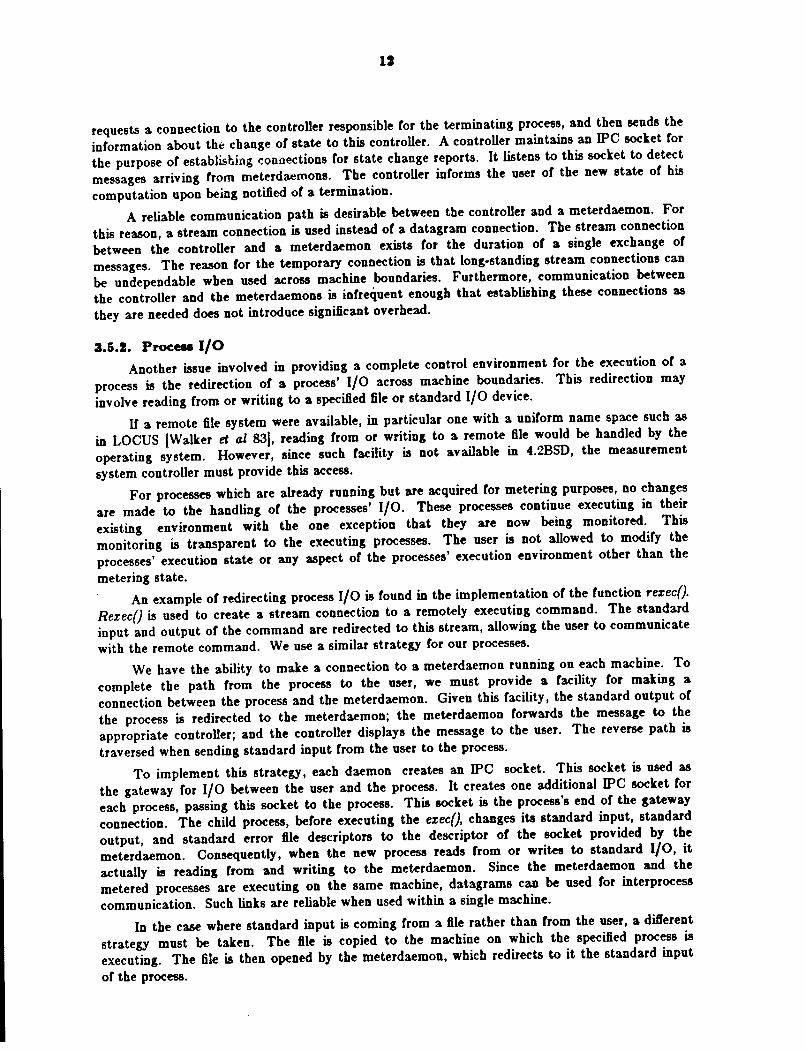
3.5.Z. Proceu 1/0
Another issue involved in providing a complete control environment Cor the execution of a
process is the redirection of a process' 1/0 across machine boundaries. This redirection may
involve reading from or writing to a specified file or standard 1/0 device.
Ir a remote file system were available, in particular one with a uniform name space such as
in LOCUS !Walker et a.l 83j, reading from or writing to a remote file would be handled by the
operating system. However, since such facility is not available in 4.2BSD, the measurement
system controller must provide this access.
For processes which are already running but are acquired Cor metering purposes, no changes
are made to the handling of the processes' 1/0. These processes continue executing in their
existing environment with the one exception that they are now being monitored. This
monitoring is transparent to the executing processes. The user is not allowed to modify the
processes' execution state or any aspect of the processes' execution environment other than the
metering state.
An example of redirecting process 1/0 is found in the implementation of the function rexec(J.
Rexec(} is used to create a stream connection to a remotely executing command. The standard
input and output or the command are redirected to this stream, allowing the user to communicate
with the remote command. We use a similar strategy Cor our processes.
We have the ability to make a connection to a meterdaemon running on each machine. To
complete the path from the process to the user, we must provide a facility Cor making a
connection between the process and the meterdaemon. Given this facility, the standard output or
the process is redirected to the meterdaemon; the meterdaemon forwards the message to the
appropriate controller; and the controller displays the message to the user. The reverse path is
traversed when sending standard input from the user to the process.
To implement this strategy, each daemon creates an IPC socket. This socket is used as
the gateway Cor 1/0 between the user and the process. It creates one additional IPC socket Cor
each process, passing this socket to the process. This socket is the process's end or the gateway
connection. The child process, before executing the ezec(J, changes its standard input, standard
output, and standard error file descriptors to the descriptor of the socket provided by the
meterdaemon. Consequently, when the new process reads from or writes to standard 1/0, it
actually is reading from and writing to the meterdaemon. Since the meterdaemon and the
metered processes are executing on the same machine, datagrams can be used Cor interprocess
communication. Such links are reliable when used within a single machine.
In the case where standard input is coming from a file rather than from the user, a different
strategy must be taken. The file is copied to the machine on which the specified process is
executing. The file is then opened by the meterdaemon, which redirects to it the standard input
or the process.
13
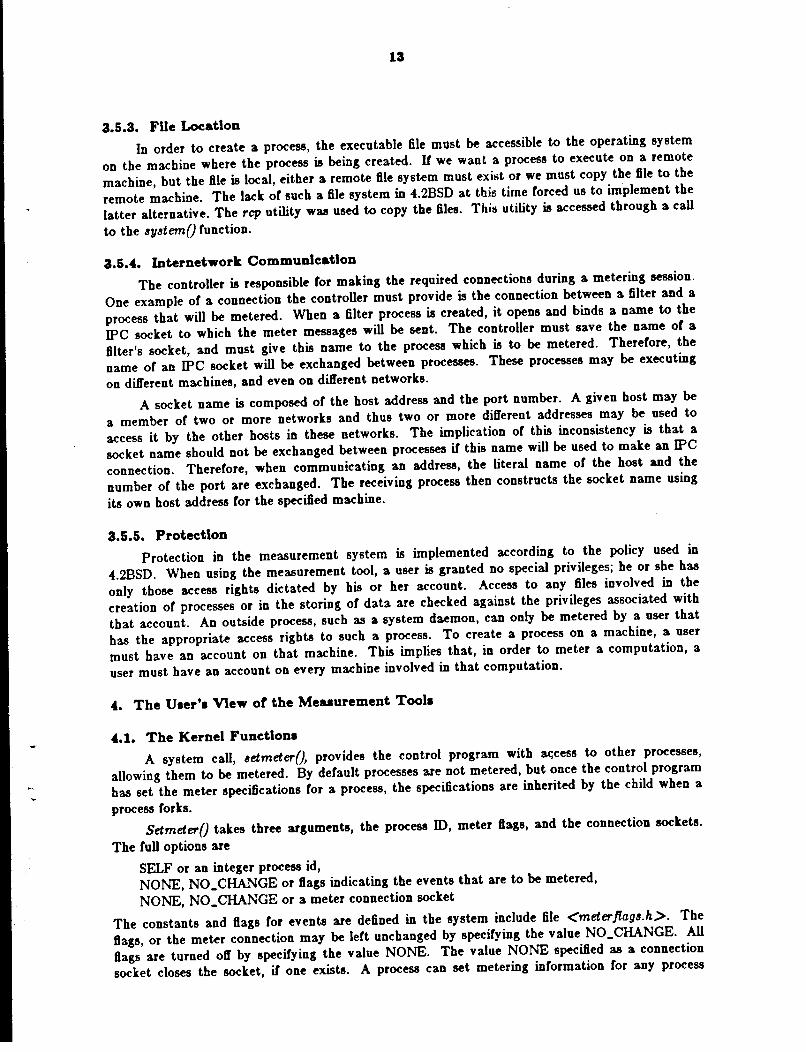
3.5.3. Flle Location
In order to create a process, the executable file must be accessible to the operating system
on the machine where the process is being created. If we want a process to execute on a remote
machine, but the file is local, either a remote file system must exist or we must copy the file to the
remote machine. The lack of such a file system in 4.2BSD at this time forced us to implement the
latter alternative. The rep utility was used to copy the files. This utility is accessed through a call
to the 8ystem() function.
3.5.4. Internetwork Communication
The controller is responsible for making the required connections during a metering session.
One example of a connection the controller must provide is the connection between a filter and a
process that will be metered. When a filter process is created, it opens and binds a name to the
IPC socket to which the meter messages will be sent. The controller must save the name of a
filter's socket, and must give this name to the process which is to be metered. Therefore, the
name of an IPC socket will be exchanged between processes. These processes may be executing
on different machines, and even on different networks.
A socket name is composed of the host address and the port number. A given host may be
a member of two or more networks and thus two or more different addresses may be used to
access it by the other hosts in these networks. The implication of this inconsistency is that a
socket name should not be exchanged between processes it this name will be used to make an IPC
connection. Therefore, when communicating an address, the literal name of the host and the
number of the port are exchanged. The receiving process then constructs the socket name using
its own host address for the specified machine.
3.5.5. Protection
Protection in the measurement system is implemented according to the policy used in
4.2BSD. When using the measurement tool, a user is granted no special privileges; he or she has
only those access rights dictated by his or her account. Access to any files involved in the
creation of processes or in the storing of data are checked against the privileges associated with
that account. An outside process, such as a system daemon, can only be metered by a user that
has the appropriate access rights to such a process. To create a process on a machine, a user
must have an account on that machine. This implies that, in order to meter a computation, a
user must have an account on every machine involved in that computation.
4. The User'• VIew of the Measurement Tools
4.1. The Kernel Funetlona
A system call, ~etmeter{}, provides the control program with ac:cess to other processes,
allowing them to be metered. By default processes are not metered, but once the control program
bas set the meter specifications for a process, the specifications are inherited by the child when a
process forks.
Setmeter() takes three arguments, the process ID, meter ftags, and the connection sockets.
The full options are
SELF or an integer process id,
NONE, NO_CHANGE or ftags indicating the events that are to be metered,
NONE, NO_CHANGE or a meter connection socket
The constants and ftags for events are defined in the system include file <meterftags.h>. The
llags, or the meter connection may be left unchanged by specifying the value NO_CHANGE. All
lla.gs are turned off by specifying the value NONE. The value NONE specified as a connection
socket closes the socket, it one exists. A process can set metering information for any process

belonging to the same user, including itself. A superuser process can set metering for any process.
One selects the ty~ or events to be metered by setting flags for the process. The flags
defined are:
METERACCEPT METER CONNECT METER SEND METERRECEfVECALL METERRECEfVE METER SOCKET METERDUP METERDESTSOCKET METERFORK METERTERMPROC M_ALL
process accepts a connection process initiates a connection process sends a message process makes a call to receive a message process receives a message process creates a socket process duplicates a socket or file descriptor process closes a socket process forks process terminates meter all events
In addition to flags for events, one may set a flag indicating that meter messages are to be sent
immediately, rather than buffered. The default is to buffer several messages so that the number
or meter messages is considerably smaller than the number or messages sent by the metered
process.
The meter connection consists or two connected sockets. One end is presumed to belong to
a filter process, the other to be created by the local meterdaemon. The meterdaemon creates its
socket by calling ~ocket(}, and initiates the connection to the filter. Once the connection is
established, the daemon calls ~etmeter(), passing to it the connected socket descriptor. The socket
descriptor is duplicated for the metered process, but not placed in that process's descriptor table,
so that the process is not able to send messages through the socket. The meter does not reduce
the number or open files and sockets available to the metered process. II utmeter() is called
specifying a new meter socket for a process already having one, the old socket is closed. Meter
sockets are also closed when the process terminates, and when the meter connection is set to the
value NONE.

15
size
machine
Header cpu Time Local clock
procTime Time charged to user process
trace Type
process id
pc PC at time of system call
socket Socket accepting connection
newSocket Socket created for connection
sockNameLen
peerNameLen
sock Name Name bound to accepting socket
peer Name Name bound to connecting socket
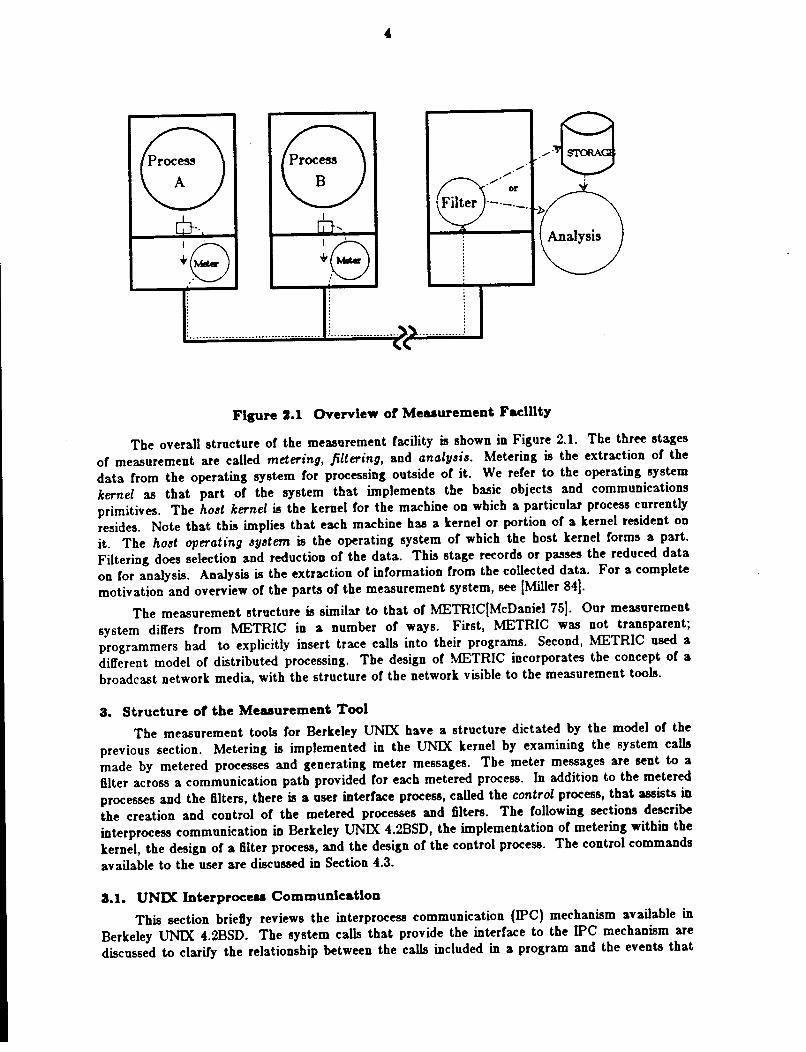
Figure 4.1 Structure of a message for an accept() call
The meter messages contain a standard header and a body that depends upon the
corresponding meter event. The structure of a message recording a accept event is shown in
Figure 4.1. The header includes fields for the message size, the event type, the machine id, the
time on the system clock, and the CPU time for which the process has executed. The system
clock time is useful for establishing the order of events on a particular machine. The separate
machines' times, however, only roughly correspond to a global time. Statements regarding the
global ordering of events can only be made on the basis of evidence within the trace. For
example, since a message must be sent before it may be received, the times of sending and
receiving a message can always be ordered relative to one another. Given these constraints, much
or the global ordering can be deduced. The process time allows the estimation or the amount or
work necessary between two events. The granularity of this measure is large, however. CPU use
is updated in increments or lOms. Estimates based on the reported values must recognize this
limitation.
The message body for most events includes the process id, the address of the instruction
that called the system routine, and the address of the socket with which the operation was
performed. Sockets are identified by their address within the system descriptor table. This
ensures that socket addresses are unique within a particular machine. Some of the message bodies
include the names of ~kets. The form of the names depends upon the domain of the
socket!Sechrest 84}. Currently, socket names are presented as either an Internet Domain name!Su
8l Postel 82}, a UNIX path name (for the UNIX domain) or, in the case or socketpairs, an
internally generated unique name. The names are important in matching the sockets in a
connection and in identifying the recipient or datagrams. The length or the name is given in the
message. For some calls, not all the information for the message is available. For example, when
one writes across a connection, the name of the recipient is not available to the metering software.
In this case the length of the name is specified as zero. By examining the sockets that were paired

18
when the connection was created, the recipient information can be recovered. This is one or the
tasks or the analysis programs. The complete message format is shown in Appendix A.
4.2. Joba and PJ"Oeeua
In our measurement model, a computation is a collection or processes working towards a
common goal. The controller uses the term job to designate a computation. A job is created by
assigning a name to it, and then adding processes to it. Once the job is created, the measurement
strategy for the job can be specified.
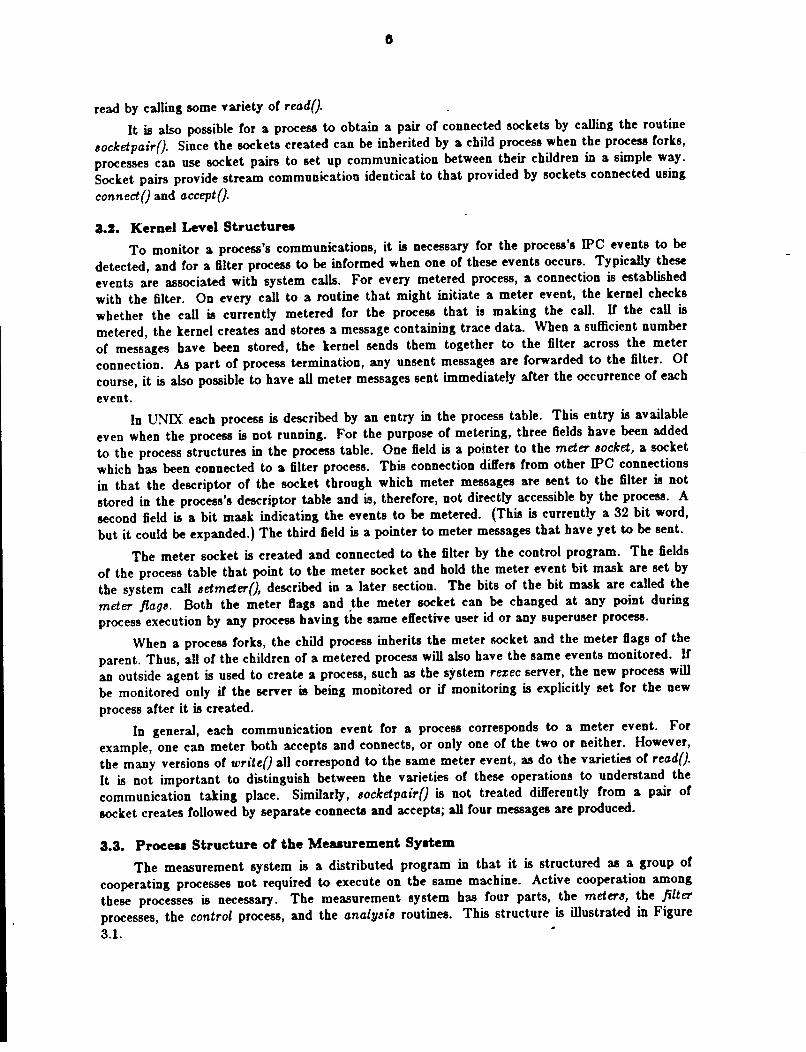
Figure 4.2 Process State Diagram
The processes making up a computation are tracked by the controller as they progress
through different stages or their lives. The five process states recognized by the controller are
new, acquired, running, Btopped, and killed. The state diagram representing a process' life cycle
is shown in Figure 4.2. When a process has been newly created, it is in the new state. This state
indicates that the execution environment has been set up, but the process is suspended prior to
the execution or the first instruction. From the new state, a process can enter the running state
by starting it, in which case the process begins execution. A process can also move from the new
state to the stopped state, in which case it remains suspended, this transition occurring when the
user stops the job. A process can switch between the running and the stopped states until the
time it completes. When a process completes, it is moved from the running state to the killed
state. It will remain in this state until the user removes the job. The killed state may also be
entered from the stopped state. This occurs if the user decides to remove the job before it has
completed execution. A process cannot be restarted once it has been killed. A process cannot
move directly to the killed state from the new state. This restriction is enforced as a
precautionary measure, ensuring that the user does not accidentally remove a computation that is
in progress. Ir a previously existing process such as a system server is metered, it is moved
directly to the acquired state. This is the only state such a process can be in. An acquired process
cannot be stopped or killed, it can only be metered. The acquired status ensures this limitation or
control.
4.3. User's Manual
This section describes the details or the user's commands to the control program. The
commands are: help, filter, newjob, addproeeu, aequlre, aetftap, atartjob, atopjob,
removejob, removeproeesa, Jobs, getlog, aouree, sink, and die. Each or these commands is
discussed in detail in this section.

17
First, the general command flow or a measurement session is outlined below:
( 1) Create a filter prvc~'3 ( ftlter ).
(2) Create a job (newJob).
(3) Create the procP.ssu; involved in the computation (addproeeu).
(4) Set the meterins flags on the job (aetftaga).
(5) Start the job (etartJob).
(6) When the job completes, get the logfile (getlos).
(7) Cleanup by removing the job (rmJob).
(8) Exit the controller (die).
In the command descriptions to follow, all parameters will be surrounded by the symbols'<'
and '>'. Optional parameters will be enclosed by 'I' and 'J'. Command parameters must be
literals formed from the digits 0 through 9, the upper and lower case letters, and the characters '/'
and '.'. Delimiting characters are blanks, tabs, new lines, and carriage returns. An example or a
session with the controller is presented in Section 4.4.
help This command is a source or information. It displays the menu or the control commands
with a brief statement or their function. The required and optional parameters to the
command are indicated. At the end or the menu, the available metering flags are listed.
Biter ( < ftltername > (<machine> [ < ftlterftle > ( < deaeriptiona > (<templates>]])]]
Ir parameters have been specified, a filter process will be created from the program in
"filterfile" and will be given the name "filtername" for identification within the control
program. The filterfile must be an existing, executable file. Ir no filterfile has been specified,
the default file "filter" is used. Ir no machine has been specified (only the filtername has
been specified on the command line) then the default is to create the filter locally. A
standard filter requires two additional files: the trace descriptions file and the templates
selection rules. Ir these files are not specified on the command line, standard filenames
("templates" and "descriptions") are used. Read access is required to these files.
Ir no parameters have been specified Cor the filter command, information about existing filter
processes is displayed. The information is a list or the available filters indicating their
process identifiers, their names, and the machines on which they are executing.
newjob <Jobname> (<ftltername>) This command is used to create and initialize a job. The job is given the name "jobname".
The user ~an optionally specify a filter Cor the job by including the name or an existing filter
process. Ir no filter is indicated, the control program uses the default filter process. A job
cannot be created if a filter has not been created. This implies that prior to the execution or
newjob, a Biter command must have been executed.
No restriction is placed on the number or jobs or on the number or filters the user can
create. Many computations could be executing simultaneously, having traces collected by
different filters.
addproeeu <Jobname> <machine> <proceaaftle> (<parml parm2 ••• >)
Addproceu, or add, is used to create a process as part or a job. The process is added to
the job "jobname" and is created on the host "machine", by executing the file "processfile"
with the parameters "parml, parm2, .. .''. A process does not begin executing at this time,
and its process state is new. The process is connected to jobname's filter and inherits the
flags or job "jobname". A process can be added to any job at any time, even after processes
18
in the job have started execution.
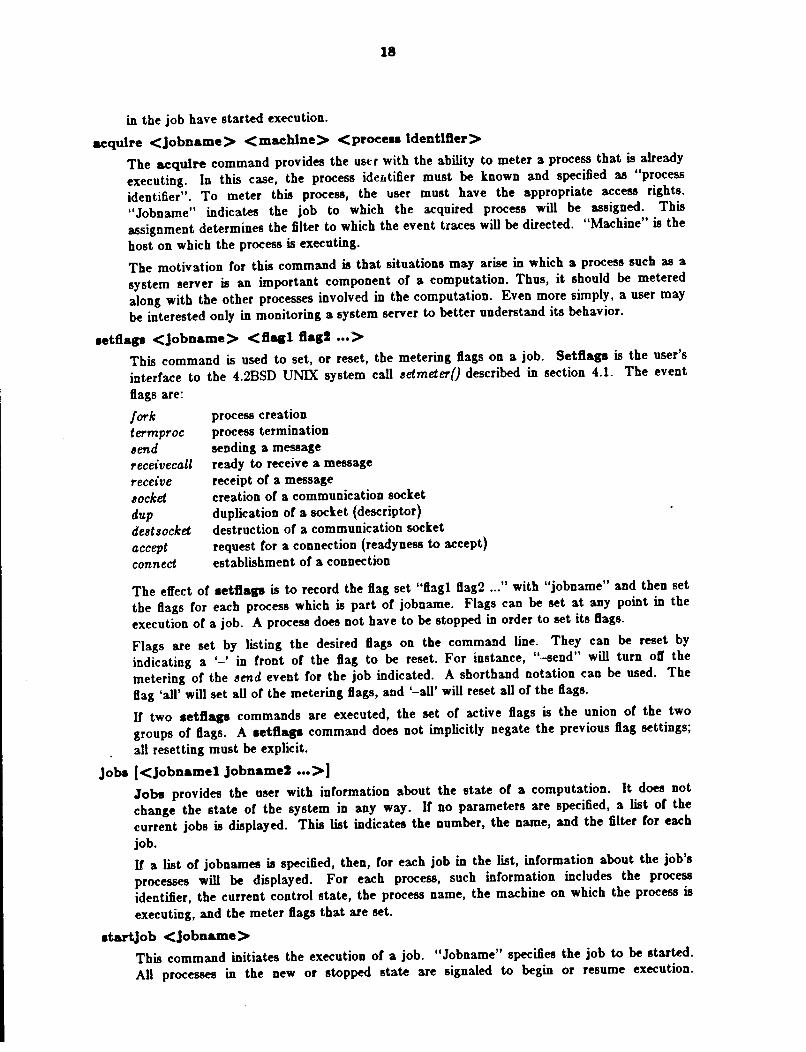
aequlre <Jobname> <maehlne> <proeeaa ldentlfter>
The aequlre command provides the ust:r with the ability to meter a process that is already
executing. In this case, the process ide.utifier must be known and specified as "process
identifier". To meter this process, the user must have the appropriate access rights.
"Jobname" indicates the job to which the acquired process will be assigned. This
assignment determines the filter to which the event traces will be directed. "Machine" is the
host on which the process is executing.
The motivation for this command is that situations may arise in which a process such as a
system server is an important component or a computation. Thus, it should be metered
along with the other processes involved in the computation. Even more simply, a user may
be interested only in monitoring a system server to better understand its behavior.
aetftaga <Jobname> <flail fta1t ••• >
This command is used to set, or reset, the metering flags on a job. Setftaga is the user's
interface to the 4.2BSD UNIX system call $etmeter() described in section 4.1. The event
flags are:
fork termproc .!end receivecall receive .!OCket dup destsocket accept connect
process creation process termination sending a message ready to receive a message receipt or a message creation or a communication socket
duplication or a socket (descriptor)
destruction or a communication socket
request for a connection (readyness to accept)
establishment or a connection
The effect or aetftaga is to record the flag set "flag 1 flag2 ... " with "jobname" and then set
the flags for each process which is part or jobname. Flags can be set at any point in the
execution or a job. A process does not have to be stopped in order to set its flags.
Flags are set by listing the desired flags on the command line. They can be reset by
indicating a '-' in front or the flag to be reset. For instance, "-send" will turn oft' the
metering or the .!end event for the job indicated. A shorthand notation can be used. The
flag 'all' will set all or the metering flags, and '-all' will reset aU or the flags.
If two aetftaga commands are executed, the set or active flags is the union or the two
groups or flags. A aetftaga command does not implicitly negate the previous flag settings;
all resetting must be explicit.
Joba [ <Jobnamel Jobnamd ••• > J Jobs provides the user with information about the state or a computation. It does not
change the state or the system in any way. If no parameters are specified, a list or the
current jobs is displayed. This list indicates the number, the name, and the filter for each
job.
Ir a list or jobnames is specified, then, for each job in the list, information about the job's
processes will be displayed. For each process, such information includes the process
identifier, the current control state, the process name, the machine on which the process is
executing, and the meter flags that are set.
atartjob <Jobname >
This command initiates the execution or a job. "Jobname" specifies the job to be started.
AU processes in the new or stopped state are signaled to begin or resume execution.
10
Processes that are running, killed, or acquired cannot be started. The user is informed as to
the status or each process.
atopjob <Jobname>
This command is used to halt the execution of a job. "Jobname" specifies the job to be
stopped. All processes in the specified job that are in the new or running state are signaled
to halt execution. Processes that are killed or acquired are ignored.
removejob <Jobname>
This command is used to remove the record of a job from the controller. Jobname specifies
the job to be removed. A job can only be removed if all or its processes are in one of the
states killed, stopped, or acquired. If any of the processes are still running or new, the job
will not be removed. When an acquired process is removed, the control program insures
that the filter connection of that process is taken down so that the process will not continue
to be metered after its job bas been removed, but the process continues to execute.
ptlog < filtername > < dHtlnatlon filename>
The log file for the filter process identified by "filtername" is retrieved. When retrieved, the
log file is copied to the file "destination filename" .
.ouree <filename>
This command (and the alnk command) allows the user to run scripts of control commands.
Souree instructs the control program to read command lines from the command script
"filename" instead or from the terminal. Any of the control commands may be specified in
this script file. Source commands may be nested within scripts to a maximum depth of
sixteen. When the entire script has been processed, input is again expected from the
terminal.
alnk [<filename> J
die
Slnk provides a way for the output or commands to be written to a file instead or to the
terminal. Thus, the output of a sourced script can be redirected to the file "filename" by
having a "sink <filename>" command as the first line of the script. When the script is
completed, the output file should be changed back to the terminal by including a sink
command without parameters as the last command in the script; output is directed back to
the terminal when a destination filename is not specified.
This command terminates the control program. Upon exit, all executing filter processes are
removed. Aliases of this command are exit, bye, and control D ( ·n ). If there are still
active processes (new, stopped, running, or acquired), the user is warned, and the controller
does not exit. If the user immediately repeats the die command in this situation, the
controller will assume the user is aware of the situation and exits with the processes active.
4.4. Example of a Programmer's Session With the Controller
This section presents an example of a metering session. The script for this session is shown
in Appendix B. We step through the commands issued by the programmer and describe what
happens throughout the system when executing each or the programmer's requests.
20
control process
filter
re green yellow
0 c9 i-·-·-·-·-·-·-·-·-·-·-·-i
daemons
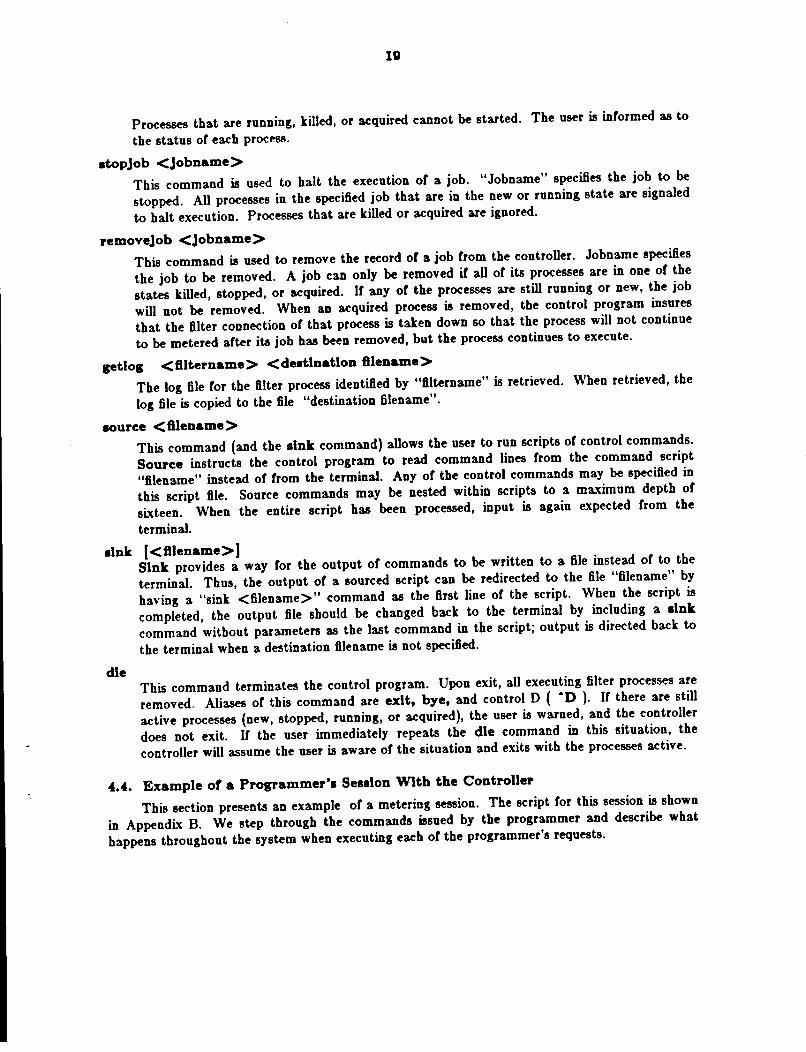
Figure 4.3 Filter Creation
The control program, the filter, and the metered processes can run on one or on several
machines. On every machine on which a process or the computation is to run, there must be a
meterdaemon" The programmer chooses a machine on which to run the control program and
starts its execution there. At this time, the programmer can issue control commands to the
control process.
The programmer first creates a filter process by issuing the filter command (see Figure 4.3),
specifying the machine on which the filter is to run. To create the filter, the control program
creates an IPC connection to the meterdaemon on the specified machine, and sends a message
that requests the creation or the filter process. The meterdaemon creates this process and returns
a reply. Once the request bas been satisfied, the IPC connection is removed.
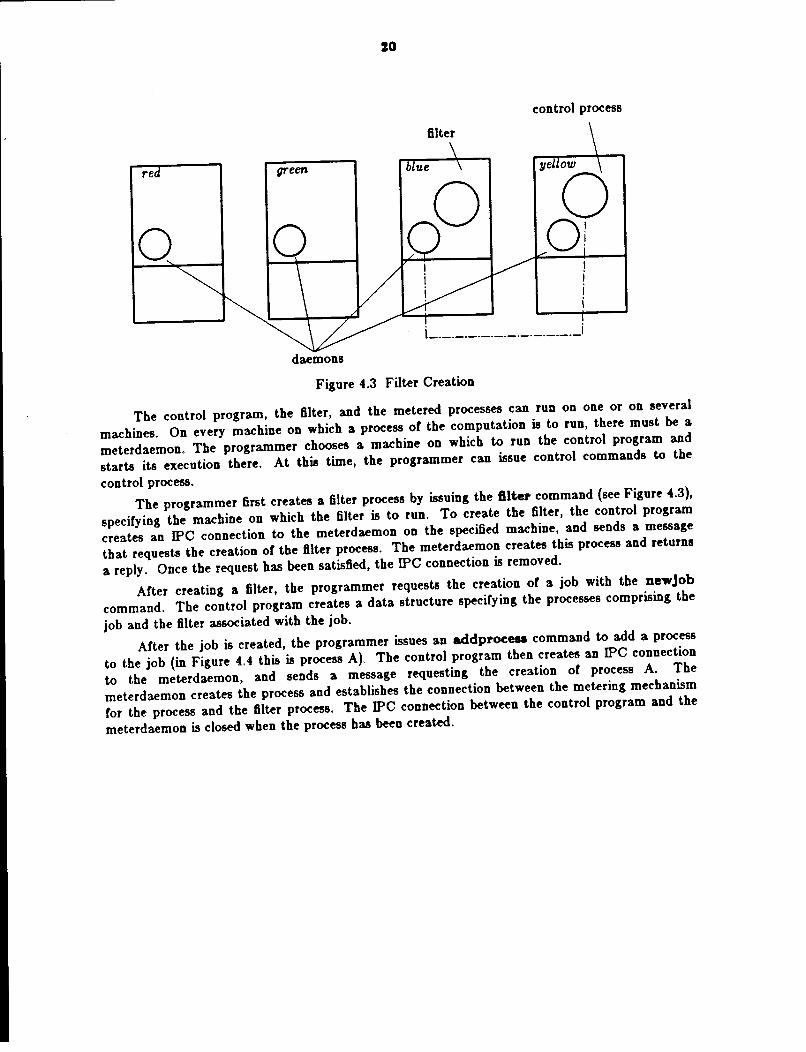
After creating a filter, the programmer requests the creation or a job with the newjob
command. The control program creates a data structure specifying the processes comprising the
job and the filter associated with the job.
After the job is created, the programmer issues an addproee .. command to add a process
to the job (in Figure 4.4 this is process A), The control program then creates an IPC connection
to the meterdaemon, and sends a message requesting the creation or process A. The
meterdaemon creates the process and establishes the connection between the metering mechanism
for the process and the filter process. The IPC connection between the control program and the
meterdaemon is closed when the process bas been created.
nnetered process
red
8 0
green
0
filter
\
control process I
yellow I
oY ! I i i
L _________ ,:_·-· i ·----------------------------------~,:
-----------------· : ............. ~~~-~--- ...................................................... ;
Figure 4.4 Creation of Process A
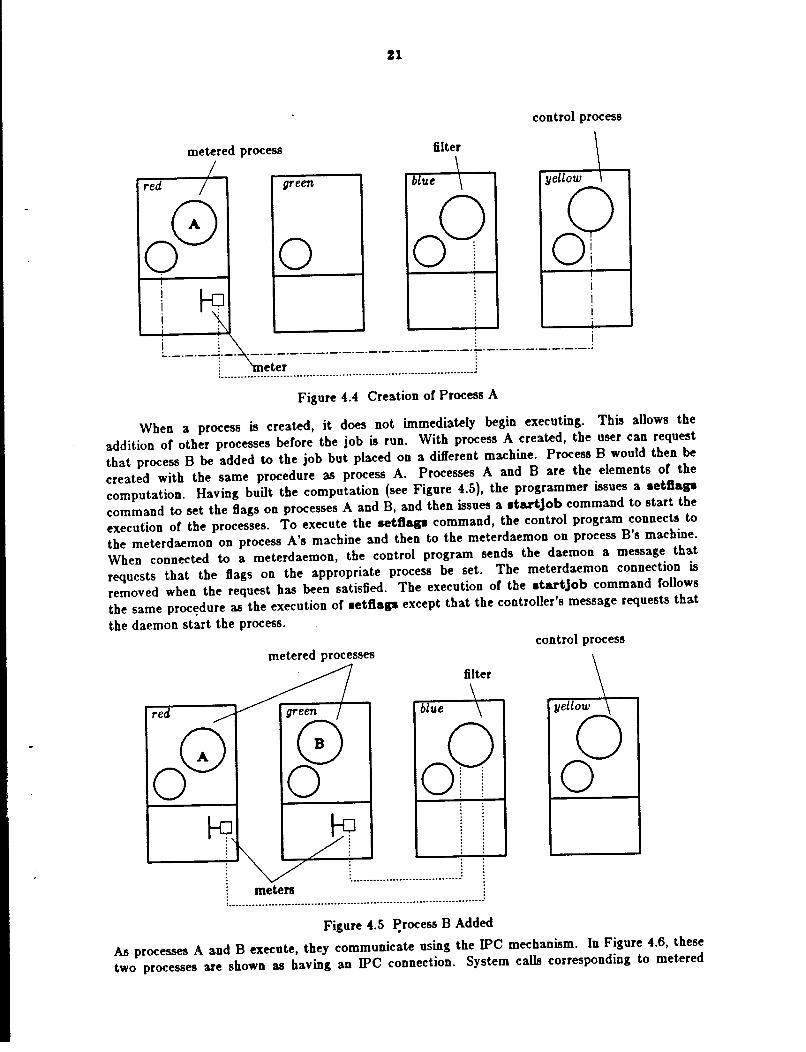
When a process is created, it does not imnnediately begin executing. This allows the
addition of other processes before the job is run. With process A created, the user can request
that process B be added to the job but placed on a different nnachine. Process B would then be
created with the sanne procedure as process A. Processes A and B are the elements of the
computation. Having built the computation (see Figure 4.5), the programmer issues a •etftap
command to set the ftags on processes A and B, and then issues a •tartjob connmand to start the
execution of the processes. To execute the •etftap command, the control progrann connects to
the meterdaemon on process A's machine and then to the meterdaemon on process B's machine.
When connected to a meterdaemon, the control program sends the daemon a message that
requests that the ftags on the appropriate process be set. The meterdaemon connection is
removed when the request bas been satisfied. The execution of the •tartjob command follows
the same proc~dure as the execution of •etftap except that the controller's message requests that
the daemon start the process.
red
Q 0
metered processes
green
8 0
meters
blue
. . ----------------------------------
filter
! ......................................................................................................................... '
Figure 4.5 l!rocess B Added
control process
\ yellow _\
SJ
AB processes A and B execute, they communicate using the IPC mechanism. In Figure 4.6, these
two processes are shown as having an IPC connection. System calls corresponding to metered

IZ
events cause the i:neters to generate messages that are sent through the meter connections to the
filter program.
md~r •. d processes
filter
red green blue
0 0! 8
Ol I
~~ I
~~ i j i i
i--~·-·-·-·-·-·-·-·j . . ....................................................... . . . . . . ·---------------------·-------------··-------------------------··-------------~
Figure 4.6 Process Communication
5. Conclu•lon
control process
\ yellow ~\
p
The tool described in this document provides a means of monitoring a distributed
computation. The model of computation is simple, involving a small set of process and
communication activities to describe the behavior of a computation. Our measurement model is
based on monitoring this set or activities. The tool is the implementation or the measurement
model for the Berkeley UNIX 4.2 BSD operating system.
The metering tools collect event records for process and communication activities. The
activities that are monitored match those primitives that are used by the programmer of the
computation. Thus, there is consistency between the static view of a program (the commands
and statements used to construct it) and the dynamic view of a program (the record of its
execution).
The measurement tools that we have described do not require the insertion or extra
statements into the programs being monitored, nor their recompilation. This transparency makes
them attractive for use in the development or evaluation of any distributed program.
Initial experience with these tools [Lai & Miller 84] has shown them to be useful for
measurement studies, as well as for program debugging. A multiprocess computation was
developed and debugged using the tool, which led to substantial modifications of the program
resulting in substantial improvements or its performance.
e. References
[Almes et al 83] G. T. Almes, A. P. Black, E. D. Lazowska, and J.D. Noe, "The Eden System: A Technical
Review," Technical Report 83-10-05, University of Washington (October 1983).
[Baiardi et al 83] F. Baiardi, N. de Francesco, E. Matteoli, S. Stefanini, and G. Vaglini, "Development of a
Debugger for a Concurrent Language," Proc. of the ACM SIGSOFT/SIGPLAN Software
Engineering Symp. on High-Level Debugging, pp. 98-106 Pacific Grove, Calif., (March
1983).
!3
[Bates & Wileden 83} P. Bates and J. C. Wileden, "An Approach to High-Level Debugging of Distributed
Systems," Proc. of the ACM SIGSOFT/SIGPLAN Symp. on High-Level Debugging, pp.
23-32 Asilomar, CaHf., (March 1983).
(Cheriton & Zwaenepoel 83} D. R. Cheriton and W. Zwaenepoel, "The Distributed V Kernel and its Performance for
Diskless Workstations," Proc. of the Ninth Symp. on Operating Sys. Principles, pp. 128-
139 Bretton Woods, N.H., (October 1983).
[Ferrari 78} D. Ferrari, Computer Systems Performance Evaluation, Prentice-Hall, Inglewood Cliffs, NJ
(1978).
(Gusella & Zatti 83} Riccardo Gusella and Stefano Zatti, "TEMPO: A Network Time Controller for a Distributed
Berkeley UNIX System," Technical Report UCB/CSD 83-163, University of California,
Berkeley (December 1983).
[Lai & Miller 84} N. Lai and B. P. Miller, "The Traveling Salesman Problem:," Technical Report UCB/CSD,
University of California, Berkeley (June 1984).
[Lamport 78} L. Lamport, "Time, clocks, and the ordering of events in distributed systems," Comm. of
the ACM U(7) pp. 558-565 (July 1978).
[Leffler 83} S. Leffler, "A 4.2BSD lnterprocess Communications Primer," Computer Systems Research
Group Technical Report, University of California, Berkeley (1983).
(McDaniel 75} G. McDaniel, "METRIC: a kernel instrumentation system for distributed environments,"
Proc. of the Sixth Symp. on Operating SyB. Principle~, pp. 93-99 Purdue University,
(November 1975).
(Miller 84} B. P. Miller, "Performance Characterization of Distributed Programs," Ph.D. Dissertation,
University of California, Berkeley {May 1984).
[Philips 82} D. Philips, "Black Flag," Technical Report, Carnegie-Mellon University (June 1982).
[Powell & Miller 83} M. L. Powell and B. P. Miller, "Process Migration in DEMOS/MP," Proc. of the Ninth
Symp. on Operating Sys. Principlu, pp. 11~119 Bretton Woods, N.H., (October 1983).
(Schifl'enbauer 81} R. D. Schitfenbauer, "Interactive Debugging in a distributed computational environment,"
Technical Report MIT /LCS/TR-264, MIT (September 1981).
(Sechrest 84} S. Sechrest, "Examples of Interprocess Communication in UNIX 4.2BSD," Technical Report
UCB/CSD, University of California, Berkeley (June 1984).
14
[Su & Postel 82J Su and Postel, "The Domain Naming Convention for Internet User Applications," RFC 819,
USC lSI (Septcmbe1· 1982).

25
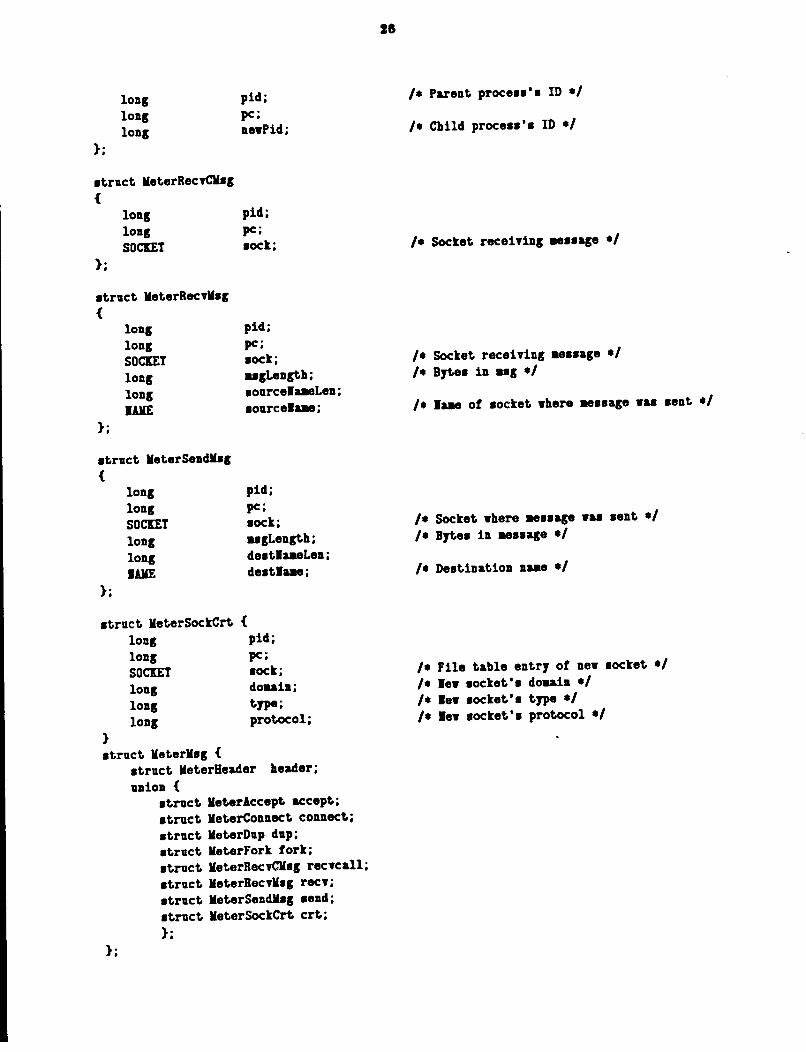
Appendix A: Meter Mesaage Formate
The following is the C language definition of meter message formats. Each time a metered
event occurs, a meter mess:\6e is created in the kernel. These messages are stored in the kernel
for eventual delivery to the filter. Each message consists of a header, whose format is common to
all messages, and data particular to the message type.
In the UNIX system, files defining common data structures are kept in the directory
jusr/include or one of its subdirectories. These files may be included in user programs. Included
files are specified by placing the path relative to jusr /include within angle brackets. The message
formats are defined in the include file <sysjmetermsgs.h>.
typedef lons SOCKET; typedef •truct Boctaddr lAKE;
•truct KeterHeader { lons •hort lons lons lons lons
};
•truct KeterAccept { lons
};
lons SOCKET
SOCIET lons lons lAKE lAKE
Btruct KeterConnect { lons lons SOCIET lons lons lAKE lAKE
};
struct KeterDup { lons lons SOCKET SOCIET };
struct KeterFort {
size; aachine; cpu TiM; Duuy; procTille; trace Type;
pid; pc; •oct;
new•oct; •octlaaeLen; peerlaaeLen; •octla.a; peerlaae;
pid; pc; •oct; •octlaaeLen; peerlaaeLen; •octlaae; peerlaae;
pid; pc; •oct; new•oct;
I• Size of aessase •I I• Machine on which proce•• run• •I I• Unu•ed •I
I• Tiae charsed to proce•• •I I• Type of .a••ase •I
I• Proce•• ID •I I• PC when •r•tea calll wa• aade •I I• Socket (file tableentry addre••>
acceptins connection •I I• lew •octet created for connection •I
I• laae bound to acceptiD.s •octet •I I• laae bound to connectins •octet •I
I• Socket reque•tins connection •I
I• Jaae bound to connectins •octet •I I• laae bound to acceptins socket •I
I• Socket beins duplicated •I I• Duplicate •octet •I
};
long long long
pid; pc; newPid;
struct KeterRecvCKsg {
};
long long SOCIET
pid; pc; soct;
struct KeterRecvKsg {
};
long long SOCIET long long IAIIE
pid; pc; soct; ugLength; sourcelaaeLen; sourcela.e;
struct KeterSendKsg {
};
long long SOCIET long long I AilE
pid; pc; soct; ugLength; destlaaeLen; destlaae;
struct KeterSoctCrt { long pid; long SOCIET long long long
}
pc; soct; doaain; type; protocol;
struct KeterKsg {
};
struct KeterBeader header; union {
struct Keterlccept accept; struct KeterConnect connect; struct KeterDup dup; struct KeterFort fort; struct KeterRecvCKsg recvcall; struct KeterRecvlsg recv; struct KeterSendKsg send; struct KeterSoctCrt crt; };
I&
I• Parent process's ID •I
I• Child process's ID •I
I• Soctet receiving .assage •I
I• Soctet receiving .assage •I I• BJte• in ug •I
I• la.a of soctet where .assage was sent •I
I• Soctet where aessage was sent •I I• BJte• iD .assage •I
I• Destination naae •I
I• File table entrJ of new soctet •I I• lew socket's doaain •I I• lew socket's tJP8 •I I• lew socket's protocol •I

27
Appendix B: Serlpt of Example Seulon
This is the script of the measuremeut session demonstrated in Section 4.4. The text appearing in
tJPnTiter font indicates prompts or responses coming from the measurement system controller.
The controller's prompt is "<control>". Text appearing in sl•nted font indicates the
programmer's responses, and text appearing in italiciJ are comments.
<Control> ff/ter fl blue r· create a filter proce/JIJ on machine blue •j
filter "f1' ... created: identifier= 2117
<Control> newjob foo r· create a job; name it foo •j
<Control> •ddprocess foo red A (• add process A to the job foo •j
process "A' ... created: identifier= 2120
<Control> •ddprocess foo green B (• add procestJ B to the job foo •j
process 'B' ... ereated: identifier = 2122
<Control> setff•gs foo send receive fork •ccept connect
new job flas• = send receive fort accept connect
Process "A' Flass set Process 'B' : Flass set
<Control> stertjob foo 'A' started. 'B' started.
<Control>
r· /Jet the metering flags on the job •j
r· IJtart the execution of the job •j
DOlE: process B in job 'foo' terainated: re&~on: noraal
DOlE: process .l in job 'foo' terainated: reason: noraal
<Control> rmjob foo '.l' reaoved 'B' reaoved
<Control> getlog fl tr•ce
<Control> bye
r- get the trace file for filter fl •j

18
Appendix C: Setmeter System Call Manual Page,f The following page contains the UNIX manual page for the ~etmeter(J system call. This
describes the system call as it is implemented on the Berkeley UNIX 4.2 BSD operating system.

SETMETER ( 2} UNIX Programmer's Manual SETMETER ( 2)
NAME setmeter - set metering of processes
SYNOPSIS #lnelude < meterftap.h > aetmeter(proe, flap, aoeket) lnt proe, flap, aoeket;
DESCRIPTION Setmeter marks a process for metering. Flagged system calls by metered processes cause a
metering message to be sent to a filtering proce~a. Proc specifies the process to be metered. The
system calls to be Bagged are specified by flaga. Socket specifies a connected stream socket, over
which the metering messages can be sent. The routine stores the ftags and socket number for the
specified process.
The arguments may also be replaced by the special value -1. Ir this value is used to specify the
process id, the id of the calling process is used. Ir this value is used for either of the last two
arguments, those values are not changed for the process.
A user can request metering only for processes belonging to that user. Specifying any other
process results in an error. The ftags spacified by the user form a bit mask, which replaces the
processes previous bit mask. These bitmasks can be formed by ORing constants found in
<meterftags.h>. The following constants have been defined:
M_SEND M_RECEIVECALL M_RECEIVE M_ACCEPT M_CONNECT M_FORK M_SOCKET M_ALL M_IMMEDIA TE
These Oags indicate the system calls to be metered, except for M_IMMEDIA TE, which indicates
that metering messages are to be sent immediately, rather than buffered for greater efficiency.
The socket provided must be a stream socket in the Internet domain. Any other socket will result
in a negative return value and an error status. The socket must be connected to be used, though
this is not checked. Meter messages are lost if they are sent on an unconnected socket.
Once a process is marked for metering, any call to a ftagged system routine will cause a metering
message to be sent automatically. The form of these messages may be found in <metermsgs.h>.
The interpretation of these messages is left to a filtering process on the other end of the stream
connection. Child processes inherit metering ftags and meter connections from their parent.
Messages will therefore l>e automatically sent from any child process of a metered parent until a
aetmeter call is made to change the child's meter ftags. The stream connection remains open as
long as any process can access it, either the creating process, a metered process, or any child of
the metered process. The connected socket is not listed in the descriptor table of the metered
process.
This routine allows information to be gathered about processes' calls to the kernel. In particular
about calls that result in communication with other processes. This gathering can be done
invisibly to the metered process.
RETURN VALUE A -1 is returned if an error occurs, otherwise a 0 is returned.
ERRORS The aetmeter call fails if
1
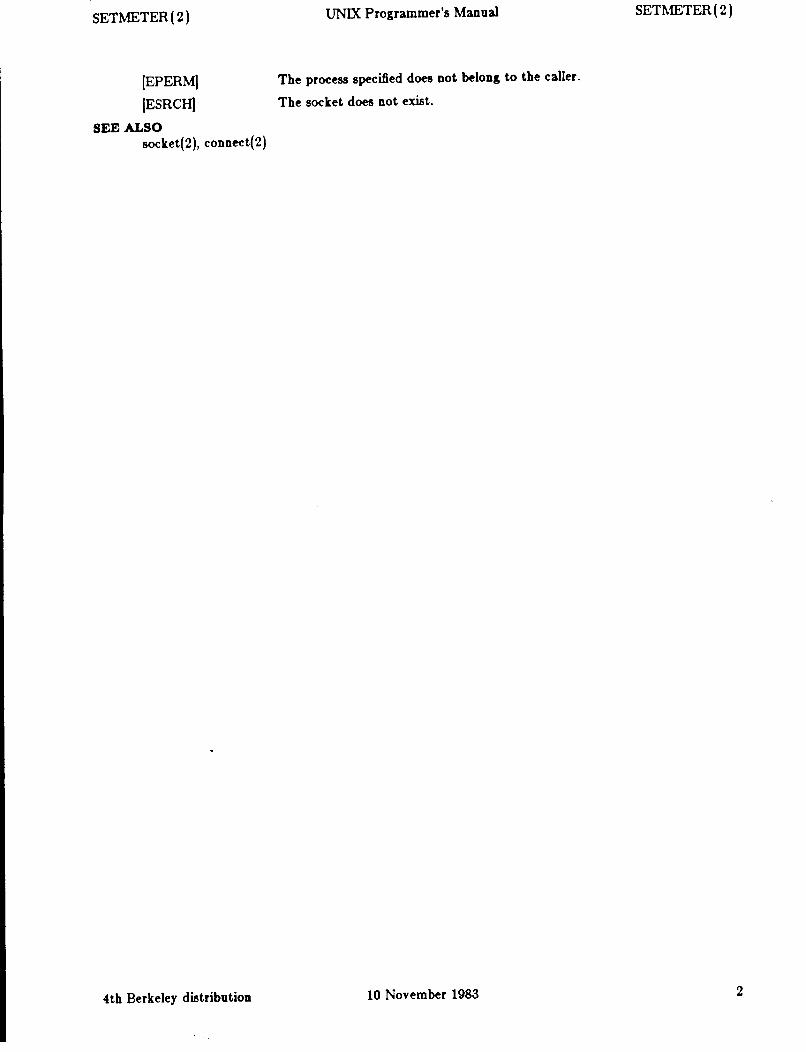
SETMETER ( 2)
[EPERMJ
[ESRCHJ
SEE ALSO socket(2), connect(2)
4th Berkeley distribution
UNIX Programmer's Manual
The process specified does not belong to the caller.
The socket does not exist.
10 November 1983
SET METER ( 2)
2